

Commuting Behavior Changes at Different Stages of Localized COVID-19 Outbreak: Evidence from Nanjing, China

Abstract
:1. Introduction
2. Literature Review
2.1. Impacts of COVID-19 on Commuting Behaviors
2.2. Influencing Factors of Commuting Behaviors on the Impact of COVID-19
2.3. Research Gaps
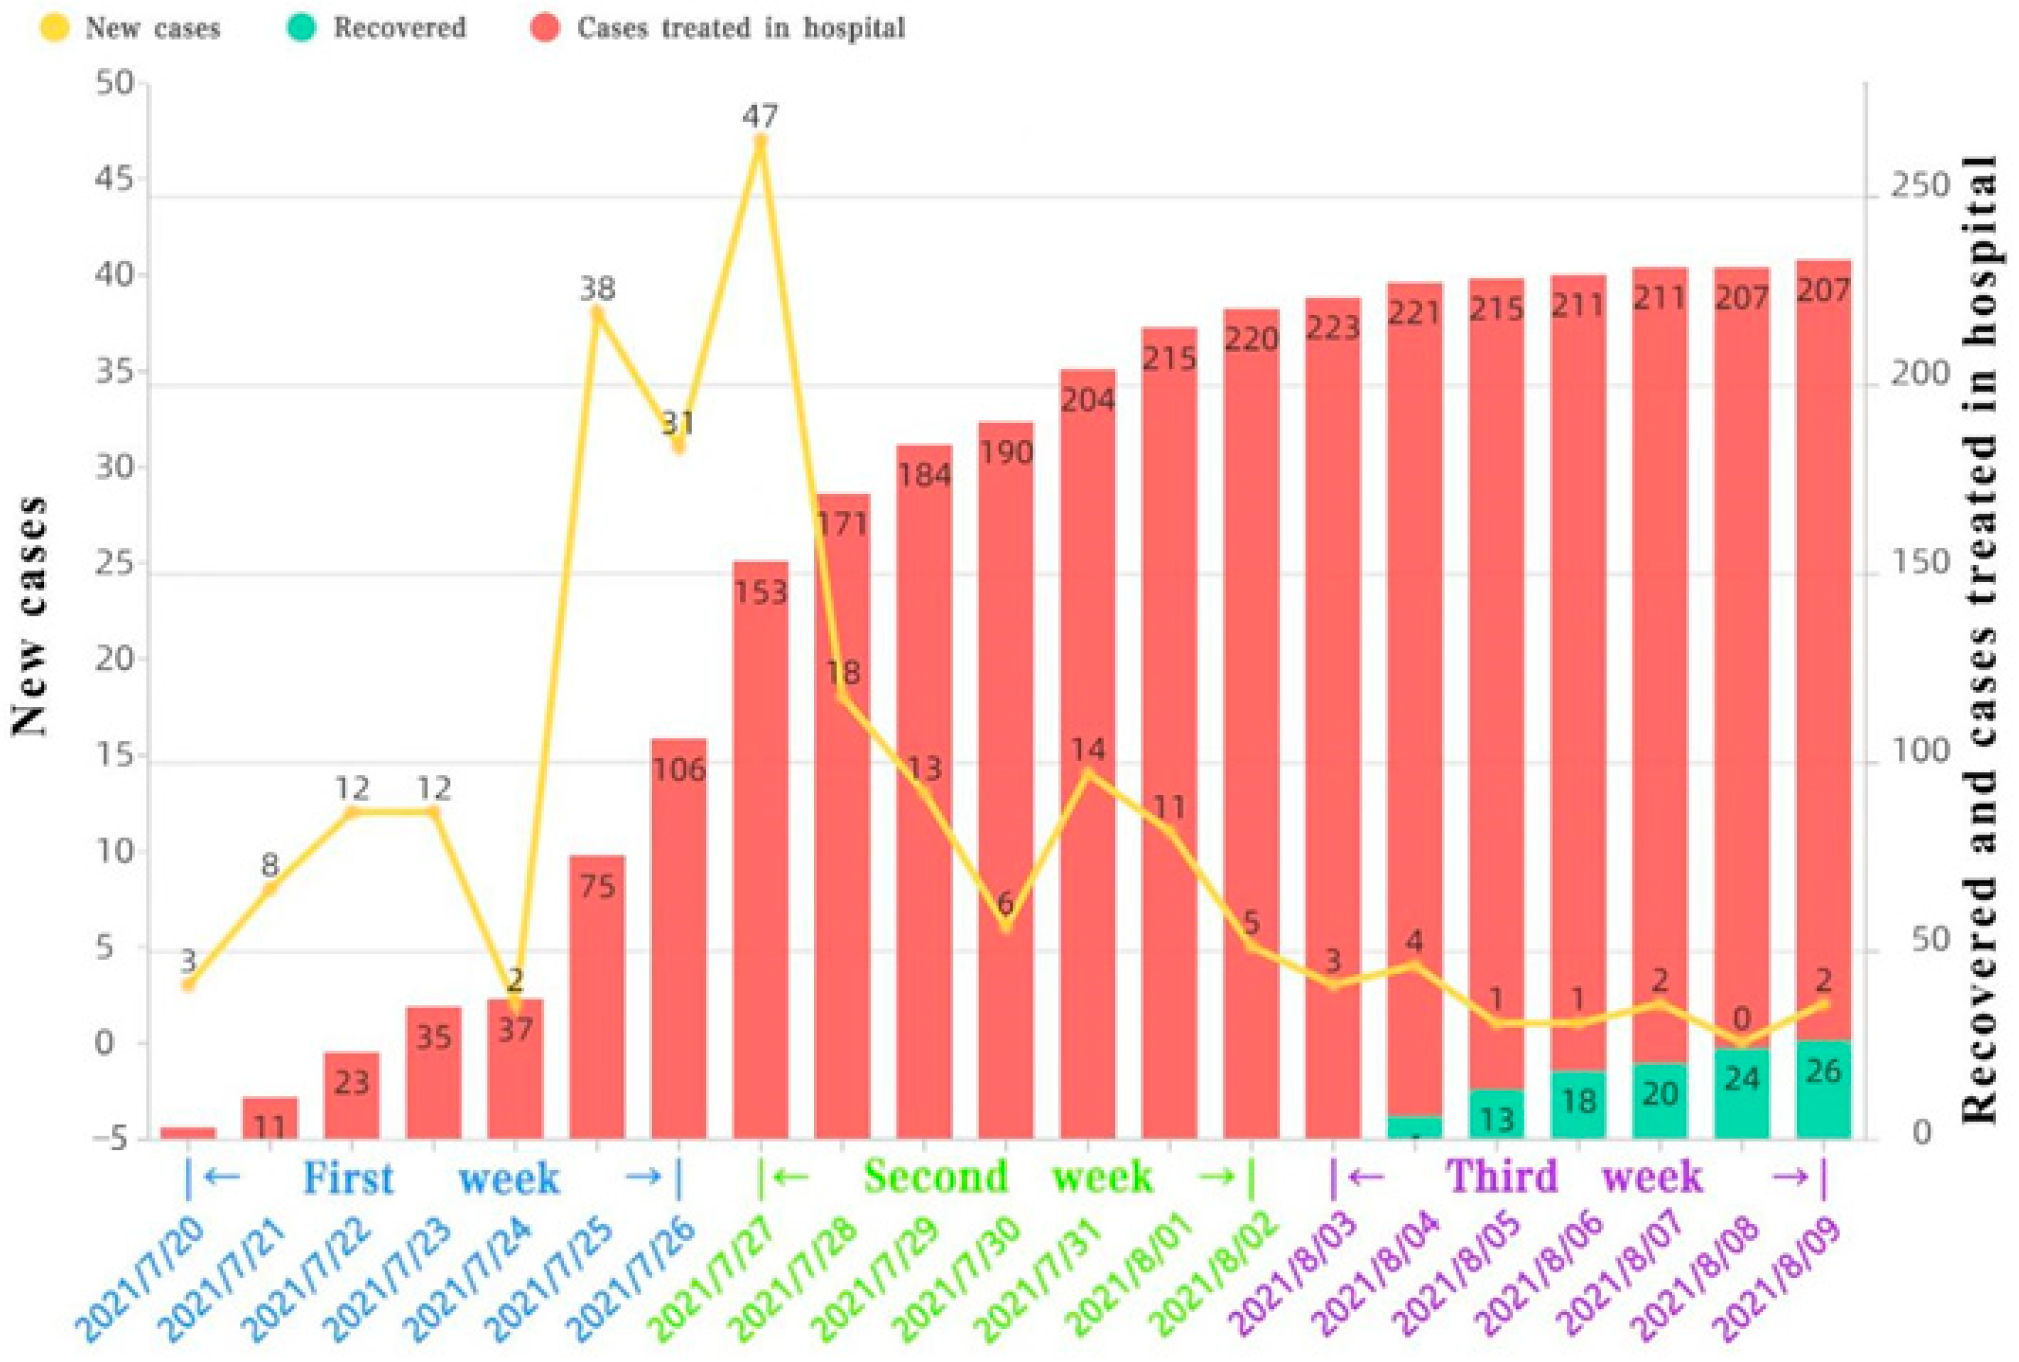
3. Data
4. Methodologies
4.1. Sequence Analysis
- x = the sequence of commuting mode,
- = the number of distinct subsequences in sequence x,
- ti = duration in each distinct state, used to compute the mean consecutive time and variance below (i = 1, number of distinct episodes),
- = variance of the state duration for the x sequence, and
- = the maximum value that the variance can take given the total duration of the sequence x.
4.2. Tobit Regression
5. Results and Discussion
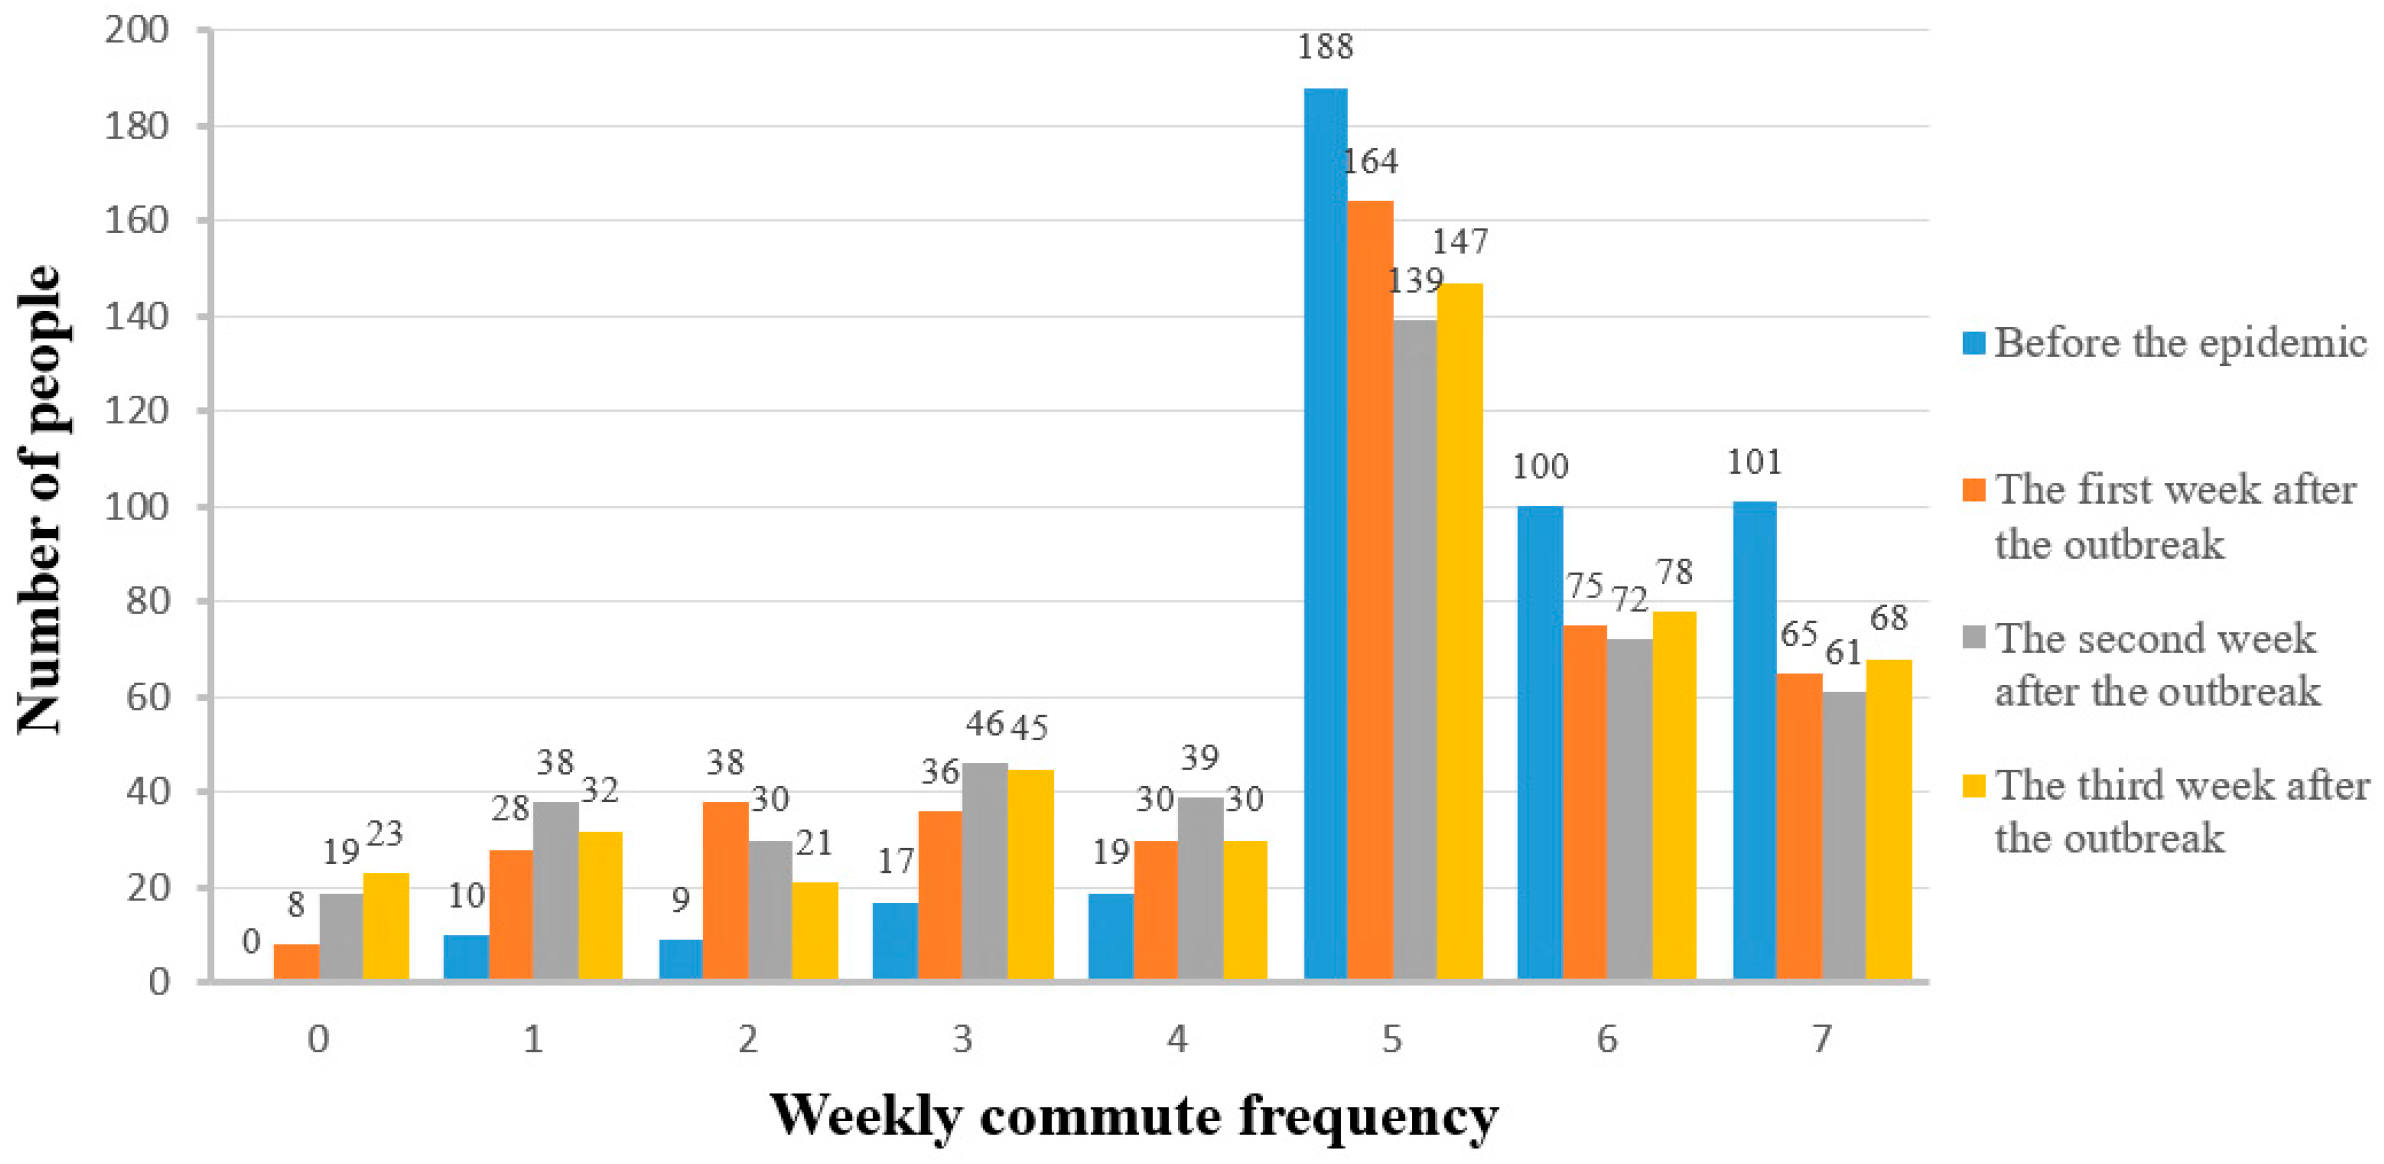
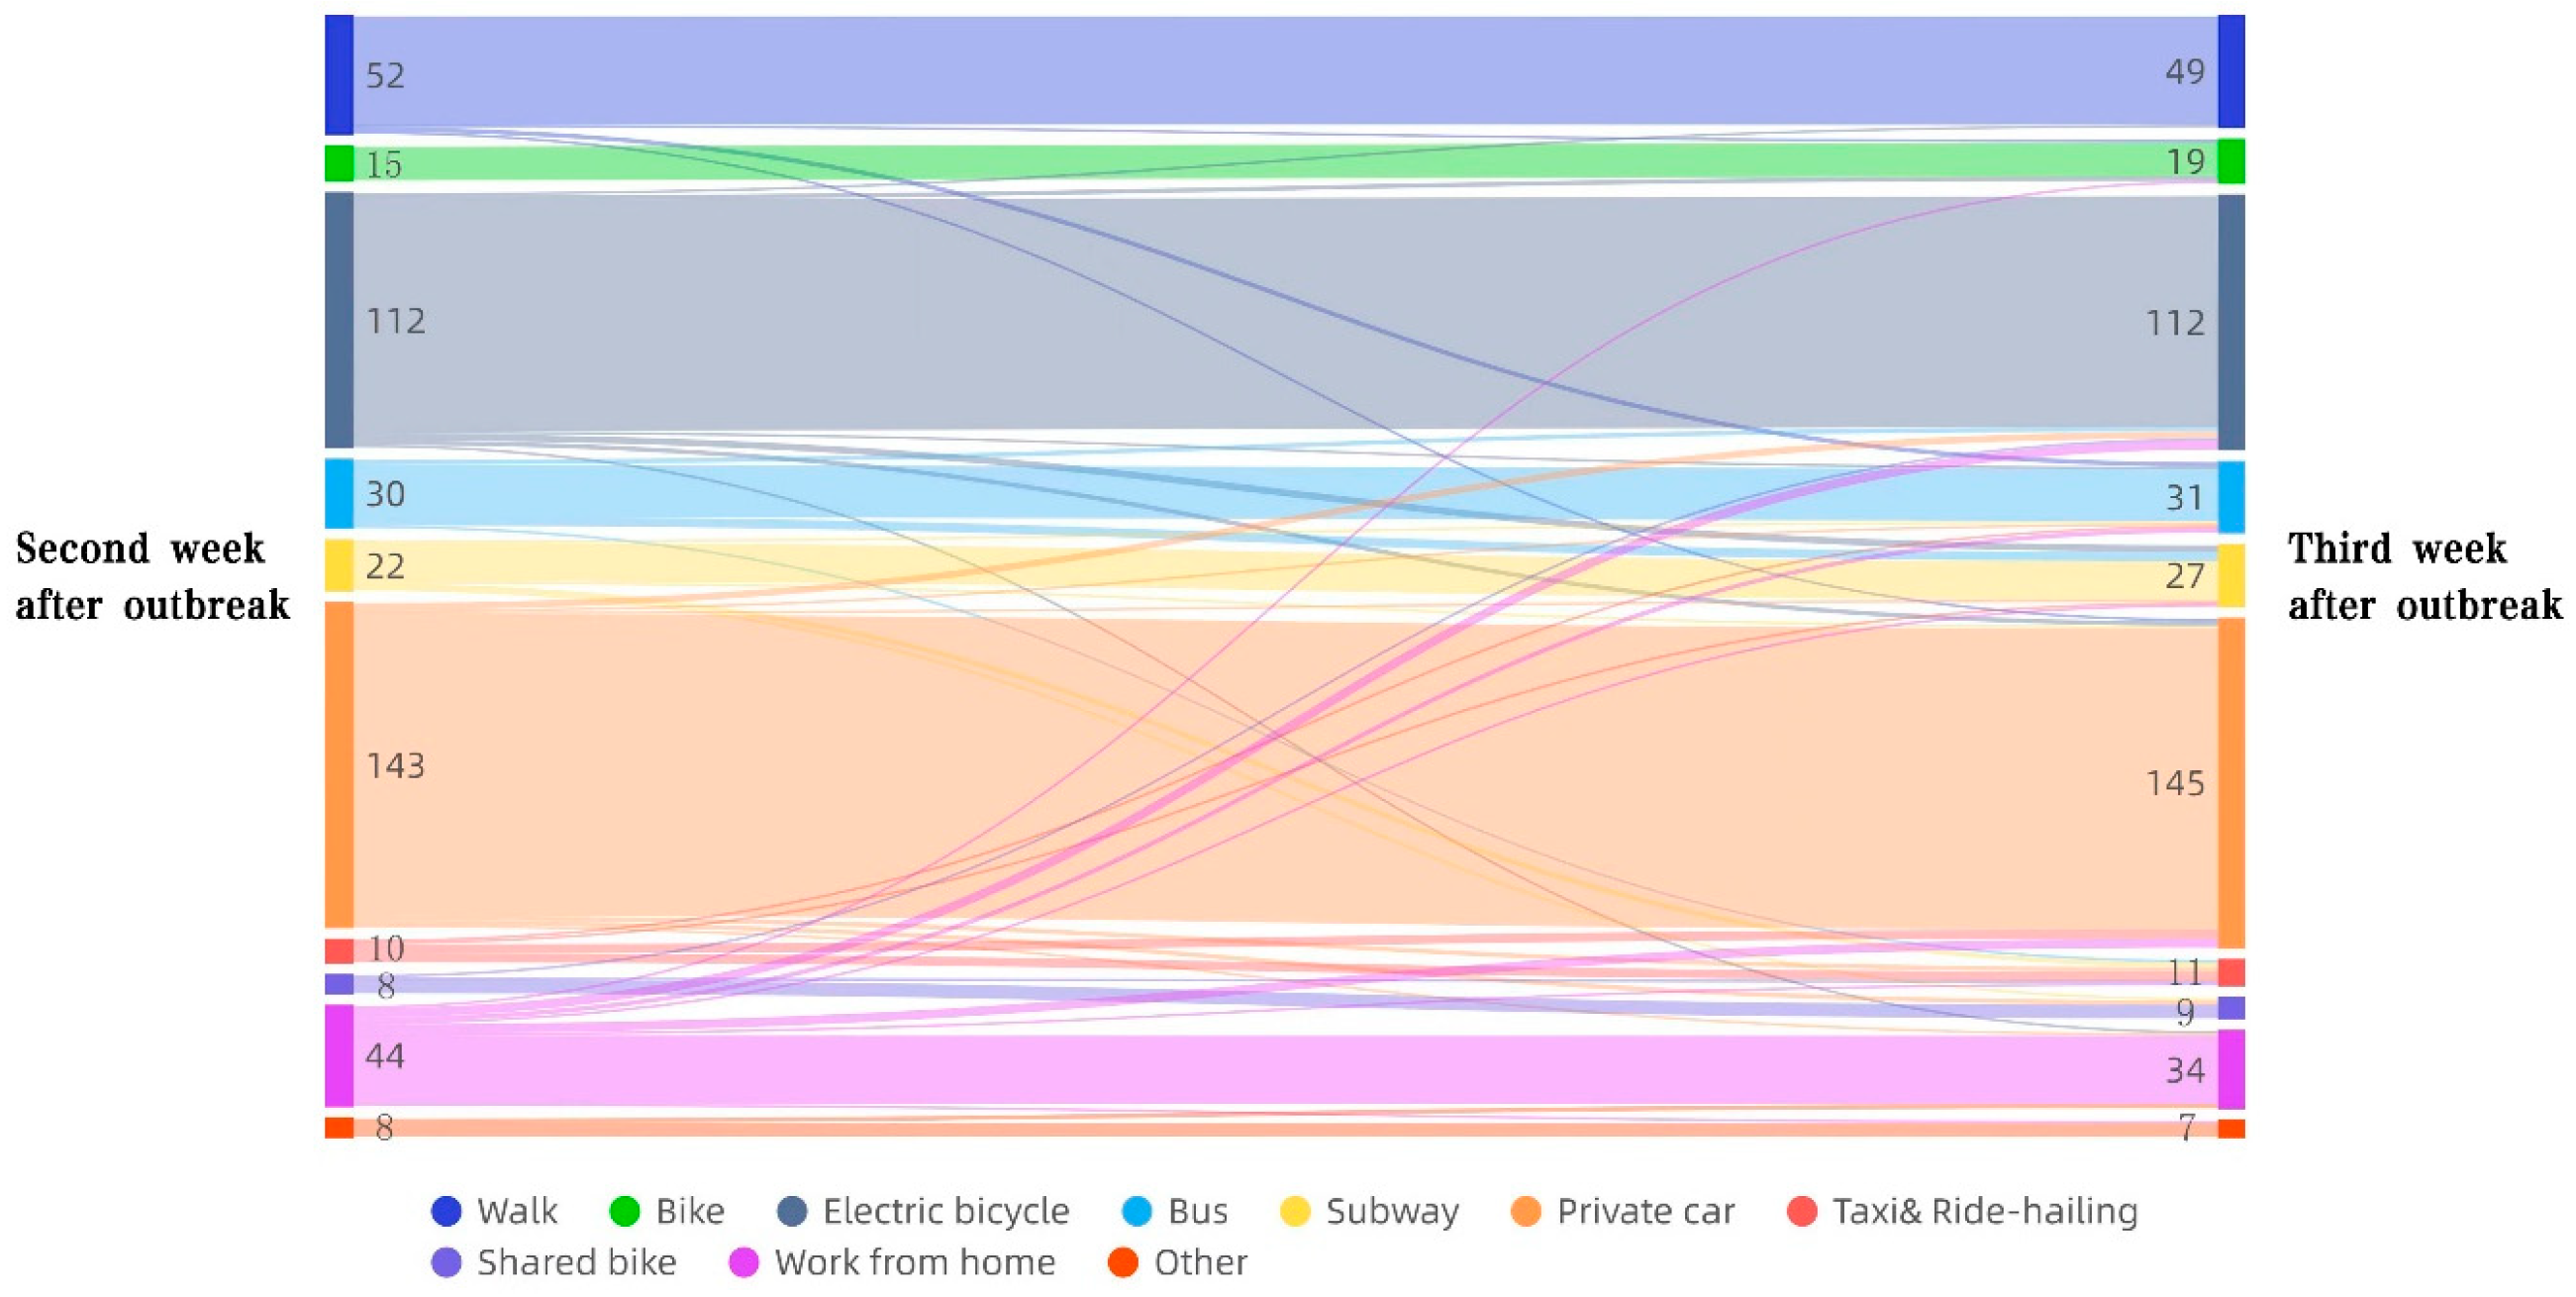
5.1. Descriptive Statistics
5.2. Impact of Localized COVID-19 Outbreak on Overall Commuting Behaviors
5.3. Tobit Regression Model Results
6. Conclusions and Recommendations
Author Contributions
Funding
Data Availability Statement
Conflicts of Interest
Appendix A
| 1. Age?: [single question] |
| ○<18 ○18~25 ○26~30 ○31~40 ○41~50 ○51~60 ○>60 |
| 2. Number of family members (including self) [single question] |
| ○1 ○2 ○3 ○4 ○5 ○>5 |
| 3. Gender?: [single question] |
| ○Male ○Female |
| 4. Occupation? [single question] |
| ○Student |
| ○Enterprise employees |
| ○Institutional employees |
| ○Freelancer |
| ○Self-employed |
| 5. Income before tax (RMB)? [single question] |
| ○0–80,000 |
| ○80,000–160,000 |
| ○>160,000 |
| 6. Educational background? [single question] |
| ○Primary school and below |
| ○Secondary school |
| ○High school |
| ○Undergraduate |
| ○Above undergraduate |
| 7. Have a driver’s licence? [single question] |
| ○Yes |
| ○No |
| 8. Household vehicle ownership? [multiple-choice question] |
| □Car |
| □Bike |
| □Electric bike |
| □None |
| 9. Whether there is a subway station within 800 m of the residence? [single question] |
| ○Yes |
| ○No |
| 11. Have you been vaccinated? [single question] |
| ○Yes |
| ○No |
| 12. Total number of nucleic acid tests you have taken since this outbreak? [single question] |
| ○Always green |
| ○The health code has had a yellow code |
| ○The health code has had a red code |
| 15. Health code situation since the outbreak? [single question] |
| ○Always green |
| ○The health code has had a yellow code |
| ○The health code has had a red code |
| 16. Family health codes since the outbreak? [single question] |
| ○Living alone |
| ○Cohabitants are always green codes |
| ○Cohabitants have yellow codes |
| ○Cohabitants have red codes |
| 17. Type of place of residence since this outbreak? [single question] |
| ○Risk-free area |
| ○Low-risk area |
| ○Medium-risk area |
| ○High-risk areas |
| 0 | 1 | 2 | 3 | 4 | 5 | 6 | 7 | |
| Before this outbreak | ○ | ○ | ○ | ○ | ○ | ○ | ○ | ○ |
| First week after outbreak | ○ | ○ | ○ | ○ | ○ | ○ | ○ | ○ |
| Second week after outbreak | ○ | ○ | ○ | ○ | ○ | ○ | ○ | ○ |
| Third week after outbreak | ○ | ○ | ○ | ○ | ○ | ○ | ○ | ○ |
| walking | private bike | electric bicycle | bus | subway | private car | taxi&ride-hailing | shared bike | working from home | others | |
| Before this outbreak | ○ | ○ | ○ | ○ | ○ | ○ | ○ | ○ | ○ | ○ |
| First week after outbreak | ○ | ○ | ○ | ○ | ○ | ○ | ○ | ○ | ○ | ○ |
| Second week after outbreak | ○ | ○ | ○ | ○ | ○ | ○ | ○ | ○ | ○ | ○ |
| Third week after outbreak | ○ | ○ | ○ | ○ | ○ | ○ | ○ | ○ | ○ | ○ |
References
- WHO. WHO Coronavirus (COVID-19) Dashboard; WHO: Geneva, Switzerland, 2022.
- Kim, S.; Lee, S.; Ko, E.; Jang, K.; Yeo, J. Changes in car and bus usage amid the COVID-19 pandemic: Relationship with land use and land price. J. Transp. Geogr. 2021, 96, 103168. [Google Scholar] [CrossRef]
- Useche, S.A.; Esteban, C.; Alonso, F.; Montoro, L. Are Latin American cycling commuters “at risk”? A comparative study on cycling patterns, behaviors, and crashes with non-commuter cyclists. Accid. Anal. Prev. 2021, 150, 105915. [Google Scholar] [CrossRef]
- Zenker, S.; Kock, F. The coronavirus pandemic—A critical discussion of a tourism research agenda. Tour. Manag. 2020, 81, 104164. [Google Scholar] [CrossRef] [PubMed]
- Yin, Y.; Li, D.; Zhang, S.; Wu, L. How does railway respond to the spread of COVID-19? Countermeasure analysis and evaluation around the world. Urban Rail Transit. 2021, 7, 29–57. [Google Scholar] [CrossRef] [PubMed]
- Li, H.; Zhang, Y.; Zhu, M.; Ren, G. Impacts of COVID-19 on the usage of public bicycle share in London. Transp. Res. Part A Policy Pract. 2021, 150, 140–155. [Google Scholar] [CrossRef] [PubMed]
- Gao, Y.; Chen, J.; Ji, K.; Liu, K.; Liu, H.; Wang, L. Effects of Individual and Built Environmental Features on Commuting Mode Shifts before and after the COVID-19 Outbreak in Guangzhou, China. J. Adv. Transp. 2023, 2023, 8955504. [Google Scholar] [CrossRef]
- Beck, M.J.; Hensher, D.A.; Nelson, J.D. Public transport trends in Australia during the COVID-19 pandemic: An investigation of the influence of bio-security concerns on trip behaviour. J. Transp. Geogr. 2021, 96, 103167. [Google Scholar] [CrossRef]
- Ha, J.; Lee, S.; Ko, J. Unraveling the impact of travel time, cost, and transit burdens on commute mode choice for different income and age groups. Transp. Res. Part A Policy Pract. 2020, 141, 147–166. [Google Scholar] [CrossRef]
- Shamshiripour, A.; Rahimi, E.; Shabanpour, R.; Mohammadian, A.K. How is COVID-19 reshaping activity-travel behavior? Evidence from a comprehensive survey in Chicago. Transp. Res. Interdiscip. Perspect. 2020, 7, 100216. [Google Scholar] [CrossRef]
- Le Quéré, C.; Jackson, R.B.; Jones, M.W.; Smith, A.J.; Abernethy, S.; Andrew, R.M.; De-Gol, A.J.; Willis, D.R.; Shan, Y.; Canadell, J.G.; et al. Temporary reduction in daily global CO 2 emissions during the COVID-19 forced confinement. Nat. Clim. Chang. 2020, 10, 647–653. [Google Scholar] [CrossRef]
- Hiselius, L.W.; Arnfalk, P. When the impossible becomes possible: COVID-19’s impact on work and travel patterns in Swedish public agencies. Eur. Transp. Res. Rev. 2021, 13, 17. [Google Scholar] [CrossRef] [PubMed]
- Hotle, S.; Murray-Tuite, P.; Singh, K. Influenza risk perception and travel-related health protection behavior in the US: Insights for the aftermath of the COVID-19 outbreak. Transp. Res. Interdiscip. Perspect. 2020, 5, 100127. [Google Scholar] [CrossRef] [PubMed]
- Ecke, L.; Magdolen, M.; Chlond, B.; Vortisch, P. Tracing the effects of the COVID-19 pandemic on car usage in Germany-an analysis of the German Mobility Panel. Eur. J. Transp. Infrastruct. Res. 2021, 21, 64–81. [Google Scholar] [CrossRef]
- Wielechowski, M.; Czech, K.; Grzęda, Ł. Decline in Mobility: Public Transport in Poland in the time of the COVID-19 Pandemic. Economies 2020, 8, 78. [Google Scholar] [CrossRef]
- Song, Y.; Ren, S.; Wolfson, J.; Zhang, Y.; Brown, R.; Fan, Y. Visualizing, clustering, and characterizing activity-trip sequences via weighted sequence alignment and functional data analysis. Transp. Res. Part C Emerg. Technol. 2021, 126, 103007. [Google Scholar] [CrossRef]
- Bhaduri, E.; Manoj, B.S.; Wadud, Z.; Goswami, A.K.; Choudhury, C.F. Modelling the effects of COVID-19 on travel mode choice behaviour in India. Transp. Res. Interdiscip. Perspect. 2020, 8, 100273. [Google Scholar] [CrossRef]
- Molloy, J.; Tchervenkov, C.; Hintermann, B.; Axhausen, K.W. Tracing the Sars-CoV-2 Impact: The First Month in Switzerland–March to April 2020. Arbeitsberichte Verk.-Und Raumplan. 2020, 1503. [Google Scholar] [CrossRef]
- Nobis, C.; Eisenmann, C.; Kolarova, V.; Winkler, C.; Lenz, B. Mobilität in Zeiten der Pandemie Auswirkungen von Corona auf Einstellungen und Mobilitätsverhalten. Int. Verkehrswesen 2020, 72, 94–97. [Google Scholar]
- Axhausen, K.W. The impact of COVID19 on Swiss travel. In Internet Access, Automation and COVID-19: On the Impacts of New and Persistent Determinants of Travel Behaviour (TRAIL and TU Delft Webinar 2020); IVT, ETH Zurich: Delft, The Netherlands, 2020. [Google Scholar]
- Hu, S.; Xiong, C.; Liu, Z.; Zhang, L. Examining spatiotemporal changing patterns of bike-sharing usage during COVID-19 pandemic. J. Transp. Geogr. 2021, 91, 102997. [Google Scholar] [CrossRef] [PubMed]
- Bh, A.; TM, R. A comprehensive analysis of the trip frequency behavior in COVID scenario. Transp. Lett. 2021, 13, 395–403. [Google Scholar] [CrossRef]
- Tan, L.; Ma, C. Choice behavior of commuters’ rail transit mode during the COVID-19 pandemic based on logistic model. J. Traffic Transp. Eng. (Engl. Ed.) 2021, 8, 186–195. [Google Scholar] [CrossRef]
- Yıldırım, M.; Geçer, E.; Akgül, Ö. The impacts of vulnerability, perceived risk, and fear on preventive behaviours against COVID-19. Psychol. Health Med. 2021, 26, 35–43. [Google Scholar] [CrossRef] [PubMed]
- Dingil, A.E.; Esztergár-Kiss, D. The influence of the Covid-19 pandemic on mobility patterns: The first Wave’s results. Transp. Lett. 2021, 13, 434–446. [Google Scholar] [CrossRef]
- Beck, M.J.; Hensher, D.A. Insights into the impact of COVID-19 on household travel and activities in Australia–The early days of easing restrictions. Transp. Policy 2020, 99, 95–119. [Google Scholar] [CrossRef]
- De Haas, M.; Faber, R.; Hamersma, M. How COVID-19 and the Dutch i‘ntelligent lockdown’ change activities, work and travel behaviour: Evidence from longitudinal data in the Netherlands. Transp. Res. Interdiscip. Perspect. 2020, 6, 100150. [Google Scholar] [PubMed]
- Advani, M.; Sharma, N.; Dhyani, R. Mobility change in Delhi due to COVID and its’ immediate and long term impact on demand with intervened non motorized transport friendly infrastructural policies. Transp. Policy 2021, 111, 28–37. [Google Scholar] [CrossRef]
- Nikiforiadis, A.; Ayfantopoulou, G.; Stamelou, A. Assessing the impact of COVID-19 on bike-sharing usage: The case of Thessaloniki, Greece. Sustainability 2020, 12, 8215. [Google Scholar] [CrossRef]
- Shang, W.; Chen, J.; Bi, H.; Sui, Y.; Chen, Y.; Yu, H. Impacts of COVID-19 pandemic on user behaviors and environmental benefits of bike sharing: A big-data analysis. Appl. Energy 2021, 285, 116429. [Google Scholar] [CrossRef]
- Dingel, J.I.; Neiman, B. How many jobs can be done at home? J. Public Econ. 2020, 189, 104235. [Google Scholar] [CrossRef] [PubMed]
- Astroza, S.; Tirachini, A.; Hurtubia, R.; Carrasco, J.A.; Guevara, A.; Munizaga, M.; Figueroa, M.; Torres, V. Mobility changes, teleworking, and remote communication during the COVID-19 pandemic in Chile. Findings 2020, 13489. [Google Scholar] [CrossRef]
- Beck, M.J.; Hensher, D.A.; Wei, E. Slowly coming out of COVID-19 restrictions in Australia: Implications for working from home and commuting trips by car and public transport. J. Transp. Geogr. 2020, 88, 102846. [Google Scholar] [CrossRef] [PubMed]
- Zhang, Y.; Fricker, J.D. Quantifying the impact of COVID-19 on non-motorized transportation: A Bayesian structural time series model. Transp. Policy 2021, 103, 11–20. [Google Scholar] [CrossRef]
- Bergantino, A.S.; Intini, M.; Tangari, L. Influencing factors for potential bike-sharing users: An empirical analysis during the COVID-19 pandemic. Res. Transp. Econ. 2021, 86, 101028. [Google Scholar] [CrossRef]
- Shakibaei, S.; De Jong, G.C.; Alpkökin, P.; Rashidi, T.H. Impact of the COVID-19 pandemic on travel behavior in Istanbul: A panel data analysis. Sustain. Cities Soc. 2021, 65, 102619. [Google Scholar] [CrossRef] [PubMed]
- Stiles, J.; Smart, M.J. Working at home and elsewhere: Daily work location, telework, and travel among United States knowledge workers. Transportation 2021, 48, 2461–2491. [Google Scholar] [CrossRef] [PubMed]
- Hadjidemetriou, G.M.; Sasidharan, M.; Kouyialis, G.; Parlikad, A.K. The impact of government measures and human mobility trend on COVID-19 related deaths in the UK. Transp. Res. Interdiscip. Perspect. 2020, 6, 100167. [Google Scholar] [CrossRef]
- Habib, K.N.; Hawkins, J.; Shakib, S.; Loa, P.; Mashrur, S.; Dianat, A.; Wang, K.; Hossain, S.; Liu, Y. Assessing the impacts of COVID-19 on urban passenger travel demand in the greater Toronto area: Description of a multi-pronged and multi-staged study with initial results. Transp. Lett. 2021, 13, 353–366. [Google Scholar] [CrossRef]
- Hensher, D.A.; Button, K.J. Handbook of Transport Modelling. Emerald Group Publishing Limited: Leeds, UK, 2000. [Google Scholar]
- Anwari, N.; Ahmed, M.T.; Islam, M.R.; Hadiuzzaman, M.; Amin, S. Exploring the travel behavior changes caused by the COVID-19 crisis: A case study for a developing country. Transp. Res. Interdiscip. Perspect. 2021, 9, 100334. [Google Scholar] [CrossRef]
- Sy, K.T.L.; Martinez, M.E.; Rader, B.; White, L.F. Socioeconomic disparities in subway use and COVID-19 outcomes in New York City. Am. J. Epidemiol. 2021, 190, 1234–1242. [Google Scholar] [CrossRef]
- Wilbur, M.; Ayman, A.; Sivagnanam, A.; Ouyang, A.; Poon, V.; Kabir, R.; Vadali, A.; Pugliese, P.; Freudberg, D.; Laszka, A.; et al. Impact of COVID-19 on public transit accessibility and ridership. arXiv 2020, arXiv:2008.02413. [Google Scholar] [CrossRef]
- Kogus, A.; Gal-Tzur, A.; Shiftan, Y. Modelling the long-term expected impact of the COVID-19 crisis on commute and telecommute. Transp. Res. Record. 2023, 03611981231160170. [Google Scholar] [CrossRef]
- Shibayama, T.; Sandholzer, F.; Laa, B.; Brezina, T. Impact of COVID-19 lockdown on commuting: A multi-country perspective. Eur. J. Transp. Infrastruct. Res. 2021, 21, 70–93. [Google Scholar]
- Zhao, Q.; Yang, J.; Wang, X. Investigating commuters’ working from home attitudes and its explanatory factors after the lifting of COVID-19 prevention and control policies. Case Stud. Transp. Policy 2024, 15, 101157. [Google Scholar] [CrossRef]
- Tang, L.; Jiao, L.; Huo, X.; Zhang, Y. Research on Residents’ Choice Behavior of Public Transport Travel Mode during the Post-epidemic Period. In International Symposium on Advancement of Construction Management and Real Estate; Springer: Berlin/Heidelberg, Germany, 2022; pp. 929–942. [Google Scholar]
- Zhou, S.; Zhou, S.; Jing, F.; Qi, L.; Li, J. Exploring the changes of individuals’ travel behavior in response to COVID-19 and their influencing factors based on mobile phone data. J. Transp. Health 2024, 36, 101788. [Google Scholar] [CrossRef]
- Commission NMH. The Latest Situation of COVID-19 in Jiangsu as of 24:00. 2024. Available online: http://wjw.nanjing.gov.cn/njswshjhsywyh/202108/t20210810_3098383.html (accessed on 10 June 2024).
- Mi, L.; Zhao, J.; Xu, T.; Yang, H.; Lv, T.; Shang, K.; Qiao, Y.; Zhang, Z. How does COVID-19 emergency cognition influence public pro-environmental behavioral intentions? An affective event perspective. Resour. Conserv. Recycl. 2021, 168, 105467. [Google Scholar] [CrossRef] [PubMed]
- Ma, X.; Zhang, S.; Zhu, M.; Wu, T.; He, M.; Cui, H. Non-commuting intentions during COVID-19 in Nanjing, China: A hybrid latent class modeling approach. Cities 2023, 137, 104341. [Google Scholar] [CrossRef] [PubMed]
- Si, H.; Shen, L.; Liu, W.; Wu, G. Uncovering people’s mask-saving intentions and behaviors in the post-COVID-19 period: Evidence from China. Sustain. Cities Soc. 2021, 65, 102626. [Google Scholar] [CrossRef]
- Zhou, H.; Wang, Y.; Huscroft, J.R.; Bai, K. Impacts of COVID-19 and anti-pandemic policies on urban transport—An empirical study in China. Transp. Policy 2021, 110, 135–149. [Google Scholar] [CrossRef]
- Su, R.; McBride, E.C.; Goulias, K.G. Unveiling daily activity pattern differences between telecommuters and commuters using human mobility motifs and sequence analysis. Transp. Res. Part A Policy Pract. 2021, 147, 106–132. [Google Scholar] [CrossRef]
- Elzinga, C.H. Turbulence in Categorical Time Series; Department of Social Science Research Methods Vrije Universiteit Amsterdam: Amsterdam, The Netherlands, 2006. [Google Scholar]
- Elzinga, C.H.; Liefbroer, A.C. De-standardization of Family-Life Trajectories of Young Adults: A Cross-National Comparison Using Sequence Analysis. Eur. J. Popul. /Rev. Eur. De Démographie 2007, 23, 225–250. [Google Scholar] [CrossRef]
- Del Saz-Salazar, S.; Feo-Valero, M.; Vázquez-Paja, B. Valuing public acceptance of alternative-fuel buses using a Latent Class Tobit model: A case study in Valencia. J. Clean. Prod. 2020, 261, 121199. [Google Scholar] [CrossRef]
- Guo, Y.; Sayed, T.; Essa, M. Real-time conflict-based Bayesian Tobit models for safety evaluation of signalized intersections. Accid. Anal. Prev. 2020, 144, 105660. [Google Scholar] [CrossRef] [PubMed]
- McIntosh, K.; Hirsch, M.S.; Bloom, A. Coronavirus disease 2019 (COVID-19). UpToDate Hirsch MS Bloom 2020, 5, 23–27. [Google Scholar]
- Greene, W.H. Econometric Analysis; Pearson Education India: Delhi, India, 2003. [Google Scholar]
- Nanjing. Communiqué of the Seventh National Population Census of Nanjing. 2024. Available online: http://tjj.nanjing.gov.cn/bmfw/njsj/202105/t20210524_2945571.html (accessed on 10 June 2024).
- China. Pandemic Risk Level. 2024. Available online: http://bmfw.www.gov.cn/yqfxdjcx/risk.html (accessed on 8 June 2024).
- Wang, J.; Zhu, H.; Lai, X.; Zhang, H.; Huang, Y.; Feng, H.; Lyu, Y.; Jing, R.; Guo, J.; Fang, H. From COVID-19 vaccination intention to actual vaccine uptake: A longitudinal study among Chinese adults after six months of a national vaccination campaign. Expert Rev. Vaccines 2022, 21, 385–395. [Google Scholar] [CrossRef] [PubMed]
- Liu, Y.; Pei, T.; Song, C.; Chen, J.; Chen, X.; Huang, Q.; Wang, X.; Shu, H.; Wang, X.; Guo, S.; et al. How did human dwelling and working intensity change over different stages of COVID-19 in Beijing? Sustain. Cities Soc. 2021, 74, 103206. [Google Scholar] [CrossRef]
- Böcker, L.; Olsson, L.E.; Uteng, T.P.; Friman, M. Pandemic impacts on public transport safety and stress perceptions in Nordic cities. Transp. Res. Part D Transp. Environ. 2023, 114, 103562. [Google Scholar] [CrossRef]
- Kim, C.; Cheon, S.H.; Choi, K.; Joh, C.; Lee, H. Exposure to fear: Changes in travel behavior during MERS outbreak in Seoul. KSCE J. Civ. Eng. 2017, 21, 2888–2895. [Google Scholar] [CrossRef]
- Kwok, K.O.; Li, K.K.; Chan, H.H.H.; Yi, Y.Y.; Tang, A.; Wei, W.I.; Wong, S.Y.S. Community responses during early phase of COVID-19 epidemic, Hong Kong. Emerg. Infect. Dis. 2020, 26, 1575. [Google Scholar] [CrossRef]
- Cai, M.; Shen, Q.; Wang, Y.; Brown, M.; Ban, X.; Ashour, L.A. Examining commute mode choice of essential workers before and during the COVID-19 pandemic–A case study of the University of Washington. Case Stud. Transp. Policy 2024, 15, 101129. [Google Scholar] [CrossRef]
- Loa, P.; Hossain, S.; Mashrur, S.M.; Liu, Y.; Wang, K.; Ong, F.; Habib, K.N. Exploring the impacts of the COVID-19 pandemic on modality profiles for non-mandatory trips in the Greater Toronto Area. Transp. Policy 2021, 110, 71–85. [Google Scholar] [CrossRef]
- Scorrano, M.; Danielis, R. Active mobility in an Italian city: Mode choice determinants and attitudes before and during the COVID-19 emergency. Res. Transp. Econ. 2021, 86, 101031. [Google Scholar] [CrossRef]
- Shakeel, K.; Wijayaratna, K.; Barbieri, D.M.; Lou, B.; Rashidi, T.H. Mobility perceptions regarding the COVID-19 pandemic from around the world. Travel Behav. Soc. 2023, 33, 100631. [Google Scholar] [CrossRef]
- Ives, J.; Greenfield, S.; Parry, J.M.; Draper, H.; Gratus, C.; Petts, J.I.; Sorell, T.; Wilson, S. Healthcare workers’ attitudes to working during pandemic influenza: A qualitative study. BMC Public Health 2009, 9, 56. [Google Scholar] [CrossRef] [PubMed]
- Paul, T.; Chakraborty, R.; Ratri, S.A.; Debnath, M. Impact of COVID-19 on mode choice behavior: A case study for Dhaka, Bangladesh. Transp. Res. Interdiscip. Perspect. 2022, 15, 100665. [Google Scholar] [CrossRef] [PubMed]
- Currie, G.; Jain, T.; Aston, L. Evidence of a post-COVID change in travel behaviour—Self-reported expectations of commuting in Melbourne. Transp. Res. Part A Policy Pract. 2021, 153, 218–234. [Google Scholar] [CrossRef]
- Harrington, D.M.; Hadjiconstantinou, M. Changes in commuting behaviours in response to the COVID-19 pandemic in the UK. J. Transp. Health 2022, 24, 101313. [Google Scholar] [CrossRef] [PubMed]
- Cohen, J. Statistical Power Analysis for the Behavioral Sciences; Routledge: London, UK, 2013. [Google Scholar]
- Pawar, D.S.; Yadav, A.K.; Choudhary, P.; Velaga, N.R. Modelling work-and non-work-based trip patterns during transition to lockdown period of COVID-19 pandemic in India. Travel Behav. Soc. 2021, 24, 46–56. [Google Scholar] [CrossRef] [PubMed]
- Elbany, M.; Elhenawy, Y. Analyzing the ultimate impact of COVID-19 in Africa. Case Stud. Transp. Policy 2021, 9, 796–804. [Google Scholar] [CrossRef]
- Chen, W.; Huang, G.; Hu, A. Red, yellow, green or golden: The post-pandemic future of China’s health code apps. Inf. Commun. Soc. 2022, 25, 618–633. [Google Scholar] [CrossRef]
- Yang, F.; Heemsbergen, L.; Fordyce, R. Comparative analysis of China’s Health Code, Australia’s COVIDSafe and New Zealand’s COVID Tracer Surveillance Apps: A new corona of public health governmentality? Media Int. Aust. 2021, 178, 182–197. [Google Scholar] [CrossRef]
- Crowley, F.; Daly, H.; Doran, J.; Ryan, G.; Caulfield, B. The impact of labour market disruptions and transport choice on the environment during COVID-19. Transp. Policy 2021, 106, 185–195. [Google Scholar] [CrossRef] [PubMed]


| (Commuting Mode, Commuting Days for Each Week) | Pattern | Number of Subsequences | Turbulence T(x) | |
|---|---|---|---|---|
| Person 1 | (SB,5)-(SB,5)-(SB,5)-(SB,5) | SB | 2 | 1 |
| Person 2 | (EB,6)-(PC,5)-(PC,4)-(PC,3) | EB-PC | 4 | 4.47 |
| Person 3 | (S,6)-(PC,6)-(PC,6)-(PC,6) | S-PC | 4 | 3.72 |
| Person 4 | (S,5)-(S,5)-(WFH,5)-(WFH,5) | S-WFH | 4 | 8.36 |
| Person 5 | (B,6)-(B,6)-(S,6)-(T&RH,6) | B-S-T&RH | 8 | 6.46 |
| Person 6 | (B,7)-(T&RH,2)-(PC,7)-(EB,5) | B-T&RH-PC-EB | 16 | 7.41 |
| Person 7 | (S,5)-(PC,5)-(WFH,5)-(PC,5) | S-PC-WFH-PC | 14 | 9.42 |
| Variable | Levels | Percentage (%) |
|---|---|---|
| Gender | Male | 51.6 |
| Female | 48.4 | |
| Age | <18 | 4.7 |
| 18–25 | 24.3 | |
| 26–30 | 21.6 | |
| 31–40 | 30.7 | |
| 41–50 | 11.9 | |
| 51–60 | 6.8 | |
| Income (RMB) | 0–80,000 | 45.0 |
| 80,000–160,000 | 43.7 | |
| >160,000 | 11.3 | |
| Education | Primary school and below | 0.7 |
| Secondary school | 6.1 | |
| High school | 17.8 | |
| Undergraduate | 63.7 | |
| Above undergraduate | 11.7 | |
| Occupation | Student | 19.6 |
| Enterprise employees | 57.0 | |
| Institutional employees | 13.3 | |
| Freelancer | 7.0 | |
| Self-employed | 3.1 | |
| Vaccination | Not vaccinated | 12.8 |
| Vaccinated | 87.2 | |
| Family member | 1 | 9.2 |
| 2 | 13.7 | |
| 3 | 34.7 | |
| 4 | 23.2 | |
| 5 | 11.7 | |
| 6 | 7.4 | |
| Risk type | Risk-free area | 46.2 |
| Low-risk area | 45.3 | |
| Medium-risk area | 7.2 | |
| High-risk areas | 1.4 | |
| Nucleic acid test (NAT) | 1 | 18.5 |
| 2 | 9.9 | |
| 3 | 16.0 | |
| 4 | 14.6 | |
| 5 | 12.2 | |
| 6 | 10.8 | |
| 7 | 11.7 | |
| 8 | 12.6 | |
| Driving license | Yes | 74.8 |
| No | 25.2 | |
| Whether there is a subway station within 800 meters of the residence | Yes | 48.6 |
| No | 51.4 | |
| Car ownership | Yes | 73.2 |
| No | 26.8 | |
| Bike ownership | Yes | 35.4 |
| No | 64.6 | |
| Electric bike ownership | Yes | 63.5 |
| No | 36.5 | |
| Health code situation since the outbreak | Always green | 92.6 |
| There was a non-green code | 7.4 | |
| Family health codes since the outbreak | Living alone | 11.5 |
| Cohabitants are always green codes | 82.4 | |
| Cohabitants have yellow codes | 5.4 | |
| Cohabitants have red codes | 0.7 |
| Category | Sub-Category | Coefficient | Marginal Effects | t Value |
|---|---|---|---|---|
| Age group | <25 | —— | —— | —— |
| 25–40 | −0.780 | −0.314 | −1.19 | |
| 40–60 | −1.611 | −0.610 | −1.98 ** | |
| Gender | Female | —— | —— | —— |
| Male | −0.517 | −0.199 | −1.15 | |
| Family member | Number of household members | −0.231 | −0.089 | −1.20 |
| Income | Less than 80,000¥ | —— | —— | —— |
| 80,000–160,000¥ | 1.589 | 0.618 | 2.64 *** | |
| More than 160,000¥ | 0.078 | 0.027 | 0.09 | |
| Education level | Low | —— | —— | —— |
| Medium | 0.034 | 0.012 | 0.03 | |
| High | 0.407 | 0.154 | 0.42 | |
| Profession | Student | —— | —— | —— |
| Unit staff | −0.520 | −0.200 | −0.68 | |
| Freelancers | 0.913 | 0.390 | 0.96 | |
| Driving license ownership | No | —— | —— | —— |
| Yes | −0.187 | −0.072 | −0.30 | |
| Car ownership | No | —— | —— | —— |
| Yes | 0.492 | 0.186 | 0.89 | |
| Bike ownership | No | —— | —— | —— |
| Yes | 0.496 | 0.193 | 1.04 | |
| Electric bike ownership | No | —— | —— | —— |
| Yes | −0.093 | −0.036 | −0.19 | |
| Subway | There is no subway station within 800 m of the residential place | —— | —— | —— |
| There is a subway station within 800 m of the residential place | 0.877 | 0.337 | 1.99 ** | |
| Vaccination | Vaccinated | —— | —— | —— |
| Not vaccinated | −0.829 | −0.304 | −1.23 | |
| NAT | The total number of nucleic acid tests since the outbreak | 0.031 | 0.012 | 0.31 |
| Residence risk zone | Risk free area | —— | —— | —— |
| Low-risk area | 0.815 | 0.883 | 1.76 * | |
| Medium-or high-risk areas | 2.133 | 0.305 | 2.69 *** | |
| Health code situation since the outbreak | Alwas green code | —— | —— | —— |
| Have a non-green code | −0.951 | −0.345 | −0.95 | |
| Family health codes since the outbreak | Living alone | —— | —— | —— |
| Cohabitants always have green health codes | 0.928 | 0.330 | 1.13 | |
| Cohabitants have non-green health codes | 3.342 | 1.428 | 2.79 *** | |
| Observations | 444 | |||
| Left-censored observations (1 turbulence) | 228 | |||
| Uncensored observations | 216 | |||
| Log likelihood at zero | −864.15 | |||
| Log likelihood at convergence | −752.11 | |||
| Akaike information criterion (AIC) | 1552.22 | |||
| Bayesian information criterion (BIC) | 1650.52 | |||
Disclaimer/Publisher’s Note: The statements, opinions and data contained in all publications are solely those of the individual author(s) and contributor(s) and not of MDPI and/or the editor(s). MDPI and/or the editor(s) disclaim responsibility for any injury to people or property resulting from any ideas, methods, instructions or products referred to in the content. |
© 2024 by the authors. Licensee MDPI, Basel, Switzerland. This article is an open access article distributed under the terms and conditions of the Creative Commons Attribution (CC BY) license (https://creativecommons.org/licenses/by/4.0/).
Share and Cite
Chen, P.; Wu, T.; Yin, Y.; Ma, X. Commuting Behavior Changes at Different Stages of Localized COVID-19 Outbreak: Evidence from Nanjing, China. Systems 2024, 12, 271. https://doi.org/10.3390/systems12080271
Chen P, Wu T, Yin Y, Ma X. Commuting Behavior Changes at Different Stages of Localized COVID-19 Outbreak: Evidence from Nanjing, China. Systems. 2024; 12(8):271. https://doi.org/10.3390/systems12080271
Chicago/Turabian StyleChen, Pei, Tao Wu, Yurui Yin, and Xinwei Ma. 2024. "Commuting Behavior Changes at Different Stages of Localized COVID-19 Outbreak: Evidence from Nanjing, China" Systems 12, no. 8: 271. https://doi.org/10.3390/systems12080271