Article

Optimal Allocation of Multi-Type Vaccines in a Two-Dose Vaccination Campaign for Epidemic Control: A Case Study of COVID-19

College of Information Science and Engineering, Northeastern University, Shenyang 110819, China
*
Author to whom correspondence should be addressed.
Systems 2024, 12(8), 286; https://doi.org/10.3390/systems12080286
Submission received: 5 June 2024 / Revised: 9 July 2024 / Accepted: 2 August 2024 / Published: 5 August 2024

Abstract

:
As a typical case of the optimal planning for the provision of restricted medical resources, widespread vaccination is considered an effective and sustainable way to prevent and control large-scale novel coronavirus disease 2019 (COVID-19) outbreaks. However, an initial supply shortage of vaccines is inevitable because of the narrow production and logistical capacity. This work focuses on the multi-type vaccine resource allocation problem in a two-dose vaccination campaign under limited supply. To address this issue, we extended an age-stratified susceptible, exposed, infectious, and recovered (SEIR) epidemiological model to incorporate a two-dose vaccination campaign involving multiple vaccine types to fully characterize the various stages of infection and vaccination. Afterward, we integrated the proposed epidemiological model into a nonlinear programming (NLP) model to determine the optimal allocation strategy under supply capacity and vaccine hesitancy constraints with the goal of minimizing the cumulative number of deaths due to the pandemic over the entire planning horizon. A case study based on real-world data from the initial mass vaccination campaign against COVID-19 in the Midlands, England, was taken to validate the applicability of our model. Then, we performed a comparative study to demonstrate the performance of the proposed method and conducted an extensive sensitivity analysis on critical model parameters. Our results indicate that prioritizing the allocation of vaccines to elderly persons is an effective strategy for reducing COVID-19-related fatalities. Furthermore, we found that vaccination alone will not be sufficient for epidemic control in the short term, and appropriate non-pharmacological interventions are still important for effective viral containment during the initial vaccine rollout. The results also showed that the relative efficacy of the first dose is a vital factor affecting the optimal interval between doses. It is always best to complete the two-dose vaccination schedule as soon as possible when the relative efficacy of the first dose is low. Conversely, delaying the second dose of a vaccine as long as possible to increase the proportion of the population vaccinated with a single dose tends to be more favorable when the relative efficacy of the first dose is high. Finally, our proposed model is general and easily extendable to the study of other infectious disease outbreaks and provides important implications for public health authorities seeking to develop effective vaccine allocation strategies for tackling possible future pandemics.

1. Introduction

Throughout human history, emerging infectious diseases caused by pathogenic microorganisms have posed a severe threat to public health and safety. For example, the Yersinia pestis plague pandemic resulted in the death of approximately a quarter of the European population in the 14th century [1]. The 1918 influenza A (H1N1) pandemic, also known as the Spanish Flu, was responsible for 50 million deaths worldwide [2]. The Ebola virus (EBOV) has caused several prominent outbreaks in Africa, resulting in high mortality rates, since its first discovery in 1976 in the Democratic Republic of the Congo [3].
Recently, another striking example of an infectious disease outbreak is the coronavirus disease 2019 (COVID-19) pandemic, which is caused by the novel RNA virus severe acute respiratory syndrome coronavirus 2 (SARS-CoV-2); it has rapidly spread globally and seriously disrupted human life since December 2019 [4]. According to reports by the World Health Organization (WHO), there were more than 775 million confirmed cases of COVID-19 and over 7.05 million fatalities worldwide as of 23 June 2024 [5].
To curb the spread of SARS-CoV-2, the public health authorities of many countries introduced a series of strict non-pharmaceutical interventions (NPIs) early in the pandemic, such as social and physical distancing, contact tracing, self-isolation, border closures, and lockdown measures, among others [6]. However, over the long term, most non-pharmaceutical interventions are unsustainable because of their huge socioeconomic costs and negative effects on the mental health of affected populations [7]. A report by the International Monetary Fund (IMF) stated that the COVID-19 pandemic lockdown caused the most severe global recession since the Great Depression and that this led directly to millions losing their jobs [8]. The WHO reported that social isolation was mainly responsible for a 25% increase in anxiety and depression rates worldwide in the first year of the COVID-19 pandemic [9].
Widespread vaccination is seen as an effective way to prevent and control large-scale COVID-19 outbreaks that is more sustainable in the long term. Some COVID-19 vaccines were created, evaluated, and authorized at record speed with the collaborative efforts of pharmaceutical companies and academic institutions worldwide after the outbreak [10]. However, vaccine supply shortages were inevitable because of narrow production and logistical capacity, especially in the initial phases of the vaccine rollout [11]. An important conundrum facing policymakers was determining how best to allocate available vaccines in the context of limited resources to maximize the public health gains of vaccination [12].
It was a complex and challenging issue to determine the optimal resource allocation for scarce vaccines during the COVID-19 outbreak. On the one hand, compared with viruses in previous pandemics, SARS-CoV-2 shows some particular epidemiological characteristics in terms of its transmission in the population. For instance, several studies suggest that presymptomatic and asymptomatic infections play a significant role in the transmission of COVID-19 [13,14]. A more comprehensive understanding of the phenomenon of silent transmission occurring through human-to-human contact is imperative for public health authorities to cope with the spread of COVID-19. Furthermore, COVID-19 transmission exhibits significant group differences. Specifically, some differences in the risk factors among age groups could contribute to the heterogeneous spread of the SARS-CoV-2 virus. For example, older adults have been demonstrated to be more vulnerable to infection than children and adolescents [15,16], and younger persons with infections face a lower risk of becoming symptomatic than older persons with infections [17]. In addition, the risk of patients developing severe disease and the risk of death have also been shown to have similar age-specific characteristics [18,19].
On the other hand, most vaccines (including Oxford-AstraZeneca, Pfizer-BioNTech, and Moderna) authorized for emergency use in the first wave of vaccination campaigns require two doses given in tandem within a recommended interval. The vaccines can be further grouped into two classes with different physicochemical properties as follows: mRNA-based and viral-vector-based vaccines. Pfizer-BioNTech and Moderna vaccines are mRNA vaccines with a recommended dose interval of 3 to 8 and 4 to 8 weeks, respectively, while Oxford-AstraZeneca is an adenovirus vector vaccine administered over a recommended dose interval of 4 to 12 weeks [20,21,22]. Compared with a straightforward single-dose vaccination rollout, a two-dose vaccination regimen presents more intricate logistical challenges. The decision-making process involves determining how many doses to allocate to the first and second vaccine demands in each period and whether a second dose should be reserved for those who have already taken their first dose to prevent the failure of previous vaccine doses due to supply shortages. Furthermore, finding an optimal time interval between vaccine doses is another critical issue. A longer dose interval enables a larger number of individuals to be provided partial protection (induced by a single dose of a vaccine) in a comparatively short time. In contrast, a shorter dose interval implies that fewer individuals will obtain full protection (induced by two doses of the vaccine) more quickly [23]. Apart from that, vaccine hesitancy should also be considered in the decision-making process for vaccine allocation to ensure that all available resources are administered to those who genuinely need them [24].
Vaccine allocation for controlling infectious diseases has gathered considerable attention from academia in recent decades [25]. Most early studies mainly focused on the allocation of influenza vaccines [26,27,28,29]. COVID-19 exhibits several epidemiological features that are distinctly different from those of the influenza pandemic, such as children and adolescents having lower susceptibility to SARS-CoV-2 infection than older people [15,16], and the fatality risk of COVID-19 infection increases with age [30]. Hence, it is imperative to develop more targeted vaccine allocation policies to deal with the COVID-19 pandemic rather than simply mirroring the vaccine allocation strategies for influenza [16,31]. Guttieres et al. [32] proposed a flexible system-level modeling framework to guide vaccine deployment during the COVID-19 pandemic. Bolcato et al. [33] explored the application of the principle of equity in allocating scarce COVID-19 vaccine resources. However, these studies did not give a specific vaccine allocation strategy. Babus et al. [34] worked to address the priorities in COVID-19 vaccine allocation in groups of different ages and occupations. Their results suggested that age is a more critical infection risk factor than occupation, and it should be prioritized in COVID-19 vaccine allocation decisions. Bubar et al. [35] modeled COVID-19 transmission dynamics using an SEIR-type model and compared five age-stratified vaccine prioritization strategies in a limited-resource setting. The authors found that preferentially vaccinating adults aged 20 to 49 years can minimize the cumulative number of infections, while preferentially vaccinating older adults (older than 60 years) can minimize the cumulative number of deaths and years of life lost. Similar conclusions have been reported in the work of other investigators (see, e.g., Shim [36], Foy et al. [37], and Moore et al. [38]). In addition, studies by Han et al. [19] and Buckner et al. [16] showed that the dynamic allocation of vaccines to different age subgroups as the COVID-19 pandemic progressed according to different public health goals could generate substantial vaccination gains in terms of reducing infection, years of life lost, and deaths. Despite their valuable insights for managing vaccine resource allocation during the COVID-19 outbreak, these studies are based on the simplifying assumption that the vaccination course only involves the injection of a single dose of vaccine. However, most approved COVID-19 vaccines are given initially in a two-dose vaccination regimen [10]. A two-dose vaccination schedule is more complicated than a single-dose vaccination schedule, which was often overlooked in past studies.
Only a few researchers have investigated the vaccine resource allocation problem in a two-dose vaccination campaign with the limited availability of the COVID-19 vaccine. For instance, Matrajt et al. [39] paired a mathematical model with a derivative-free optimization algorithm to find the optimal vaccine allocation strategies of a single-dose vaccination campaign and mixed vaccination campaign in different pandemic scenarios. These scenarios were constructed based on different combinations of vaccine coverage, single-dose efficacy, and viral transmissibility. They found that the optimal vaccine allocation strongly depends on the level of single-dose efficacy. Zhu et al. [40] considered a vaccine allocation problem in a two-dose vaccination rollout for different age groups. The problem was formulated as a nonlinear programming model that aimed to minimize the cumulative number of deaths. Their results suggested that focusing on providing the first dose of vaccine to unvaccinated individuals might result in even larger vaccination gains compared with holding back second doses. Moreover, some studies were dedicated to exploring the impacts of different two-dose vaccine inventory control policies on the development of the COVID-19 pandemic [41,42], while another study was devoted to assessing the optimal dose interval [10]. It is worth noting that all the studies mentioned above focused on the allocation problem of a single vaccine type and ignored the reality that COVID-19 vaccination campaigns involve several vaccine types. Moreover, these studies assumed that all people who are eligible for a vaccine are willing to receive a vaccine, which is clearly unrealistic. The most relevant study to our work is by Miura et al. [43], who presented a data-driven approach to obtain a near-optimal vaccine allocation strategy given a public health goal. Their study, like ours, focused on the multi-type vaccine allocation problem; however, they considered only single-dose vaccine uptake to simplify this issue. To the best of our knowledge, our study is the first attempt to address the optimization problem of multi-period, multi-type vaccine resource allocation in a two-dose vaccination campaign for controlling the COVID-19 pandemic. In addition, we also explicitly take the impact of vaccine hesitancy into account.
In this work, we first develop a novel deterministic compartmental epidemiological model to characterize the dynamics of COVID-19 spread in the population. We extended an age-stratified susceptible, exposed, infectious, and recovered (SEIR) epidemiological model to incorporate a two-dose vaccination campaign. The proposed SEIR model classified the individuals with infection according to symptoms developed and their severity. Moreover, we also considered age differences in susceptibility to infection and risk factors of infection (e.g., the risks of symptomatic infections, developing severe disease, requiring ICU admission, and deaths). Next, we integrated the proposed compartmental model into a nonlinear programming (NLP) model to find the optimal allocation strategy that minimized the cumulative number of potential deaths due to the pandemic over the entire planning horizon, subject to supply capacity and vaccine hesitancy constraints. Then, we performed a case study based on real-world data from the initial mass vaccination campaign against COVID-19 in the Midlands, England, to demonstrate the feasibility and effectiveness of our proposed method. Afterward, we conducted an extensive sensitivity analysis of the key model parameters. Overall, our results provide valuable insights into the allocation of COVID-19 vaccine resources in a two-dose vaccination regimen.

2. Materials and Methods

In this section, we first present the compartmental epidemic model, followed by the notations and assumptions used to formulate it. Moreover, we introduce the detailed formulation of the proposed vaccine allocation optimization model.

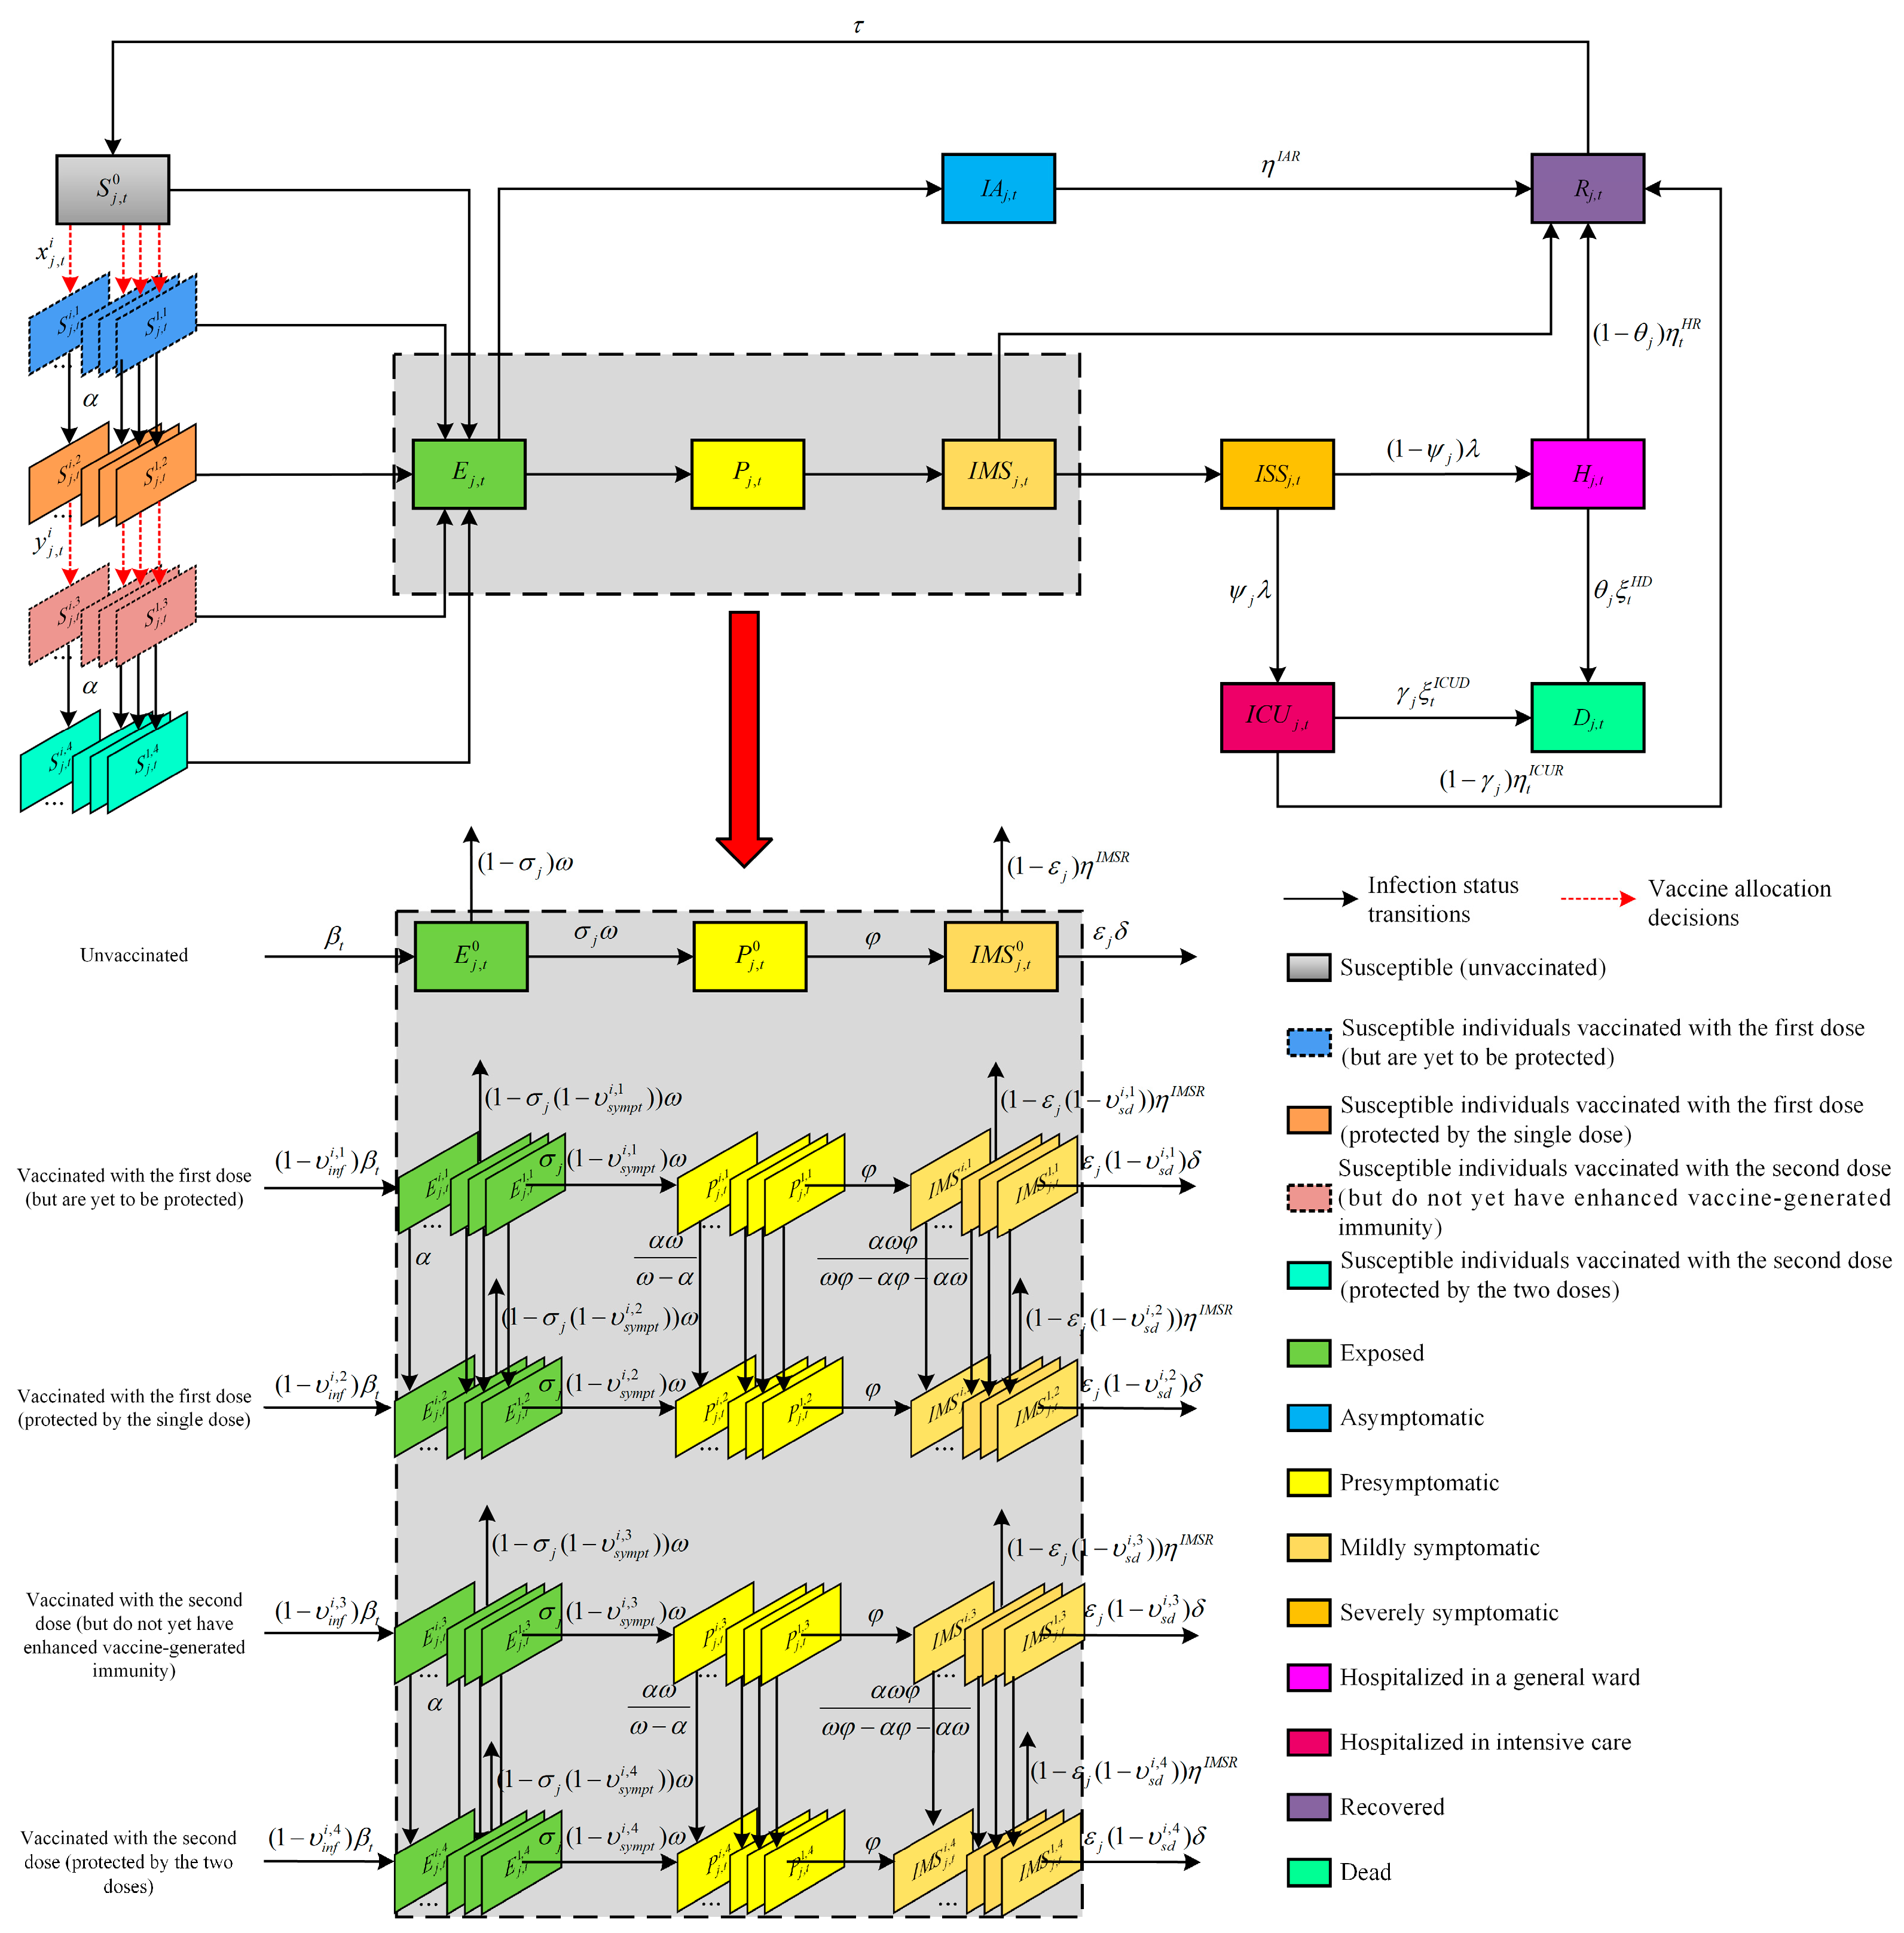
2.1. Compartmental Epidemic Model

We describe the evolution of the COVID-19 pandemic and the vaccine rollout dynamics with a discrete-time compartmental metapopulation model. The model structure is shown schematically in Figure 1, which depicts the transmission of the SARS-CoV-2 virus in a population stratified by age, vaccination status, and the vaccine types received by means of extending the classic SEIR model [44]. The whole population is separated into seventeen age groups (sixteen age groups of 5 years from 0 to 79 years and one age group for people aged 80 years or older). Then, each age group is partitioned into the following subgroups according to vaccination status:
(1)
Those who are unvaccinated;
(2)
Those who received the first dose but are yet to be protected;
(3)
Those who are protected by the single dose after they received the first dose;
(4)
Those who received the second dose but do not yet have enhanced vaccine-generated immunity;
(5)
Those who are protected by the two doses after they received the second dose. In addition, the vaccinated groups are further divided based on the type of vaccine that they received.
For each demographic group, the model tracks the following ten epidemiological states: susceptible (S), exposed (E), infectious and asymptomatic (IA), presymptomatic (P), infectious and mildly symptomatic (IMS), infectious and severely symptomatic (ISS), hospitalized in a general ward (H), hospitalized in intensive care (ICU), recovered (R), and dead (D). In Figure 1, the compartments indicate the corresponding infection and vaccination status of people with regard to COVID-19, and the arrows indicate the directions of transitions among different compartments, while the transition rates are annotated along the arrows. Notably, the figure shows only the vaccination status transition paths for S, E, P, and IMS for clarity and brevity. Evidently, the evolution of the individual states relies on infection status transitions or vaccine allocation decisions.
Figure 1. Diagram of the SARS-CoV-2 transmission model incorporating vaccination.
Systems 12 00286 g001
As a virus spreads in the population, susceptible individuals can become exposed to pathogens (infected but not yet infectious) via contact with infected persons. Subsequently, they develop as either asymptomatic or presymptomatic infectious individuals after a latent period of several days. All asymptomatic infectious individuals may recover naturally without treatment. In addition, presymptomatic infectious individuals subsequently develop into mildly symptomatic individuals. Moreover, a proportion of mildly symptomatic individuals is also able to recover naturally, as is the case for asymptomatic infectious individuals, while the remaining proportion develops into severely symptomatic individuals who require admission for therapy. Among them, some severely symptomatic individuals are admitted to a general ward, and the remainder are admitted to the ICU since they require mechanical ventilation and intensive nursing care. Lastly, hospitalized individuals either recover after adequate treatment or die because of worsening conditions. It is worth noting that the immunity derived from natural infection in recovered individuals wanes over time, and they eventually return to the susceptible state.
On the other hand, the vaccination status of individuals depends on vaccine allocation decisions. If vaccine resources are available, they can be used to meet the demands for the first or second dose of the vaccine. Notably, a time delay exists between vaccination and when dose-specific protection is gained since the vaccine does not take effect immediately after each vaccination. In addition, the same type of vaccine needs to be administered sequentially for vaccination candidates, and the second dose needs to be given within a recommended time window to achieve the optimal protective efficacy of the vaccine. In this study, we accounted for multiple leaky vaccines (that is, vaccines that offer only partial protection in all vaccinees) that reduce the probability of acquiring infection, developing symptoms upon infection, and developing severe symptoms requiring hospitalization.

2.2. Model Notations

For ease of presentation, we provide a summary of the notations used throughout this article in Table S1.

2.3. Model Assumptions

The transmission of the SARS-CoV-2 virus in human hosts is a highly complex process. To simplify the problem, we make the following assumptions:
  • Firstly, we assume that the population is homogeneously mixed. We do not consider natural births and deaths since the duration of the outbreak is much shorter than the human life expectancy [17]. Additionally, we also do not consider the population flow from region to region, i.e., the population size is constant within each public health region, which is judged to be a reasonable assumption over a short-term time horizon [45].
  • Secondly, we assume that severely symptomatic individuals requiring hospitalization are either admitted to a general ward or an ICU, and patients cannot be transferred between the two. As in previous work (Moghadas et al. [46] and Zhu et al. [40]), we assume that all severely symptomatic individuals who are not hospitalized voluntarily undertake self-quarantine and, thus, do not transmit the virus to others. Moreover, once they are admitted, individuals are assumed to no longer be infectious because personnel and visitors who have contact with them are strictly required to adopt personal protective measures. Similar to the work of Hogan et al. [47], we assume that all infection-related deaths occur during hospitalization.
  • Thirdly, we make the simplifying assumption that only susceptible individuals are eligible for vaccination (a similar assumption can be found in Yang et al. [15] and Han et al. [19]). In addition, vaccinated and unvaccinated individuals with SARS-CoV-2 infection are assumed to be equally infectious. We also assume that everyone who receives the first dose also receives the second dose of the vaccine.
  • Lastly, the proposed model considers a continuous relaxation of the state and decision variables to make the problem computationally tractable [48]. This is a common assumption in studies aiming at optimizing infectious disease interventions, and this relaxation of the integer variables has been shown to guarantee a high-quality result [45].

2.4. Mathematical Formulation

This section formulates the multi-type vaccine resource allocation problem in a two-dose vaccination campaign as a non-linear programming model using the abovementioned notations and assumptions.
Objective function. The objective function (see Equation (1)) minimizes the total expected number of deaths in all age groups over the entire planning horizon, which consists of (i) the expected number of deaths that occur in general wards and (ii) the expected number of deaths that occur in ICUs.
min t T j J θ j ξ t H D H j , t + γ j ξ t I C U D I C U j , t
Constraints on pandemic transmission dynamics. We introduce constraints on pandemic transmission dynamics to depict the transitions among different epidemiological states shown in Figure 1. Detailed formulas are provided in Equations (S1)–(S11) in the Supplementary Materials.
Vaccine resource allocation constraints. Here, we propose resource allocation constraints (2)–(8) concerning logistics and operations management for the limited vaccine resources.
j J x j , t i + y j , t i C t i ,       i I , t T
C t + 1 i = B t + 1 i + C t i j J x j , t i + y j , t i ,       i I , t T  
i I x j , t i S j , t 0 ,       j J , t T  
t T i I x j , t i N j 1 μ ,       j J  
ς i n t e r v a l i , L z i ς i n t e r v a l i , U ,       i I  
y j , t i = α α z i 1 S j , t i , 2 ,       i I , j J , t T  
x j , t i = 0 , y j , t i = 0 ,       i I , j 1,2 , 3 , t T
Constraint (2) guarantees that the total number of vaccines of type i for the first and second doses allocated to individuals does not exceed the total number of vaccines of type i available during period t . Constraint (3) denotes that the total number of vaccines of type i available during period t + 1 is equal to the manufacturer’s type i vaccine capacity during period t + 1 plus the number of unutilized type i vaccines during period t . Constraint (4) ensures that the number of vaccines allocated to first-dose recipients in age group j is no more than the number of unvaccinated susceptible individuals in age group j during period t . Constraint (5) indicates that the total number of vaccines allocated to first-dose recipients in age group j over the planning horizon is less than or equal to the number of individuals in age group j who are willing to be vaccinated. Constraint (6) indicates that the second vaccine dose must be given within the indicated time window after giving the first dose. Constraint (7) represents the number of type i vaccines for the second dose allocated to individuals in age group j during period t . Constraint (8) describes the age limit for COVID-19 vaccination, as most candidate vaccines were only authorized for emergency use in people aged 15 years and older during the initial vaccination campaign [49].
Nonnegativity constraints. Constraint (9) indicates that the state and decision variables should be non-negative.
All   state   and   decision   variables   are   continuous   and   nonnegative ,       i I , j J , k K , t T
Lastly, it is worth noting that constraints (S2a)–(S3e) in the Supplementary Materials and constraint (7) are nonconvex and nonlinear because they include bilinear terms. Hence, the considered problem is formulated as a nonlinear programming model.

3. Results

We present a case study to investigate the applicability and performance of the optimization model introduced in Section 2. The first COVID-19 cases in England were confirmed on 31 January 2020 after the causative agent of COVID-19 was first recognized in December 2019. After that, the number of new cases increased exponentially, and the country soon emerged as one of the most severely affected by the COVID-19 outbreak. As in many countries, the United Kingdom (UK) government used drastic non-pharmaceutical interventions to limit the early transmission of the virus, such as lockdowns, border closures, and social distancing measures. However, implementing these interventions resulted in enormous economic losses for society and seriously affected people’s daily lives. In response to this outbreak, some vaccines against COVID-19 were created at a phenomenal pace, and a nationwide mass vaccination campaign was begun in England on 8 December 2020 [18]. England is divided into seven National Health Service (NHS) regions by NHS England. Here, we take the Midlands, England, as our case study area, as this is the most populated NHS region in England. In this study, we primarily focused on applying the proposed model to optimally allocate the available vaccine resources among the different age groups in the region. All our experiments were executed on a desktop PC running Ubuntu 20.04 equipped with a 1.8 GHz Intel Core i7-10510U 8-core CPU and 32 GB RAM. To parse the NLP model, we used the JuMP [50] modeling language in Julia 1.7, while the solution was provided by the NLP solver Interior Point Optimizer (IPOPT) [51] configured with the parallel linear solver MA97 from the Harwell Subroutine Library (HSL) [52].
In the following sections, we first introduce the data sources applied to the case study. Then, we present the validation results of our model based on actual epidemiological data. Finally, we perform a comparative study to assess the performance of the obtained optimal vaccine allocation strategy.

3.1. Data Sources

The data used in our case study consisted of disease transition parameters, the initial conditions of the epidemic, population size, and vaccine effectiveness data. Tables S2 and S3 summarize the main disease transition parameters derived from the published literature or publicly available reports. An age-structured contact matrix is shown in Table S4; this was obtained from the POLYMOD survey for the UK with regard to the contacts relevant for infectious disease transmission by age [53]. Notably, we scaled this contact matrix according to population data, making it more suitable for this study. Moreover, β t characterizes the changes in transmission efficiency over time due to changes in interventions. In our work, the data were extracted from the work of Sonabend et al. [18], who explored the key drivers contributing to the transmission of SARS-CoV-2 in each NHS region in England.
We performed a case study on the initial mass vaccine rollout in the Midlands, England, for a total period of 25 weeks, with a planning horizon from 8 December 2020 to 30 May 2021, when people were experiencing the second wave of the COVID-19 pandemic in the UK. We set the initial condition for the total number of individuals in the infected compartment to 1.21% of the population of the Midlands, England; this was drawn from a COVID-19 community infection survey from 6 December 2020 to 12 December 2020 conducted by the UK’s Office for National Statistics (ONS) [54]. Afterward, the initial condition for the total number of individuals in the infected compartment was multiplied by the proportion of initially infected individuals in each age group (see Table S5, data from the GOV.UK website [55]); we obtained the initial conditions for the number of individuals in the infected compartment in each age group. It was easy to derive the initial conditions for the number of individuals in the severely symptomatic compartments using the daily newly admitted patient data on 9 December 2020, which were publicly available on the GOV.UK website [55]. Furthermore, we hypothesized that the number of remaining initially infected individuals was uniformly distributed among other infection types.
Likewise, we set the initial condition for the total number of individuals in the recovered compartment to 9.03% of the population of the Midlands, England; this number was derived from an ONS survey on antibodies against SARS-CoV-2 at the beginning of December 2020 [56]. Subsequently, we obtained the initial conditions for the number of individuals in the recovered compartment in each age group by multiplying the initial condition for the total number of individuals in the recovered compartment by the proportion of initially recovered individuals in each age group (see Table S5) according to Molla et al. [57]. In addition, we extracted the initial conditions for the total number of individuals in the hospitalized cases admitted to general wards, hospitalized cases admitted to ICUs, and dead compartments from the UK coronavirus data on 8 December 2020, which were available on the GOV.UK website [55]. Similarly, we obtained the initial conditions of these three compartments in each age group according to the corresponding initial proportion in each age group (see Table S5). The size of the population of the Midlands of England, according to the ONS, is listed in Table S5 [58]. Moreover, we subtracted the initial conditions for the numbers of individuals in the infected compartment, hospitalized cases admitted to general wards, hospitalized cases admitted to the ICUs, recovered compartment, and dead compartment from the population size to derive the initial conditions for the number of individuals in the susceptible compartment.
Finally, in the UK, the Pfizer–BioNTech COVID-19 vaccine first received authorization for emergency use on 2 December 2020, followed by the AstraZeneca vaccine on 20 December 2020 and the Moderna vaccine on 8 January 2021. We summarize the vaccine efficacy of these three types of vaccines in Table S6; the data were obtained from the published literature.

3.2. Model Validation

This model was validated with actual epidemiological data from the Midlands, England, and it was shown that it could accurately track the trajectory of the outbreak of COVID-19 with a given parameter setting. Specifically, the actual numbers of vaccines allocated in the Midlands, England, from 8 December 2020 to 30 May 2021 were adopted and used as the model input. Thus, the model could be solved with fixed values of the decision variables based on actual vaccination data. We present the estimated cumulative number of deaths, hospital admissions, and hospital bed occupancy on these days and compare them with the actual outbreak data from the GOV.UK website [55].
A visual comparison between the model results (solid line, deep pink triangles) and the actual epidemiological data (solid line, black squares) over the entire planning horizon is shown in Figure 2. The results suggested that our model could closely reproduce the COVID-19 pandemic in the Midlands, England. Furthermore, we also evaluated the performance of this model with three common statistical error metrics, namely, the mean absolute percent error weighted (wMAPE), normalized root mean squared error (nRMSE), and explained variance. As shown in Table 1, both the wMAPE and nRMSE were very low. Moreover, the model also explained a significant proportion of variance (approaching 1) in the cumulative number of deaths, hospital admissions, and hospital bed occupancy, respectively. These results indicated that our model was reliable and able to capture the evolution of the epidemic correctly.

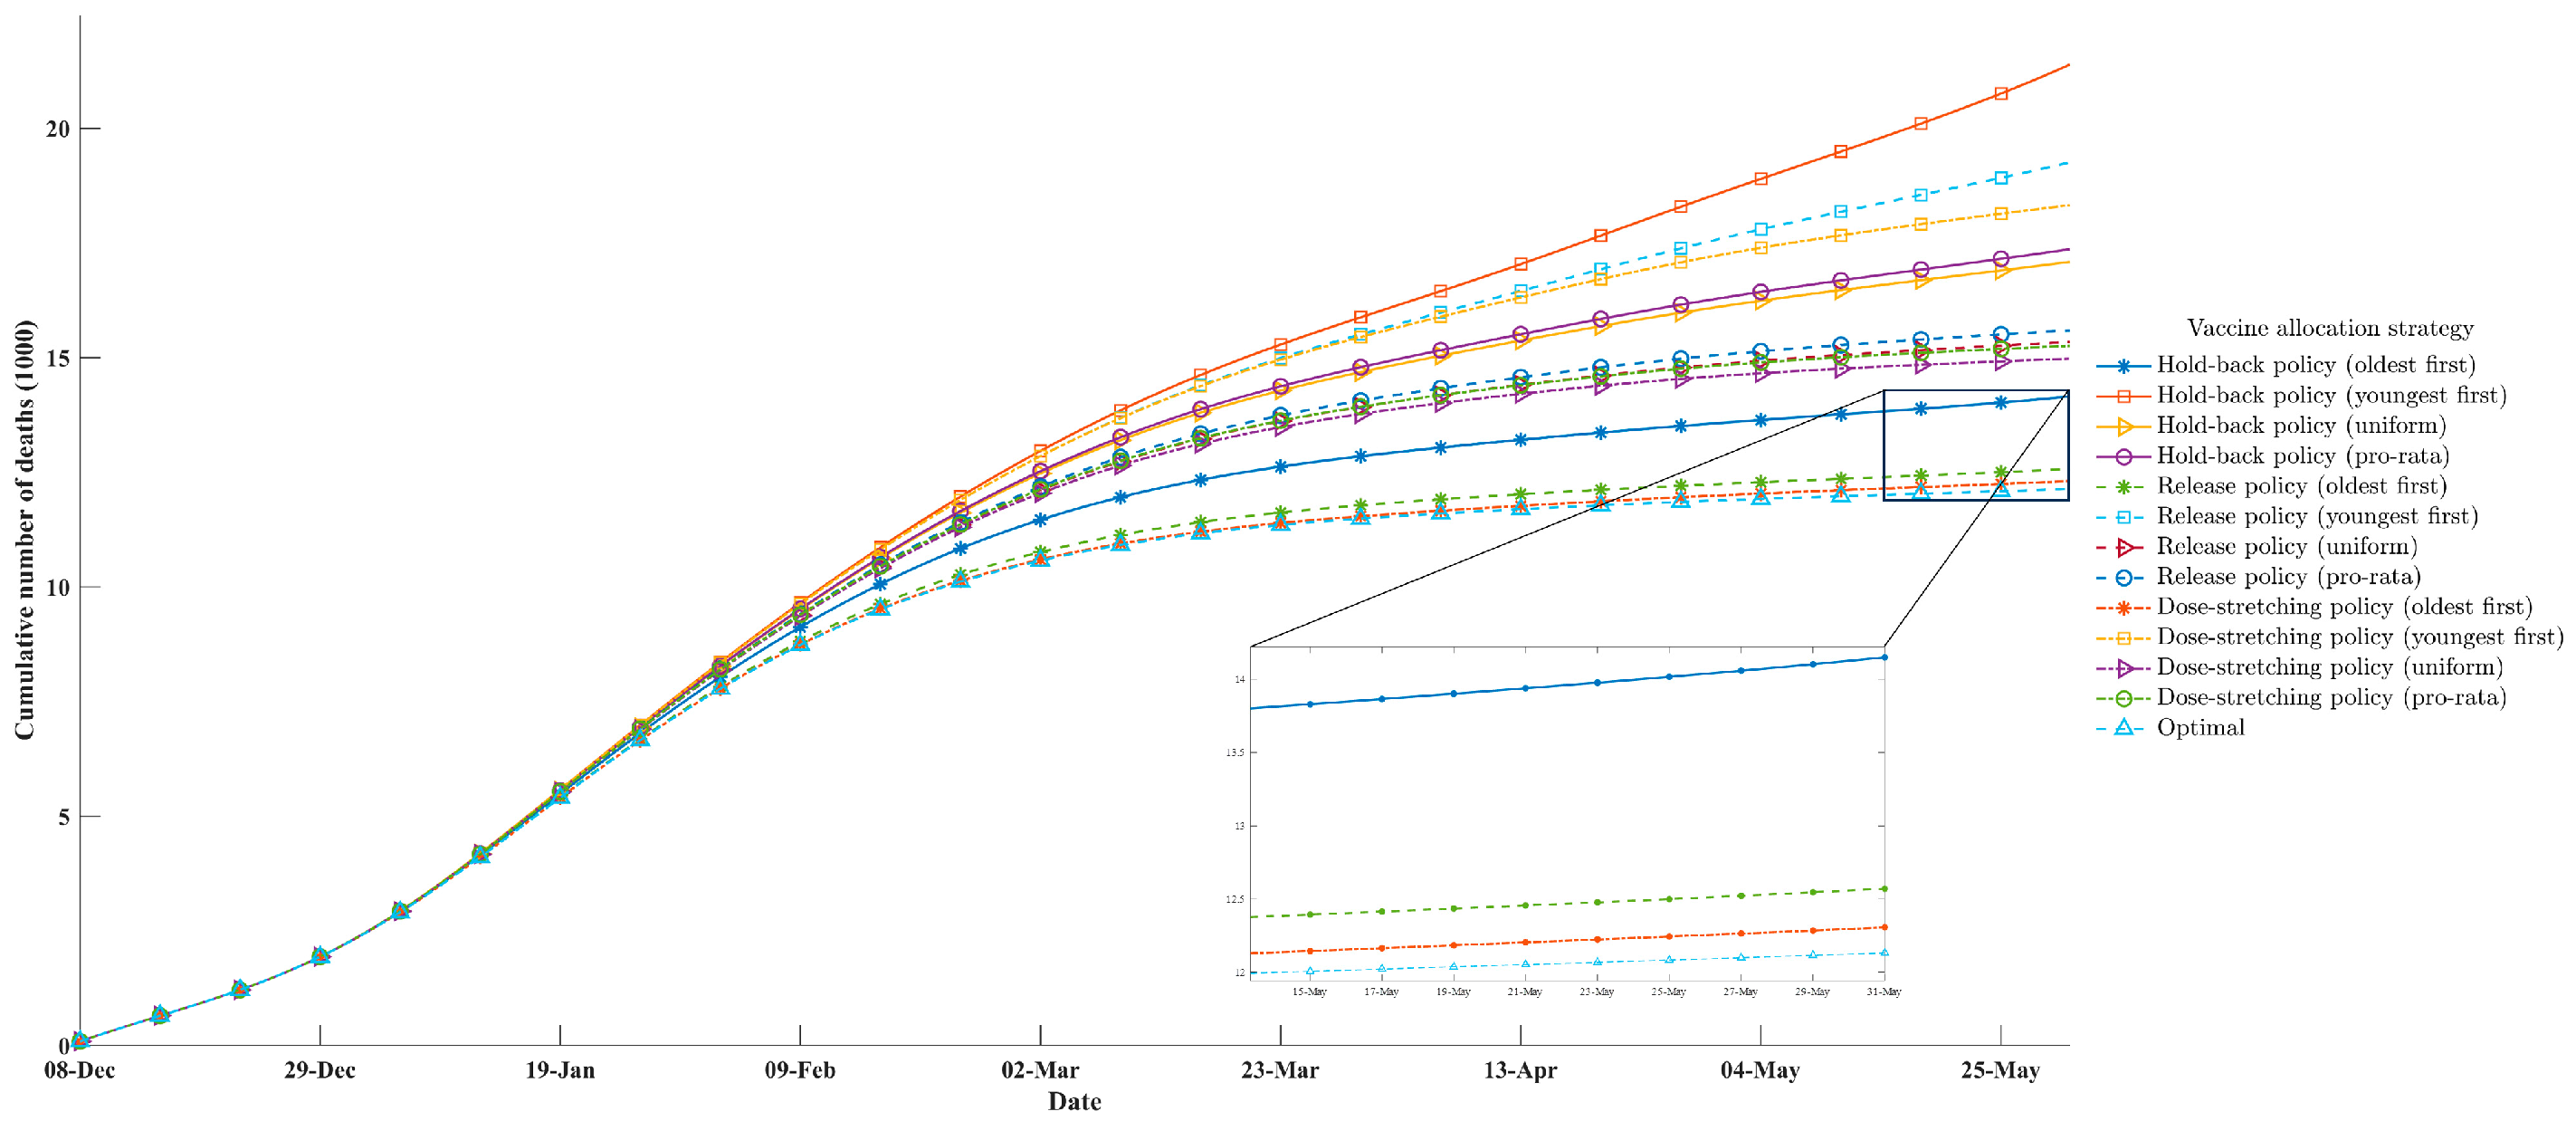
3.3. Comparative Studies

In this subsection, we compare our obtained optimal allocation strategy against twelve alternative allocation strategies generated by combining different vaccine prioritization schemes and two-dose vaccination rollout policies.
(a) Vaccine prioritization schemes
We considered four different age-based vaccine prioritization schemes. Notably, we assumed that vaccines were allocated to the previous age group first in the following order: first, Pfizer–BioNTech, then AstraZeneca, and lastly, Moderna when the allocation group needed to be switched from one age group to another; then, the remaining vaccines were allocated to the next age group. The prioritization schemes are described as follows:
  • Oldest first: Prioritization of the allocation of vaccines to the oldest group and then to younger groups in decreasing order of age.
  • Youngest first: Prioritization of the allocation of vaccines to the youngest groups and then to older groups in increasing order of age.
  • Pro-rata: The vaccines were allocated according to the population proportion within each age group.
  • Uniform: The vaccines were uniformly allocated to each age group.
(b) Two-dose vaccination rollout policies
In addition, we considered three two-dose vaccination rollout policies that were implemented in the real world as follows:
  • Hold-back policy: The United States initially implemented a two-dose vaccination rollout policy under the Trump administration [59]. One additional vaccine dose was immediately put into storage when an individual received the first dose, and it was given to them once they returned to receive the second dose.
  • Release policy: In the other two-dose vaccination rollout policy that then-President Joe Biden declared, the United States increased the release speeds of the available vaccine resources starting on 8 January 2021, which replaced the original hold-back policy [60]. In brief, all available vaccine resources in each period were used as either first doses for individuals with primary vaccinations or second doses for revaccinated individuals. Furthermore, the release policy stated that the available vaccine resources were to be first given to returning individuals who were eligible for their second dose. After that, all the remaining unused doses were given to individuals with a primary vaccination.
  • Dose-stretching policy: The UK was the first country in the world to pursue this two-dose vaccination rollout policy [18]. The dose-stretching policy was similar to the release policy but extended the interval between the two doses of COVID-19 vaccines. Specifically, this vaccination rollout policy did not immediately provide a dose of vaccine for a recipient eligible to receive their second dose but delayed the administration of the second dose to provide the first dose to more individuals on the premise of guaranteeing the efficacy of the vaccines.
In Figure 3, we observe that the deaths due to COVID-19 did not vary significantly among the various vaccine allocation strategies early in the experiment because the UK government initiated a third nationwide lockdown in response to the rapid spread of COVID-19 on 5 January 2021. In this stage, non-pharmacological intervention was the main factor influencing COVID-19 transmission. However, with the gradual lifting of the third nationwide lockdown after March 2021, differences among the cumulative numbers of deaths in the different allocation strategies became apparent. As shown in Figure 3, our optimal allocation strategy was better than all twelve alternative strategies regarding the number of lives saved. The outcome from the dose-stretching policy (oldest first) aligned most closely with the optimal allocation strategy that we obtained, followed closely by the release policy (oldest first), while the hold-back policy (youngest first) yielded the worst results. In addition, with the same two-dose vaccination rollout policy, we observed that prioritizing older adults for vaccination was the best scheme, followed by the uniform and pro-rata schemes; the prioritization of young adults for vaccination was the worst-performer scheme. The experimental results indicated that prioritizing high-risk populations in vaccine promotion may allow more COVID-19 deaths to be averted.
In addition, we further compared our optimal policy with the actual policy and non-vaccination policy. The comparative results for these three policies are provided in Table 2. The table shows that our optimal policy avoided about 300 deaths compared with the actual policy and provided a 71.5% reduction in deaths compared with the counterfactual scenario of no vaccination.

4. Discussion

In this section, we conduct an extensive sensitivity analysis on several critical model parameters and extract some insights.

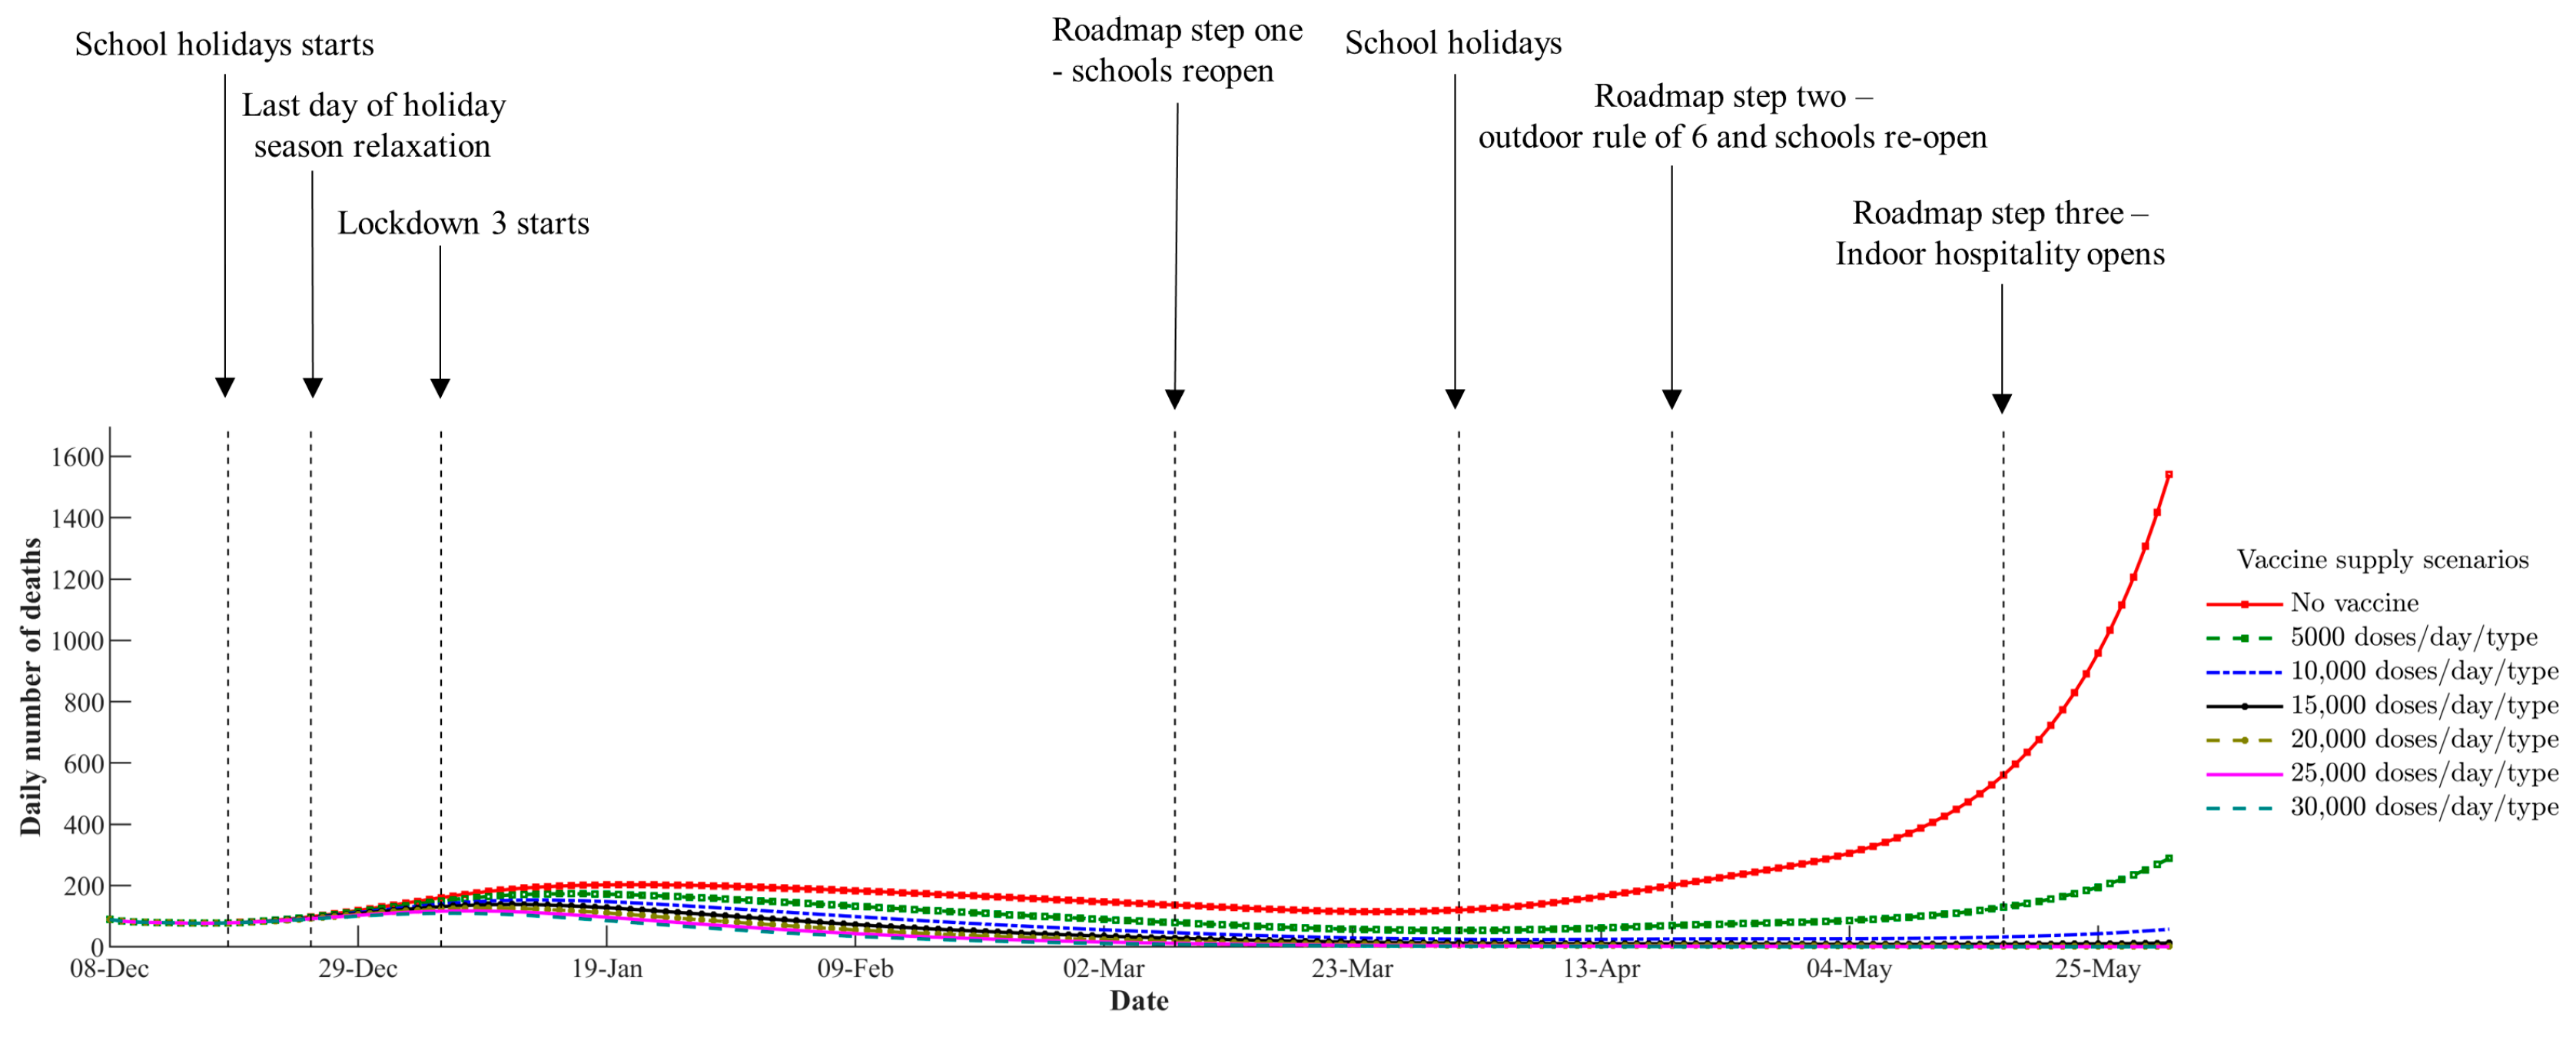
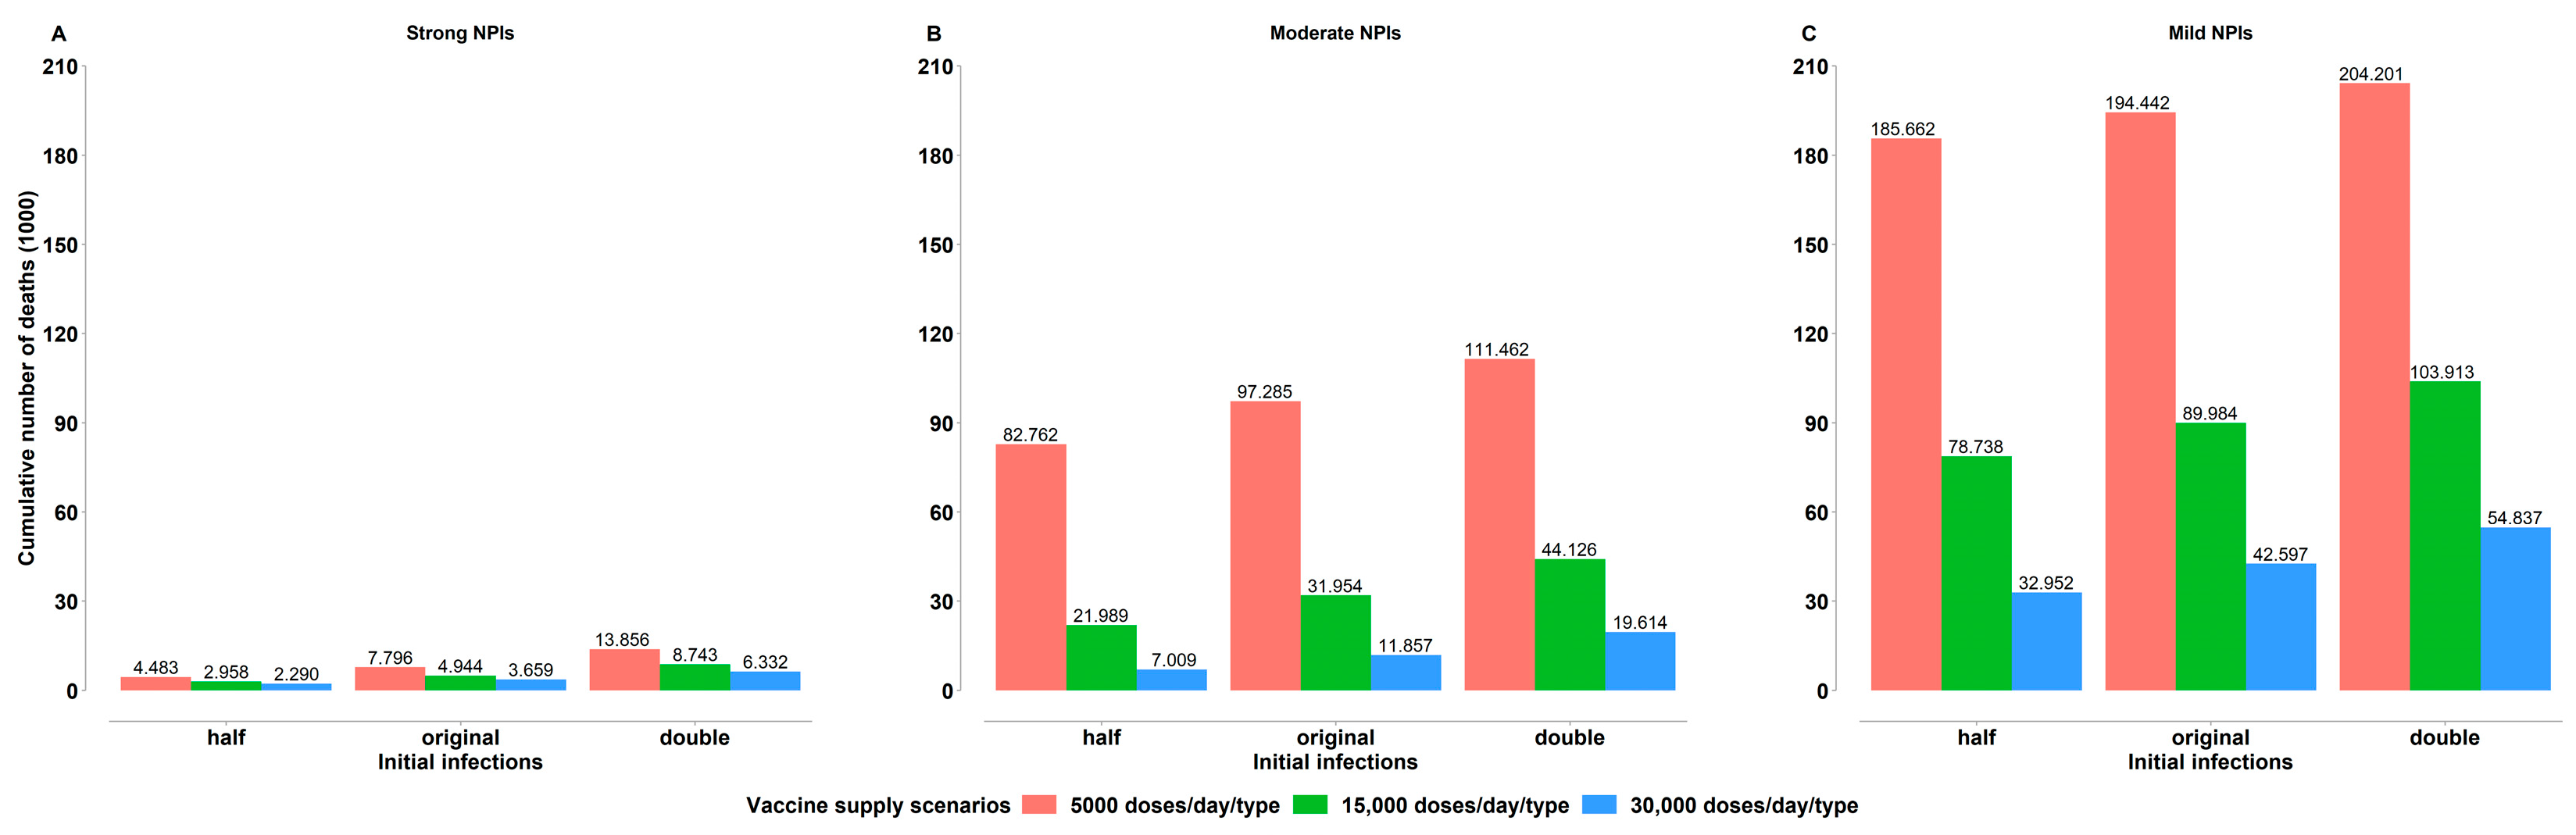
4.1. Impact of Vaccine Supply Levels

Here, we investigated the impact of vaccine supply levels on allocation decisions and the control of the outbreak. Specifically, we analyzed the optimal allocation strategies for seven vaccine supply levels as follows: no vaccine and 5000, 10,000, 15,000, 20,000, 25,000, and 30,000 doses per day of each vaccine type available to be allocated among all age groups. For a clear explanation, we only show the age-specific vaccine coverage over time for β t i = 15,000 doses in the main text (Figure 4), and the remaining outcomes can be found in Figures S1–S5. Similar to the results in the previous section, we found that prioritizing the elderly for vaccination and gradually expanding from older to younger age groups remained the most effective way to minimize deaths in all supply scenarios. Furthermore, we also observed that the optimal time intervals between the first and second doses for these three vaccines were 84, 56, and 56, respectively, indicating that a dose-stretching two-dose vaccination rollout policy should be implemented under these scenarios, thus resulting in more recipients having access to first doses.
Figure 5 illustrates the differences in the curves of the daily numbers of deaths with varying vaccine supplies. The black vertical dashed lines indicate the time points of significant announcements and changes in the COVID-19-related public intervention policies that occurred. Obviously, vaccination played a positive role in responding to COVID-19, even at low vaccine supply levels. As shown in Figure 5, we observed that a new wave of the outbreak occurred in the Midlands, England, when the UK government announced the lifting of the second national lockdown on 2 December 2020. Soon after that, the UK government implemented a third national lockdown on 5 January 2021 in response to the diffusion of this epidemic wave. We found that the epidemic was effectively controlled with strong non-pharmaceutical interventions, even without vaccination. However, apparent discrepancies in the daily number of deaths began to appear as the lockdown was gradually loosened after 8 March 2021. A resurgence of the epidemic occurred, and the number of SARS-CoV-2 deaths continued to grow exponentially in the absence of vaccination. Moreover, we observed that the premature widespread relaxation of non-pharmaceutical interventions could also result in a non-negligible increase in deaths in a low vaccine supply scenario (below 5000 doses per day for each vaccine type). Our results indicate that proper non-pharmaceutical interventions are necessary during vaccine rollout, especially in a low vaccine supply scenario, to avoid jeopardizing the public health benefits brought by vaccination in the short term because of premature relaxation.
Lastly, we compared the cumulative number of COVID-19 deaths over the planning horizon with varying vaccine supplies (see Figure 6A). As expected, higher levels of vaccine supply would result in adverting considerably more COVID-19-related deaths. As shown in Figure 6B, we also observed that the decline in fatalities became less significant when the number of vaccines available per day became very large. Indeed, this would be anticipated because the diminishing marginal effect of vaccination showed a downward trend as vaccine-driven immunity was built up in the population. In addition, we also compared the performance of different allocation strategies with varying vaccine supplies. The results of the experiment are summarized in Table S7. We obtained a similar conclusion to that discussed in the previous section, so it will not be repeated here (see Section 3.3).

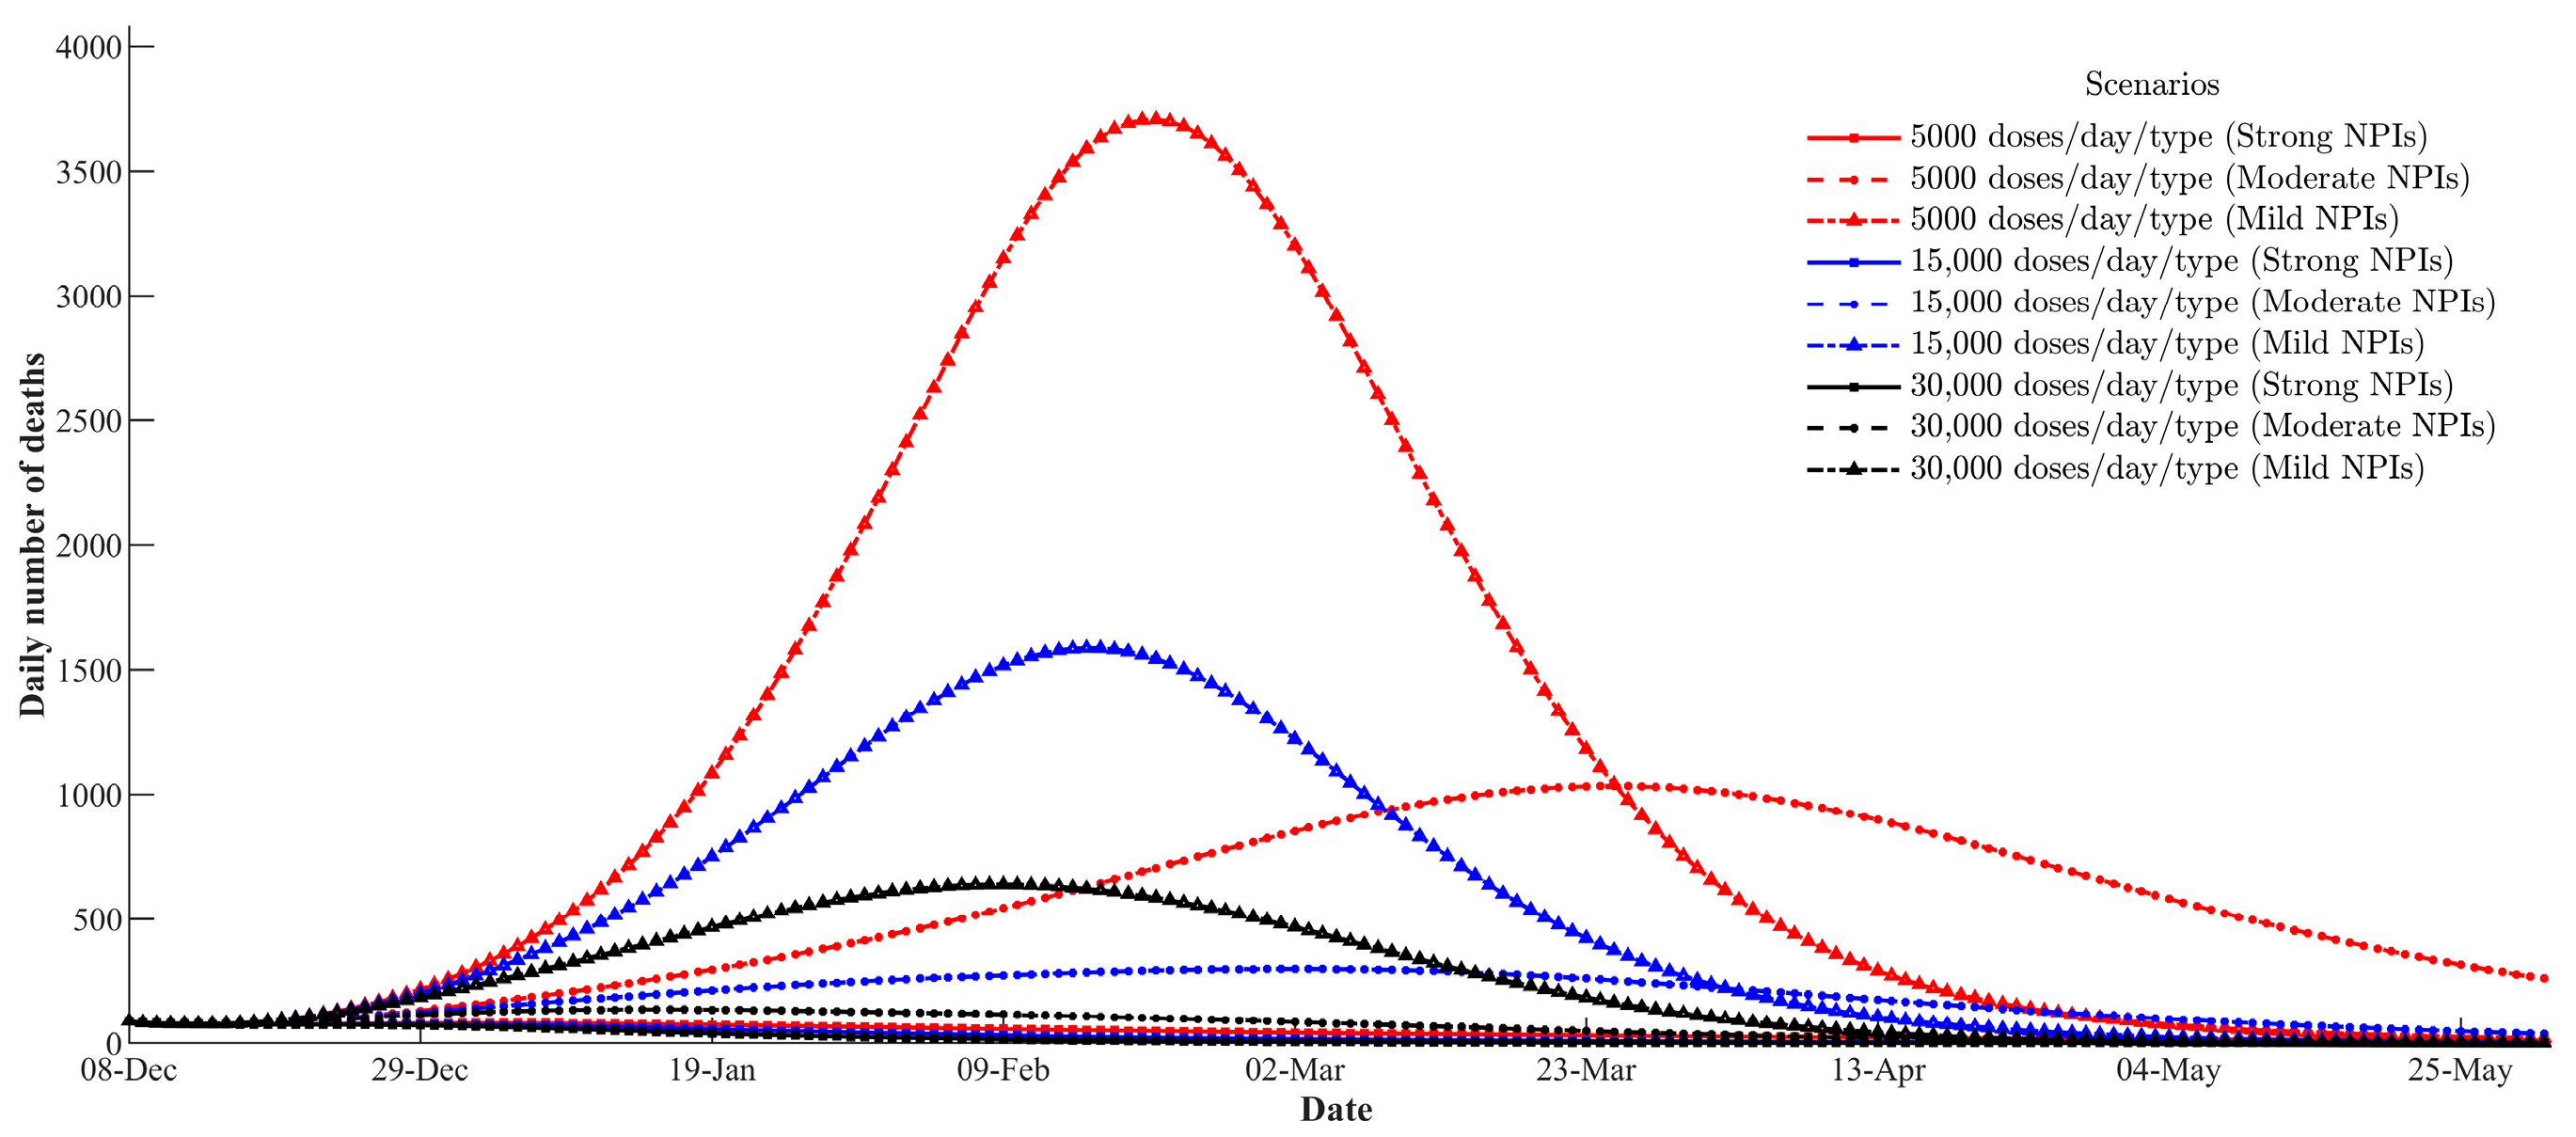
4.2. Impact of Non-Pharmaceutical Interventions

Here, we further analyzed the impact of imposing non-pharmaceutical interventions of varying intensity on the allocation decisions and the number of deaths. Three different counterfactual scenarios were considered regarding the NPIs implemented with different degrees of intensity as follows: strong NPIs, moderate NPIs, and mild NPIs. To simulate the effects of implementing different non-pharmaceutical interventions, we modeled their effects with the help of three major change points in the transmission rate in the real-world scenario. In particular, we used the instantaneous transmission rate on 5 January 2021 to represent the change in social behavior due to strong non-pharmaceutical interventions because the UK government initiated a third nationwide lockdown at that time. For the second change point, we chose the instantaneous transmission rate on 1 April 2021 to represent the change in social behavior due to moderate non-pharmaceutical interventions because most schools started their holidays, and step three of the roadmap for easing lockdown restrictions had not yet been undertaken at that time. For the third change point, we used the instantaneous transmission rate on 17 May 2021 to represent the change in social behavior due to mild non-pharmaceutical interventions because the last step of the roadmap for easing lockdown restrictions was implemented at that time. Furthermore, for the different degrees of interventions, we solved for the three levels of vaccine supply considered in the previous section, namely, 5000, 15,000, and 30,000 doses per day for each vaccine type.
As seen in Figures S6–S14, optimal vaccine allocation strategies for minimizing deaths were always administered first to older adults with a higher risk of death in all the above scenarios. For the three scenarios of vaccination that started under mild NPIs, the number of daily new deaths rose quickly, with an apparent epidemic peak during the studied horizon, irrespective of the vaccine supply level, as shown in Figure 7. Suffice it to say that the vaccine alone was insufficient to control the pandemic completely in a short time, implying that appropriate non-pharmacological interventions remained important during the initial vaccine rollout. In addition, we noticed that implementing stronger interventions during the initial vaccine rollout not only caused a substantial decrease in total deaths but also reduced the peak level of the deaths and delayed their occurrence, especially at the low level of vaccine supply.
Furthermore, we found that the optimal time interval between the first and second doses for the three types of vaccines in the scenario with 30,000 doses per day of each vaccine type and mild NPIs were 84, 25.5, and 56, respectively; the administration of the second dose of the Pfizer–BioNTech vaccine was no longer as delayed as possible. This result is reasonable because mild NPIs and high vaccine supply levels resulted in substantial infection-induced and vaccine-induced immunity. Thus, the number of people eligible for vaccination decreased over time, providing the optimal solution for the Pfizer–BioNTech vaccine, which had lower relative efficacy of the first dose; there could be a tendency to provide second doses more quickly, thereby improving the overall vaccination campaign’s efficiency.

4.3. Impact of the Initial Infections

In this subsection, we investigate the impact of initial infections on the optimal allocation strategies. We repeated the analytic process assuming that the initial infections were set to half or twice those in the actual epidemic situation. In Figure 8, we compare the cumulative number of deaths with the different vaccine supplies, NPIs, and initial infection magnitudes. As anticipated, the results confirmed that larger initial outbreak sizes for the same level of vaccine supply and NPIs gave rise to a higher number of deaths. Figure 9 illustrates the proportion of deaths averted compared with the no-vaccination scenario with different vaccine supplies, NPIs, and magnitudes of initial infections. It was seen that the proportion of deaths averted compared with the no-vaccination scenario was always the highest when implementing moderate NPIs for the same level of vaccine supply and initial infection magnitude. This was because, on the one hand, compared with vaccination, strict NPIs had a more significant impact on the development of the epidemic. On the other hand, more individuals were infected earlier with this virus, which reduced the overall impact of the vaccination program to a certain extent when the widespread relaxation of NPIs was adopted.
Moreover, the optimal allocation strategies were very similar irrespective of the initial infections, and it was always optimal to protect older age groups directly when minimizing deaths (see Figures S15 and S16). Remarkably, we found that the optimal allocation strategies tended to extend the time intervals between the first and second doses of the Pfizer–BioNTech vaccine in the scenario with 30,000 doses per day for each vaccine type and mild NPIs when facing more severe initial outbreak sizes, as shown in Figure S17. This finding may have been due to more severe initial outbreak sizes implying an earlier epidemic peak, and delays in administering the second doses of the Pfizer–BioNTech vaccine could increase access to the first doses of the Pfizer–BioNTech vaccine for more recipients during the peak phase of the epidemic, thus providing a greater vaccination benefit. Finally, we also compared the performance of different allocation strategies when using varying vaccine supplies, various NPIs, and different magnitudes of initial infections at the start of the vaccination rollout. The results of this comparative analysis are summarized in Table S8, and the comparison’s results are consistent with the previously obtained results described in Section 3.3.

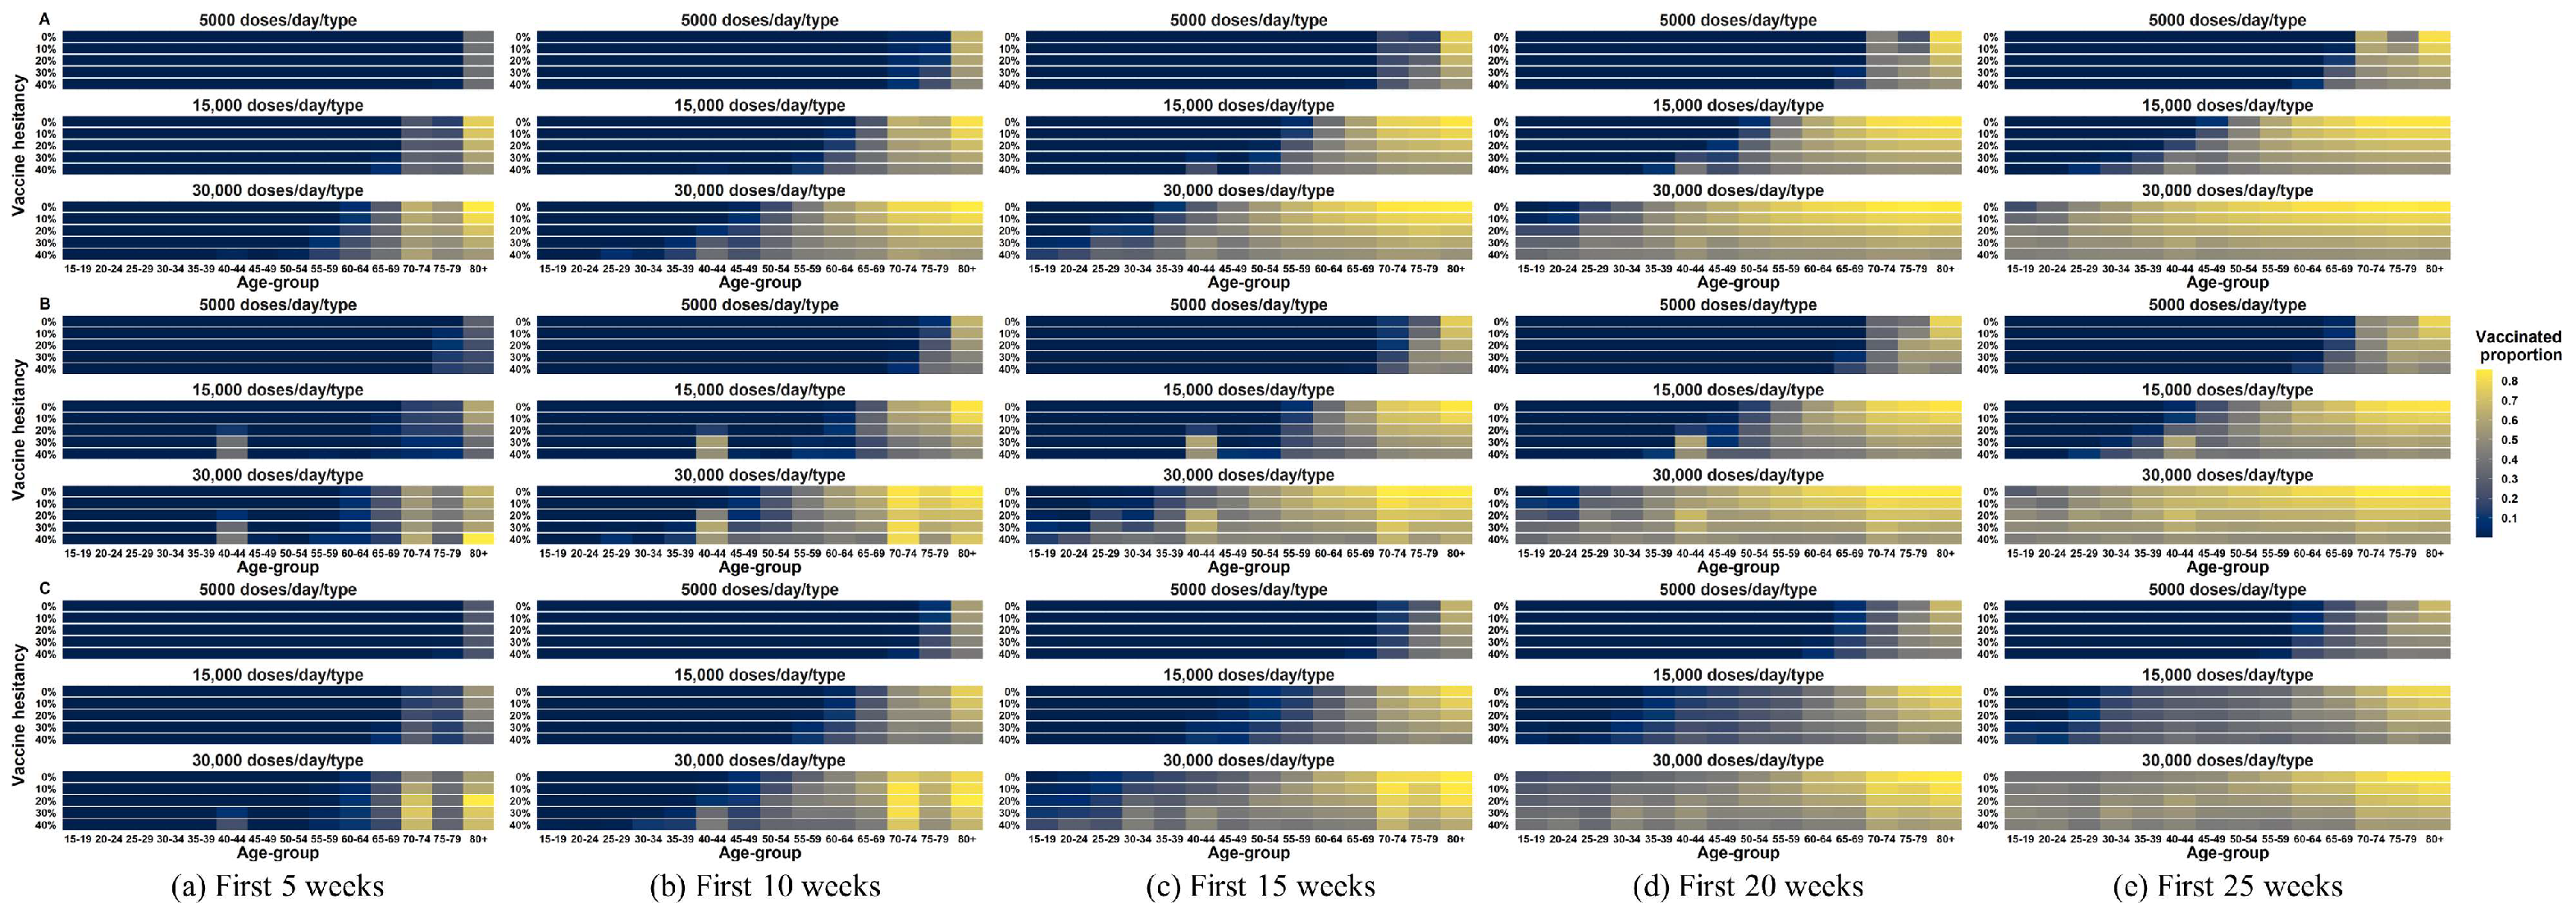
4.4. Impact of Vaccine Hesitancy

For a variety of reasons, a proportion of individuals might be hesitant to receive COVID-19 vaccination. Here, we explored the optimal allocation strategies for five different levels of vaccine hesitancy as follows: 0%, 10%, 20%, 30%, and 40%. As expected, a higher level of vaccine hesitancy could lead to poorer outcomes regarding averted deaths. However, this difference was not as apparent in scenarios with a low vaccine supply level, as seen in Figures S18, S19, S21, S22, S26, and S27. This was because the number of doses allocated in the scenarios with a low vaccine supply level was not high enough to make the level of vaccine hesitancy considered significant. Figure 10 and Figure 11 show the proportions of individuals who received the first dose (second dose) of the vaccine in each age group after 5 weeks, 10 weeks, 15 weeks, 20 weeks, and 25 weeks when initial infections were set to those in the actual epidemic situation when using varying vaccine supplies, various NPIs, and different vaccine hesitancy levels. In Figure 10 and Figure 11, we can observe that the priority was always allocated to older adults, regardless of vaccine hesitancy levels. The same conclusion can also be drawn from the other two scenarios involving different magnitudes of initial infections (see Figures S23, S24, S28, and S29).
Moreover, the change in the vaccine hesitancy level indicated a change in the number of people eligible for vaccination. As a result, the optimal solution for the Pfizer–BioNTech vaccine, which had a lower relative efficacy of the first dose, tended toward a faster provision of the second doses, rather than delaying them, in a few of the scenarios with high vaccine supply levels and high vaccine hesitancy levels (see Figures S20, S25, and S30). Similarly, we performed comparative studies to assess the performance of different allocation strategies when using varying vaccine supplies, various NPIs, different magnitudes of initial infections, and different vaccine hesitancy levels. The detailed results of this comparative study are summarized in Tables S9–S11, and the main conclusions remained unchanged.

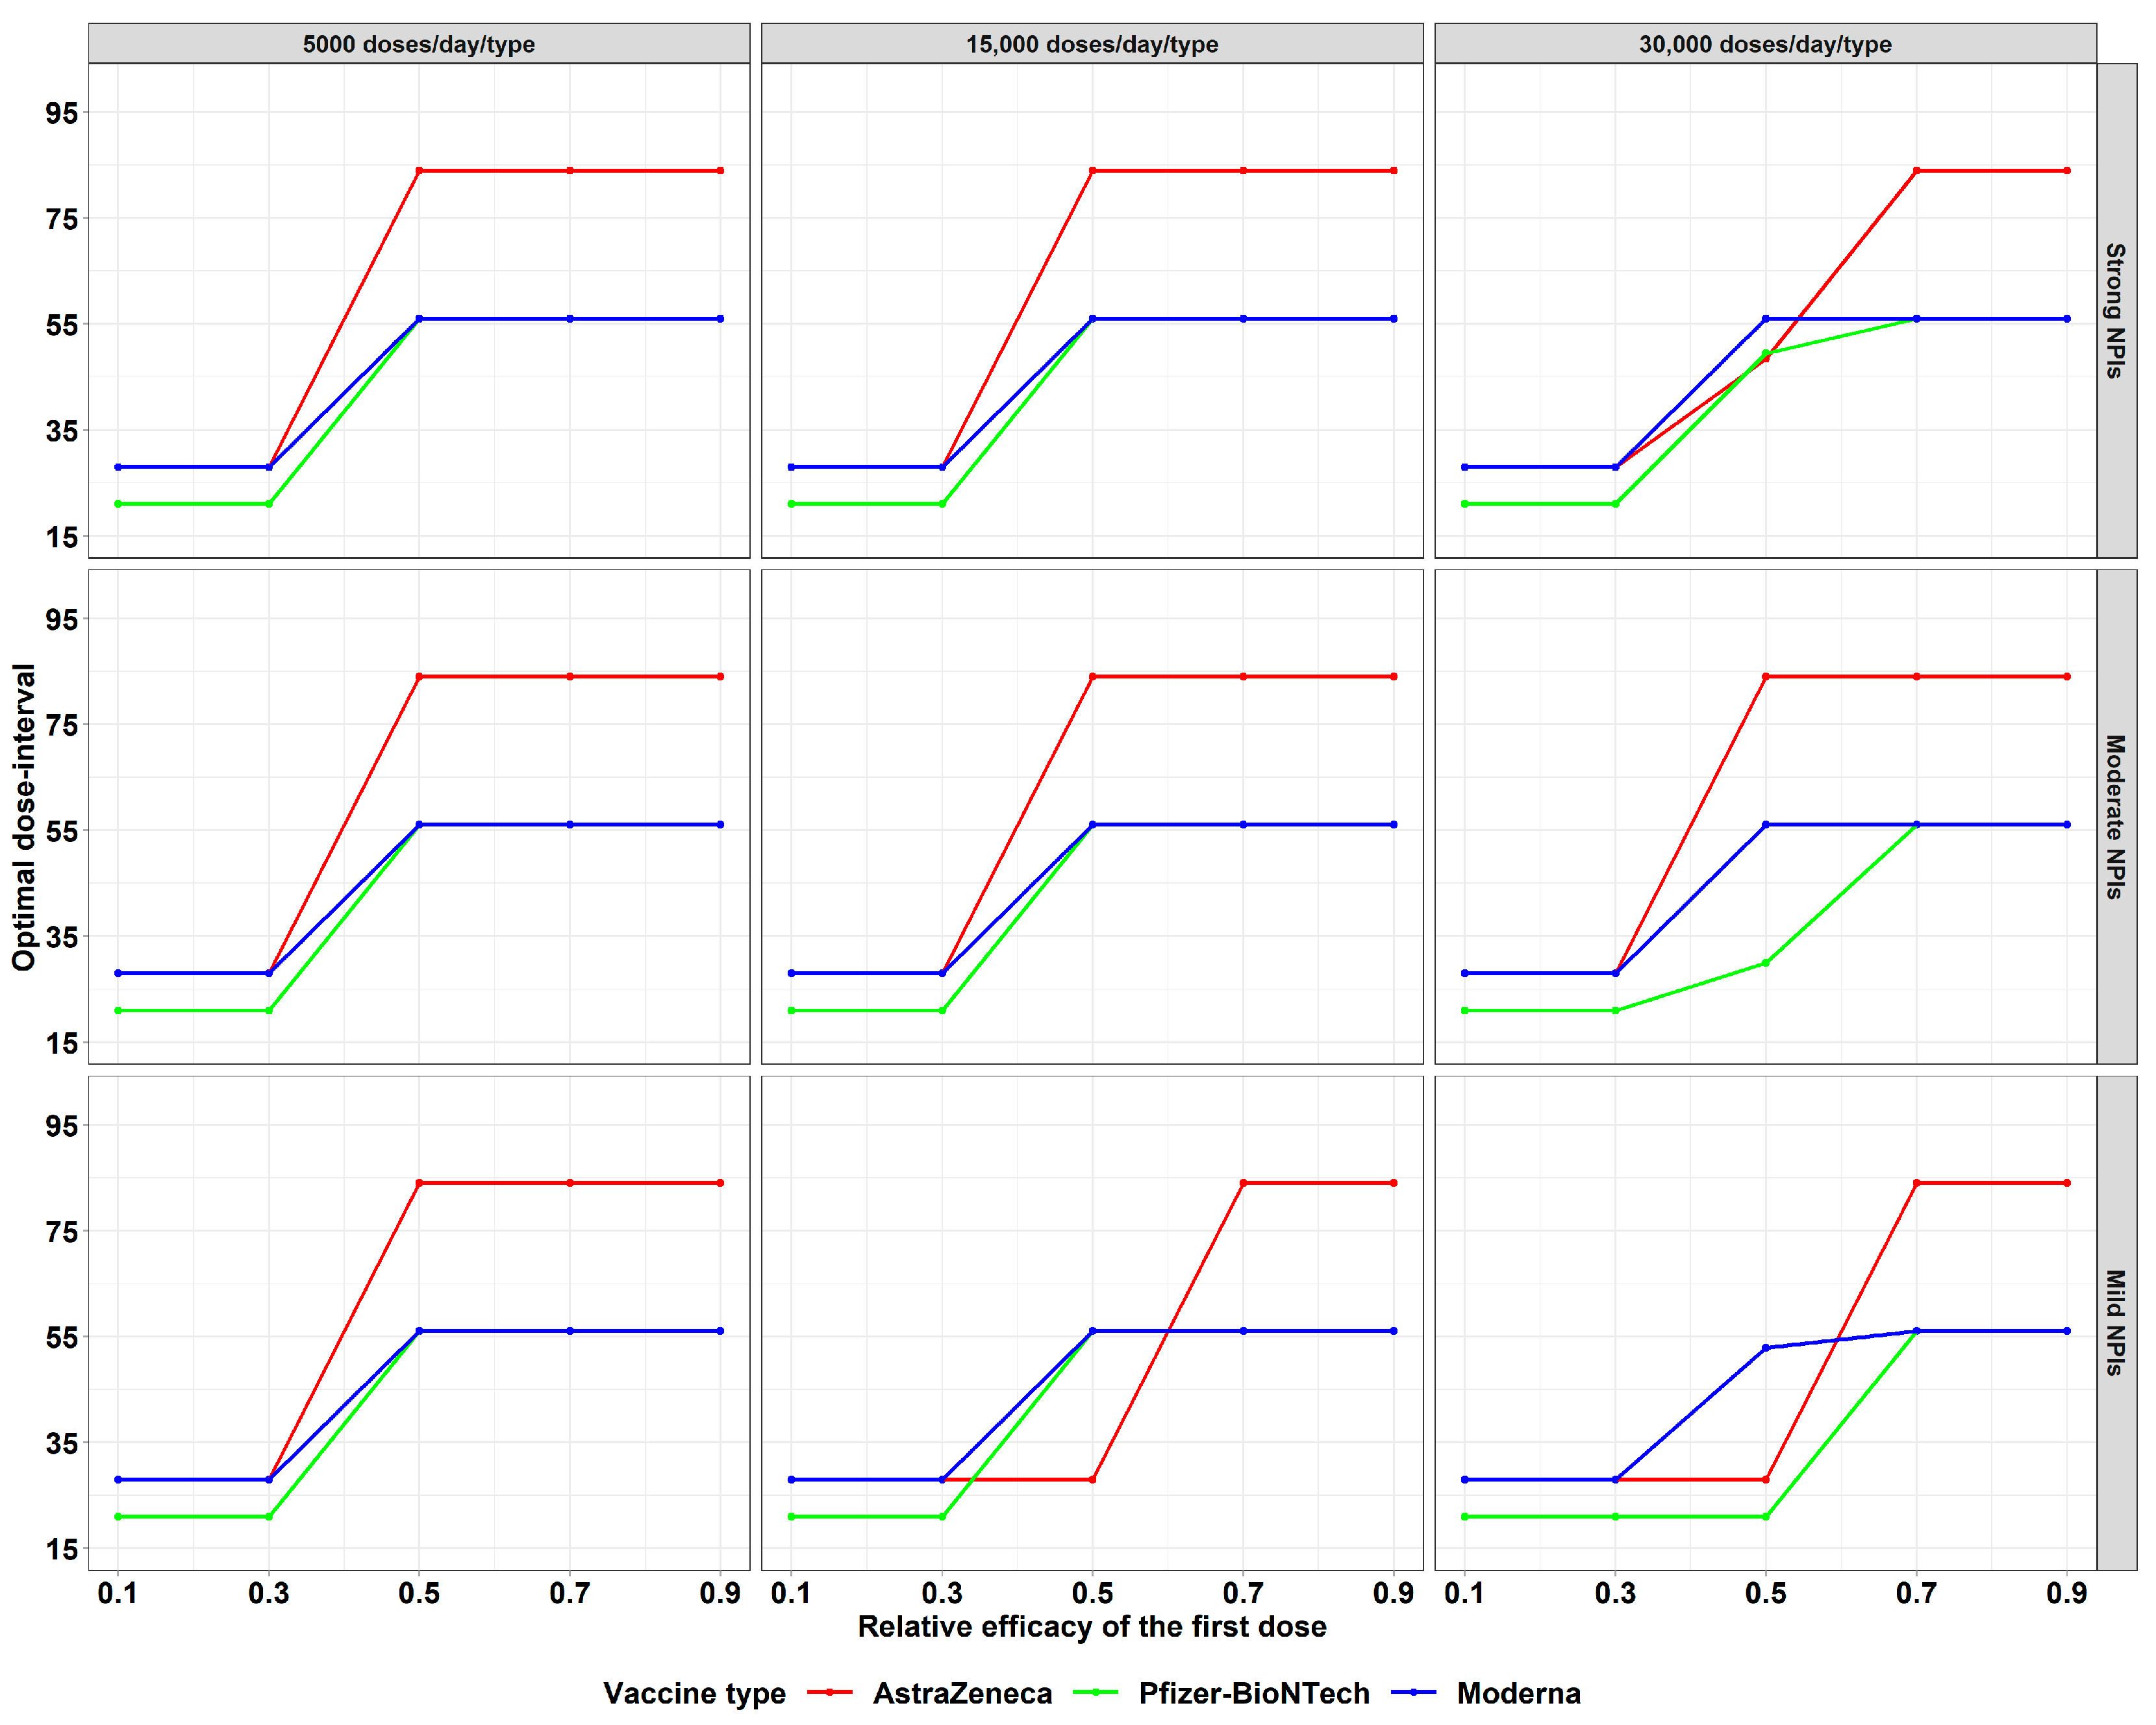
4.5. Impact of the Relative Efficacy of the First Dose

In this subsection, we perform a sensitivity analysis on the different relative efficacies of the first dose and their impacts on the number of vaccines allocated to each age group. We explored a range of counterfactual scenarios, expanding upon Section 4.3. Specifically, we fixed the efficacy of the second dose of the three types of COVID-19 vaccines, and the efficacy of the first dose was assumed to be 0.1-, 0.3-, 0.5-, 0.7-, and 0.9-fold that of the corresponding second dose. Undoubtedly, higher efficacy of the first dose resulted in the most significant number of deaths being averted, as shown in Figures S31, S32, S35, S36, S40, and S41. In all scenarios, we found that the optimal vaccine allocation result was always prioritized for the older age groups in reducing the total deaths, which was also in agreement with the previous results (see Figures S33, S34, S37, S38, S42, and S43).
Figure 12 illustrates the optimal time interval between the first and second doses for different types of vaccines when initial infections were set to those of the actual epidemic situation and when using varying vaccine supplies, various NPIs, and different relative efficacies of the first dose. It was shown that, in the scenario with low relative efficacy of the first dose, it was always best to administer a second dose as soon as possible. In contrast, in the scenario with high relative efficacy of the first dose, delayed administration of the second dose but provision of the first dose to more people tended to be better. We also found that the best time interval between doses depended on an interplay among the levels of vaccine supply, non-pharmaceutical intervention intensity, and initial infection magnitude in the scenario with moderate relative efficacy of the first dose. It is also worth noting that initial infection magnitude did not substantially affect the optimal time interval between the first and second doses for the strong NPI scenarios (see Figures S39 and S44). Finally, we also compared the performance of different allocation strategies when using varying vaccine supplies, various NPIs, and different relative efficacies of the first dose. The results are reported in Tables S12–S14. This showed that our optimal allocation strategy was consistently superior to other alternative strategies.

5. Conclusions and Future Work

This work presented a novel multi-type vaccine resource allocation model in a two-dose vaccination campaign for epidemic control. The model combined the transmission dynamics of infectious diseases with the allocation of limited vaccine supplies across age groups to minimize the expected cumulative number of deaths due to the pandemic over the entire planning horizon. This model explicitly took into account the critical drivers of the COVID-19 epidemic’s progression and the major features of a two-dose vaccination campaign with multiple vaccine types. The applicability of our model was validated through a case study for vaccine allocation with real data during the initial stage of the mass vaccination campaign against COVID-19 in the Midlands, England. We performed a comparative study to prove the advantages of our resulting optimal allocation strategy and conducted an extensive sensitivity analysis for the main model parameters. Our results suggest that prioritizing the allocation of limited vaccines to older adults is an effective strategy for reducing COVID-19-related fatalities. Furthermore, we found that the vaccine alone is insufficient to achieve outbreak control in the short term, and proper non-pharmacological interventions remain significant during the initial vaccination campaign, especially in a setting with a low vaccine supply. We observed that the relative efficacy of the first dose is an essential parameter affecting the optimal dosing interval. If the relative efficacy of the first dose is low, it is always best to complete the two-dose vaccination schedule as soon as possible. On the contrary, if the relative efficacy of the first dose is high, delayed administration of the second dose to increase the proportion of the population vaccinated with a single dose tends to be better. Moreover, we also observed that the optimal time interval between the first and second doses depends on a variety of factors if the relative efficacy of the first dose is moderate, including vaccine supply levels, non-pharmaceutical intervention intensity, initial infection magnitude, and vaccine efficacy.
Overall, our work provides more than just a simple case study. We provide a flexible decision-making framework for COVID-19 vaccine allocation. Moreover, our proposed approach is general and can be easily extended to other infectious diseases with different epidemiological characteristics to provide valuable insights into the development of vaccine allocation strategies for curbing future possible pandemics.
This study has several limitations that represent important directions for future research. Firstly, our model considers age as the sole risk factor. However, other factors, such as sex, race, comorbidities, and occupation, have also been associated with differences in the risk of infection. Secondly, a potential topic for future work is generalizing our model to a stochastic program that considers the uncertainty in the disease transition parameters of the model, such as vaccine hesitancy levels and vaccine efficacy. Thirdly, although we selected minimization of the total number of deaths as the optimization objective, other metrics of disease burden, such as minimization of the total number of infections, intensive care unit occupancy, years of life lost, or a combination of these metrics, might also be efficient for outbreak control, and this deserves further investigation. Fourthly, the current model does not account for different virus variants. Therefore, integrating variant-specific dynamics into the model is an interesting future direction. Furthermore, the proposed model could incorporate a more realistic scenario involving more complicated procedures for a third or booster dose of vaccinations. Finally, in this work, we only focused on a single region without cross-regional movement. Our future research will attempt to incorporate spatial structures into the model.

Supplementary Materials

The following supporting information can be downloaded at https://www.mdpi.com/article/10.3390/systems12080286/s1, Supplementary Materials SA: Constraints on pandemic transmission dynamics; Supplementary Materials SB: Additional figures cited in this main manuscript; Supplementary Materials SC: Additional tables cited in this main manuscript.

Author Contributions

Conceptualization, J.Z. and M.H.; methodology, J.Z.; software, J.Z.; validation, J.Z.; formal analysis, J.Z.; investigation, Q.W. and M.H.; resources, J.Z.; data curation, J.Z.; writing—original draft preparation, J.Z.; writing—review and editing, Q.W.; visualization, J.Z.; supervision, M.H. All authors have read and agreed to the published version of the manuscript.

Funding

This work was supported by the NSFC Key Supported Project of the Major Research Plan (Grant No. 92267206); the NSFC (Grant No. 62032013); the Liaoning Revitalizing Talent Program (Grant No. XLYC2202045).

Institutional Review Board Statement

Not applicable.

Informed Consent Statement

Not applicable.

Data Availability Statement

All data are available within this manuscript and the supporting information in the Supplementary Materials.

Conflicts of Interest

The authors declare no conflicts of interest.

References

  1. Choudhury, N.A.; Ramkumar, M.; Schoenherr, T.; Singh, S. The role of operations and supply chain management during epidemics and pandemics: Potential and future research opportunities. Transp. Res. E Logist. Transp. Rev 2023, 175, 103139. [Google Scholar] [CrossRef]
  2. Biswas, D.; Alfandari, L. Designing an optimal sequence of non-pharmaceutical interventions for controlling COVID-19. Eur. J. Oper. Res 2022, 303, 1372–1391. [Google Scholar] [CrossRef]
  3. Henao-Restrepo, A.M.; Camacho, A.; Longini, I.M.; Watson, C.H.; Edmunds, W.J.; Egger, M.; Carroll, M.W.; Dean, N.E.; Diatta, I.; Doumbia, M.; et al. Efficacy and effectiveness of an rVSV-vectored vaccine in preventing Ebola virus disease: Final results from the Guinea ring vaccination, open-label, cluster-randomised trial (Ebola Ça Suffit!). Lancet 2017, 389, 505–518. [Google Scholar] [CrossRef]
  4. Giuntella, O.; Hyde, K.; Saccardo, S.; Sadoff, S. Lifestyle and mental health disruptions during COVID-19. Proc. Natl. Acad. Sci. USA 2021, 118, e2016632118. [Google Scholar] [CrossRef]
  5. WHO. WHO COVID-19 Dashboard. Available online: https://data.who.int/dashboards/covid19/deaths?n=o (accessed on 6 July 2024).
  6. Vermeulen-Miltz, E.; Clifford-Holmes, J.K.; Snow, B.; Lombard, A.T. Exploring the Impacts of COVID-19 on Coastal Tourism to Inform Recovery Strategies in Nelson Mandela Bay, South Africa. Systems 2022, 10, 120. [Google Scholar] [CrossRef]
  7. Huberts, N.F.D.; Thijssen, J.J.J. Optimal timing of non-pharmaceutical interventions during an epidemic. Eur. J. Oper. Res. 2023, 305, 1366–1389. [Google Scholar] [CrossRef]
  8. IMF. The Great Lockdown: Worst Economic Downturn Since the Great Depression. Available online: https://www.imf.org/zh/Blogs/Articles/2020/04/14/blog-weo-the-great-lockdown-worst-economic-downturn-since-the-great-depression (accessed on 8 June 2023).
  9. WHO. COVID-19 Pandemic Triggers 25% Increase in Prevalence of Anxiety and Depression Worldwide. Available online: https://www.who.int/news/item/02-03-2022-covid-19-pandemic-triggers-25-increase-in-prevalence-of-anxiety-and-depression-worldwide (accessed on 8 September 2023).
  10. Silva, P.J.S.; Sagastizábal, C.; Nonato, L.G.; Struchiner, C.J.; Pereira, T. Optimized delay of the second COVID-19 vaccine dose reduces ICU admissions. Proc. Natl. Acad. Sci. USA 2021, 118, e2104640118. [Google Scholar] [CrossRef]
  11. Bertsimas, D.; Li, M.L.; Liu, X.; Xu, J.; Khan, N. Data-Driven COVID-19 Vaccine Development for Janssen. INFORMS J. Appl. Anal. 2023, 53, 70–84. [Google Scholar] [CrossRef]
  12. Joshi, K.; Rumpler, E.; Kennedy-Shaffer, L.; Bosan, R.; Lipsitch, M. Comparative performance of between-population vaccine allocation strategies with applications for emerging pandemics. Vaccine 2023, 41, 1864–1874. [Google Scholar] [CrossRef] [PubMed]
  13. Bertuzzo, E.; Mari, L.; Pasetto, D.; Miccoli, S.; Casagrandi, R.; Gatto, M.; Rinaldo, A. The geography of COVID-19 spread in Italy and implications for the relaxation of confinement measures. Nat. Commun. 2020, 11, 4264. [Google Scholar] [CrossRef] [PubMed]
  14. Giordano, G.; Blanchini, F.; Bruno, R.; Colaneri, P.; Di Filippo, A.; Di Matteo, A.; Colaneri, M. Modelling the COVID-19 epidemic and implementation of population-wide interventions in Italy. Nat. Med. 2020, 26, 855–860. [Google Scholar] [CrossRef] [PubMed]
  15. Yang, J.; Marziano, V.; Deng, X.; Guzzetta, G.; Zhang, J.; Trentini, F.; Cai, J.; Poletti, P.; Zheng, W.; Wang, W.; et al. Despite vaccination, China needs non-pharmaceutical interventions to prevent widespread outbreaks of COVID-19 in 2021. Nat. Hum. Behav. 2021, 5, 1009–1020. [Google Scholar] [CrossRef] [PubMed]
  16. Buckner, J.H.; Chowell, G.; Springborn, M.R. Dynamic prioritization of COVID-19 vaccines when social distancing is limited for essential workers. Proc. Natl. Acad. Sci. USA 2021, 118, e2025786118. [Google Scholar] [CrossRef] [PubMed]
  17. Miller, I.F.; Becker, A.D.; Grenfell, B.T.; Metcalf, C.J.E. Disease and healthcare burden of COVID-19 in the United States. Nat. Med. 2020, 26, 1212–1217. [Google Scholar] [CrossRef] [PubMed]
  18. Sonabend, R.; Whittles, L.K.; Imai, N.; Perez-Guzman, P.N.; Knock, E.S.; Rawson, T.; Gaythorpe, K.A.M.; Djaafara, B.A.; Hinsley, W.; FitzJohn, R.G.; et al. Non-pharmaceutical interventions, vaccination, and the SARS-CoV-2 delta variant in England: A mathematical modelling study. Lancet 2021, 398, 1825–1835. [Google Scholar] [CrossRef] [PubMed]
  19. Han, S.; Cai, J.; Yang, J.; Zhang, J.; Wu, Q.; Zheng, W.; Shi, H.; Ajelli, M.; Zhou, X.H.; Yu, H. Time-varying optimization of COVID-19 vaccine prioritization in the context of limited vaccination capacity. Nat. Commun. 2021, 12, 4673. [Google Scholar] [CrossRef] [PubMed]
  20. Mallapaty, S.; Callaway, E. What scientists do and don’t know about the Oxford-AstraZeneca COVID vaccine. Nature 2021, 592, 15–17. [Google Scholar] [CrossRef] [PubMed]
  21. Nahofti Kohneh, J.; Amirdadi, M.; Teimoury, E. An optimization framework for COVID-19 vaccine allocation and inventory management: A case study. Appl. Soft. Comput. 2023, 132, 109801. [Google Scholar] [CrossRef] [PubMed]
  22. CDC. Interim Clinical Considerations for Use of COVID-19 Vaccines in the United States. Available online: https://www.cdc.gov/vaccines/covid-19/clinical-considerations/interim-considerations-us.html (accessed on 20 June 2023).
  23. Hill, E.M.; Keeling, M.J. Comparison between one and two dose SARS-CoV-2 vaccine prioritization for a fixed number of vaccine doses. J. R. Soc. Interface 2021, 18, 20210214. [Google Scholar] [CrossRef]
  24. Abbas, H.W.; Sajid, Z.; Dao, U. Assessing the Impact of Risk Factors on Vaccination Uptake Policy Decisions Using a Bayesian Network (BN) Approach. Systems 2024, 12, 167. [Google Scholar] [CrossRef]
  25. Duijzer, L.E.; van Jaarsveld, W.; Dekker, R. Literature review: The vaccine supply chain. Eur. J. Oper. Res. 2018, 268, 174–192. [Google Scholar] [CrossRef]
  26. Medlock, J.; Galvani, A.P. Optimizing Influenza Vaccine Distribution. Science 2009, 325, 1705–1708. [Google Scholar] [CrossRef]
  27. Enayati, S.; Özaltın, O.Y. Optimal influenza vaccine distribution with equity. Eur. J. Oper. Res. 2020, 283, 714–725. [Google Scholar] [CrossRef]
  28. Venkatramanan, S.; Chen, J.; Fadikar, A.; Gupta, S.; Higdon, D.; Lewis, B.; Marathe, M.; Mortveit, H.; Vullikanti, A. Optimizing spatial allocation of seasonal influenza vaccine under temporal constraints. PLoS Comput. Biol. 2019, 15, e1007111. [Google Scholar] [CrossRef]
  29. Ferguson, N.; Matrajt, L.; Halloran, M.E.; Longini, I.M. Optimal Vaccine Allocation for the Early Mitigation of Pandemic Influenza. PLoS Comput. Biol. 2013, 9, e1002964. [Google Scholar] [CrossRef]
  30. Koks-Leensen, M.C.J.; Schalk, B.W.M.; Bakker-van Gijssel, E.J.; Timen, A.; Nagele, M.E.; van den Bemd, M.; Leusink, G.L.; Cuypers, M.; Naaldenberg, J. Risk for Severe COVID-19 Outcomes among Persons with Intellectual Disabilities, the Netherlands. Emerg. Infect. Dis. 2023, 29, 118–126. [Google Scholar] [CrossRef]
  31. Ibrahim, D.; Kis, Z.; Papathanasiou, M.M.; Kontoravdi, C.; Chachuat, B.; Shah, N. Strategic Planning of a Joint SARS-CoV-2 and Influenza Vaccination Campaign in the UK. Vaccines 2024, 12, 158. [Google Scholar] [CrossRef] [PubMed]
  32. Guttieres, D.; Sinskey, A.J.; Springs, S.L. Modeling Framework to Evaluate Vaccine Strategies against the COVID-19 Pandemic. Systems 2021, 9, 4. [Google Scholar] [CrossRef]
  33. Bolcato, M.; Rodriguez, D.; Feola, A.; Di Mizio, G.; Bonsignore, A.; Ciliberti, R.; Tettamanti, C.; Trabucco Aurilio, M.; Aprile, A. COVID-19 Pandemic and Equal Access to Vaccines. Vaccines 2021, 9, 538. [Google Scholar] [CrossRef]
  34. Babus, A.; Das, S.; Lee, S. The optimal allocation of COVID-19 vaccines. Econ. Lett. 2023, 224, 111008. [Google Scholar] [CrossRef]
  35. Bubar, K.M.; Reinholt, K.; Kissler, S.M.; Lipsitch, M.; Cobey, S.; Grad, Y.H.; Larremore, D.B. Model-informed COVID-19 vaccine prioritization strategies by age and serostatus. Science 2021, 371, 916–921. [Google Scholar] [CrossRef]
  36. Shim, E. Optimal Allocation of the Limited COVID-19 Vaccine Supply in South Korea. J. Clin. Med. 2021, 10, 591. [Google Scholar] [CrossRef]
  37. Foy, B.H.; Wahl, B.; Mehta, K.; Shet, A.; Menon, G.I.; Britto, C. Comparing COVID-19 vaccine allocation strategies in India: A mathematical modelling study. Int. J. Infect. Dis. 2021, 103, 431–438. [Google Scholar] [CrossRef] [PubMed]
  38. Moore, S.; Hill, E.M.; Dyson, L.; Tildesley, M.J.; Keeling, M.J. Modelling optimal vaccination strategy for SARS-CoV-2 in the UK. PLoS Comput. Biol. 2021, 17, e1008849. [Google Scholar] [CrossRef] [PubMed]
  39. Matrajt, L.; Eaton, J.; Leung, T.; Dimitrov, D.; Schiffer, J.T.; Swan, D.A.; Janes, H. Optimizing vaccine allocation for COVID-19 vaccines shows the potential role of single-dose vaccination. Nat. Commun. 2021, 12, 3449. [Google Scholar] [CrossRef] [PubMed]
  40. Zhu, J.; Wang, Q.; Huang, M. Optimizing two-dose vaccine resource allocation to combat a pandemic in the context of limited supply: The case of COVID-19. Front. Public Health 2023, 11, 1129183. [Google Scholar] [CrossRef] [PubMed]
  41. Mak, H.Y.; Dai, T.; Tang, C.S. Managing two-dose COVID-19 vaccine rollouts with limited supply: Operations strategies for distributing time-sensitive resources. Prod. Oper. Manag. 2022, 31, 4424–4442. [Google Scholar] [CrossRef] [PubMed]
  42. Shumsky, R.A.; Smith, J.; Hoen, A.; Gilbert, M. Allocating COVID-19 vaccines: Save one for the second dose? Tuck School of Business Working Paper 2021. [Google Scholar] [CrossRef]
  43. Miura, F.; Leung, K.Y.; Klinkenberg, D.; Ainslie, K.E.C.; Wallinga, J. Optimal vaccine allocation for COVID-19 in the Netherlands: A data-driven prioritization. PLoS Comput. Biol. 2021, 17, e1009697. [Google Scholar] [CrossRef]
  44. Schwartz, I.B.; Smith, H.L. Infinite subharmonic bifurcation in an SEIR epidemic model. J. Math. Biol. 1983, 18, 233–253. [Google Scholar] [CrossRef]
  45. Abdin, A.F.; Fang, Y.P.; Caunhye, A.; Alem, D.; Barros, A.; Zio, E. An optimization model for planning testing and control strategies to limit the spread of a pandemic—The case of COVID-19. Eur. J. Oper. Res. 2023, 304, 308–324. [Google Scholar] [CrossRef] [PubMed]
  46. Moghadas, S.M.; Vilches, T.N.; Zhang, K.; Nourbakhsh, S.; Sah, P.; Fitzpatrick, M.C.; Galvani, A.P. Evaluation of COVID-19 vaccination strategies with a delayed second dose. PLoS Biol. 2021, 19, e3001211. [Google Scholar] [CrossRef] [PubMed]
  47. Hogan, A.B.; Winskill, P.; Watson, O.J.; Walker, P.G.T.; Whittaker, C.; Baguelin, M.; Brazeau, N.F.; Charles, G.D.; Gaythorpe, K.A.M.; Hamlet, A.; et al. Within-country age-based prioritisation, global allocation, and public health impact of a vaccine against SARS-CoV-2: A mathematical modelling analysis. Vaccine 2021, 39, 2995–3006. [Google Scholar] [CrossRef] [PubMed]
  48. Parino, F.; Zino, L.; Calafiore, G.C.; Rizzo, A. A model predictive control approach to optimally devise a two-dose vaccination rollout: A case study on COVID-19 in Italy. Int. J. Robust Nonlinear Control 2023, 33, 4808–4823. [Google Scholar] [CrossRef] [PubMed]
  49. Zibadi, S.; Samieefar, N.; Sodeifian, F.; Mosavari, N.; Rezaei, N. COVID-19 Vaccination: What Challenges Are We Going to Face. Acta Biomed. 2021, 92, e2021379. [Google Scholar] [CrossRef]
  50. Dunning, I.; Huchette, J.; Lubin, M. JuMP: A Modeling Language for Mathematical Optimization. SIAM Rev. 2017, 59, 295–320. [Google Scholar] [CrossRef]
  51. Wächter, A.; Biegler, L.T. On the implementation of an interior-point filter line-search algorithm for large-scale nonlinear programming. Math. Program. 2006, 106, 25–57. [Google Scholar] [CrossRef]
  52. HSL. The HSL Mathematical Software Library. Available online: https://www.hsl.rl.ac.uk/ (accessed on 20 April 2023).
  53. Prem, K.; Cook, A.R.; Jit, M. Projecting social contact matrices in 152 countries using contact surveys and demographic data. PLoS Comput. Biol. 2017, 13, e1005697. [Google Scholar] [CrossRef]
  54. ONS. Coronavirus (COVID-19) Infection Survey, UK: 18 December 2020. Available online: https://www.ons.gov.uk/peoplepopulationandcommunity/healthandsocialcare/conditionsanddiseases/bulletins/coronaviruscovid19infectionsurveypilot/18december2020 (accessed on 9 June 2022).
  55. UK, GOV. Coronavirus (COVID-19) in the UK. Available online: https://coronavirus.data.gov.uk (accessed on 9 June 2022).
  56. ONS. Coronavirus (COVID-19) Infection Survey: Characteristics of People Testing Positive for COVID-19 in England and Antibody Data for the UK: December 2020. Available online: https://www.ons.gov.uk/peoplepopulationandcommunity/healthandsocialcare/conditionsanddiseases/articles/coronaviruscovid19infectionsinthecommunityinengland/december2020 (accessed on 12 June 2022).
  57. Molla, J.; Ponce de Leon Chavez, A.; Hiraoka, T.; Ala-Nissila, T.; Kivela, M.; Leskela, L. Adaptive and optimized COVID-19 vaccination strategies across geographical regions and age groups. PLoS Comput. Biol. 2022, 18, e1009974. [Google Scholar] [CrossRef]
  58. ONS. Estimates of the Population for the UK, England and Wales, Scotland and Northern Ireland. Available online: https://www.ons.gov.uk/peoplepopulationandcommunity/populationandmigration/populationestimates/datasets/populationestimatesforukenglandandwalesscotlandandnorthernireland (accessed on 6 June 2022).
  59. Gottlieb, S. Pharmacies Can Get Shots in Arms. Available online: https://www.wsj.com/articles/pharmacies-can-get-shots-in-arms-11609710279 (accessed on 25 June 2023).
  60. Staff, A. A Timeline of COVID-19 Vaccine Developments in 2021. Available online: https://www.ajmc.com/view/a-timeline-of-covid-19-vaccine-developments-in-2021 (accessed on 15 June 2023).
Figure 2. Comparison of the model results with actual epidemiological data. (A) Cumulative number of deaths. (B) Cumulative number of hospital admissions. (C) Hospital bed occupancy.
Systems 12 00286 g002
Figure 3. Comparison of the results from different vaccine allocation strategies.
Systems 12 00286 g003
Figure 4. Age-specific vaccine coverage over time for β t i = 15,000 doses in the real-world NPIs. The proportion of individuals who were vaccinated with the first dose of the vaccine, including the sum of all types of vaccines (A), AstraZeneca (B), Pfizer–BioNTech (C), and Moderna (D). The proportion of individuals who were vaccinated with the second dose of the vaccine, including the sum of all types of vaccines (E), AstraZeneca (F), Pfizer–BioNTech (G), and Moderna (H).
Systems 12 00286 g004
Figure 5. The differences in the curves of the daily numbers of deaths with varying vaccine supplies.
Systems 12 00286 g005
Figure 6. Comparison of the cumulative number of deaths with varying vaccine supplies (A), and the proportion of deaths averted compared with the no-vaccination scenario (B).
Systems 12 00286 g006
Figure 7. The differences in curves for the daily number of deaths with varying vaccine supplies and various NPIs.
Systems 12 00286 g007
Figure 8. Comparison of the cumulative number of deaths with varying vaccine supplies, various NPIs, and different magnitudes of initial infections. (A) Strong NPIs. (B) Moderate NPIs. (C) Mild NPIs.
Systems 12 00286 g008
Figure 9. Proportion of deaths averted compared with the no-vaccination scenario with varying vaccine supplies, various NPIs, and different magnitudes of initial infections. (A) Strong NPIs. (B) Moderate NPIs. (C) Mild NPIs.
Systems 12 00286 g009
Figure 10. The percentage of vaccinated individuals (first dose) in each age group after 5 weeks, 10 weeks, 15 weeks, 20 weeks, and 25 weeks when initial infections were set to those of the actual epidemic situation and when using varying vaccine supplies, various NPIs—strong NPIs (A), moderate NPIs (B), and mild NPIs (C)—and different vaccine hesitancy levels.
Systems 12 00286 g010
Figure 11. The percentage of vaccinated individuals (second dose) in each age group after 5 weeks, 10 weeks, 15 weeks, 20 weeks, and 25 weeks when initial infections were set to those of the actual epidemic situation and when using varying vaccine supplies, various NPIs—strong NPIs (A), moderate NPIs (B), and mild NPIs (C)—and different vaccine hesitancy levels.
Systems 12 00286 g011
Figure 12. Optimal time interval between the first and second doses for different types of vaccines when initial infections were set to those of the actual epidemic situation and when using varying vaccine supplies, various NPIs, and different relative efficacies of the first dose.
Systems 12 00286 g012
Table 1. Statistical analysis comparing the actual epidemiological data and the model results.
DataMetric
Mean Absolute Percent Error WeightedNormalized Root Mean Squared ErrorExplained Variance (%)
Cumulative number of deaths0.04250.048398.95
Cumulative number of hospital admissions0.02560.029599.72
Hospital bed occupancy0.06010.100898.78
Table 2. A comparison of the results of the three vaccination policies.
PolicyCumulative Number of DeathsProportion of Deaths Averted Compared with the Non-Vaccination Policy (%)
Non-vaccination policy42,579-
Actual policy12,43370.8
Optimal policy12,13371.5
Disclaimer/Publisher’s Note: The statements, opinions and data contained in all publications are solely those of the individual author(s) and contributor(s) and not of MDPI and/or the editor(s). MDPI and/or the editor(s) disclaim responsibility for any injury to people or property resulting from any ideas, methods, instructions or products referred to in the content.

