
Sharing a Ride: A Dual-Service Model of People and Parcels Sharing Taxis with Loose Time Windows of Parcels


Abstract
:1. Introduction
2. Problem Description
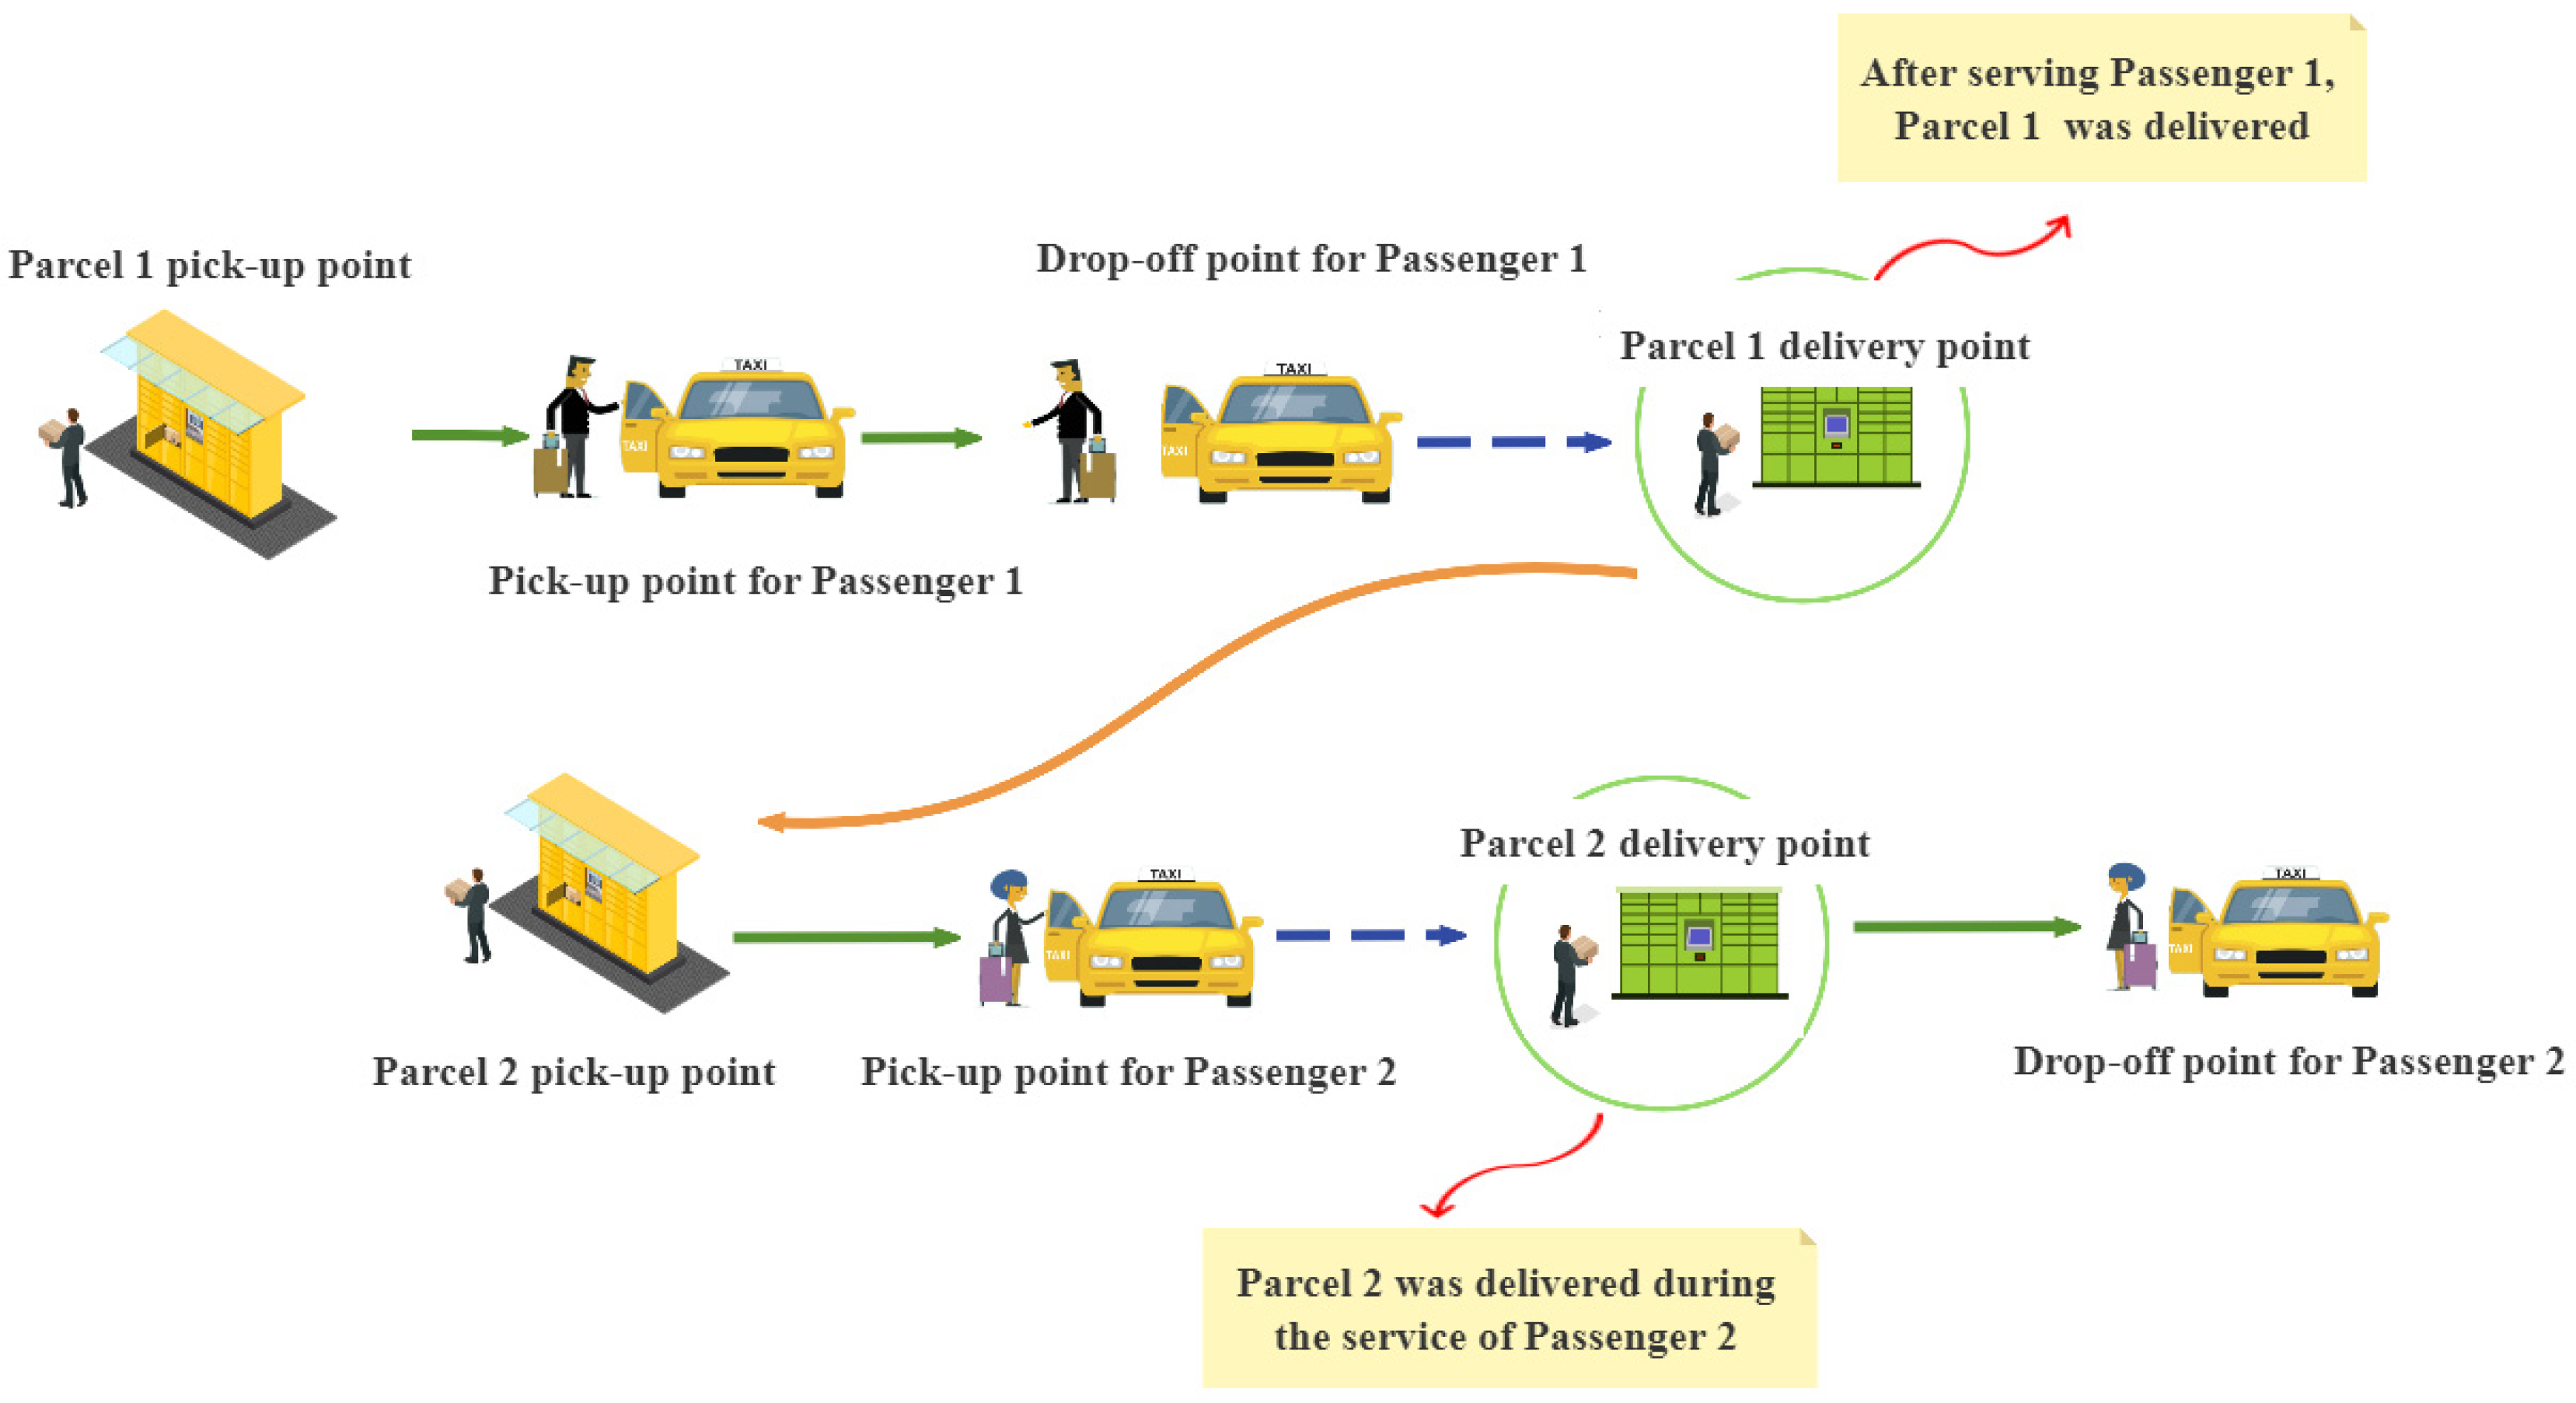
2.1. Subsection Illustration of the Proposed Problem
2.2. Definition of the Problem
2.3. Model of SARP-LTW
- (a)
- When simultaneously carrying parcels and passengers, passenger requests are given higher priority than parcels. When taxis depart from the parcel center, parcels are already loaded into the taxis. Parcels only need to be delivered to the designated delivery points before the end of the taxi working day, for example, 6:00 p.m.
- (b)
- Each parcel order or passenger order is assigned to only one taxi to serve, prohibiting transfers between vehicles mid-service.
- (c)
- Vehicles are allowed to at most merge up to two groups of passenger orders simultaneously. For example, while passenger 1 is en route from the origin to the destination, another passenger request is allowed for a ride-sharing arrangement.
- (d)
- The start of work for taxis is at 8:00 a.m. from the parcel center, and they need to return to the parcel center at 6:00 p.m.
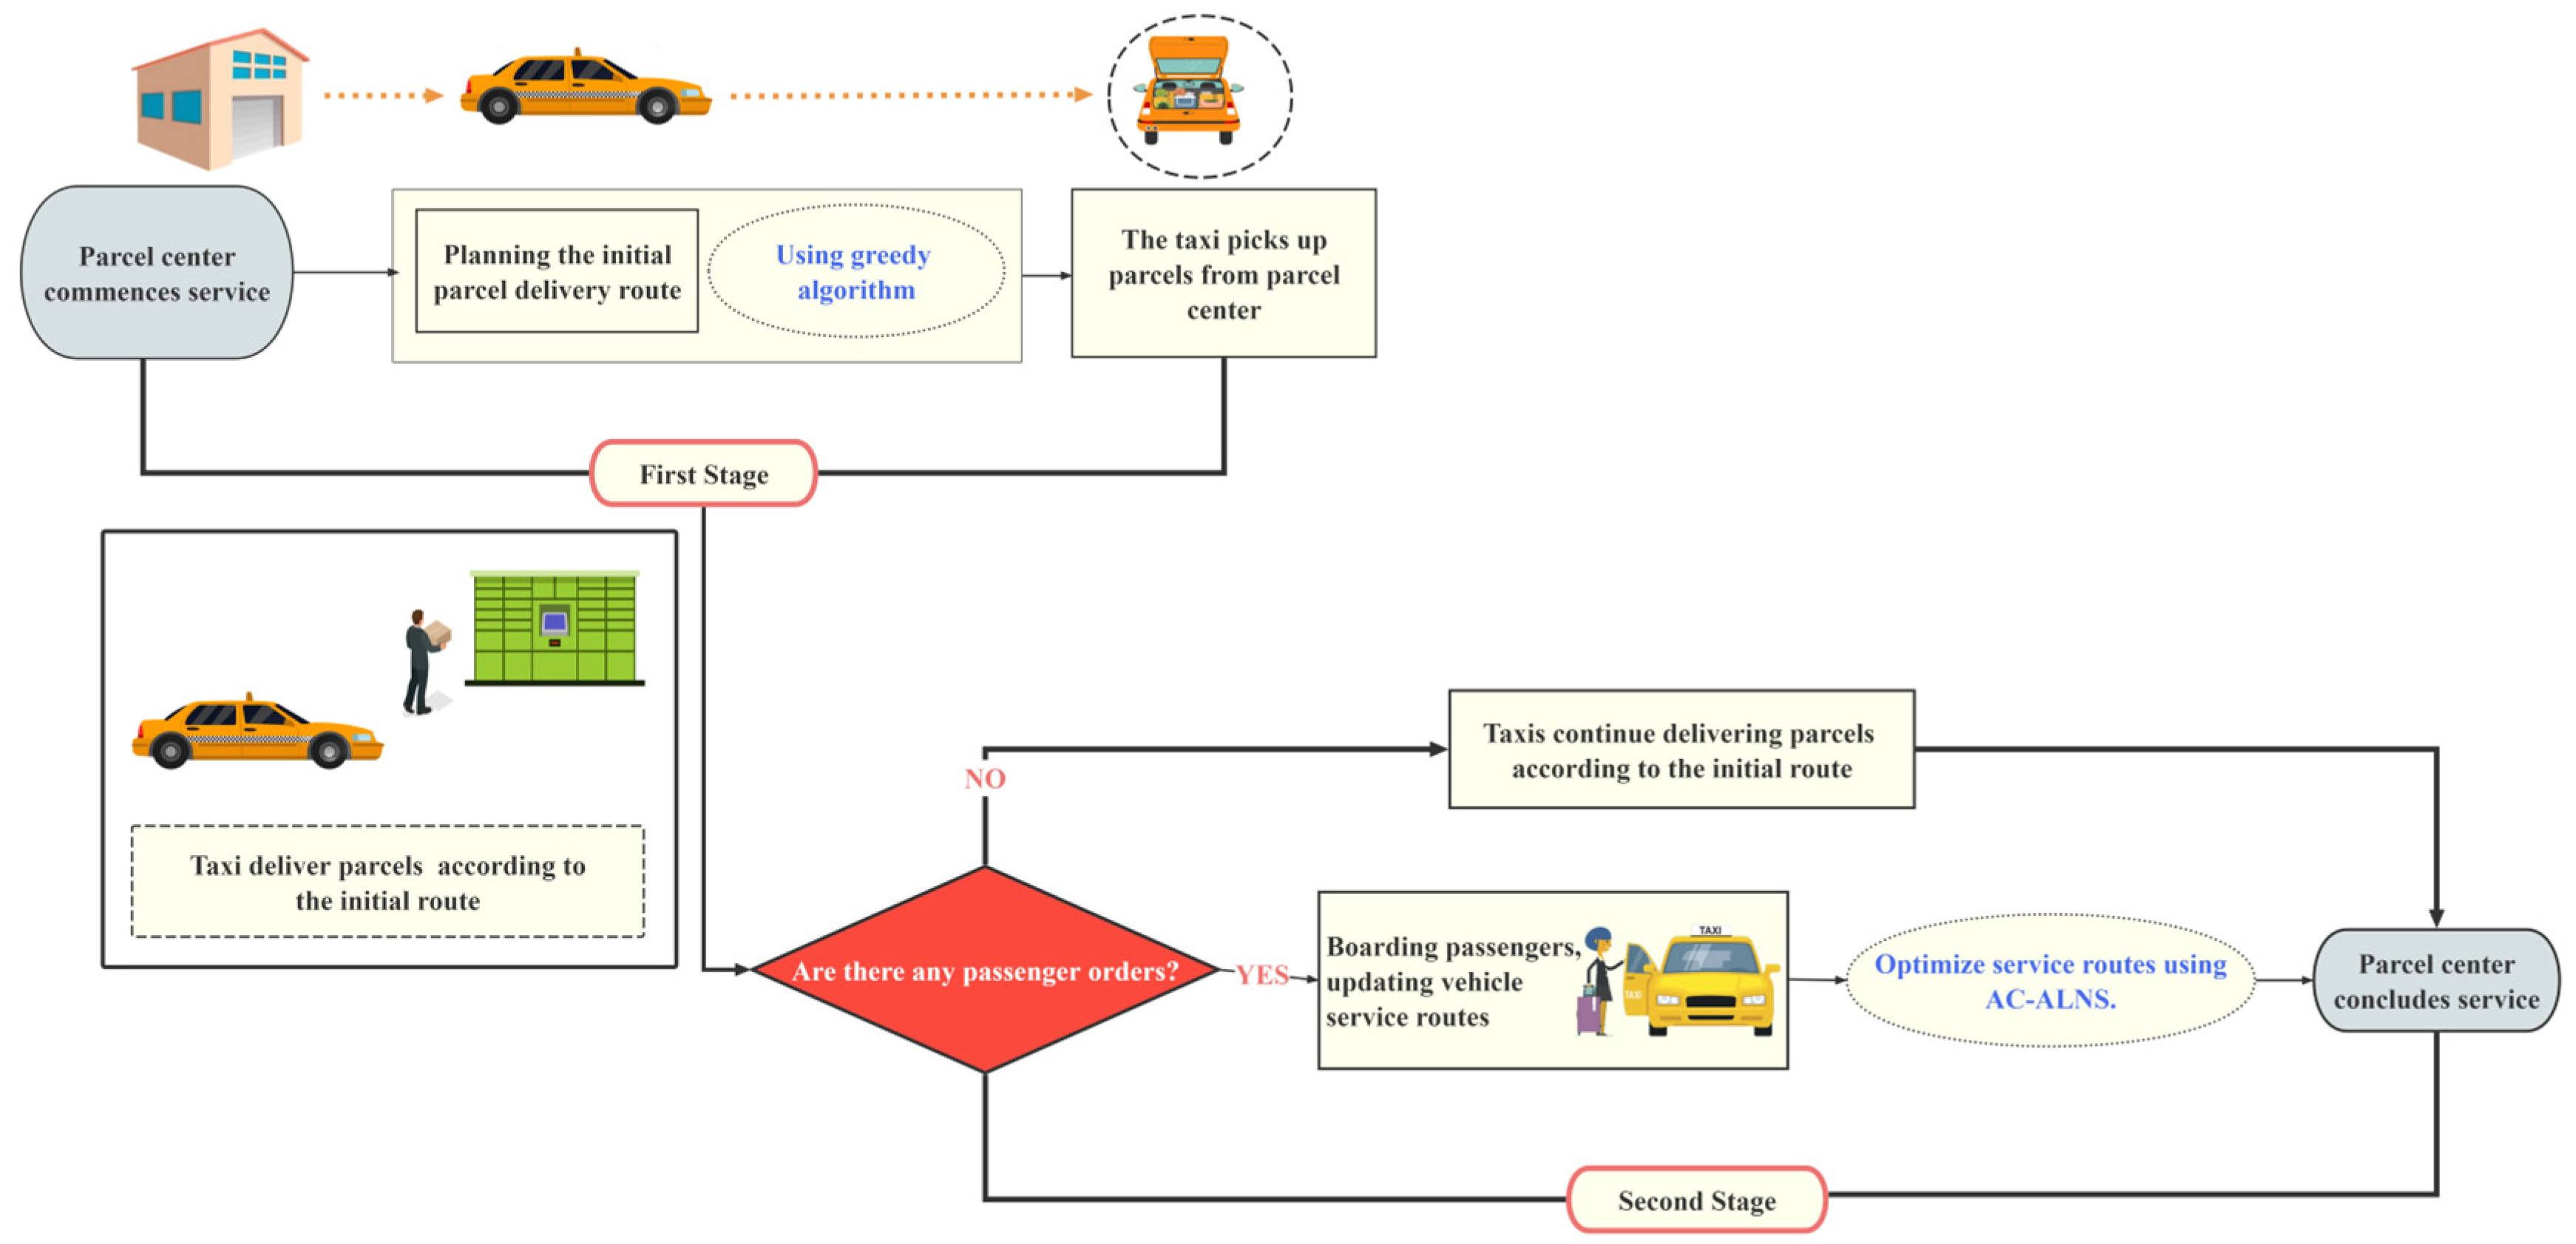
3. The Algorithm Design
3.1. The Problem-Solving Strategy
3.2. Greedy-AC-ALNS Algorithm
| Algorithm 1 The process of updating pheromones |
| 1: Input Parameters: |
| 2: Set: |
| 3: for each path in initial_paths do |
| 4: for each pair in path do |
| 5: |
| 6: end for |
| 7: end for |
| 8: Output: The node pair with the highest concentration of pheromones in each path segment |
| Algorithm 2 Greedy Adaptive Large Neighborhood Search Algorithm based on Ant Colony Optimization |
| 1: Input Parameters: |
| 2: Generate initial solution using the Greedy Algorithm, |
| 3: |
| 4: The initial score of operators |
| 5: The initial weight of operators |
| 6: The number of times an operator is selected |
| 7: Fix the nodes and in each subroute using the pheromone concentration |
| 8: while do |
| 9: Randomly select a removal operator using a roulette wheel selection method. Draw or request from . Remove or from |
| 10: Randomly select a repair operator using a roulette wheel selection method to reinsert request or Update |
| 11: if then |
| 12: Update the best solution |
| 13: |
| 14: else |
| 15: if then |
| 16: |
| 17: |
| 18: else |
| 19: with probability |
| 20: |
| 21: end if |
| 22: |
| 23: end if |
| 24: |
| 25: |
| 26: end while |
| 27: Output: |
- Disruption and Repair Operators
- (1)
- Disruption operators
- (2)
- Repair operators
- Adaptive adjustment strategy
- Acceptance criterion for simulated annealing
4. Numerical Results
4.1. Comparison with the SARP
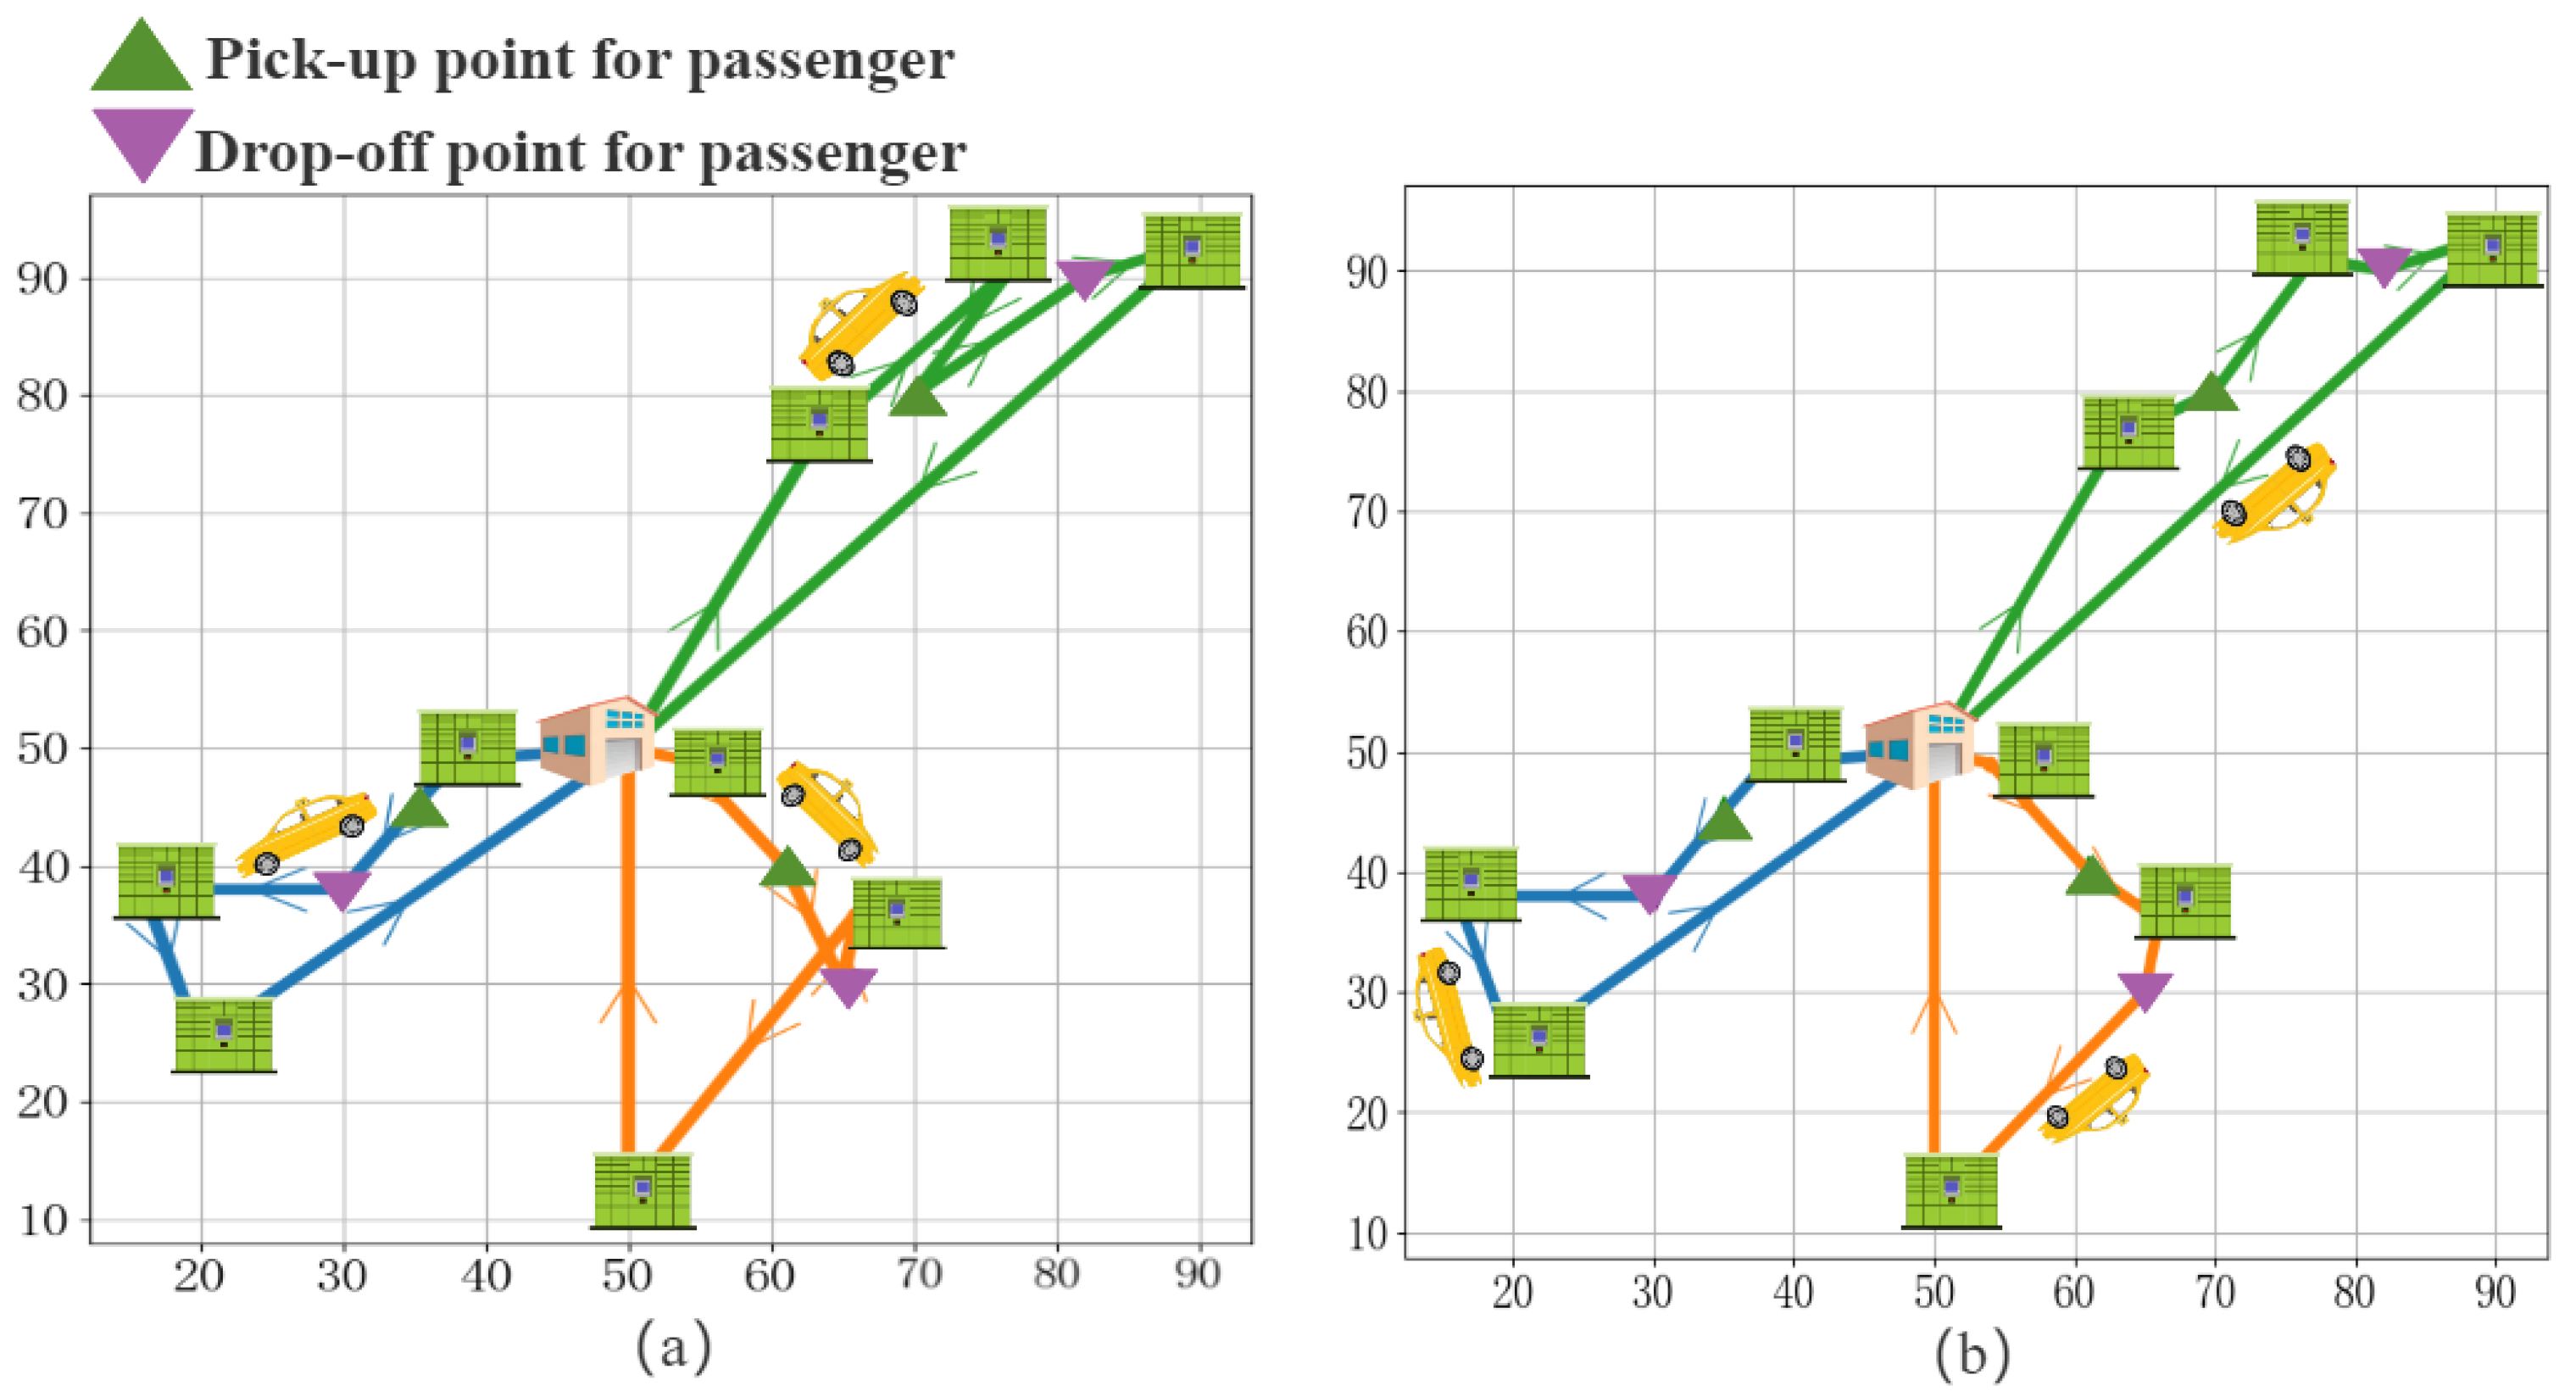
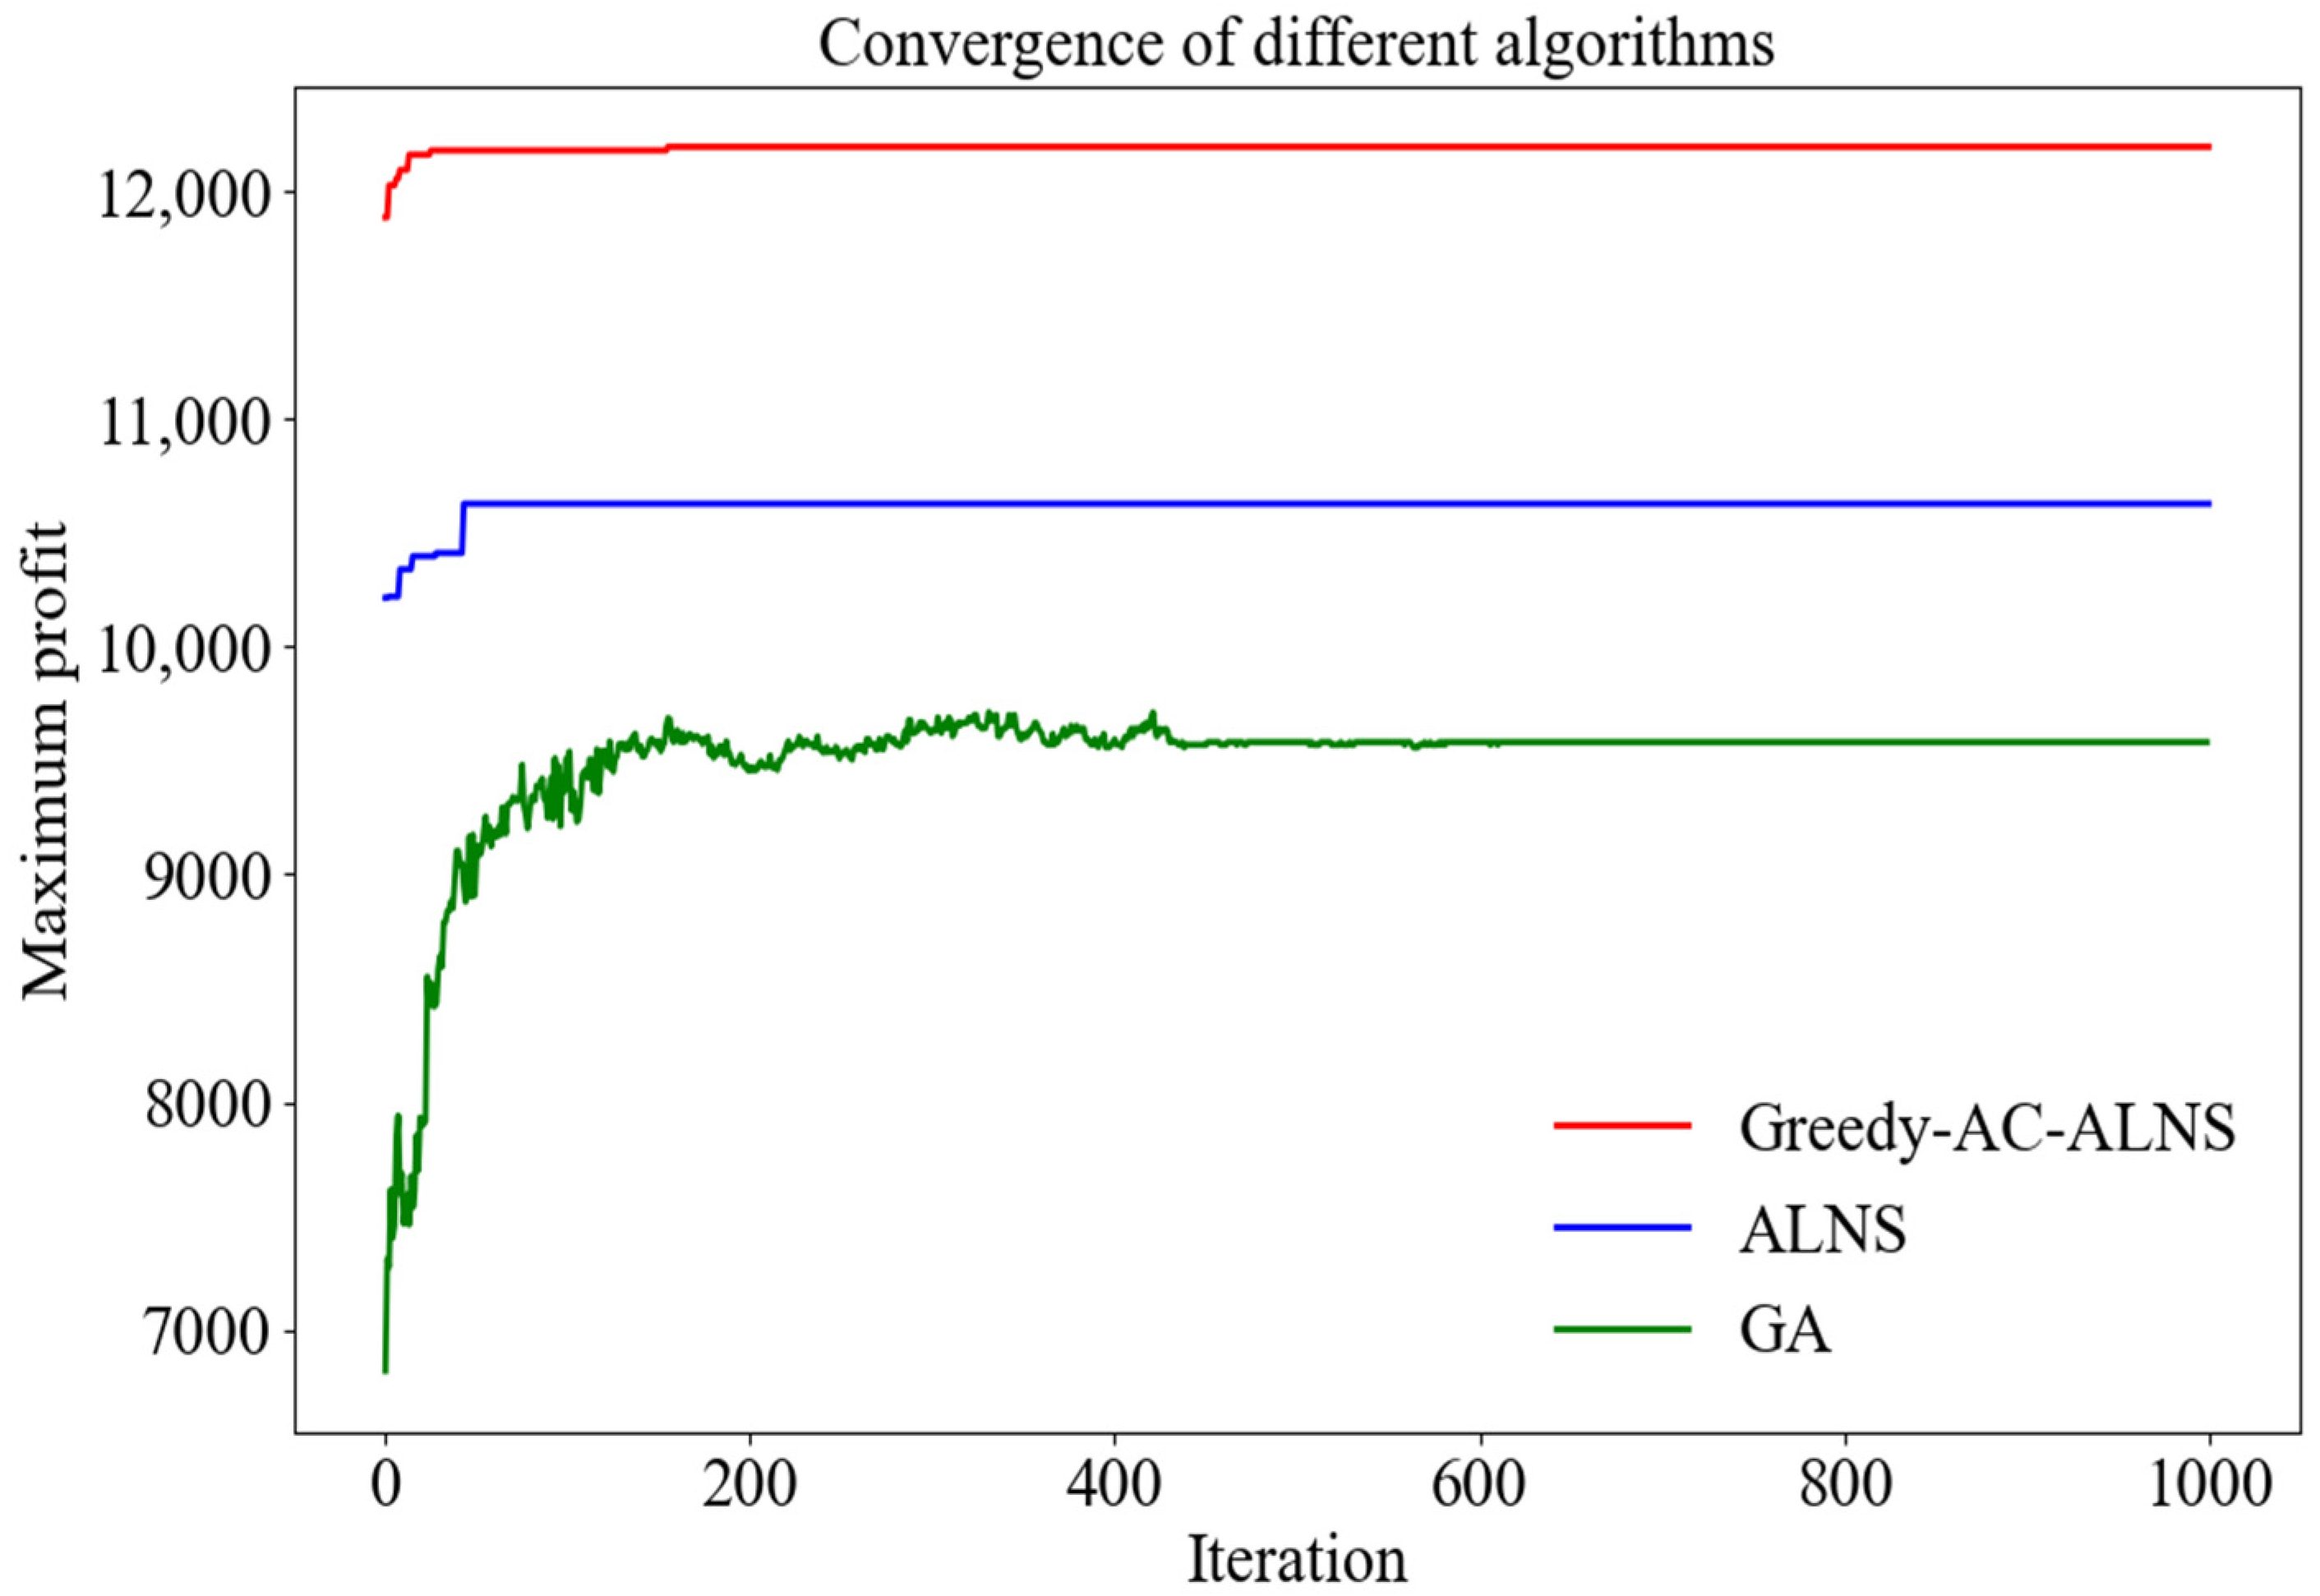
4.2. Performance of Greedy-AC-ALNS
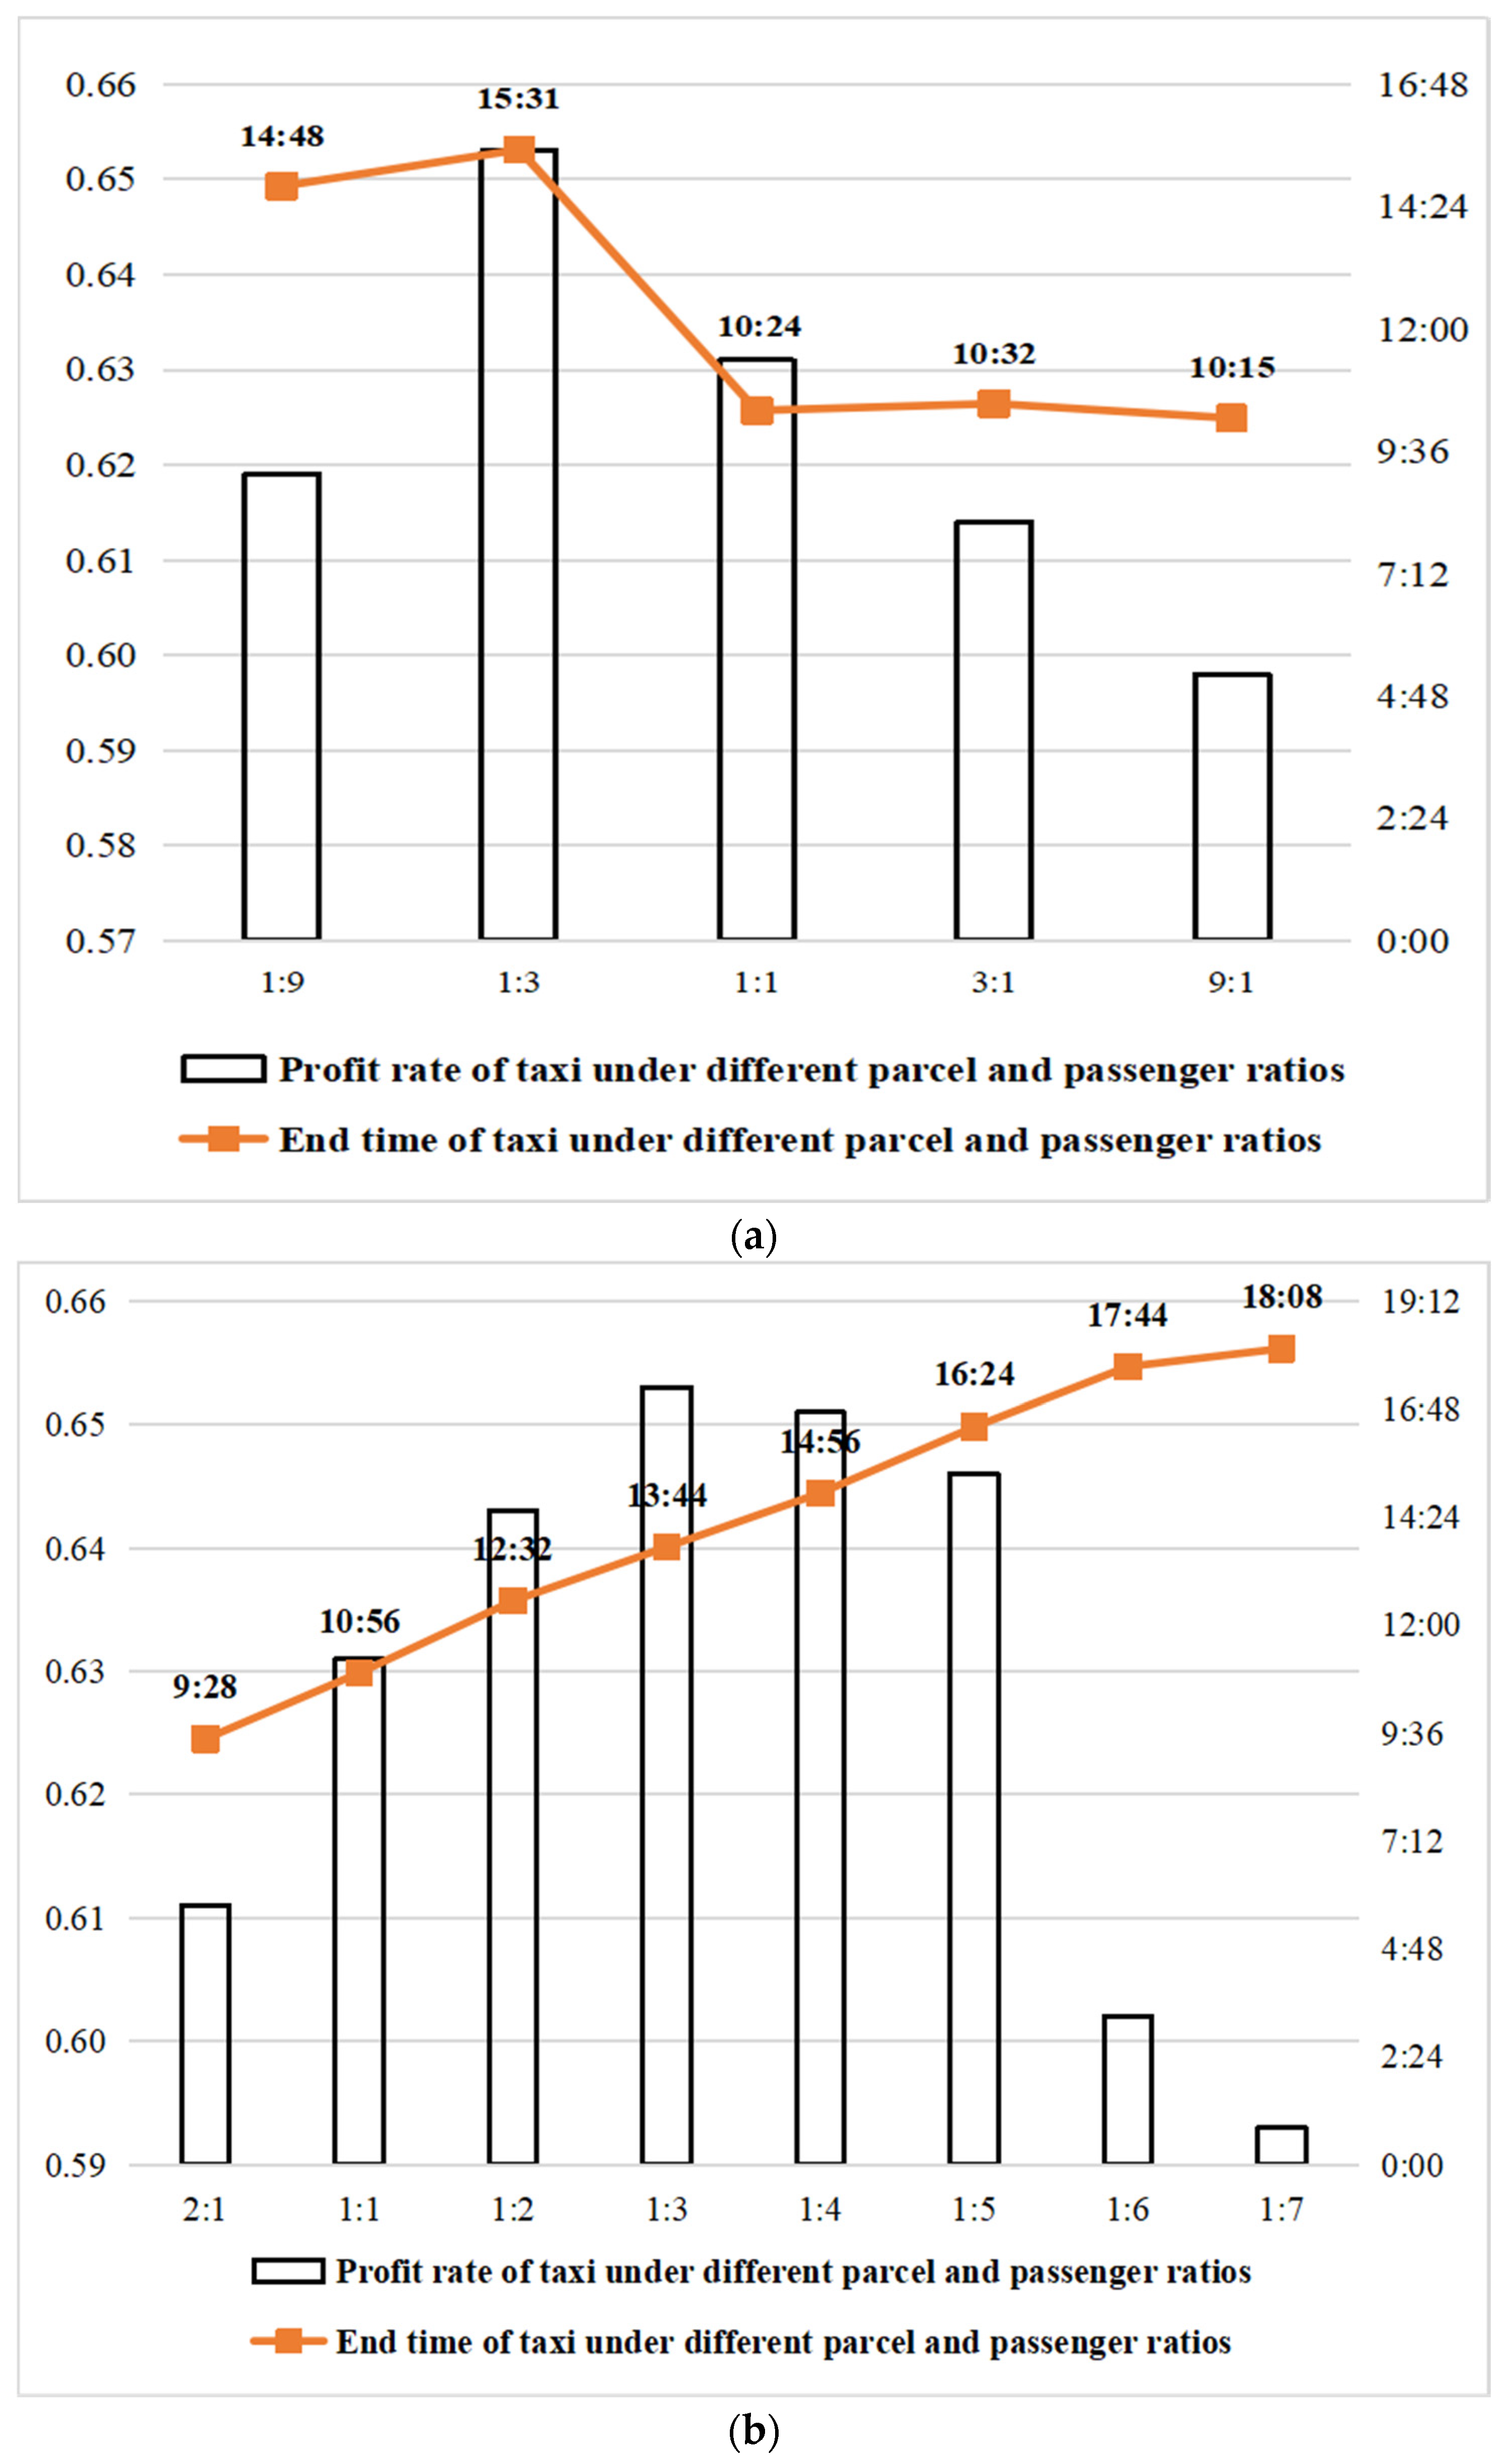
4.3. Effect of Ratio of Parcel to Passenger
5. Conclusions and Discussion
- (1)
- Our research clarifies the specific concept and operational mechanism of the people and parcel-sharing taxis problem with loose time windows of parcels and establishes a mathematical model suitable for this operational scenario.
- (2)
- In response to the complexity of the problem and the scale of the instances, this paper designs the Greedy-AC-ALNS algorithm based on the ant colony information updating mechanism. From the results of the instance analysis, the SARP-LTW outperforms the SARP mode in terms of profit rate, revenue, and revenue stability, with improvements of 56%, 46%, and 69%, respectively. The improved Greedy-AC-ALNS algorithm designed in this paper also outperforms the ALNS algorithm in terms of solution stability, with an average solution coefficient of variation lower than that of the ALNS algorithm by 0.43 and a 16% higher ability to search for optimal solutions. The instance analysis shows that the people and parcel-sharing taxis problem with loose time windows of parcels in this paper performs better in terms of operational revenue compared to the SARP mode, indicating potential practical applicability in the future. As for the Greedy-AC-ALNS algorithm proposed in this paper, it effectively improves both solution efficiency and solution quality when dealing with large-scale instances.
- (3)
- In the final numerical analysis, our study also explored the impact of different parcel–passenger ratios on various metrics of the system under different vehicle scales. Ultimately, we found that when there are many vehicles, the highest vehicle profitability rate occurs when the parcel–passenger ratio is 1:3. However, when the number of vehicles is limited, the system cannot complete all delivery tasks before the vehicles finish their shifts when the parcel–passenger ratio reaches 1:7.
Author Contributions
Funding
Data Availability Statement
Conflicts of Interest
References
- Alisoltani, N.; Leclercq, L.; Zargayouna, M. Can dynamic ride-sharing reduce traffic congestion? Transp. Res. Part B Methodol. 2022, 145, 212–246. [Google Scholar] [CrossRef]
- Long, J.; Tan, W.; Szeto, W.Y.; Li, Y. Ride-sharing with travel time uncertainty. Transp. Res. Part B Methodol. 2018, 118, 143–171. [Google Scholar] [CrossRef]
- Sun, Z.; Wang, Y.; Zhou, H.; Jiao, J.; Overstreet, R.E. Travel behaviours, user characteristics, and social economic impacts of shared transportation: A comprehensive review. Int. J. Logist. Res. Appl. 2019, 24, 1–27. [Google Scholar] [CrossRef]
- Li, B.; Krushinsky, D.; Reijers, H.A.; Van Woensel, T. The Share-a-Ride Problem: People and parcels sharing taxis. Eur. J. Oper. Research. 2014, 238, 31–40. [Google Scholar] [CrossRef]
- Wang, R.; Chen, F.; Liu, X.; Liu, X.; Li, Z.; Zhu, Y. A Matching Model for Door-to-Door Multimodal Transit by Integrating Taxi-Sharing and Subways. ISPRS Int. J. Geo-Inf. 2021, 10, 469. [Google Scholar] [CrossRef]
- Beirigo, B.A.; Schulte, F.; Negenborn, R.R. Integrating people and freight transportation using shared autonomous vehicles with compartments. IFAC-Pap. Online 2018, 51, 392–397. [Google Scholar] [CrossRef]
- van der Tholen, M.; Beirigo, B.A.; Jovanova, J.; Schulte, F. The share-a-ride problem with integrated routing and design decisions: The case of mixed-purpose shared autonomous vehicles. Int. Conf. Comput. Logist. 2021, 62, 347–361. [Google Scholar]
- Enzi, M.; Parragh, S.N.; Pisinger, D.; Prandtstetter, M. Modeling and solving the multimodal car- and ride-sharing problem. Eur. J. Oper. Res. 2021, 16, 290–303. [Google Scholar] [CrossRef]
- Ghilas, V.; Demir, E.; Van Woensel, T. A scenario-based planning for the pickup and delivery problem with time windows, scheduled lines and stochastic demands. Transp. Res. Part B Methodol. 2016, 91, 34–51. [Google Scholar] [CrossRef]
- Ren, T.; Jiang, Z.; Cai, X.; Yu, Y.; Xing, L.; Zhuang, Y.; Li, Z. A dynamic routing optimization problem considering joint delivery of passengers and parcels. Neural Comput. Appl. 2022, 33, 10323–10334. [Google Scholar] [CrossRef]
- Ye, Y.; Guo, J.; Yan, L. A Metro Freight Plan for Mixed Passenger and Freight Transportation. J. Adv. Transp. 2022, 2022, 6602387. [Google Scholar] [CrossRef]
- Ye, Y.; Guo, J.; Yan, L. A Mixed Decision Strategy for Freight and Passenger Transportation in Metro Systems. Comput. Intell. Neurosci. 2021, 2021, 5412016. [Google Scholar] [CrossRef]
- Azcuy, I.; Agatz, N.; Giesen, R. Designing integrated urban delivery systems using public transport. Transp. Res. Part E Logist. Transp. Rev. 2021, 156, 102525. [Google Scholar] [CrossRef]
- Pimentel, C.; Alvelos, F. Integrated urban freight logistics combining passenger and freight flows mathematical model proposal. Transp. Res. Procedia 2018, 30, 80–89. [Google Scholar] [CrossRef]
- Ehmke, J.F.; Campbell, A.M. Customer acceptance mechanisms for home deliveries in metropolitan areas. Eur. J. Oper. Res. 2019, 233, 193–207. [Google Scholar] [CrossRef]
- Lu, C.C.; Diabat, A.; Li, Y.T.; Yang, Y.M. Combined passenger and parcel transportation using a mixed fleet of electric and gasoline vehicles. Transp. Res. Part E Logist. Transp. Rev. 2022, 157, 102546. [Google Scholar] [CrossRef]
- Shu, S.; Chen, Z.; Yu, Z.; Cao, S.; Wu, G.; Shi, D.; Wang, G.; Liu, Z.; Chen, X.; Na, X.; et al. Modeling Freight-Sharing Platform Operations for Optimal Compensation Strategy Using Markov Decision Processes. Inst. Electr. Electron. Eng. 2022, 1006–1011. [Google Scholar]
- Taiebat, M.; Amini, E.; Xu, M. Sharing behavior in ride-hailing trips: A machine learning inference approach. Transp. Res. Part D Transp. Environ. 2022, 103, 10316. [Google Scholar] [CrossRef]
- Vincent, F.Y.; Mareg, M.Z.; Sisay, G.G.; Putu, A.Y.I.; Panca, J. A Metaheuristic algorithm for the share-a-ride problem. Expert Syst. Appl. 2023, 230, 120569. [Google Scholar]
- Yu, V.F.; Indrakarna, P.A.; Redi, A.A.N.P.; Lin, S.W. Simulated annealing with mutation strategy for the share-a-ride problem with flexible compartments. Mathematics 2021, 9, 2320. [Google Scholar] [CrossRef]
- Zhan, X.; Szeto, W.Y.; Shui, C.S.; Chen, X.M. A modified artificial bee colony algorithm for the dynamic ride-hailing sharing problem. Transp. Res. Part E Logist. Transp. Rev. 2021, 150, 102124. [Google Scholar] [CrossRef]
- Azi, N.; Gendreau, M.; Potvin, J.Y. An adaptive large neighborhood search for a vehicle routing problem with multiple routes. Comput. Oper. Res. 2022, 41, 167–173. [Google Scholar] [CrossRef]
- Li, B.; Krushinsky, D.; Van Woensel, T.; Reijers, H.A. An adaptive large neighborhood search heuristic for the share-a-ride problem. Comput. Oper. Res. 2016, 66, 170–180. [Google Scholar] [CrossRef]
- Hosni, H.; Naoum-Sawaya, J.; Artail, H. The shared-taxi problem: Formulation and solution methods. Transp. Res. Part B Methodol. 2014, 70, 303–318. [Google Scholar] [CrossRef]
- Ji, W.; Liu, S.; Han, K.; Liu, T. Share-a-Ride Problem with mixed ride-hailing and logistic vehicles. arXiv 2024, arXiv:2403.11944. [Google Scholar]
- Cohen, B.; Kietzmann, J. Ride On! Mobility Business Models for the Sharing Economy. Organ. Environ. 2014, 27, 280–298. [Google Scholar] [CrossRef]
- Zhu, J.; Lin, N.; Zhu, H.; Liu, X. Role of sharing economy in energy transition and sustainable economic development in China. J. Innov. Knowl. 2023, 8, 1–12. [Google Scholar] [CrossRef]
- Solomon, M.M. Algorithms for the Vehicle Routing and Scheduling Problems with Time Window Constraints. Oper. Res. 1987, 35, 254–265. [Google Scholar] [CrossRef]


| Study | Sharing Mode | Transportation Means | Method Type |
|---|---|---|---|
| [4,10,11] | Allow passenger–parcel sharing and parcel–parcel sharing. | Taxis | Exact and heuristic |
| [5,7,13] | Allow passenger–parcel sharing and parcel–parcel sharing. | Subways | Heuristic |
| [6,14] | Allow passenger–parcel sharing and parcel–parcel sharing. | SAVs (shared autonomous vehicles) | Exact |
| [17] | Allow passenger–parcel sharing and parcel–parcel sharing. | Bus | Exact and heuristic |
| [18] | Allow passenger–parcel sharing and parcel–parcel sharing. | A mixed fleet of electric and gasoline vehicles | Heuristic |
| Sets | |
|---|---|
| Number of passengers | |
| Number of parcels | |
| Set of passenger stops | |
| Set of parcel stops | |
| and represent the parcel center | |
| Set of passenger origins | |
| Set of passenger destinations | |
| Set of parcel origins | |
| Set of parcel destinations | |
| Set of passengers served by taxi | |
| Set of pairs , which define a pair of subsequently served requests | |
| Parameters and constants | |
| Load of parcel | |
| Distance from the origin to the destination for the request , i.e., distance between stops and | |
| Time window for request | |
| Parcel capacity of taxi | |
| Maximum duration time for taxi | |
| Number of passenger orders served by taxi | |
| Maximum number of requests between one passenger service | |
| Distance between stops and | |
| Travel time between stops and | |
| Extra travel distance for taxi if parcel is delivered between passengers and | |
| Extra travel distance for taxi if parcel is delivered between passengers and : average speed | |
| Maximum delivery time for request | |
| Flag-down fare for passenger service | |
| Base fare for parcel service | |
| Fare charged for delivering one passenger per kilometer | |
| Fare charged for delivering one parcel per kilometer | |
| Average cost per kilometer for delivering requests | |
| Discount factor for exceeding the expected time of passengers | |
| Time spent by request in taxi , | |
| Auxiliary variables | |
| Timepoint when taxi arrives at stop | |
| Index of request in a service sequence of a taxi | |
| Load of taxi after visiting stop | |
| Decision variables | |
| Binary decision variables equal to 1 if taxi goes directly from node to stop | |
| Binary decision variables equal to 1 if taxi visits stop | |
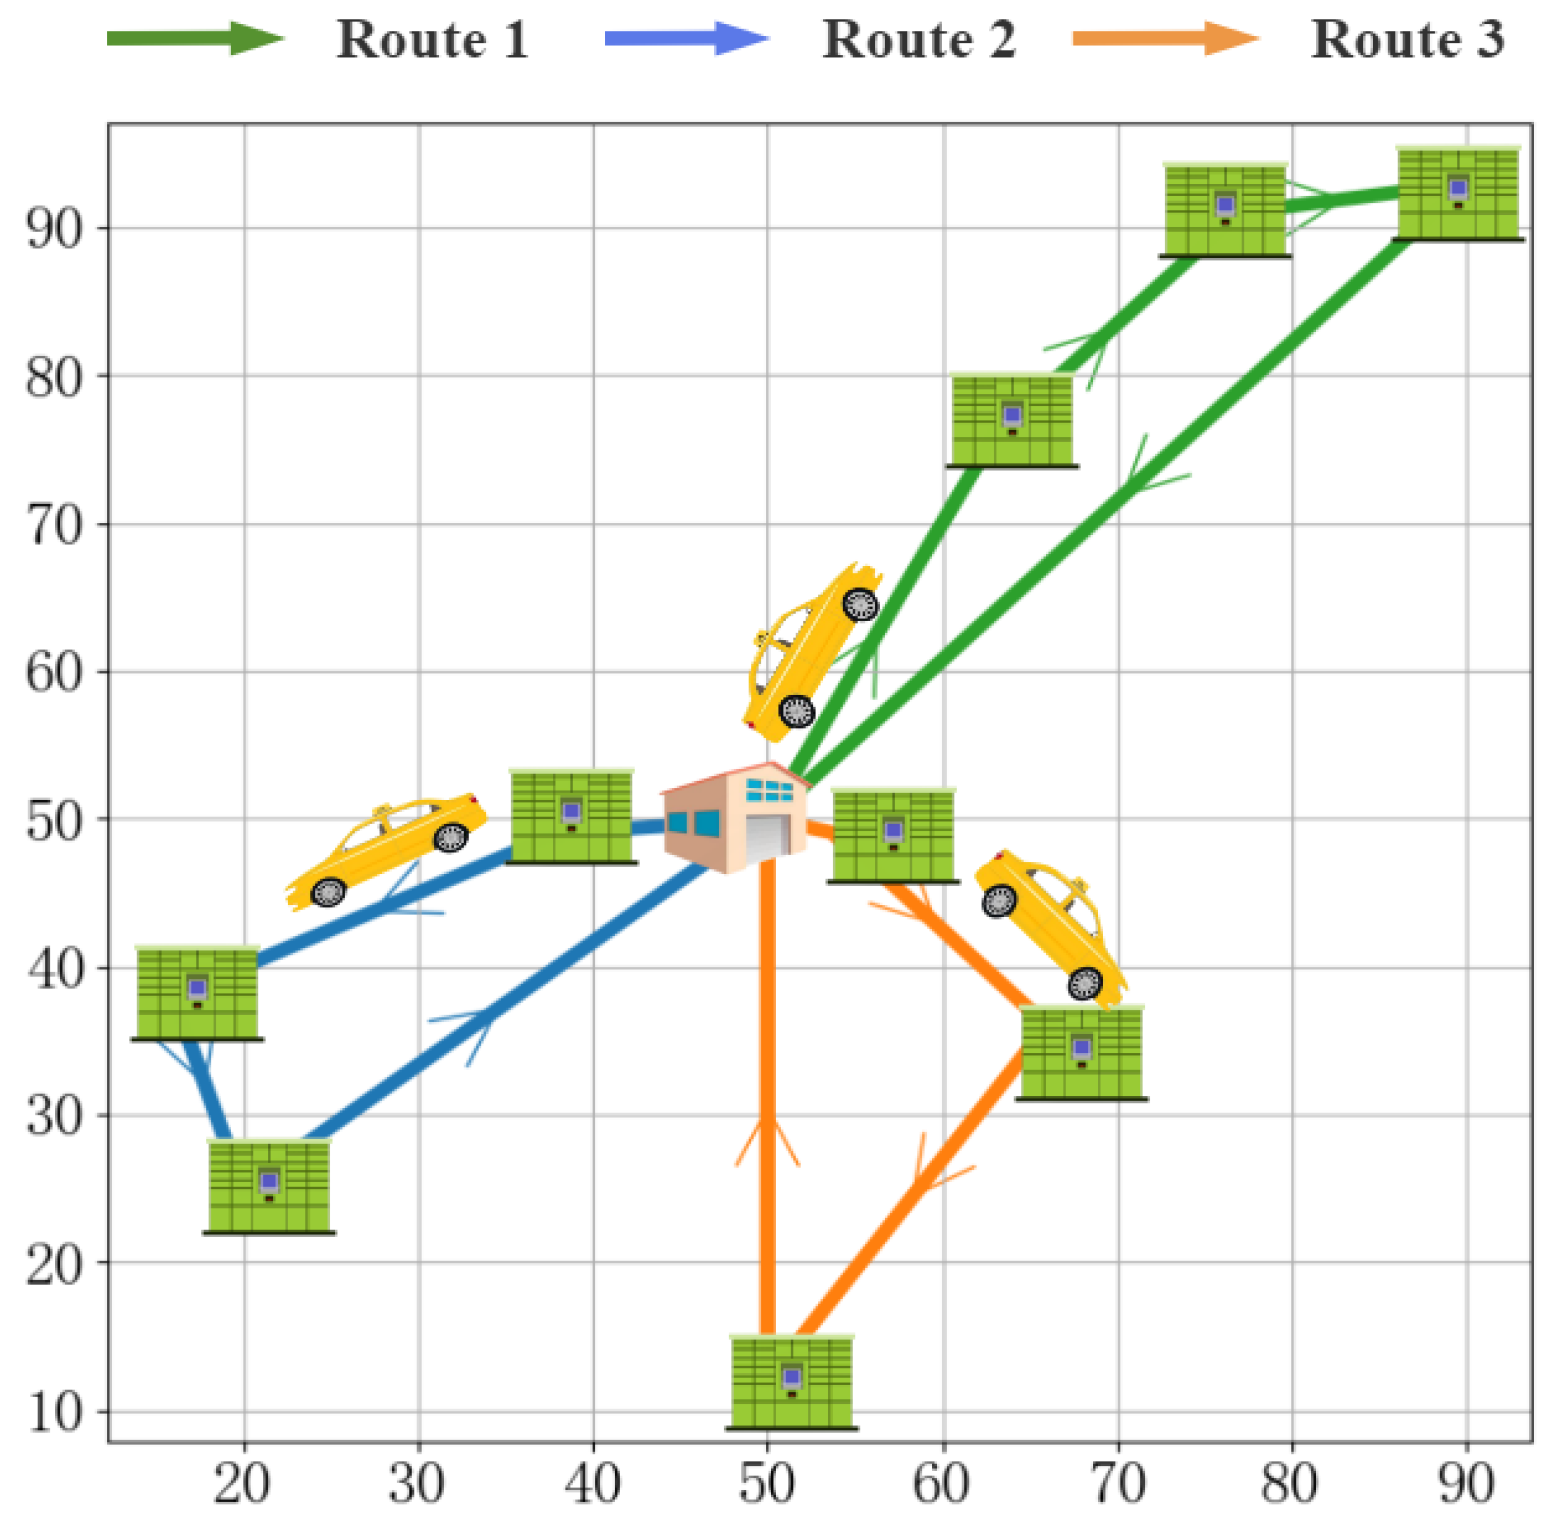
| Instance | Greedy Algorithm | Savings Mileage Method | ||
|---|---|---|---|---|
| Number of Vehicles | Total Distance (km) | Number of Vehicles | Total Distance (km) | |
| RC101-10 | 3 | 298.74 | 5 | 509.83 |
| RC101-25 | 7 | 723.36 | 12 | 1144.34 |
| RC101-50 | 16 | 1074.66 | 24 | 1906.22 |
| Id | x_coord (m) | y_coord (m) | Volume (dm3) | Start Time | End Time |
|---|---|---|---|---|---|
| 1 | 95 | 77 | 1.54 | 8 | 18 |
| 2 | 40 | 30 | 1.90 | 8 | 18 |
| 3 | 94 | 14 | 1.11 | 8 | 18 |
| 4 | 66 | 36 | 1.48 | 8 | 18 |
| 5 | 77 | 91 | 1.72 | 8 | 18 |
| 6 | 38 | 49 | 1.32 | 8 | 18 |
| 7 | 20 | 25 | 0.57 | 8 | 18 |
| 8 | 63 | 76 | 1.13 | 8 | 18 |
| 9 | 16 | 38 | 1.65 | 8 | 18 |
| 10 | 50 | 50 | 0 | 8 | 18 |
| Case | SARP | SARP-LTW | ||||||
|---|---|---|---|---|---|---|---|---|
| Re (¥) | RT(h) | CV | MV (¥) | Re (¥) | RT(h) | CV | MV (¥) | |
| C101-25 | 3258.16 | 0.10 | 0.16 | 3894.17 | 4399.56 | 0.09 | 0.15 | 5046.18 |
| C101-50 | 4877.91 | 0.11 | 0.14 | 5537.15 | 6461.48 | 0.14 | 0.13 | 7054.86 |
| C101-100 | 6178.84 | 1.5 | 0.12 | 6964.68 | 10,315.14 | 0.47 | 0.08 | 11,297.61 |
| R101-25 | 3257.44 | 0.13 | 0.13 | 4045.89 | 4399.56 | 0.09 | 0.15 | 5146.89 |
| R101-50 | 5410.64 | 0.15 | 0.15 | 6015.37 | 6461.48 | 0.16 | 0.13 | 6974.44 |
| R101-100 | 7065.41 | 1.3 | 0.96 | 7873.16 | 10,187.85 | 0.41 | 0.08 | 11,963.05 |
| RC101-25 | 3046.46 | 0.08 | 0.08 | 3517.39 | 3856.59 | 0.10 | 0.05 | 4315.84 |
| RC101-50 | 4112.66 | 0.15 | 0.13 | 4689.35 | 6242.41 | 0.13 | 0.12 | 6945.21 |
| RC101-100 | 7743.25 | 1.18 | 1 | 8369.23 | 10,302.96 | 0.51 | 0.26 | 11,703.06 |
| Case | SARP | SARP-LTW | ||||
|---|---|---|---|---|---|---|
| DR (%) | PR (%) | PST (h) | DR (%) | PR (%) | PST (h) | |
| C101-100 | 4.05 | 33.6 | 0.29 | 6.21 | 49.8 | 0.26 |
| R101-100 | 4.91 | 31.8 | 0.32 | 6.63 | 48.1 | 0.29 |
| RC101-100 | 8.66 | 26.3 | 0.41 | 9.89 | 45.3 | 0.38 |
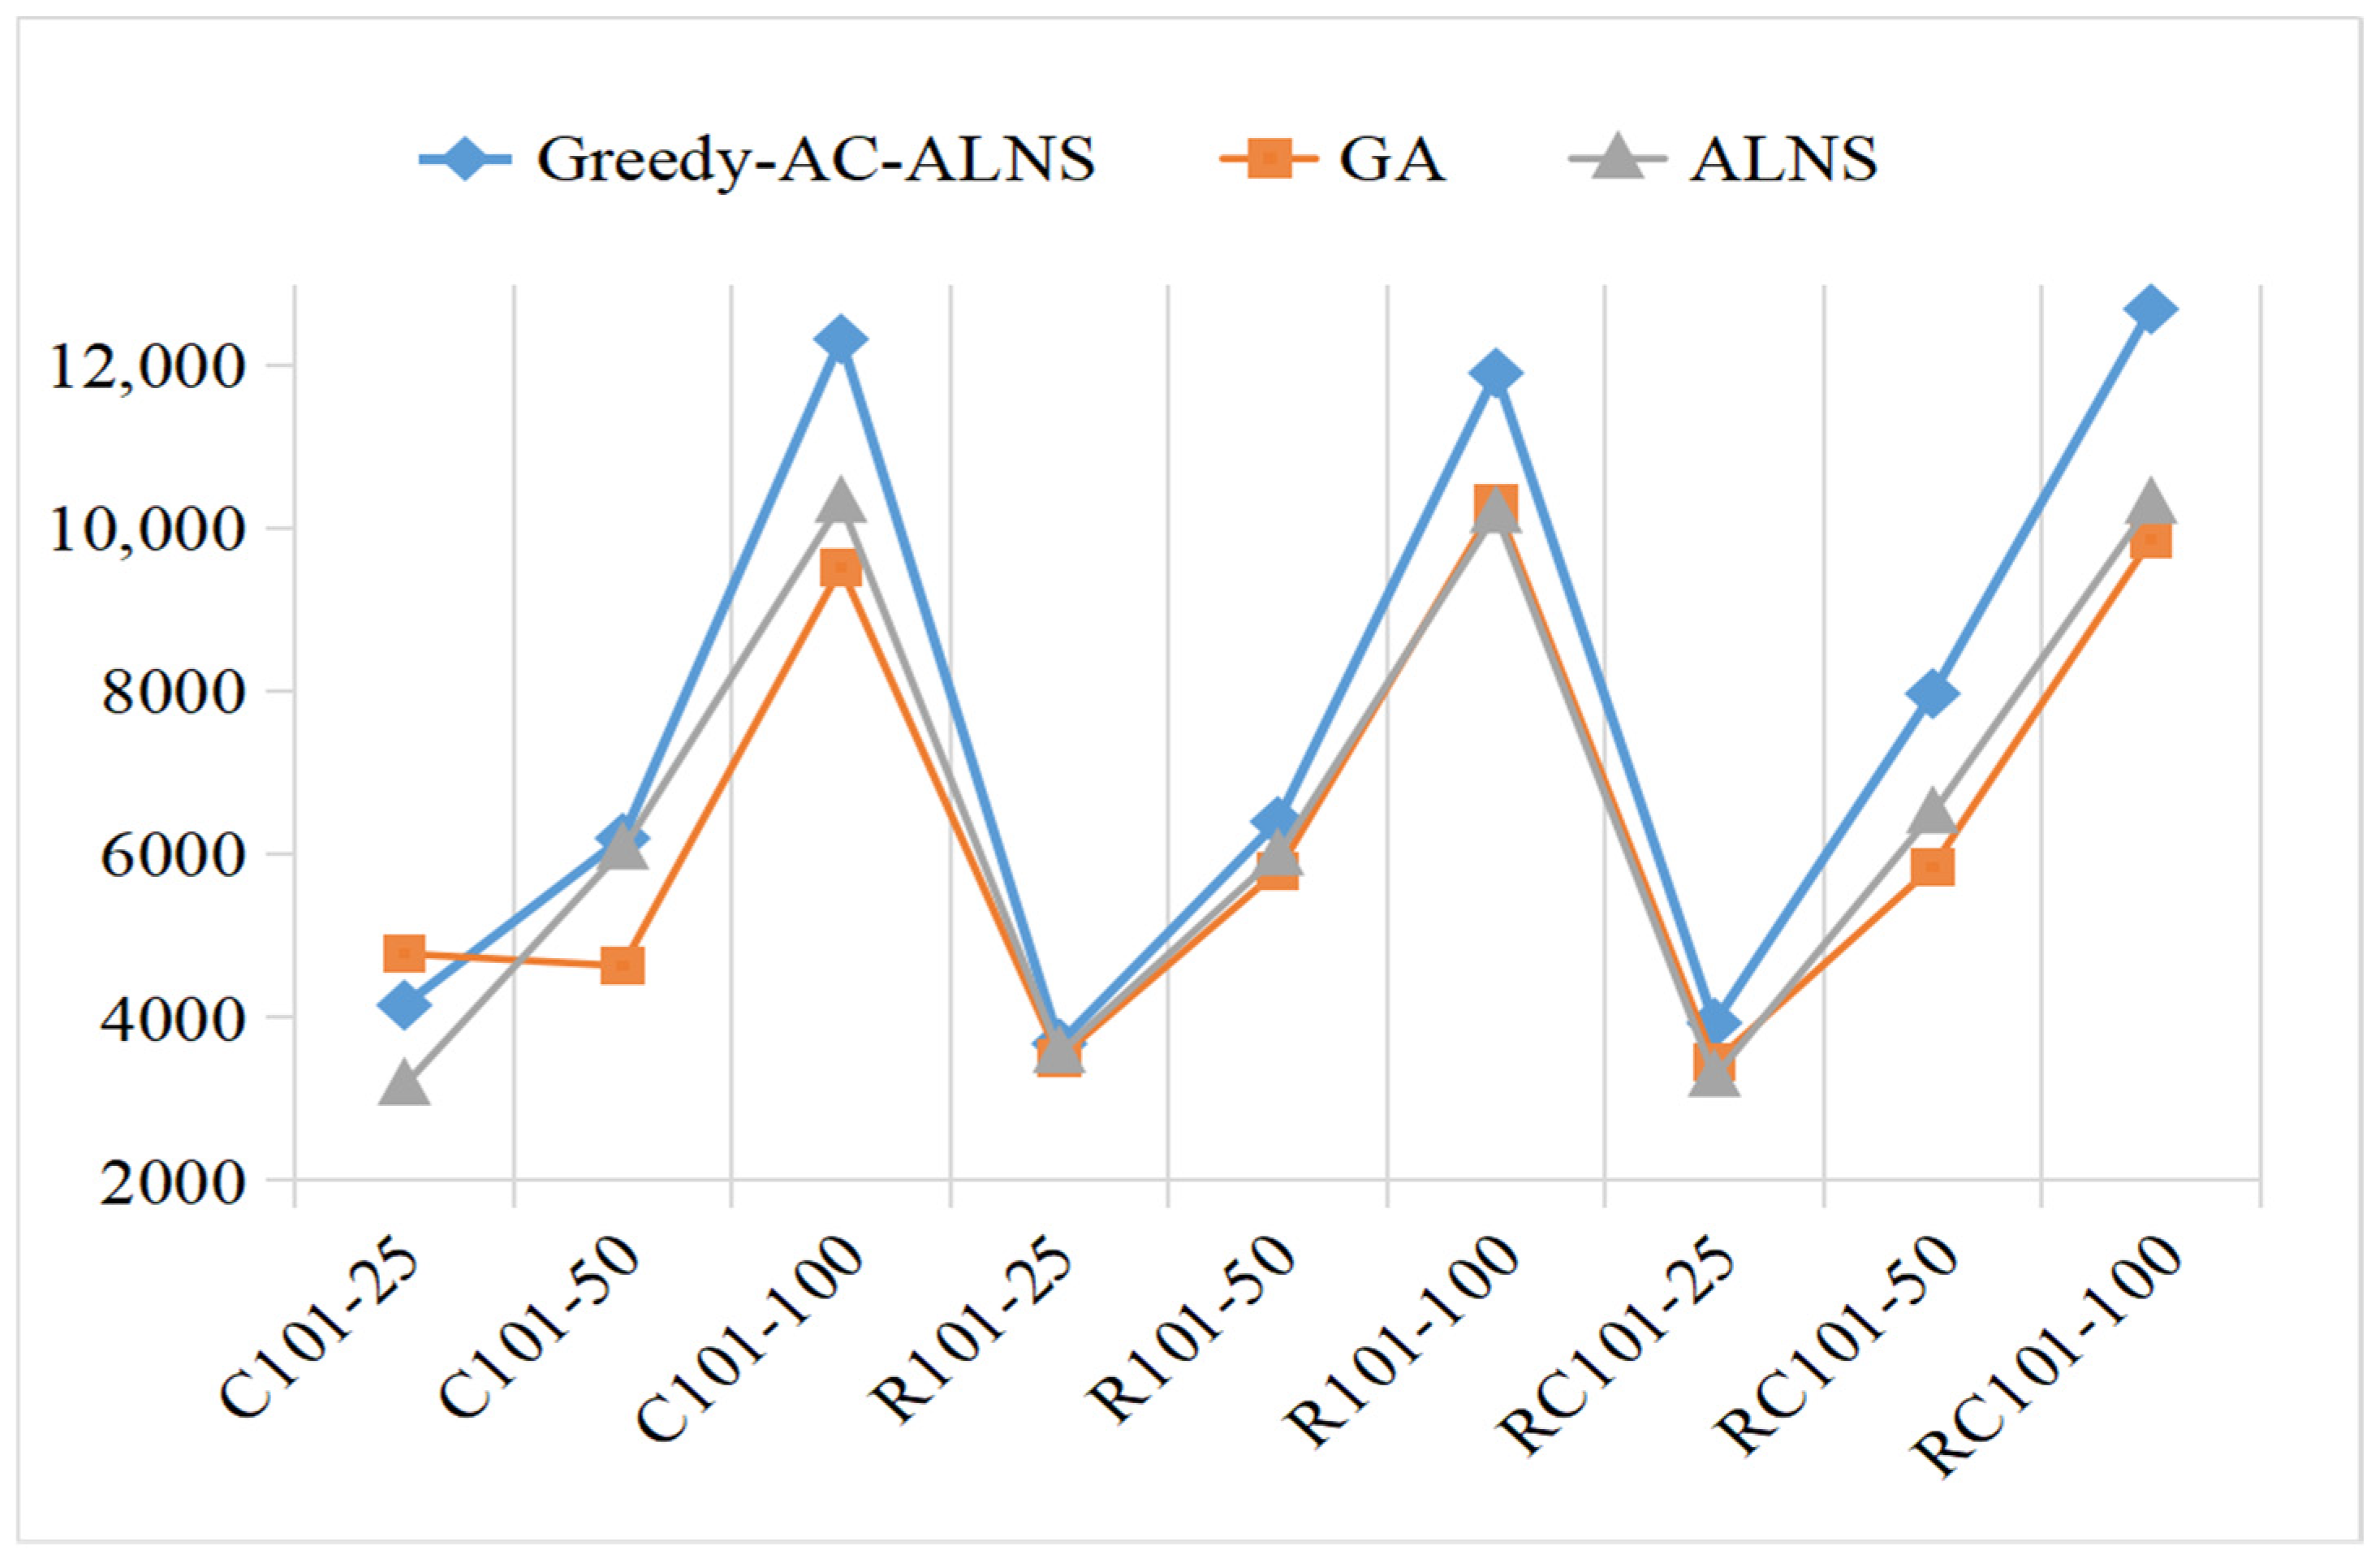
| Case | GA | ALNS | Greedy-AC-ALNS | ||||||
|---|---|---|---|---|---|---|---|---|---|
| Re (¥) | RT(s) | CV | Re (¥) | RT(s) | CV | Re (¥) | RT(s) | CV | |
| C101-25 | 4782.58 | 0.36 | 0.1 | 3167.85 | 0.09 | 0.15 | 4151.88 | 0.55 | 0.08 |
| C101-50 | 4632.91 | 0.72 | 0.12 | 6059.75 | 0.14 | 0.13 | 6200.42 | 0.46 | 0.16 |
| C101-100 | 9518.23 | 2.5 | 0.13 | 10,315.14 | 0.47 | 0.08 | 12,326.55 | 0.42 | 0.05 |
| R101-25 | 3507.46 | 0.34 | 0.25 | 3563.34 | 0.06 | 0.66 | 3679.75 | 0.35 | 0.13 |
| R101-50 | 5798.17 | 0.84 | 0.36 | 5986.37 | 0.15 | 0.2 | 6404.34 | 0.33 | 0.16 |
| R101-100 | 10,298.9 | 2.75 | 0.12 | 10,187.85 | 0.41 | 0.04 | 11,909 | 0.43 | 0.03 |
| RC101-25 | 3447.66 | 0.25 | 0.12 | 3271.24 | 0.05 | 0.05 | 3932.66 | 0.44 | 0.06 |
| RC101-50 | 5851.08 | 0.91 | 0.16 | 6503.55 | 0.13 | 0.12 | 7975.32 | 0.49 | 0.13 |
| RC101-100 | 9863.65 | 2.5 | 0.1 | 10,302.96 | 0.51 | 0.05 | 12,694.29 | 0.5 | 0.03 |
Disclaimer/Publisher’s Note: The statements, opinions and data contained in all publications are solely those of the individual author(s) and contributor(s) and not of MDPI and/or the editor(s). MDPI and/or the editor(s) disclaim responsibility for any injury to people or property resulting from any ideas, methods, instructions or products referred to in the content. |
© 2024 by the authors. Licensee MDPI, Basel, Switzerland. This article is an open access article distributed under the terms and conditions of the Creative Commons Attribution (CC BY) license (https://creativecommons.org/licenses/by/4.0/).
Share and Cite
Xue, S.; Zhang, Q.; Shiwakoti, N. Sharing a Ride: A Dual-Service Model of People and Parcels Sharing Taxis with Loose Time Windows of Parcels. Systems 2024, 12, 302. https://doi.org/10.3390/systems12080302
Xue S, Zhang Q, Shiwakoti N. Sharing a Ride: A Dual-Service Model of People and Parcels Sharing Taxis with Loose Time Windows of Parcels. Systems. 2024; 12(8):302. https://doi.org/10.3390/systems12080302
Chicago/Turabian StyleXue, Shuqi, Qi Zhang, and Nirajan Shiwakoti. 2024. "Sharing a Ride: A Dual-Service Model of People and Parcels Sharing Taxis with Loose Time Windows of Parcels" Systems 12, no. 8: 302. https://doi.org/10.3390/systems12080302