Article

FedResilience: A Federated Classification System to Ensure Critical LTE Communications During Natural Disasters

by
Alvaro Acuña-Avila
1,
Christian Fernández-Campusano
1,*,
Héctor Kaschel
1 and
Raúl Carrasco
2
1
Department of Electrical Engineering, Faculty of Engineering, University of Santiago de Chile (USACH), Santiago 9170124, Chile
2
Departamento de Contabilidad y Gestión Financiera, Facultad de Administración y Economía, Universidad Tecnológica Metropolitana, Santiago 7500998, Chile
*
Author to whom correspondence should be addressed.
Systems 2025, 13(10), 866; https://doi.org/10.3390/systems13100866
Submission received: 12 August 2025 / Revised: 23 September 2025 / Accepted: 30 September 2025 / Published: 2 October 2025
(This article belongs to the Special Issue Data-Driven Decision Making for Complex Systems)

Abstract

Natural disasters can disrupt communication services, leading to severe consequences in emergencies. Maintaining connectivity and communication quality during crises is crucial for coordinating rescues, providing critical information, and ensuring reliable and secure service. This study proposes FedResilience, a Federated Learning (FL) system for classifying Long-Term Evolution (LTE) network coverage in both normal operation and natural disaster scenarios. A three-tier architecture is implemented: (i) edge nodes, (ii) a central aggregation server, and (iii) a batch processing interface. Five FL aggregation methods (FedAvg, FedProx, FedAdam, FedYogi, and FedAdagrad) were evaluated under normal conditions and disaster simulations. The results show that FedAdam outperforms the other methods under normal conditions, achieving an F1 score of 0.7271 and a Global System Adherence ( S A global ) of 91.51%. In disaster scenarios, FedProx was superior, with an F1 score of 0.7946 and S A global of 61.73%. The innovation in this study is the introduction of the System Adherence (SA) metric to evaluate the predictive fidelity of the model. The system demonstrated robustness against Non-Independent and Identically Distributed (non-IID) data distributions and the ability to handle significant class imbalances. FedResilience serves as a tool for companies to implement automated corrective actions, contributing to the predictive maintenance of LTE networks through FL while preserving data privacy.

1. Introduction

The 2024 edition of the World Risk Report1 for Natural Disasters ranks Chile 39th out of 193 countries, categorizing it as one of the most dangerous countries on the planet.
Geography and access to resources have led to human settlements in areas vulnerable to natural disasters. However, the complexity of these locations complicates the maintenance of network components because they are not considered a priority during emergencies. It is essential to maintain connectivity and communication quality during crises to coordinate rescues, provide crucial information, and ensure the continuity of essential services.
Monitoring LTE networks is essential to ensure operational continuity in the event of disasters, as it enables Internet access for data, both for users and for industries and emergency organizations. However, natural disasters can disrupt communication services, which can have serious repercussions in emergency situations.
The susceptibility of telecommunications networks to natural disasters is a critical concern for emergency agencies because it hinders the deployment of rescue teams. A network failure can compromise coverage if a tower collapses or loses power, leading to overload on nearby towers. The National Disaster Risk Management Unit (UNGRD2) the Ministry of Education of Chile (Mineduc) coordinates mitigation and response actions for disasters affecting the educational system and educates the public on natural disasters.
To address these issues, a robust system is required to ensure Internet connectivity for as long as possible during natural disasters. Therefore, it is proposed to develop a Machine Learning (ML) model using Federated Learning (FL) techniques for the classification of LTE network coverage, thus ensuring dependability. FL [1,2,3] enables the collaborative training of an ML model from multiple devices without compromising the privacy and security of information [4].
This study is a tool that helps companies make informed decisions to implement automated corrective actions, making it easier for LTE network personnel to perform corrective maintenance by leveraging the collaborative nature of FL. By classifying LTE coverage, companies can strengthen infrastructure in areas with deficiencies and establish alternative routes to ensure a resilient network during natural disasters. This study lays the groundwork for improving the resilience of LTE networks in disaster-prone areas, thereby contributing to a more efficient response.
The remainder of this paper is organized as follows. The Background section addresses key concepts such as LTE and LTE network coverage, FL, and the natural disasters in Chile. The Related Work section reviews the pertinent literature on mobile coverage prediction, machine learning techniques for network optimization, and applications of FL in distributed networks. Subsequently, the Methods section details the employed methodology, including data collection and processing, implementation of FL aggregation methods, and simulations of network degradation. The Proposed Design section describes the architecture of the FedResilience system, including the FL topology, multiparametric classification framework, and adaptive aggregation strategies. The Results and Discussion section presents and analyzes the results obtained under normal operating conditions and simulated natural disaster scenarios. Finally, the Conclusions and Future Work section summarizes the main findings of this study and proposes directions for future research.

2. Background

This section examines the LTE network coverage, FL, and the occurrence of natural disasters in Chile. Mobile network coverage is crucial for ensuring service quality and availability, particularly during natural disasters. LTE and 5G technologies have specific characteristics that affect the range and transmission speed, as well as infrastructure implementation challenges. Parameters such as RSRP and RSRQ enable the objective evaluation of coverage and service quality, serving as key indicators for optimizing modern mobile networks.

2.1. Communication Network Coverage

The coverage of LTE networks represents the extent and quality of the communication services that these technologies can offer users. Each technology has distinct characteristics that affect its performance and coverage.
LTE Network Coverage: LTE is a fourth-generation (4G) communication technology designed to improve data transmission speeds in mobile networks, allowing download speeds of up to 300 Mbps and upload speeds of up to 75 Mbps [5]. It employs advanced multiplexing techniques to optimize data transmission and meet the growing demand for mobile connectivity [6]. LTE faces challenges such as traffic management and efficient resource utilization in mobile networks [7]. To improve coverage and reduce interference, heterogeneous network models that integrate LTE with technologies such as Wi-Fi have been proposed [8].
5G Network Coverage: 5G technology promises to deliver higher data speeds, lower latency, and greater connection capacity compared to LTE [9]. The improvements of 5G are achieved through the use of higher frequency bands, which allow for greater capacity, although they also require denser deployments owing to propagation loss as frequency increases [10]. 5G coverage faces the challenge of ensuring uniform deployment across large areas, which demands the installation of multiple small cells, as opposed to the macrocells used in LTE [11]. The use of technologies such as Massive MIMO and mmWave helps to extend coverage and increase capacity in 5G networks [12].
While LTE provides extensive coverage with reasonable speeds, 5G offers significant improvements in terms of speed and connectivity, but presents challenges related to deployment density and uniform coverage. Network operators must meticulously plan the infrastructure to maximize the potential of both technologies and ensure continuous and efficient network coverage [10,13].
Reference Signal Received Power (RSRP): RSRP represents the power level of a specific reference signal transmitted by a cellular tower. This parameter is essential for assessing the signal strength received by user equipment (UE), such as mobile phones. The RSRP is crucial for various functions, such as handovers, cell selection, and mobility management. Additionally, it enables network operators to evaluate signal coverage and optimize network configurations to improve connectivity and performance [14,15].
Reference Signal Received Quality (RSRQ): RSRQ, on the other hand, assesses the quality of the reference signal. It is defined as the ratio between the RSRP and the total received power within the network, including both the interference and noise. This metric is valuable for determining the signal quality, as it considers both the signal strength and the level of interference. Effective network planning and optimization strategies often incorporate RSRQ to enhance the user experience and ensure reliable connectivity, especially in ultra-dense network environments [16,17].
The RSRP and RSRQ are fundamental parameters in wireless communication systems. These parameters are essential for evaluating the effectiveness of network deployment and guiding improvements in network performance and Quality of Service (QoS).

2.2. Federated Learning

FL is an innovative approach in the field of machine learning that enables collaborative model training without the need to exchange data in a centralized manner. This paradigm significantly promotes privacy preservation and reduces communication costs, making it suitable for various applications in different contexts [18]. The main advantage of FL lies in its ability to address issues related to data isolation and privacy, as the data remain decentralized at their source, which is crucial in sensitive fields such as healthcare. In the health sector, FL is integrated with IoT devices and remote monitoring systems to provide decentralized real-time data processing, improve predictive analysis, and personalize patient care while respecting patient privacy and complying with regulatory requirements [19].
Network security is another critical area that benefits from FL. By employing attention-based graph neural networks in federated environments, the accuracy of network-attack detection can be improved while protecting data privacy on distributed devices. This underscores FL’s ability of FL to maintain robust network security without compromising data integrity [20].
FL is revolutionizing the way industries approach decentralized and privacy-preserving ML. Its integration with other technologies, such as blockchain, significantly enhances security and performance, broadening the applicability of FL to various fields [21]. The continuous evolution of FL methods promises to improve the privacy and performance of intelligent systems, enabling broader and more secure applications in real-world scenarios [22].

2.3. Natural Disasters

Chile has been a leader in the implementation of 5G technology in Latin America, which has significantly impacted emergency services. 5G connections continue to expand, covering a large part of the country and enhancing the response capacity in critical situations. According to the Subsecretariat of Telecommunications (SUBTEL) [23], this technology has optimized connectivity, and by December 2024, the country recorded more than 5 million 5G connections, representing a 70.3% increase compared to the previous year. This is crucial in critical situations, such as natural disasters, accidents, fires, or major mass events, where real-time communication between various security and emergency agencies is essential [24].
Strategies to improve resilience include responding to demand and reorganizing the network topology after a disaster to ensure that critical loads are restored as quickly as possible. A two-stage approach, which first reconstructs the distribution network after a disaster and then optimizes the demand response, has proven effective in maximizing the socioeconomic value of network restoration [25].
In the context of communication networks, resilience also involves developing the ability to quickly recover and adapt the network structure to mitigate the impact of similar future events. This is particularly relevant for energy systems, where robustness and resilience are evaluated not only in terms of the ability to withstand disruptive events but also in terms of how quickly the service can be restored and the infrastructure adapted [26].
FL provides significant advantages in terms of network resilience and efficiency. For example, it helps mitigate privacy concerns by ensuring that sensitive data remain on the local device without being transmitted to central servers [27,28]. This feature of FL is essential for maintaining data integrity and user trust, both of which are crucial for resilient network operation.
FL addresses challenges related to data heterogeneity. It can adapt to variations in data distribution, which helps solve a major problem given the non-IID nature of data on each device [29]. Solutions such as FedAvg and joint optimization algorithms have proven effective in harmonizing discrepancies in data distribution, thereby improving model accuracy and reducing latency [30].
FL offers the opportunity to optimize the energy efficiency of network operations, which is a fundamental aspect of resilience. By minimizing the need to transmit data to central servers and enabling model training directly on the device, the communication overhead and energy consumption are reduced [27].
This study proposes the application of FL to classify LTE network coverage by considering environmental and electrical factors. The objective is to develop a robust global model that can operate in a distributed manner, preserve data privacy, and adapt to changing network conditions during disasters. This approach allows for the determination of secure routes for information to the cloud [31], thus contributing to companies’ ability to perform predictive maintenance and to improve network resilience. The application of FL in this context addresses data privacy and heterogeneity challenges, which are critical in emergency situations, while optimizing the energy efficiency of network operations.

3. Related Work

In the field of mobile communication networks, the RSRP and RSRQ parameters have become key indicators for evaluating the performance of LTE networks under various environmental conditions [32]. These metrics provide essential information about the signal strength and quality, respectively [33]. Additionally, the Signal-to-Interference-plus-Noise Ratio (SINR) and Channel Quality Indicator (CQI) are significant metrics used to assess network performance and determine the appropriate modulation and coding schemes [34].
In 5G New Radio (NR) networks, new metrics such as Synchronization Signal Reference Signal Received Power (SS-RSRP), Synchronization Signal Reference Signal Received Quality (SS-RSRQ), and signal-to-interference-plus-noise methods (SS-RINR) have been introduced to account for the distinctive features of 5G technology [35]. The use of millimeter wave frequencies and beamforming in 5G requires the development of new performance indicators that can address the complexity of systems based on multiple-input multiple-output (MIMO) and beamforming [36].
Several environmental factors affect signal propagation, although this has not been specifically studied for 5G. For example, atmospheric pressure significantly affects the thermal parameters of semiconductor devices [37,38], which can influence the performance of the electronic components used in 5G infrastructure.
Traditional centralized ML approaches have been widely used for signal quality classification and network traffic in various contexts [39,40]. However, these approaches have significant limitations, particularly in disaster scenarios, where conventional communication technologies may become inoperable [41].
To address these limitations, FL has emerged as a promising technique for distributed training of telecommunications models. FL enables model training without sharing sensitive data, which is particularly beneficial in contexts with heterogeneous or decentralized data [42]. In the context of 6G networks, FL is a distributed computing paradigm that facilitates the collaborative generation of value from data, preserving privacy and reducing communication overhead [43,44].
However, FL is not without challenges, such as potential security threats during training [45] and excessive communication costs due to the transmission of redundant parameters [46]. Research continues in areas such as optimizing communication efficiency, enhancing security, and adapting to non-IID data to maximize the potential of FL in the telecommunications sector [47].
According to the literature review shown in Table 1, no explicit application of FL for the classification of LTE, 4G, and 5G coverage has been identified in the context of natural disasters. This study specifically focuses on the classification of LTE, which can be considered a significant contribution to the body of knowledge in this field.

4. Materials and Methods

This study proposes a batch model for classifying LTE network coverage that integrates both electrical and environmental factors using FL. The proposed approach is illustrated in Figure 1, which shows the workflow based on the FL.
Figure 1 shows the LTE network coverage classification process using FL.
The pipeline of the classification process is defined as:

4.1. Dataset

In 2024, data were collected from each node of the different communication networks every 10 min. The LTE communication networks are located in various geographical locations at more than 4000 m above sea level, each corresponding to a unique client. These clients are referred to as clients 1, 2, 3, 4, and 5. A variable amount of data was recorded for each client because, owing to geographical conditions, it was not possible to repair the device responsible for data acquisition in some cases.
The attributes of the dataset are as follows:
  • Timestamp.
  • Temperature (°C).
  • Pressure hPa (hectopascales).
  • Direct Current Idc (A).
  • Continuous Voltage Vdc (V).
  • Alternating RMS voltage. Vac (V).
  • Provider.
  • Technology LTE.
  • RSRQ: The quality of the received signal was measured in dB.
  • Network Coverage, Class: good (>−90 dBm), fair (−90 to −109 dBm) or poor (<−109 dBm), where 0 indicates a poor signal, 1 indicates a good, and 2 indicates a fair.
Note: This analysis uses the Smartflex industrial router [88]. Web scraping was performed to obtain the RSRQ and RSRP values. The coverage classification was based on the LTE network’s RSRP, which determined the validation pattern for the classification model. A 10-minute interval is suitable for capturing relevant trends in the parameters being monitored, such as temperature, atmospheric pressure, voltage, and current, because this study focuses on identifying long-term patterns and trends in network coverage during disaster situations, rather than momentary situations.
The data presented in Table 2 correspond to Client Node 1. At this node, 22,800 data points were recorded at 10-minute intervals from 28 June to 13 December 2024. This is because the node was not operational from January until 27 June 2024.

Exploratory Data Analysis (EDA)

Exploratory Data Analysis revealed important characteristics of the dataset.
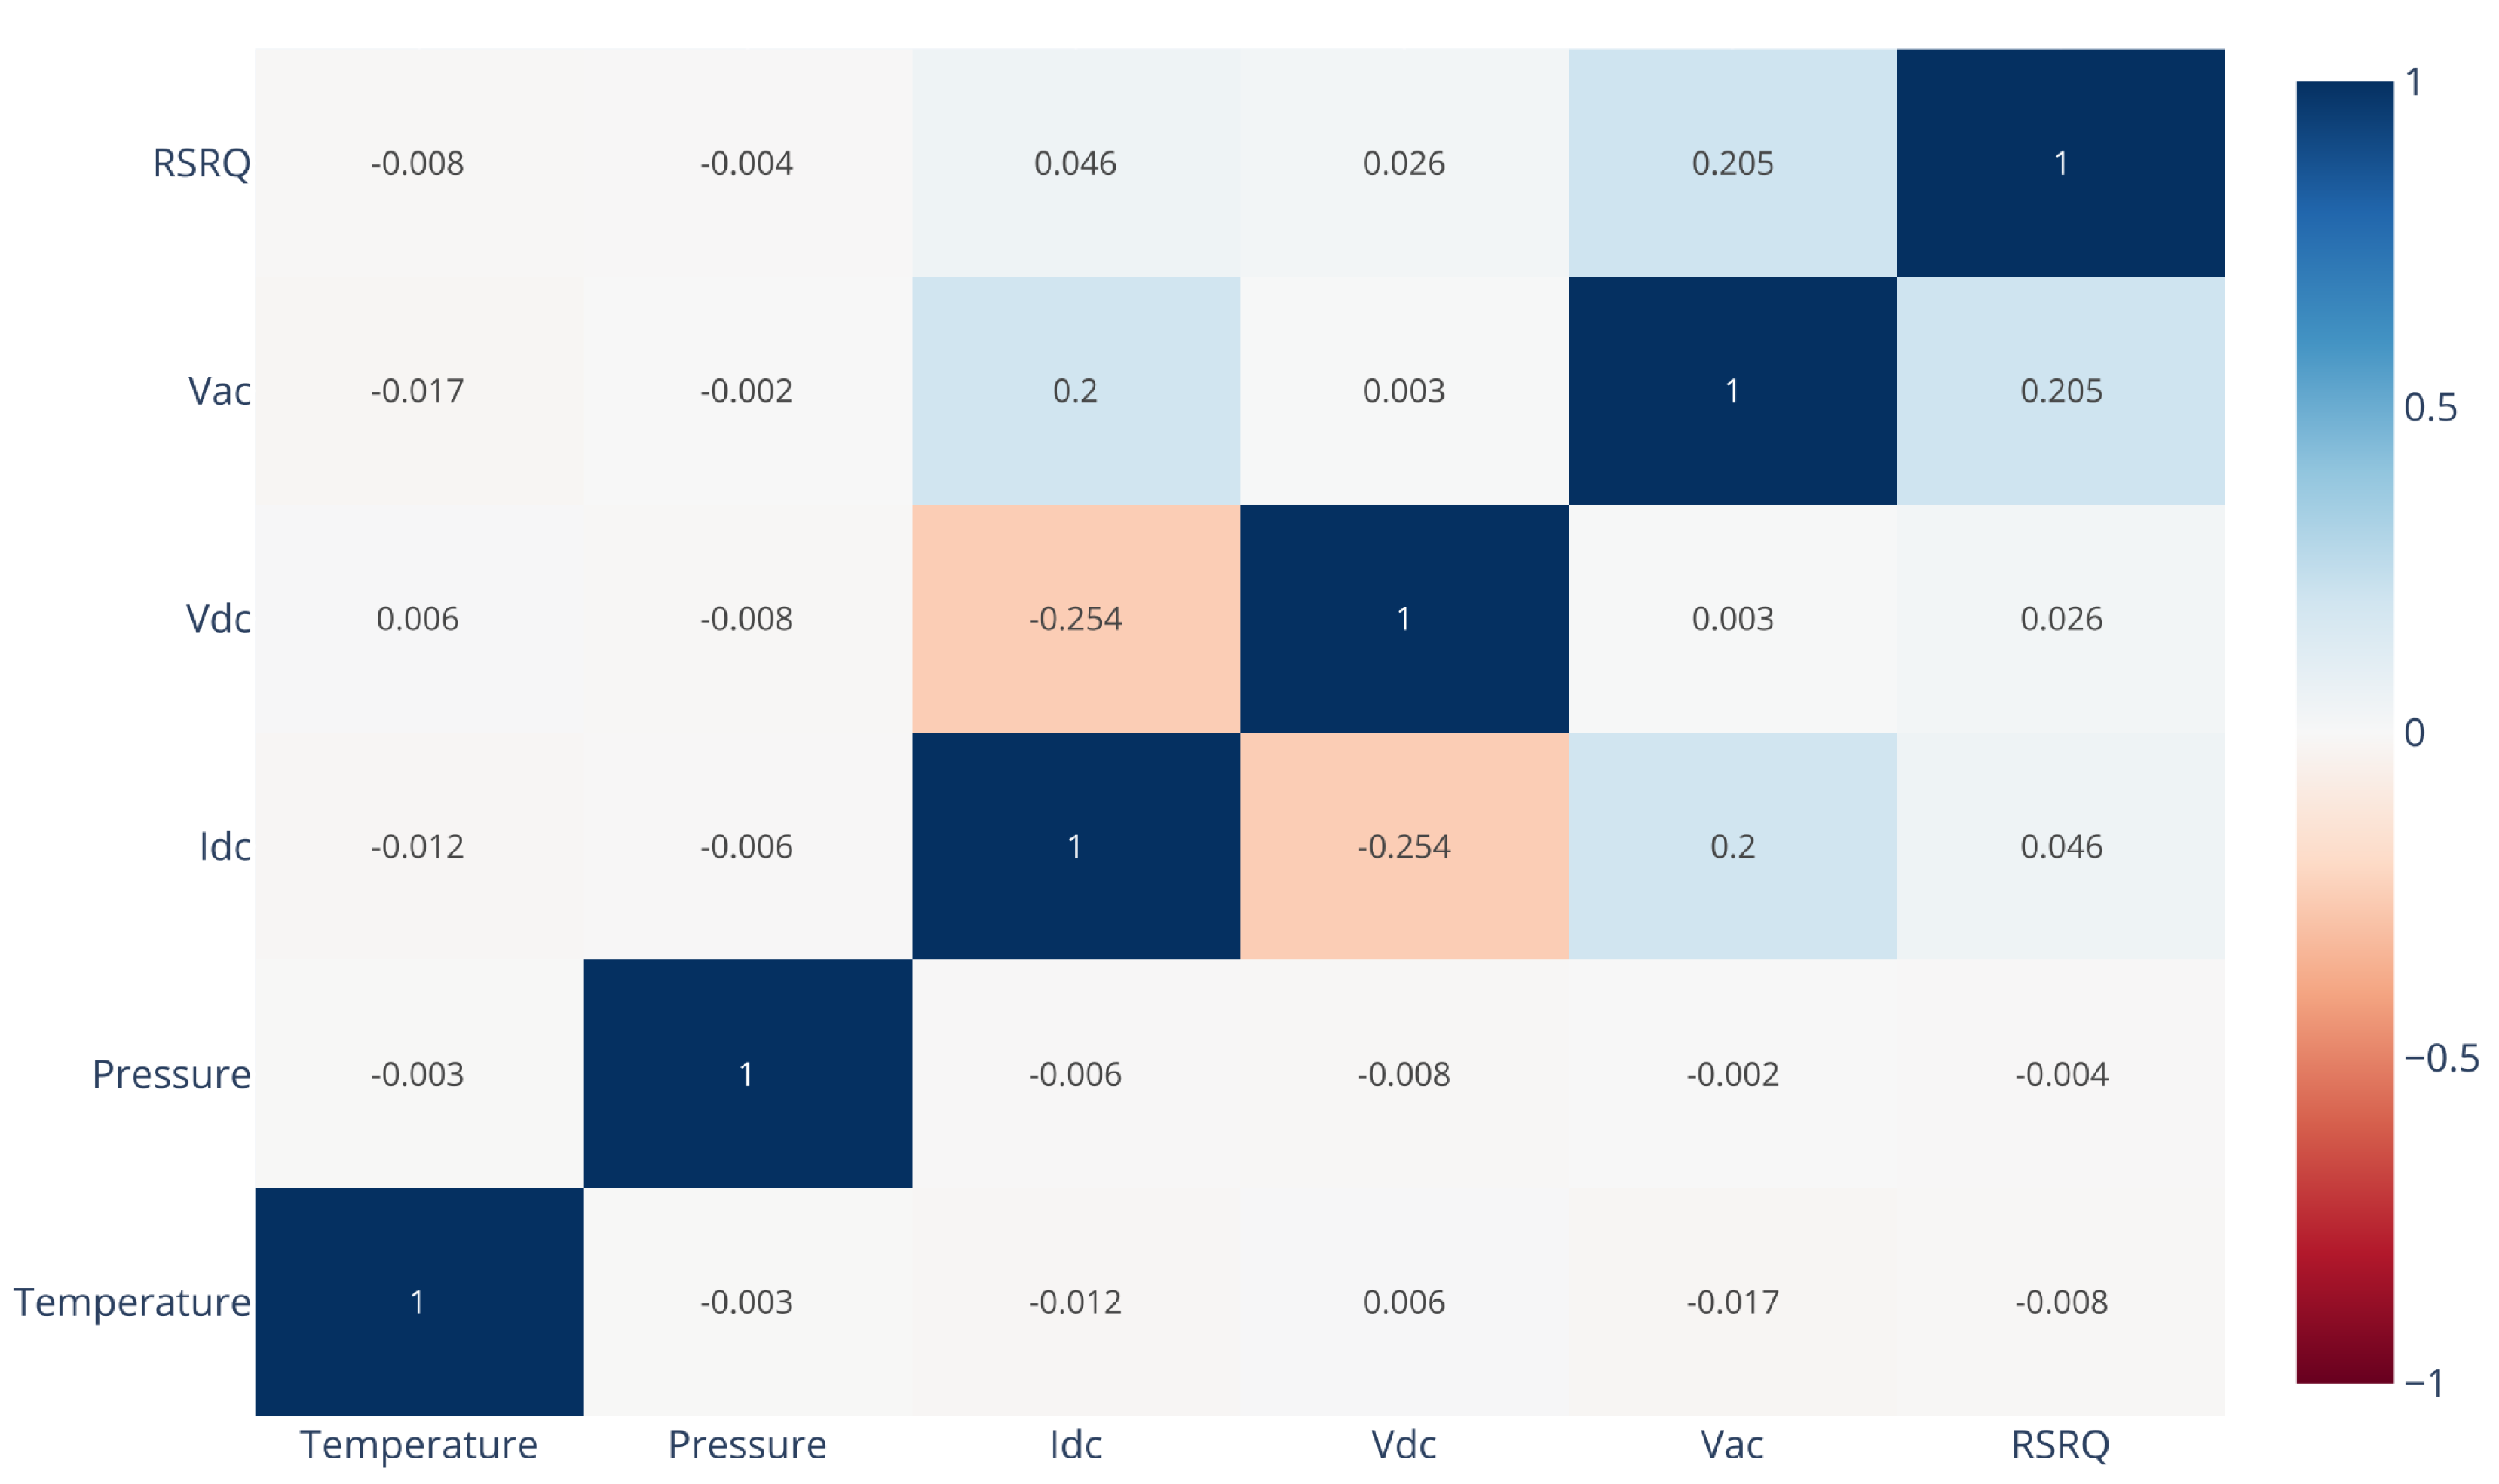
In Figure 2, weak relationships are observed among most of the attributes of client node 1. The most significant correlation was found between direct current (Idc) and direct voltage (Vdc), with a negative coefficient of −0.254, indicating a moderate inverse correlation. The other variables showed correlations close to zero, suggesting statistical independence between the environmental parameters (temperature and pressure), signal quality (RSRQ), and electrical metrics (Vac, Vdc, and Idc).
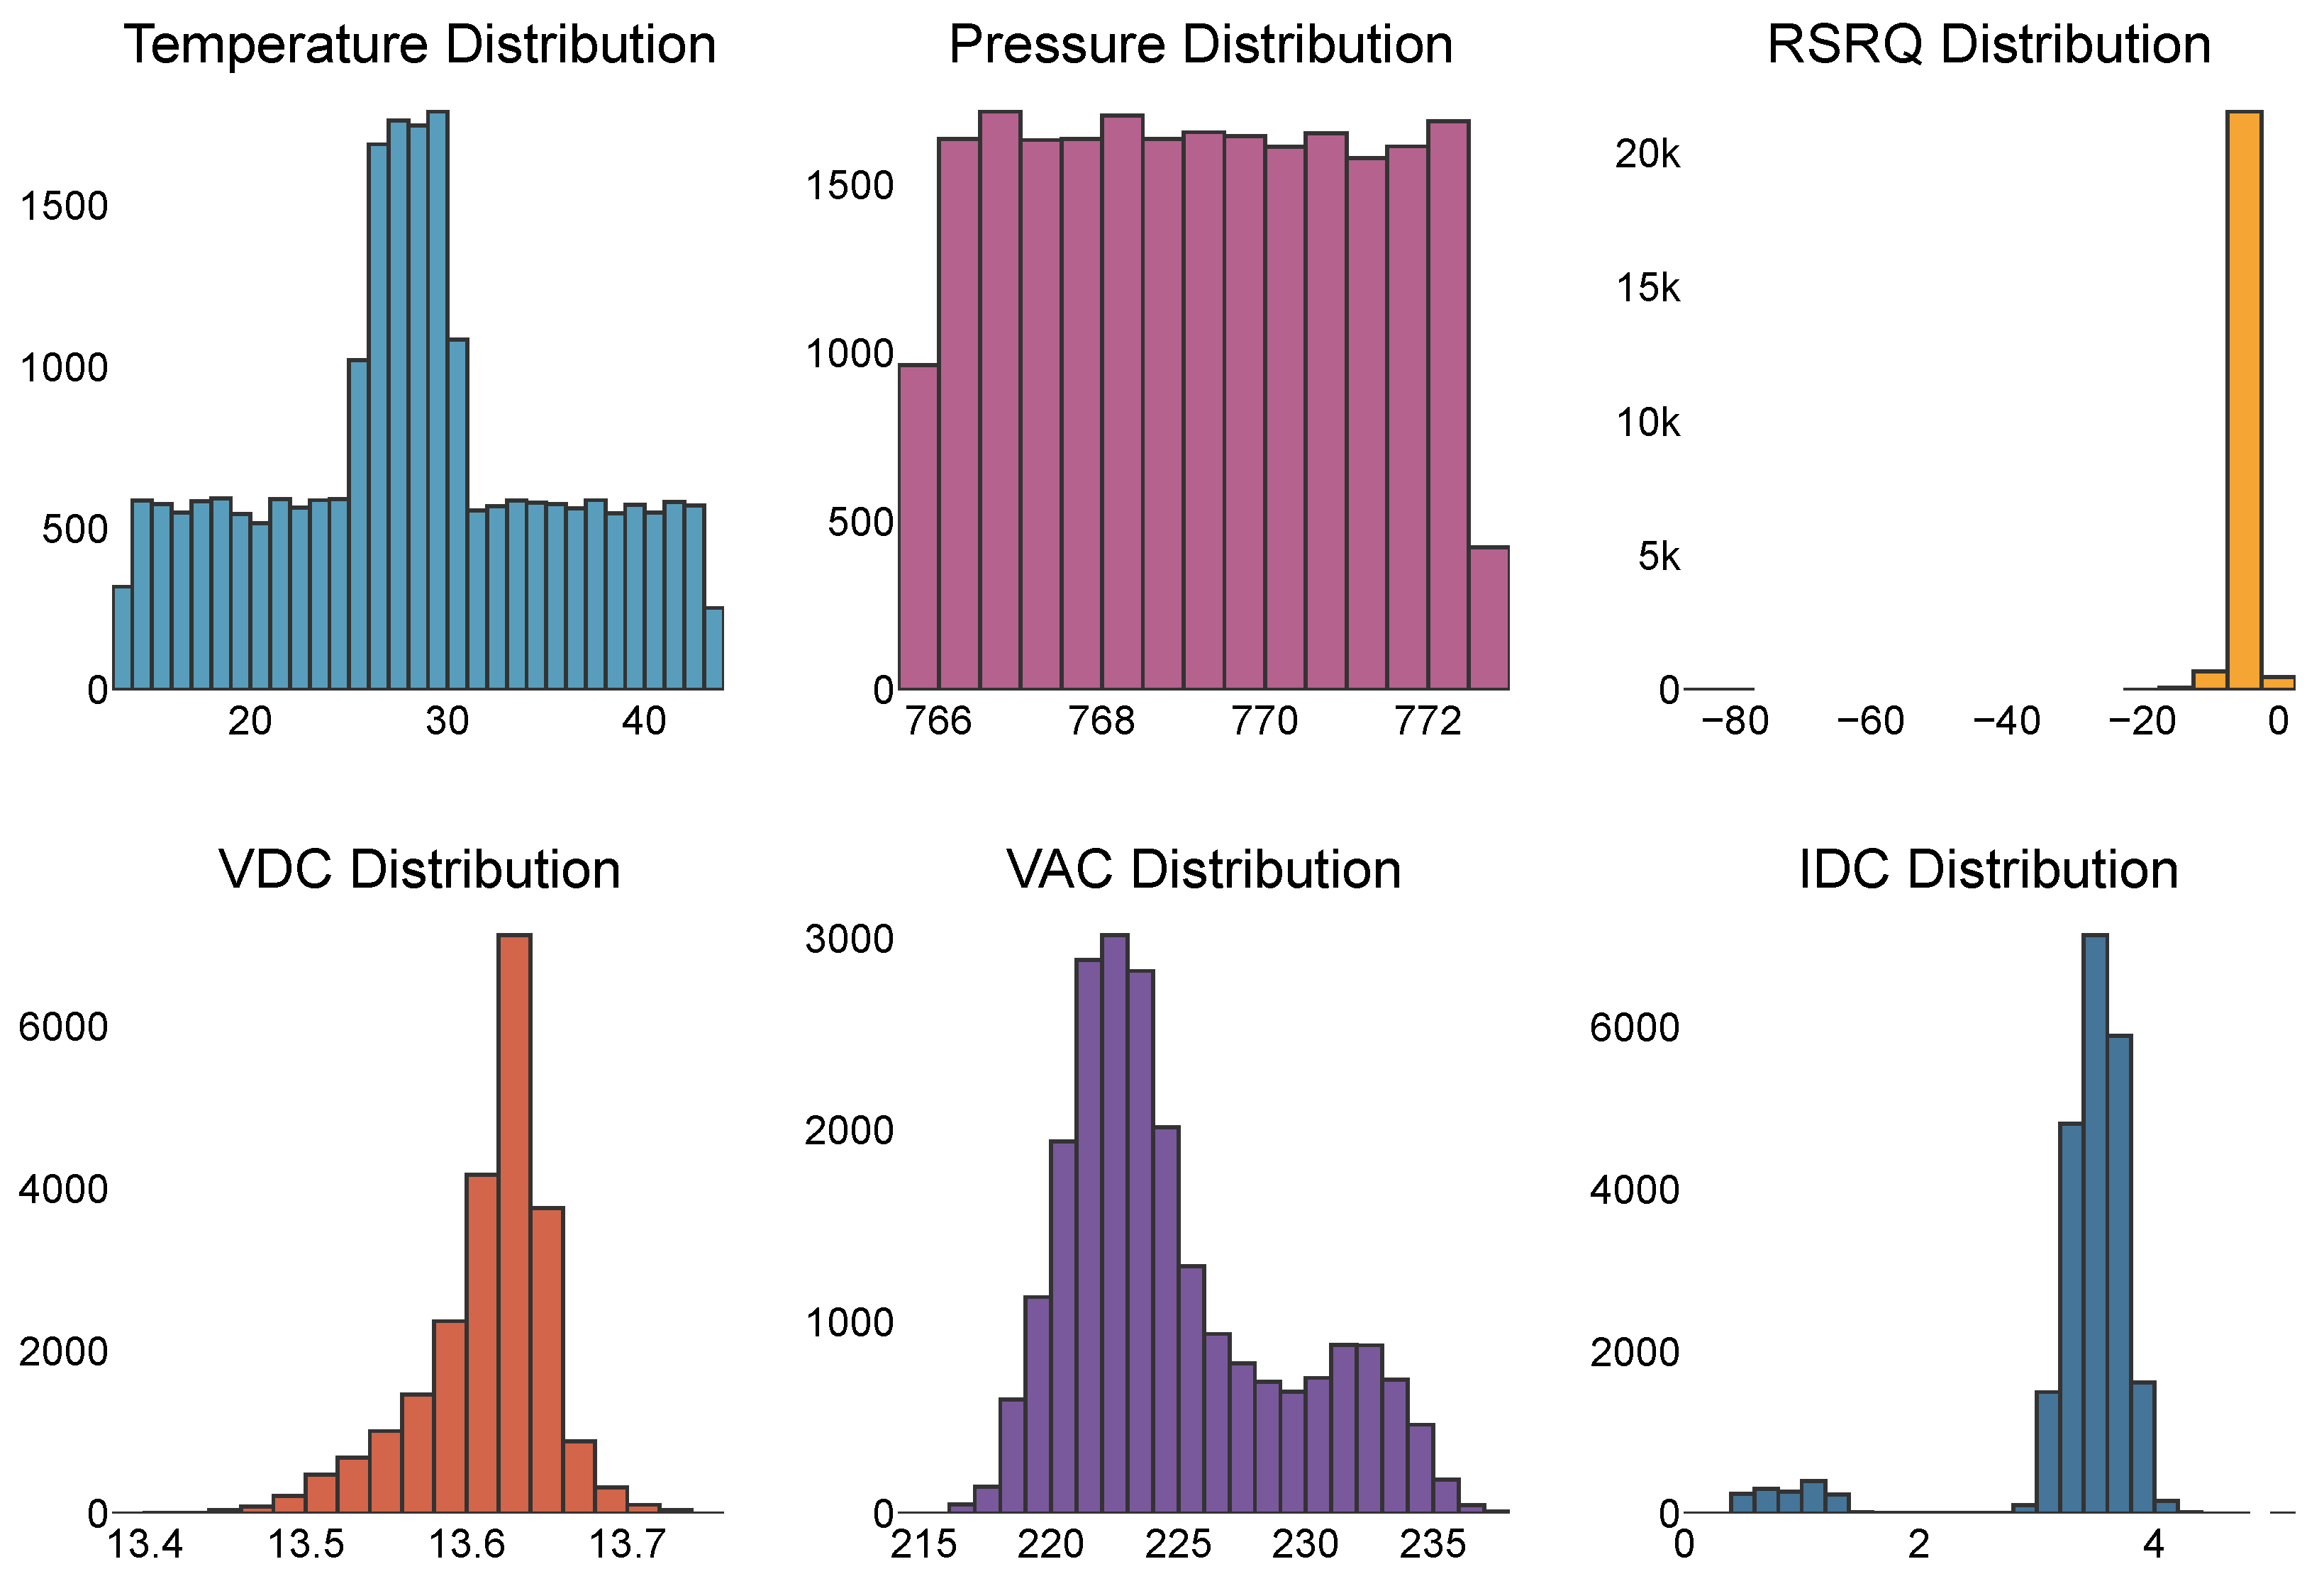
Figure 3 indicates that the temperature follows an approximately normal distribution centered at 30 °C. The atmospheric pressure was uniformly distributed between 766 and 772 hPa. The RSRQ concentration showed high values (close to 0 dB), suggesting good signal quality. The DC voltage displayed a narrow normal distribution of approximately 13.6 V. The AC voltage exhibited a bimodal distribution with peaks at 220 V and 230 V. The DC current was strongly concentrated near 4A, with some outliers.
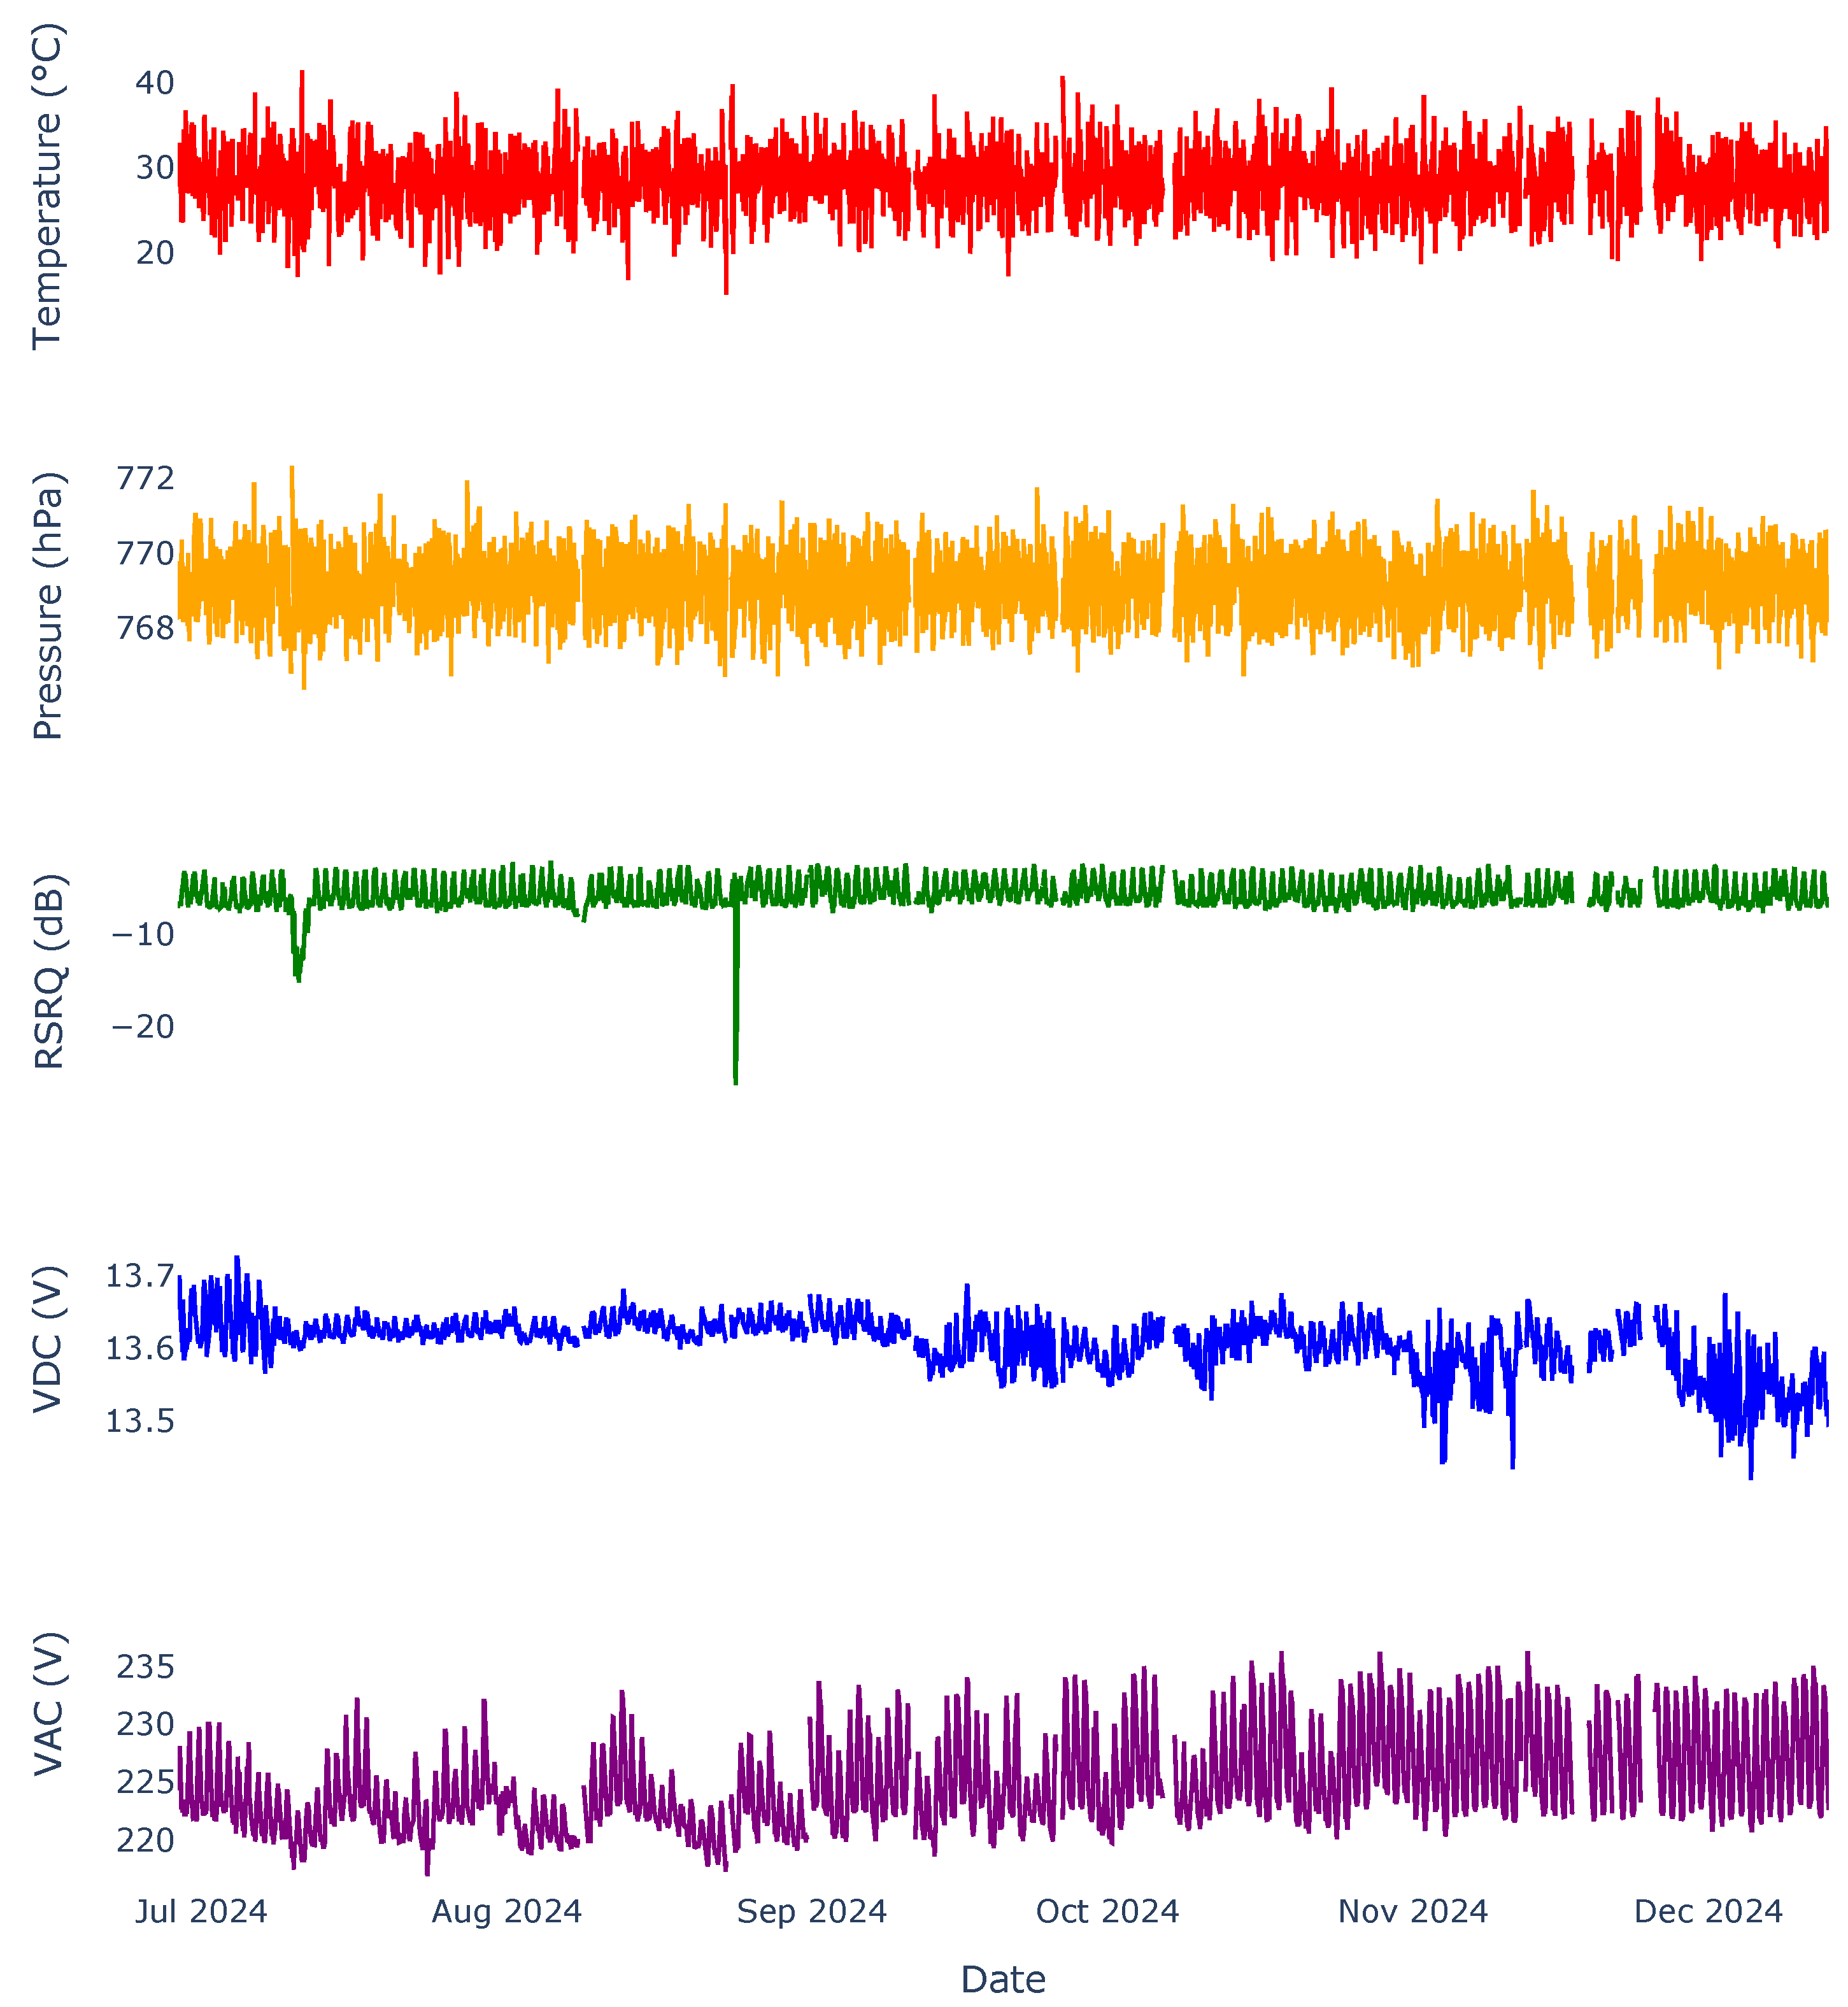
In Figure 4, the environmental variables appear stable, whereas the electrical parameters show fluctuations. The temperature and pressure exhibited normal variations without significant trends. Regarding the RSRQ, two severe degradation events were observed (−25 dB), possibly related to service interruptions or adverse network conditions. The AC and DC voltages exhibited variability over time, with the DC voltage showing progressive degradation toward the end of the observation period.
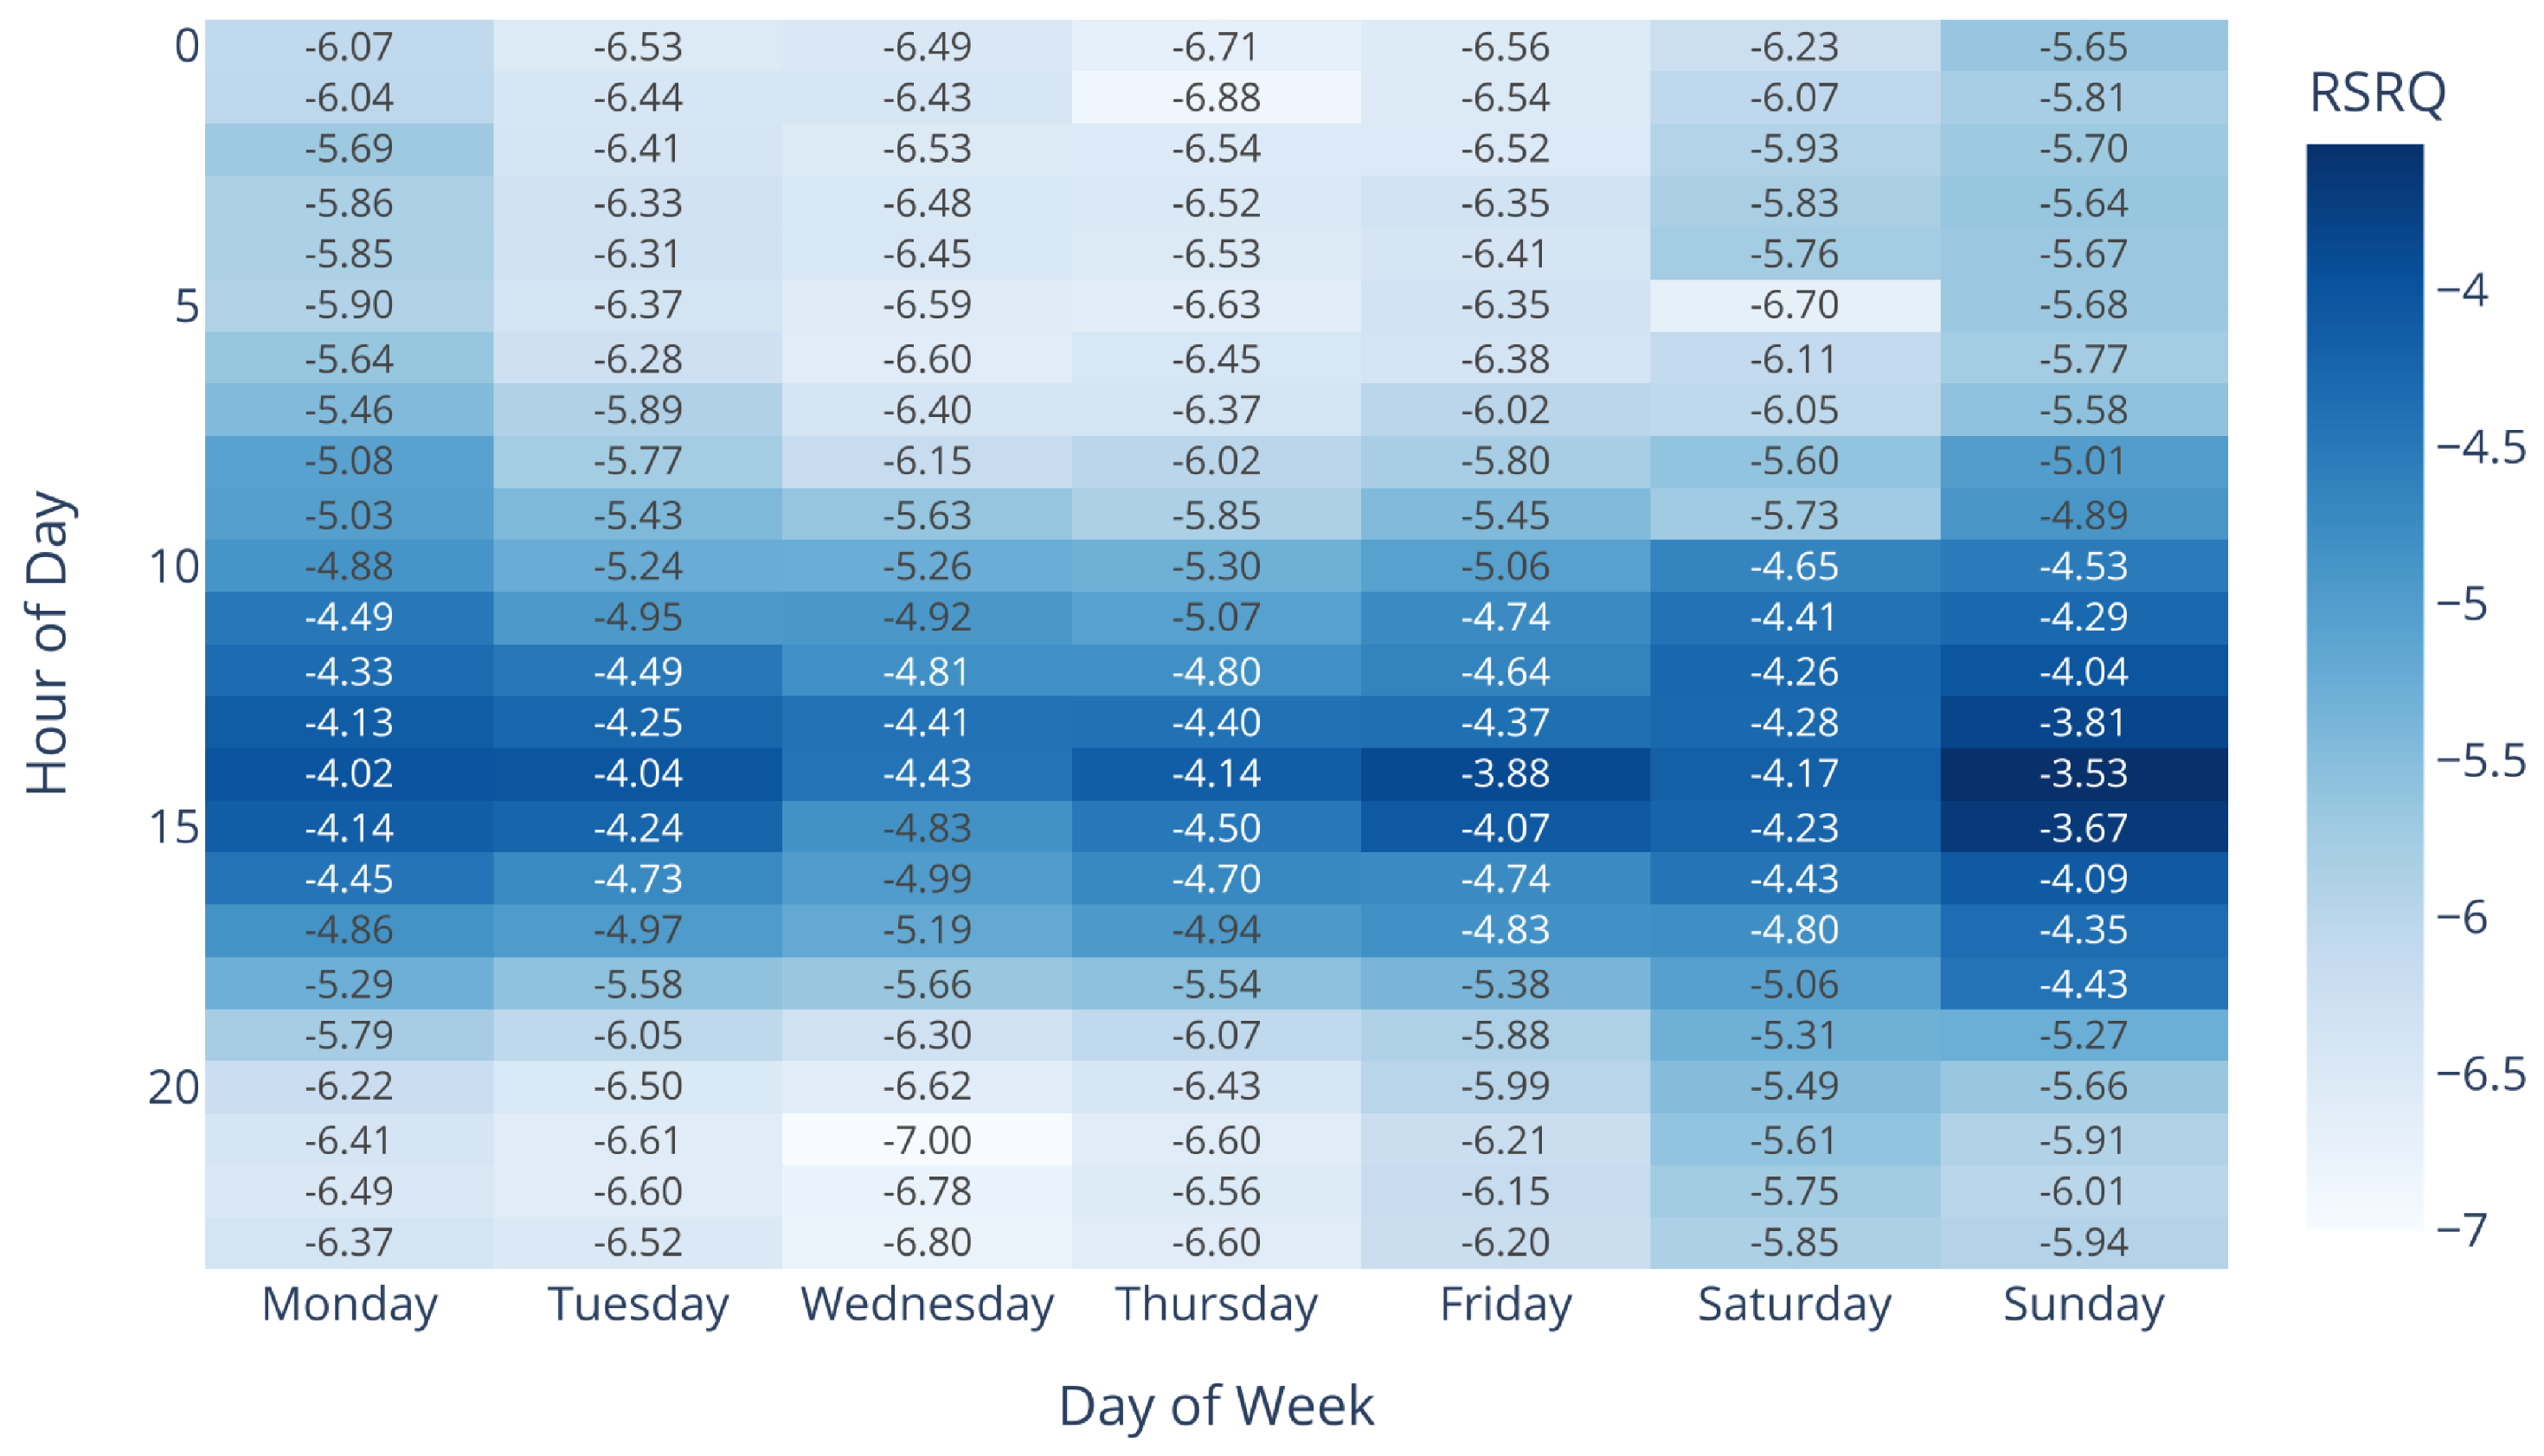
Finally, Figure 5 illustrates the better signal quality during the afternoons (approximately from 12:00 to 4:00 p.m.) and on weekends. Greater degradation was observed in the early morning hours (approximately 12:00 to 6:00 a.m.) and on weekdays. These patterns reflect the network traffic load and are crucial for training FL models that consider non-IID data patterns.

4.2. Process Data

In this phase, null data and outliers identified in the dataset corresponding to each of the five clients’ attributes were eliminated.

4.3. Sync Data

At this stage, data synchronization was performed by applying resampling to the dataset based on the timestamp column. This statistical technique was used to ensure that the data were presented in 10-minute intervals. This interval was appropriate to ensure the operational continuity of each of the five companies that participated in this study during the period.

4.4. Feature Data

Once the dataset was synchronized, the statistical characteristics of the numerical attributes were obtained: standard deviation (standard_dev), mean (meaning), median (median), maximum (maxim), minimum (minim), skewness (skew), kurtosis (kurtosis), linear regression slope (slope), and a polynomial feature based on the mean (polynomial_feat). These features are applied to sliding windows in time-series and signal analyses [89].
This statistical feature extraction technique is suitable for this study because of the non-IID nature of the data and the low correlation between the attribute distributions, as shown in Figure 2. Additionally, statistical behavior is more stable than instantaneous values, captures temporal dynamics, is robust to noise and outliers, preserves temporal continuity, and enhances generalization.
Figure 6 compares two approaches to addressing imbalance: the original balance, Random Oversampling, and Random Undersampling [90]. The dataset for Client 3 contained 2367 samples labeled as “Fair” (80.73%) compared to 565 samples labeled as “Good” (19.27%).
Random Oversampling was chosen because it preserves the original samples, generating a balanced dataset of 4734 samples (50–50%) for FL training with four federated clients. Unlike Random Undersampling, it retains existing information, which is critical in infrastructure data analysis.
These techniques effectively capture the variability and trends in each client’s data while mitigating the challenges associated with non-uniform and unbalanced distributions. By preserving the original information and generating a balanced dataset, the model robustness is enhanced in the face of data heterogeneity in an FL environment.

4.5. Split Data

In this phase, the dataset was split, using 80% for training and 20% for testing purposes. Of the five available clients, only four were used to train the FL model. Client 5 is used once the global model is obtained, serving as the validation dataset.

4.6. Train and Test

The model training phase involves implementing FL aggregation methods such as FedAvg, FedProx, FedAdam, FedAdagrad, and FedYogi, along with updates to the clients’ local models. This distributed learning approach does not require sharing data among clients because each client only sends the weights of their local model to the central server. Data scaling was performed during this stage. Finally, 20% of the data were scaled for testing.

4.7. Evaluate

The model performance evaluation stage in FL is carried out using multiple evaluation metrics, such as precision, loss, accuracy, recall, F1-score, and convergence time, to quantify the classification performance in scenarios of normal operation and disaster situations. In this phase, Client 5 was used to observe the adherence of the FL model.

4.8. Reports

In this phase, the results obtained after completing the training are presented, including the performance benchmarks and comparative analyses of the aggregation methods. Additionally, adherence to the global model was evaluated under normal operating conditions and natural disaster scenarios.

4.9. Base Model Refinement

This stage of iterative model optimization incorporates feedback from the evaluation to improve the model architecture, adjust the hyperparameters, and perform algorithmic refinements to enhance the predictive performance and computational efficiency.
This study presents two FL models:
1.
Under normal operating conditions, a dense feedforward neural network model (fully connected) was used to perform binary classification between the good (Class 1) and fair (Class 2) categories.
2.
For disaster conditions, the same architecture was used, but it also included Class 0 (poor), resulting in a multiclass classification.
The optimal architecture, determined through empirical testing, is as follows:
  • Input: 60 neurons.
  • First hidden layer: Dense (80 neurons) + Dropout (0.3).
  • Second hidden: Dense (32 neurons) + Dropout (0.2).
  • Third hidden layer: Dense (16 neurons) + Dropout (0.1).
  • Output: Dense (2 neurons, binary classification or 3 neurons, multiclass classification.)
Regularization and training parameters:
  • L1 + L2 regularization enabled on dense layers.
  • Dropout on each hidden layer (0.3, 0.2, 0.1 respectively).
  • Learning rate: 0.0002.
  • Gradient clipping: 0.5.
This architecture was used under normal conditions and in natural disaster scenarios, with only the output layer adjusted as needed.

4.10. System Adherence Metric

The System Adherence (SA) metric is defined as a productive evaluation index that quantifies the predictive fidelity of the FL model in relation to a reference classification (in this case, based on RSRP). Its purpose was to transform the technical evaluation of the model into a direct operational guide for decision-making. Unlike traditional metrics, such as accuracy or recall, which focus on statistical performance, the SA metric directly measures operational reliability.
One of its main advantages is that it provides a multilevel decision framework (individual, per class, and global), allowing for the determination of which predictions are reliable enough to automate actions and which require human intervention. This metric is designed to address reliability challenges in distributed FL systems, in which model consistency is crucial. SA metric connects technical performance with the trust required for its implementation in telecommunications networks during disasters.

4.10.1. Mathematical Formulation

The SA metric is defined through three complementary levels of evaluation:
Individual Sample Adherence:
S A i = 100 % if C p ( i ) = C r ( i ) 0 % if C p ( i ) C r ( i )
where:
  • S A i : Individual sample adherence (expressed as a percentage)
  • C p ( i ) : Predicted class for sample i by the FL classification model
  • C r ( i ) : Reference class for sample i based on direct RSRP measurements
Class-specific Adherence:
S A k = T P k T P k + F N k × 100 = Correct predictions for class k Total real samples of class k × 100
where:
  • S A k : Class-specific adherence (expressed as a percentage)
  • T P k : True positives for class k
  • F N k : False negatives for class k
Global System Adherence:
S A global = 1 N i = 1 N S A i = Total correct predictions Total samples × 100
where:
  • S A global : Global system adherence (expressed as a percentage)
  • N: Total number of samples
This mathematical formulation provides a solid foundation for assessing the predictive fidelity of the FL model at different levels of granularity, from individual samples to the overall performance of the system.

4.10.2. Operational Interpretation

The SA metric provides a discrete measure of the model’s classification reliability for operational decision-making.
  • S A i = 100 % : Perfect prediction for individual sample (automated decision safe)
  • S A i = 0 % : Incorrect prediction for individual sample (human intervention required)
  • S A k = 100 % : Perfect class-specific adherence (full automation enabled for class k)
  • S A global τ : Acceptable system adherence threshold (where τ is the minimum operational confidence level)
This interpretation allows granular decision-making based on the model’s performance at the individual sample, specific class, and overall system levels.

4.10.3. LTE Coverage Classification

For the tripartite classification of LTE coverage quality, the SA metric operates based on the following coding scheme:
Class Encoding = 0 if coverage = poor 1 if coverage = good 2 if coverage = fair
This coding allows the SA metric to provide class-specific reliability assessments in different coverage scenarios, facilitating operational decision-making based on coverage classification prediction.
The combination of operational interpretation and class coding scheme provides a robust framework for evaluating and applying the LTE coverage classification model in real-world scenarios. This enables network operators to make informed decisions regarding process automation, human intervention, and resource management based on the predictive reliability of the model at different levels of granularity.

4.10.4. Differentiation from Traditional Metrics

The SA metric stands out from conventional ML evaluation metrics because of its operational focus and FL context. Table 3 presents the key differences between SA metric and the traditional accuracy-based metrics.
The SA metric is notable in FL systems for LTE communication networks because of its operational focus and practical application. Unlike traditional metrics, SA metric directly measures operational reliability, informs decision-making in production environments, and guides automation and human monitoring processes. Specifically designed for FL, it addresses reliability in distributed environments and is based on the management of operational risks, making it crucial for practical implementation of models.

4.10.5. Value-Added Contributions

The SA metric provides several distinctive advantages for FL deployments in telecommunications:
(a) Operational Decision Framework: Transforms the model’s technical evaluation into a direct operational guide, enabling network operators to make informed decisions regarding automation levels without requiring deep expertise in ML.
(b) Risk-based thresholds: Thresholds are established based on operational risk tolerance, allowing for graduated deployment strategies, wherein different coverage classes can have different levels of automation.
(c) FL Reliability: Specifically addresses the reliability challenges inherent to distributed FL systems, where model consistency across heterogeneous network nodes is critical for operational deployment.
(d) Class-Specific Automation: Enables granular control over automation decisions, allowing operators to fully automate high-confidence predictions while maintaining human oversight for lower-confidence classes.
(e) Deployment Readiness Assessment: The three-level SA metric assessment (individual, class-specific, and global) provides a comprehensive framework for determining when FL models are ready for production.
The SA metric offers a clear interpretation of operational decisions by providing an intuitive percentage of adherence to classification at the individual, class-specific and global levels. It quantifies the model’s classification performance for each coverage class and can be integrated as an external index for operational decision-making in federated learning scenarios, bridging the gap between the model’s technical performance and trust in its real-world implementation.

4.11. FL and Aggregation Methods

FL is an advanced distributed learning technique in which multiple devices collaborate to develop a global model without the need to share private data. The process unfolds as follows: Initially, the server is activated and prepared to receive connections from the devices. Once the connection between the server and devices is established, the server transmits the model parameters to the devices, either starting from scratch or from a pretrained model. Subsequently, the devices perform local training over several epochs and update the parameters. These parameter updates are sent back to the server, which integrates all the received parameter updates into a standard, global model. This entire process constitutes one round of FL, which is repeated several times until the global model reaches a satisfactory level of accuracy [91].
The FL depends on the aggregation method used. This method integrates the knowledge acquired by the clients during training with their local data and uses this aggregated knowledge to update the global model. This study proposes parameter-based aggregation methods that focus on the combination of trainable parameters, such as the weights or gradients of deep neural networks. In each communication round, the local models share these parameters after iteratively training on their local datasets.
In particular, Table 4 illustrates that the selection of parameter μ in FedProx is fundamental to the performance of the algorithm. This parameter regulates the balance between proximity to the global model and the local optimization. An excessively high value of μ can restrict local adaptation, whereas a value that is too low can cause the global model to diverge. In our study, the value of μ was determined through a sensitivity analysis of simulated disaster scenarios, with the aim of optimizing convergence under non-IID data conditions. A value of μ = 0.05 provided the best balance between global model stability and adaptation to local conditions across various disaster scenarios. This approach allows FedProx to maintain its robustness in the face of the statistical heterogeneity typical of emergency situations while preserving the necessary local adaptation capability to capture variations in network conditions during disasters.
Table 4 presents a summary of the aggregation methods used in this study.

4.12. Non-IID Data Distribution

One of the main challenges of this study was addressing the unbalanced distribution of client datasets. In the context of FL, two concepts are considered: Independent and Identically Distributed (IID) and Non-Independent and Identically Distributed (non-IID).
An IID distribution implies that the client data come from the same statistical distribution obtained in a controlled and uniform environment. The samples were independent of the clients and shared the same probability density function. In contrast, a non-IID distribution indicates differences in the distribution among clients owing to geographic and temporal factors [93,94], which affect FL of the global model’s performance [95,96].
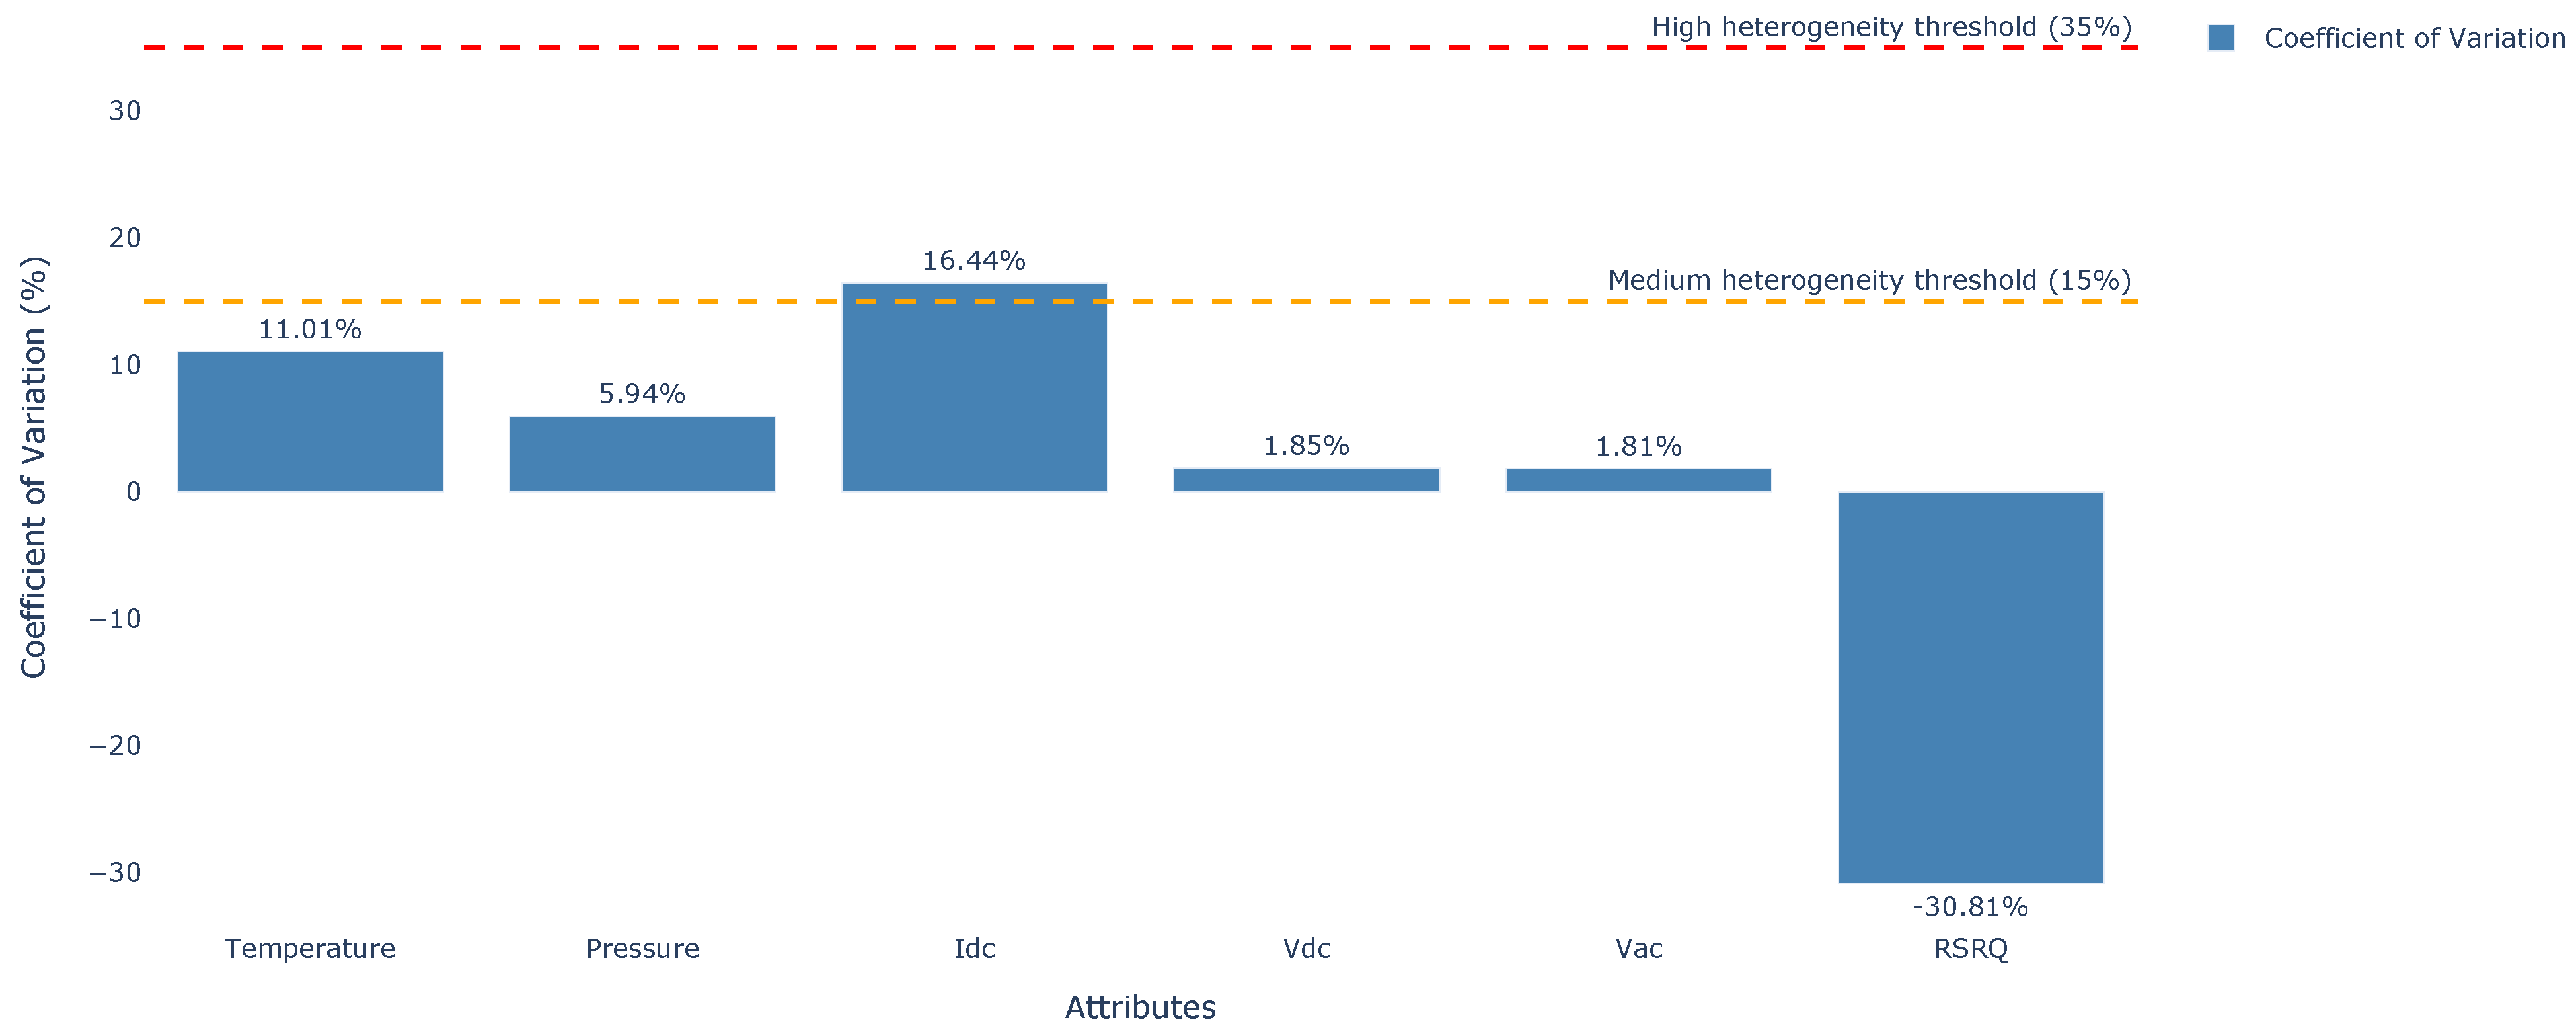
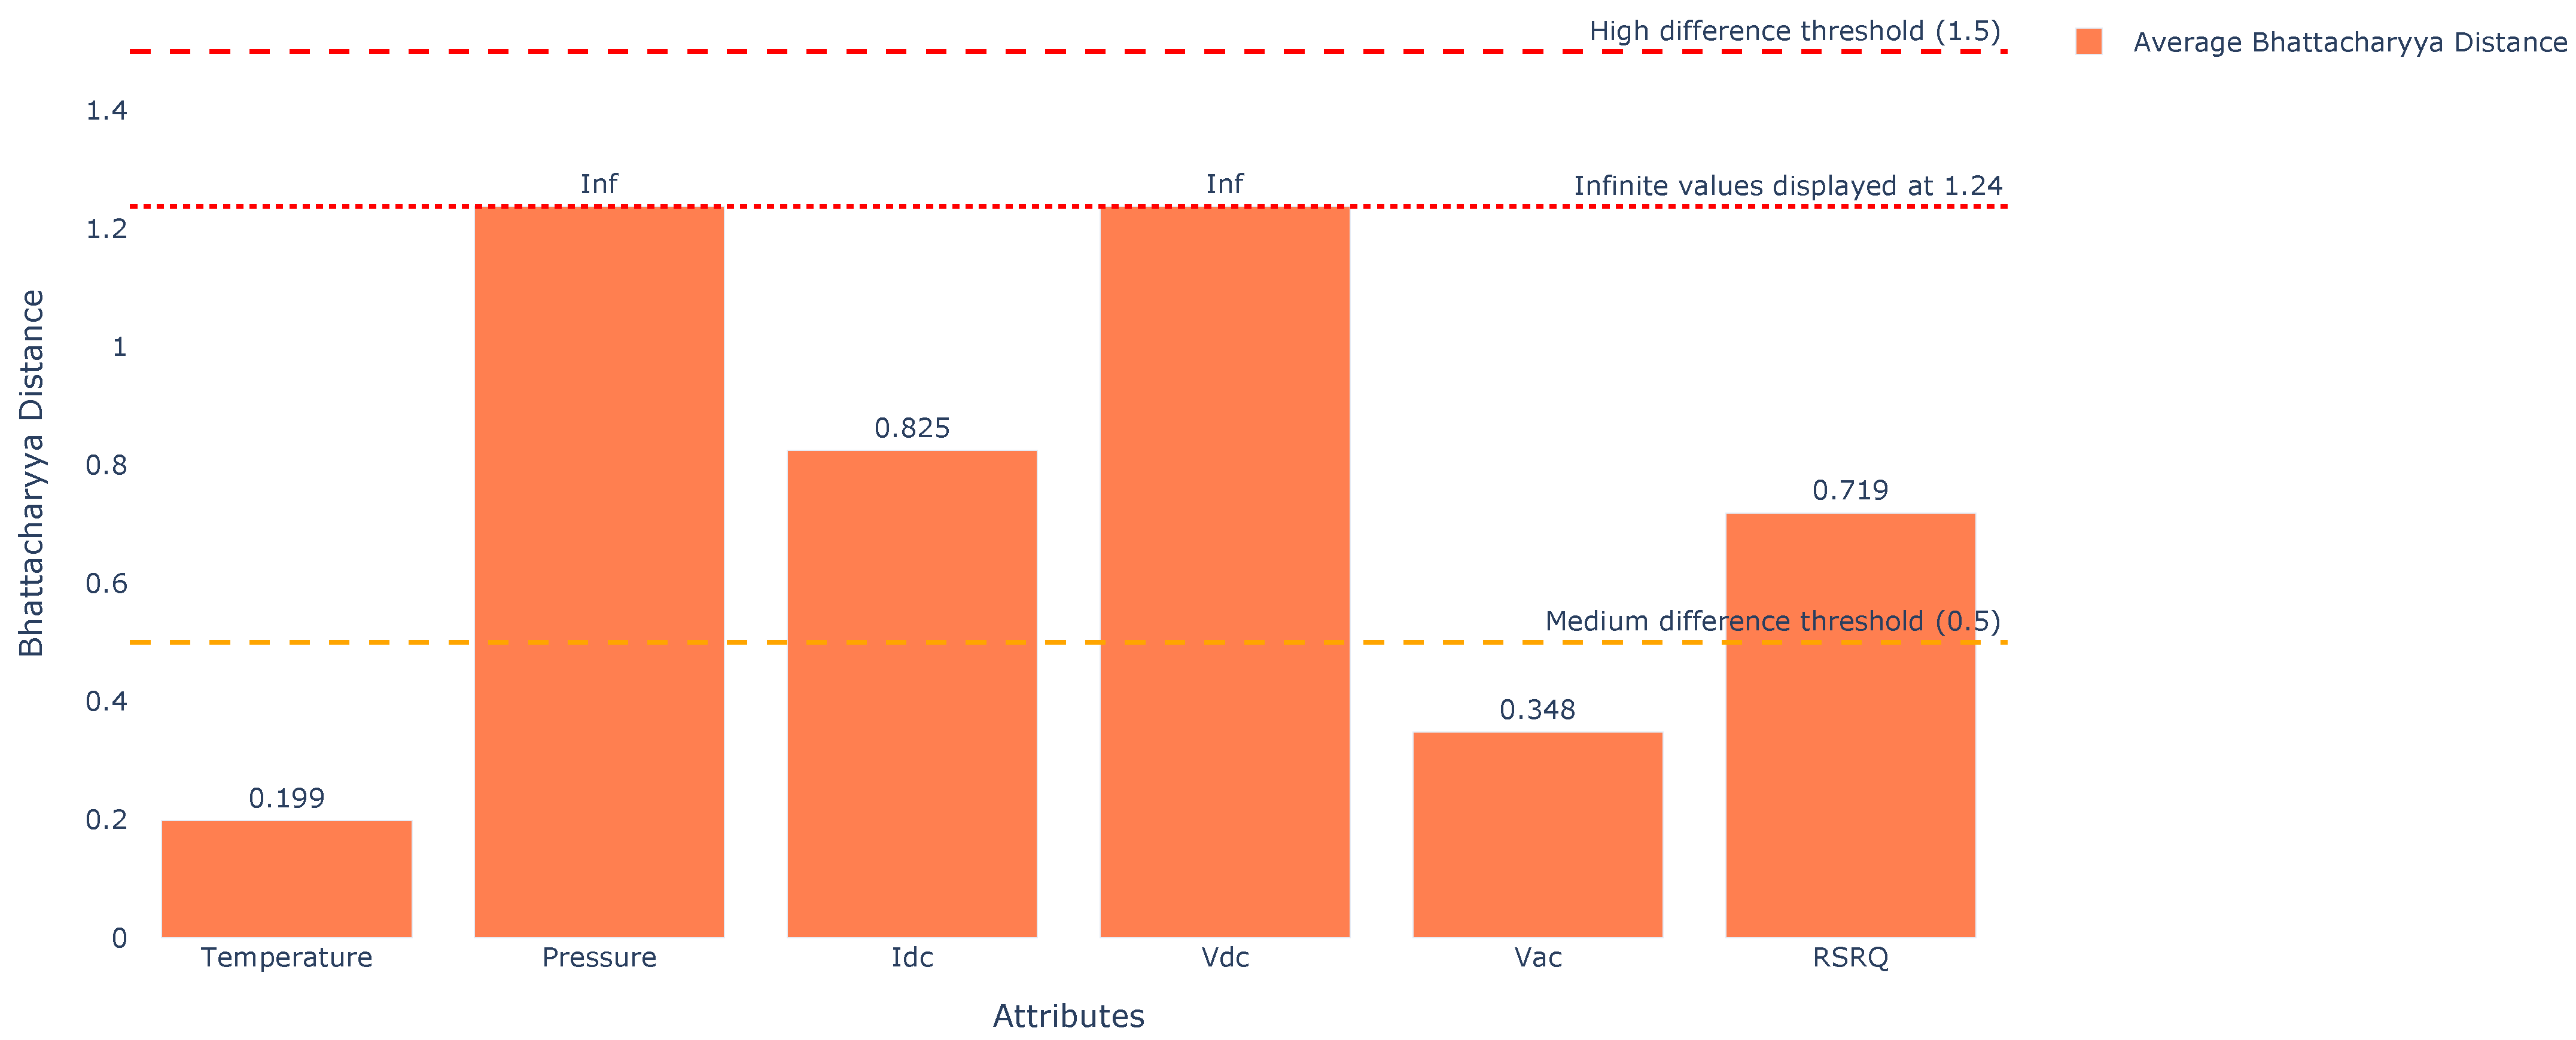
Figure 7 illustrates the presence of non-IID distributions among the five clients, with coefficients of variation ranging from 1.81% (Vac) to 16.44% (Idc), and an RSRQ of −30.81%. The Bhattacharyya distances observed in Figure 8 reach infinity for pressure and Vdc among the clients [97]. This heterogeneity reflects the diversity of LTE infrastructure in high-altitude locations, where environmental conditions vary significantly. The non-IID nature justifies the use of FL, which is designed to manage heterogeneous data while preserving the privacy. In disaster situations, FL ensures resilience by maintaining operability, even when some nodes fail.

4.13. Dataset and Disaster Simulation Details

To improve the reproducibility and clarity of our study, we provide details of the dataset and design of the disaster simulations below. The data were collected from operational LTE communication nodes under high-altitude conditions (4000 m above sea level), which introduced significant environmental and electrical variability, as reflected in the non-IID nature of the data distributions (see Figure 7 and Figure 8). This heterogeneity is fundamental to the study because it represents a realistic challenge for any FL model. Disaster simulations were not merely theoretical; they were designed to emulate empirically observed network degradation patterns. For example, the fire scenario shown in Section 6.2.1 was modeled to induce a temperature increase in client 1 of up to 130 °C, an extreme threshold derived from industrial heat sensor specifications, which causes a predictable failure in network coverage to ‘Poor’ (Class 0). Similarly, blackout, storm, and earthquake scenarios were constructed by introducing specific anomalies in the electrical parameters (Vdc, Idc, Vac) and atmospheric pressure, thus generating distinct and challenging training datasets for each federated client, ensuring that the global model generalizes to diverse infrastructure failures and does not merely memorize a single error pattern.

5. Proposed Design

This section describes FedResilience, an FL framework designed to classify LTE coverage during natural disasters. This design offers a tool that enables companies to implement automated corrective actions for the maintenance of LTE network. FedResilience helps companies strengthen their infrastructure in deficient areas and establish alternative routes for operational continuity (see Section 4.10.2). The system employs four geographically distributed nodes from participating companies to train the global model, preserving the privacy of non-IID data and enhancing resilience in disaster-prone areas.

5.1. General System Architecture

The FedResilience system implements a distributed three-tier architecture that facilitates collaborative learning without the need to centralize sensitive data in the network. This architecture consists of edge nodes deployed at altitudes above 4000 m above sea level in various geographic areas across five different industries, a central aggregation server, and a batch processing interface that incorporates multiple layers of both physical and digital security, strictly restricting unauthorized access. This design contributes to operational continuity, even when individual nodes experience interruptions caused by natural disasters.
The system leverages the geographic distribution of the network infrastructure to create a robust FL environment. Figure 9 shows that each edge node operates as an autonomous learning unit capable of local model training using environmental and network quality parameters. The central server orchestrates the learning process through secure parameter aggregation, eliminating the need to transmit raw data over potentially compromised communication channels.

5.2. FL Topology

The topology proposed in Figure 9 employs four geographically distributed clients for global model development, with a fifth client reserved exclusively for validation. This configuration ensured robust generalization of the model while maintaining an independent evaluation dataset. The 4+1 topology provides sufficient diversity to handle the non-IID data distributions inherent in geographically dispersed network deployments.
Each participating client follows an 80/20 data splitting protocol, where 80% of the local data serves for local “train” and 20% for local “test.” This configuration enables both local model validation and global model evaluation, thereby ensuring a consistent performance evaluation across all participating nodes. The reserved validation client operates with complete data independence and provides unbiased performance metrics for the federated model.

5.3. Multi-Parametric Classification Framework

The system employs a multidimensional feature space comprising RSRQ, ambient temperature, atmospheric pressure, direct current, and continuous voltage to classify LTE coverage. This comprehensive set of parameters allows the detection of coverage degradation patterns that go beyond traditional signal strength metrics. The framework classifies network coverage into three distinct categories: good (class 1), fair (class 2), and poor (class 0), based on the integrated environmental and electrical conditions.
The RSRP parameter serves as a ground truth reference for model adherence validation, creating a robust feedback mechanism for evaluating classification accuracy. This dual-parameter approach enhances the system’s ability to predict coverage quality under the variable environmental conditions typical of natural disaster scenarios.

5.4. Dual Operation Scenarios

5.4.1. Scenarios Under Normal Conditions

The system processes real network data under normal operational conditions, where coverage is classified only into the categories “good” and “fair”. These scenarios represent the typical operational conditions of the LTE network in high-altitude areas, providing a baseline for federated model training. Normal condition data were collected during stable network operation periods without significant interference from extreme environmental events.

5.4.2. Disaster Simulation Scenarios

To evaluate the resilience of the system under extreme conditions, simulations of four specific types of natural disasters were implemented: fire, power outages, severe storms, and earthquakes. These simulated scenarios incorporated three coverage classes (good, fair, and poor), allowing the model to learn the degradation patterns associated with each type of disaster.
Fire simulations model the gradual degradation of infrastructure due to extreme heat and the destruction of physical equipment. Power outage scenarios simulate the sudden loss of power at critical nodes, and storm simulations incorporate electromagnetic interference and damage from adverse weather conditions. Earthquake scenario models of seismic disruptions affect both physical infrastructure and communication stability.

5.5. Adaptive Aggregation Strategies

The FedResilience system implements an adaptive aggregation strategy that dynamically selects optimal federation algorithms based on the network conditions and data heterogeneity. The system evaluates five distinct aggregation methods—FedAvg, FedProx, FedAdam, FedAdagrad, and FedYogi—to identify the most suitable approach for the prevailing conditions.
The aggregation strategy incorporates a weighted parameter combination based on the local dataset sizes and model performance metrics. This approach ensures that nodes with higher quality and quantity of data contribute proportionately to the global model while maintaining robustness against potential node failures or data corruption during disasters.
For FedProx, the μ parameter was adjusted according to the network conditions and data heterogeneity. In scenarios with high variability among clients, μ is increased to maintain global coherence, whereas in homogeneous conditions, it is reduced to allow for local adaptation. This adjustment ensures that FedProx responds to the network conditions in disaster scenarios.

5.6. Batch Processing for Retrospective Analysis

The proposed design employs a batch processing paradigm that enables a comprehensive analysis of historical data and model validation in various disaster scenarios without the constraints of real-time processing. This approach facilitates a thorough evaluation of FL algorithms under different network configurations and environmental conditions, providing detailed insights into the model performance across various operational and disaster scenarios. Batch processing enhances the benchmarking of algorithms, allowing for the optimal selection of hyperparameters and model configurations to increase the network resilience. This paradigm is especially advantageous for the development and refinement of models in disaster preparedness, where predictive accuracy and interpretability take precedence over immediate-response latency.

5.7. Adherence Validation Mechanism

An innovative adherence validation mechanism is proposed, introducing the SA metric as a productive evaluation index that quantifies the predictive fidelity of the FL model in relation to the RSRP reference classification. This metric provides a standardized measure of the model reliability under various operational conditions and disaster scenarios, offering an operational framework for decision-making in distributed telecommunications networks. The SA metric enables a granular assessment at the individual sample, specific class, and global levels, facilitating informed decisions regarding process automation, human intervention, and resource allocation based on predefined thresholds.
The validation mechanism operates independently of the FL process, leveraging the fifth reserved client to conduct an impartial evaluation of performance. This approach ensured an objective validation of the model, unaffected by the distribution of training data among the four active clients. The SA metric offers several advantages for FL implementations in telecommunications, including an operational framework for decision-making, risk-based thresholds, evaluation of FL reliability, class-specific automation, and assessment of deployment readiness. By providing an intuitive percentage of classification adherence, the SA metric bridges the gap between technical performance and confidence in real-world implementation, making it especially valuable for maintaining network resilience in various disaster scenarios and enabling informed operational decisions, both of which are fundamental for the practical implementation of FL models in LTE communication networks under challenging conditions.

5.8. Privacy Preservation Framework

FedResilience implements a privacy-preserving framework through a three-tier distributed architecture that guarantees data privacy and facilitates collaborative learning among network operators. This architecture comprises edge nodes deployed at high altitudes (above 4000 m), a central aggregation server, and batch processing interface. The system employs parameter-based communication protocols, ensuring that raw data do not leave the local environment. The model gradient and parameter updates were transmitted to the central server to maintain data protection compliance. Aggregation protocols prevent the identification of individual contributions, whereas differential privacy mechanisms protect against model inversion attacks. Layers of physical and digital security restrict unauthorized access to the networks of participating companies, safeguarding sensitive data even if communication channels are compromised. This approach preserves privacy and contributes to operational continuity during natural disasters, thereby enabling resilient collaborative learning in high-altitude environments.

5.9. Benchmarking Framework

FedResilience integrates a benchmarking framework designed to measure the performance of FL algorithms under disaster scenario conditions and during normal operations. This framework allows for contrasting the most effective aggregation methods in catastrophic situations versus normal operations, offering an evidence-based guide for their operational implementation. Various performance metrics were employed, such as precision, loss, accuracy, recall, and F1-score, in addition to the SA metric, which measures the model’s predictive fidelity in relation to RSRP classifications, facilitating a productive interpretation. The comparison covered both normal conditions and simulated disaster scenarios, ensuring the robustness of the models in both contexts. By evaluating the algorithms according to these metrics, the framework identifies the most suitable aggregation method for disaster and normal operations. Once selected, the best overall model is evaluated using client 5, where the SA metric contributes to operational interpretation, enabling participating companies to take automated, human, or hybrid actions, as detailed in Section 4.10.2, which is essential for the resilience of the FedResilience system in LTE communication networks.

5.10. Deployment Considerations and Practical Implications

The practical implementation of FedResilience has significant implications for telecommunications network operators, especially in Chile, given its susceptibility to disasters. FedResilience is not only a classification model but also a decision-support tool that enables companies to shift from reactive maintenance to predictive and automated maintenance. One of its main practical advantages is its ability to operate in a distributed environment, preserving the privacy of each operator’s data—an essential aspect when multiple companies collaborate without sharing sensitive information. From a deployment perspective, the system is designed with a three-tier architecture (edge nodes, aggregation server, and batch processing) that ensures operational continuity once the global model is trained, even if some nodes fail, which is a vital consideration during a natural disaster.
The operational implications are direct: by using the SA metric, operators can set risk thresholds to automate the corrective actions. For example, they can fully automate monitoring in areas with high predictive reliability (high SA for “Good” coverage) and activate human supervision or redundant systems in areas where the model shows lower confidence (low SA for "Fair" coverage). This optimizes resource allocation, reduces operational costs, and, most importantly, strengthens the communication infrastructure in vulnerable areas, helping companies proactively establish alternative routes to ensure a resilient network. FedResilience provides a tangible framework for improving network reliability and the efficiency of emergency response, transforming network data into actionable operational intelligence.

6. Results and Discussions

6.1. Normal Operation

Table 5 presents a comprehensive comparison between five federated aggregation methods—FedAvg, FedProx, FedAdam, FedYogi, and FedAdagrad—evaluating their performance in terms of Precision, Accuracy, Recall, F1-score, Loss, and convergence time over 75 rounds of federated training with four clients.
FedAdam achieved the highest F1-score (0.7271), as well as the best accuracy (0.7498) and recall (0.7498), making it the most robust method for classification tasks under the federated scheme. Additionally, it was among the three most efficient methods in terms of training time (2.3 min).
FedYogi showed a slightly higher precision (0.7922), but its F1-score was lower (0.7229), indicating that, although precise, the balance between precision and recall does not surpass that of FedAdam.
FedProx and FedAvg showed comparable results, with F1-scores of 0.7124 and 0.7102, respectively, although they had different convergence times of 2.3 and 2.5 min.
FedAdagrad was the aggregation method with the lowest performance, obtaining the lowest F1-score (0.6089) and the highest loss (1.8717), which excludes it from applications where precision is critical.
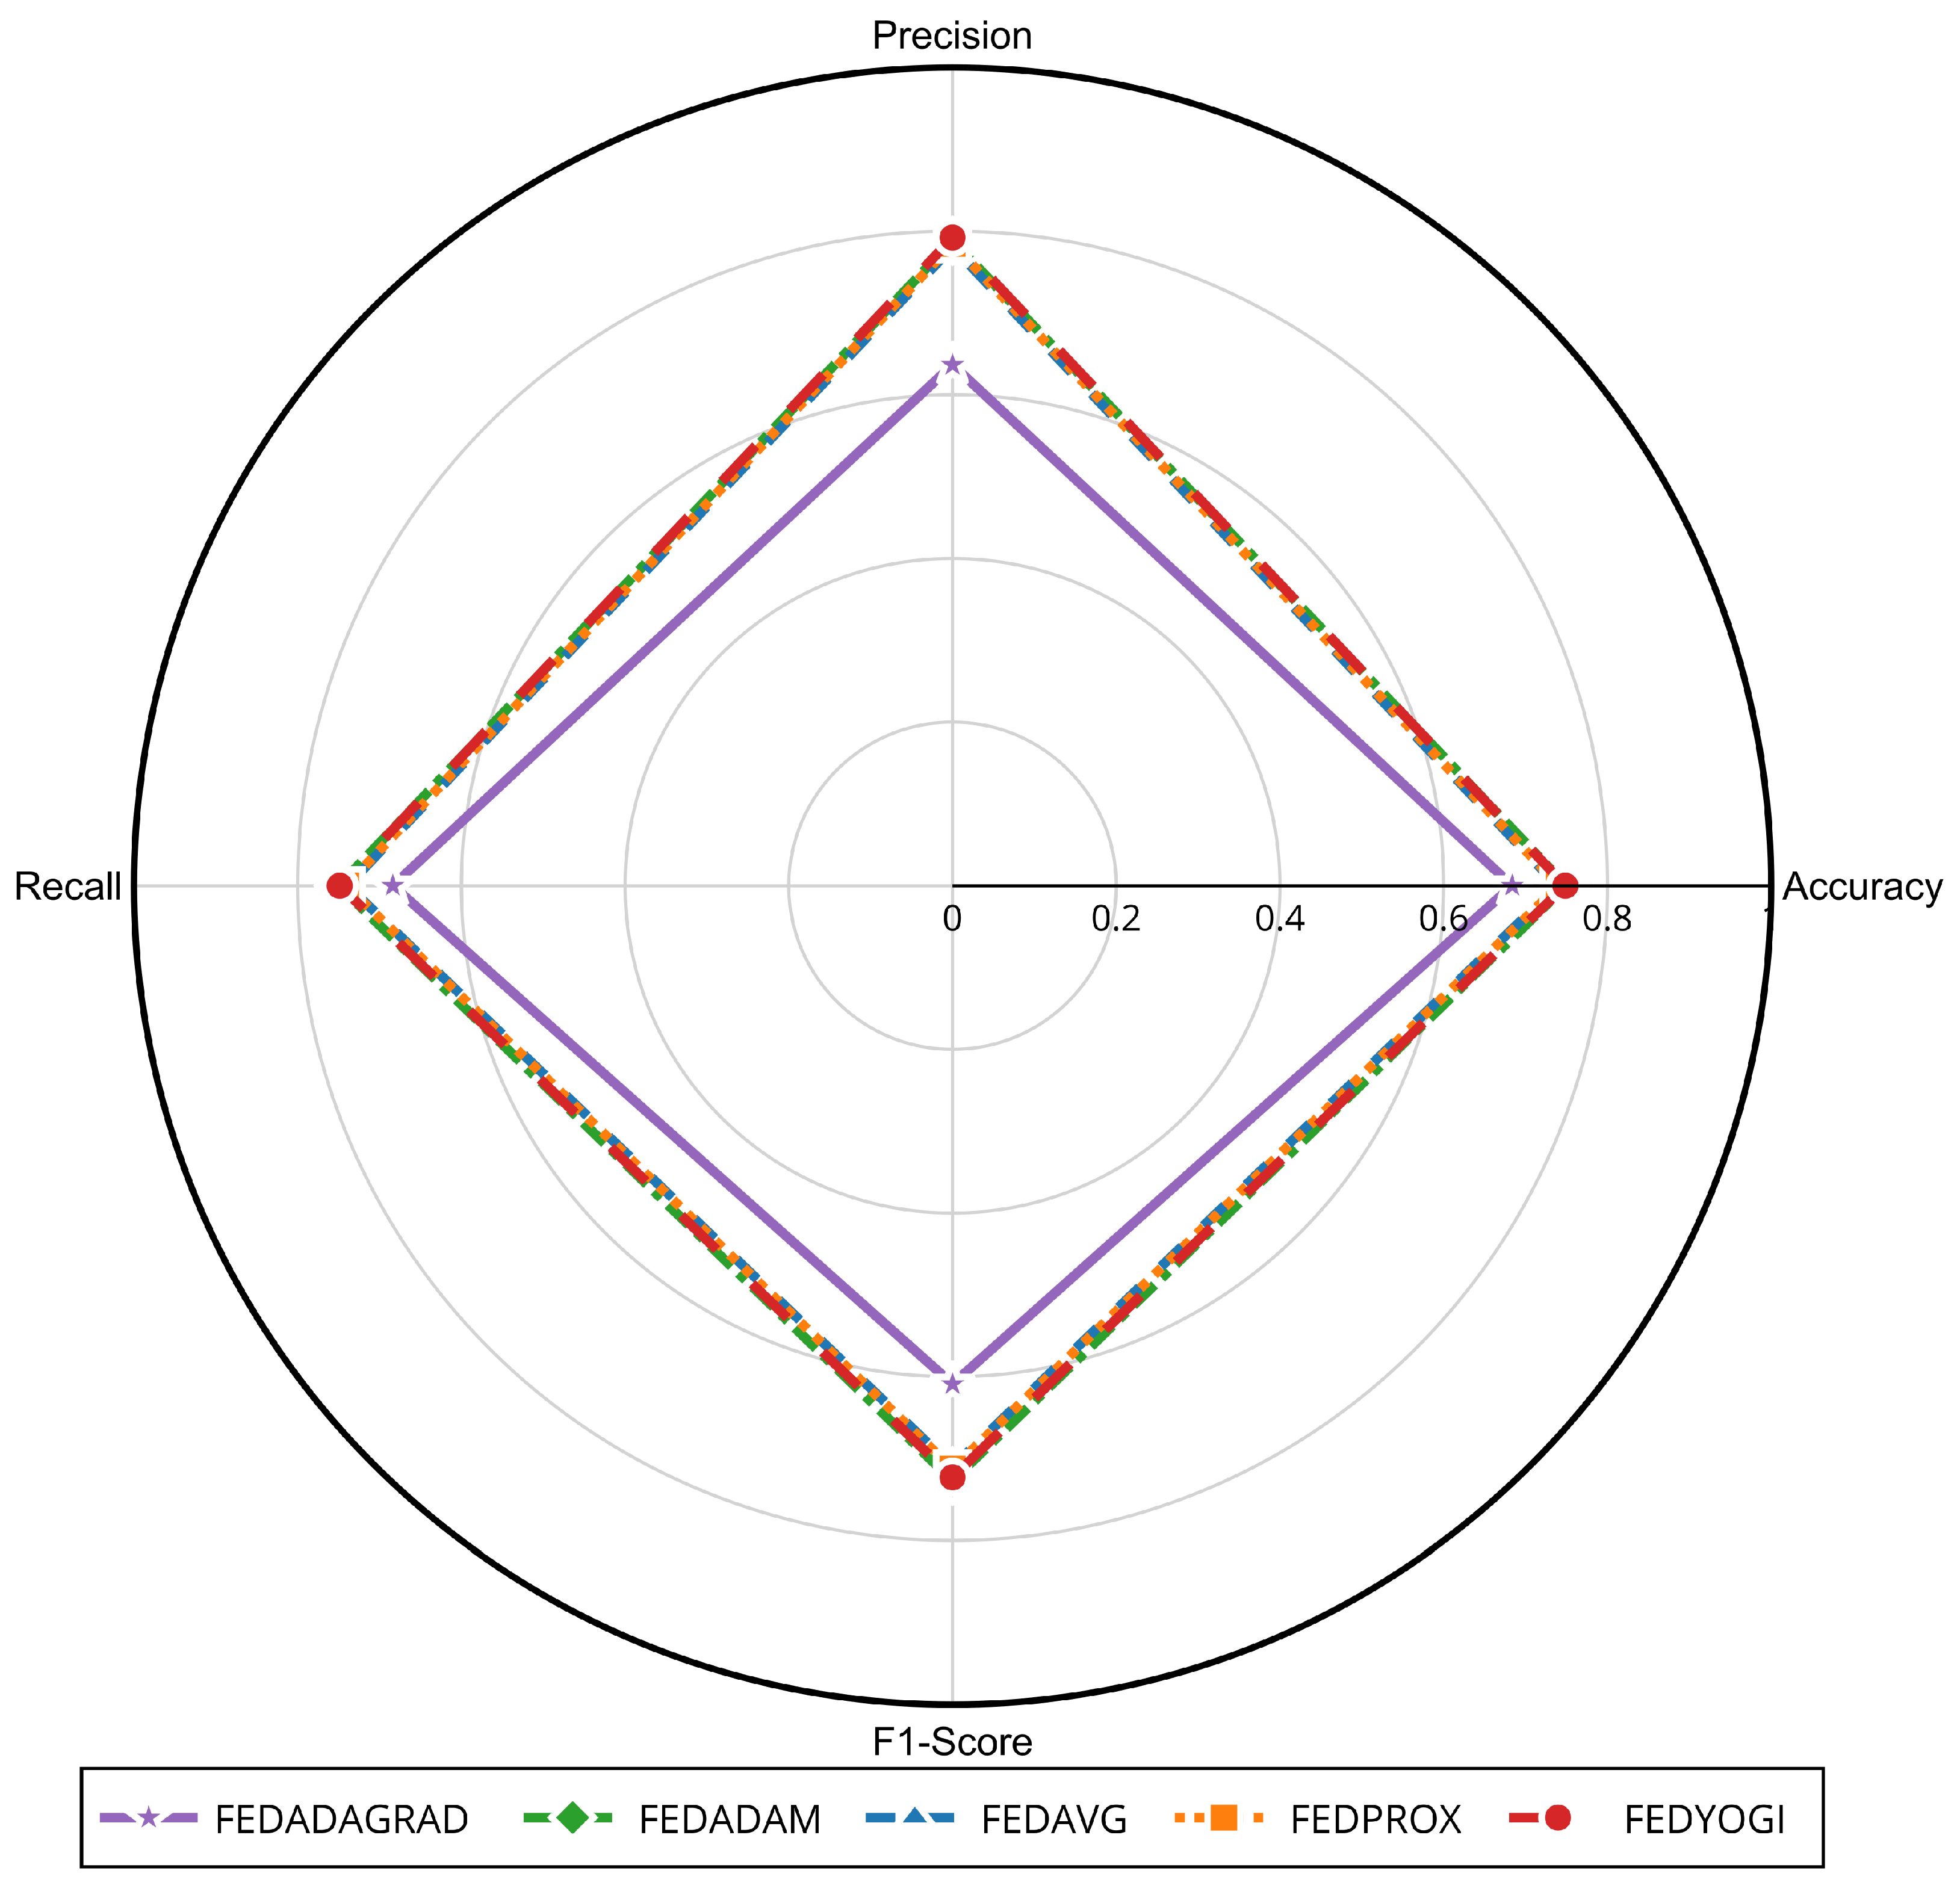
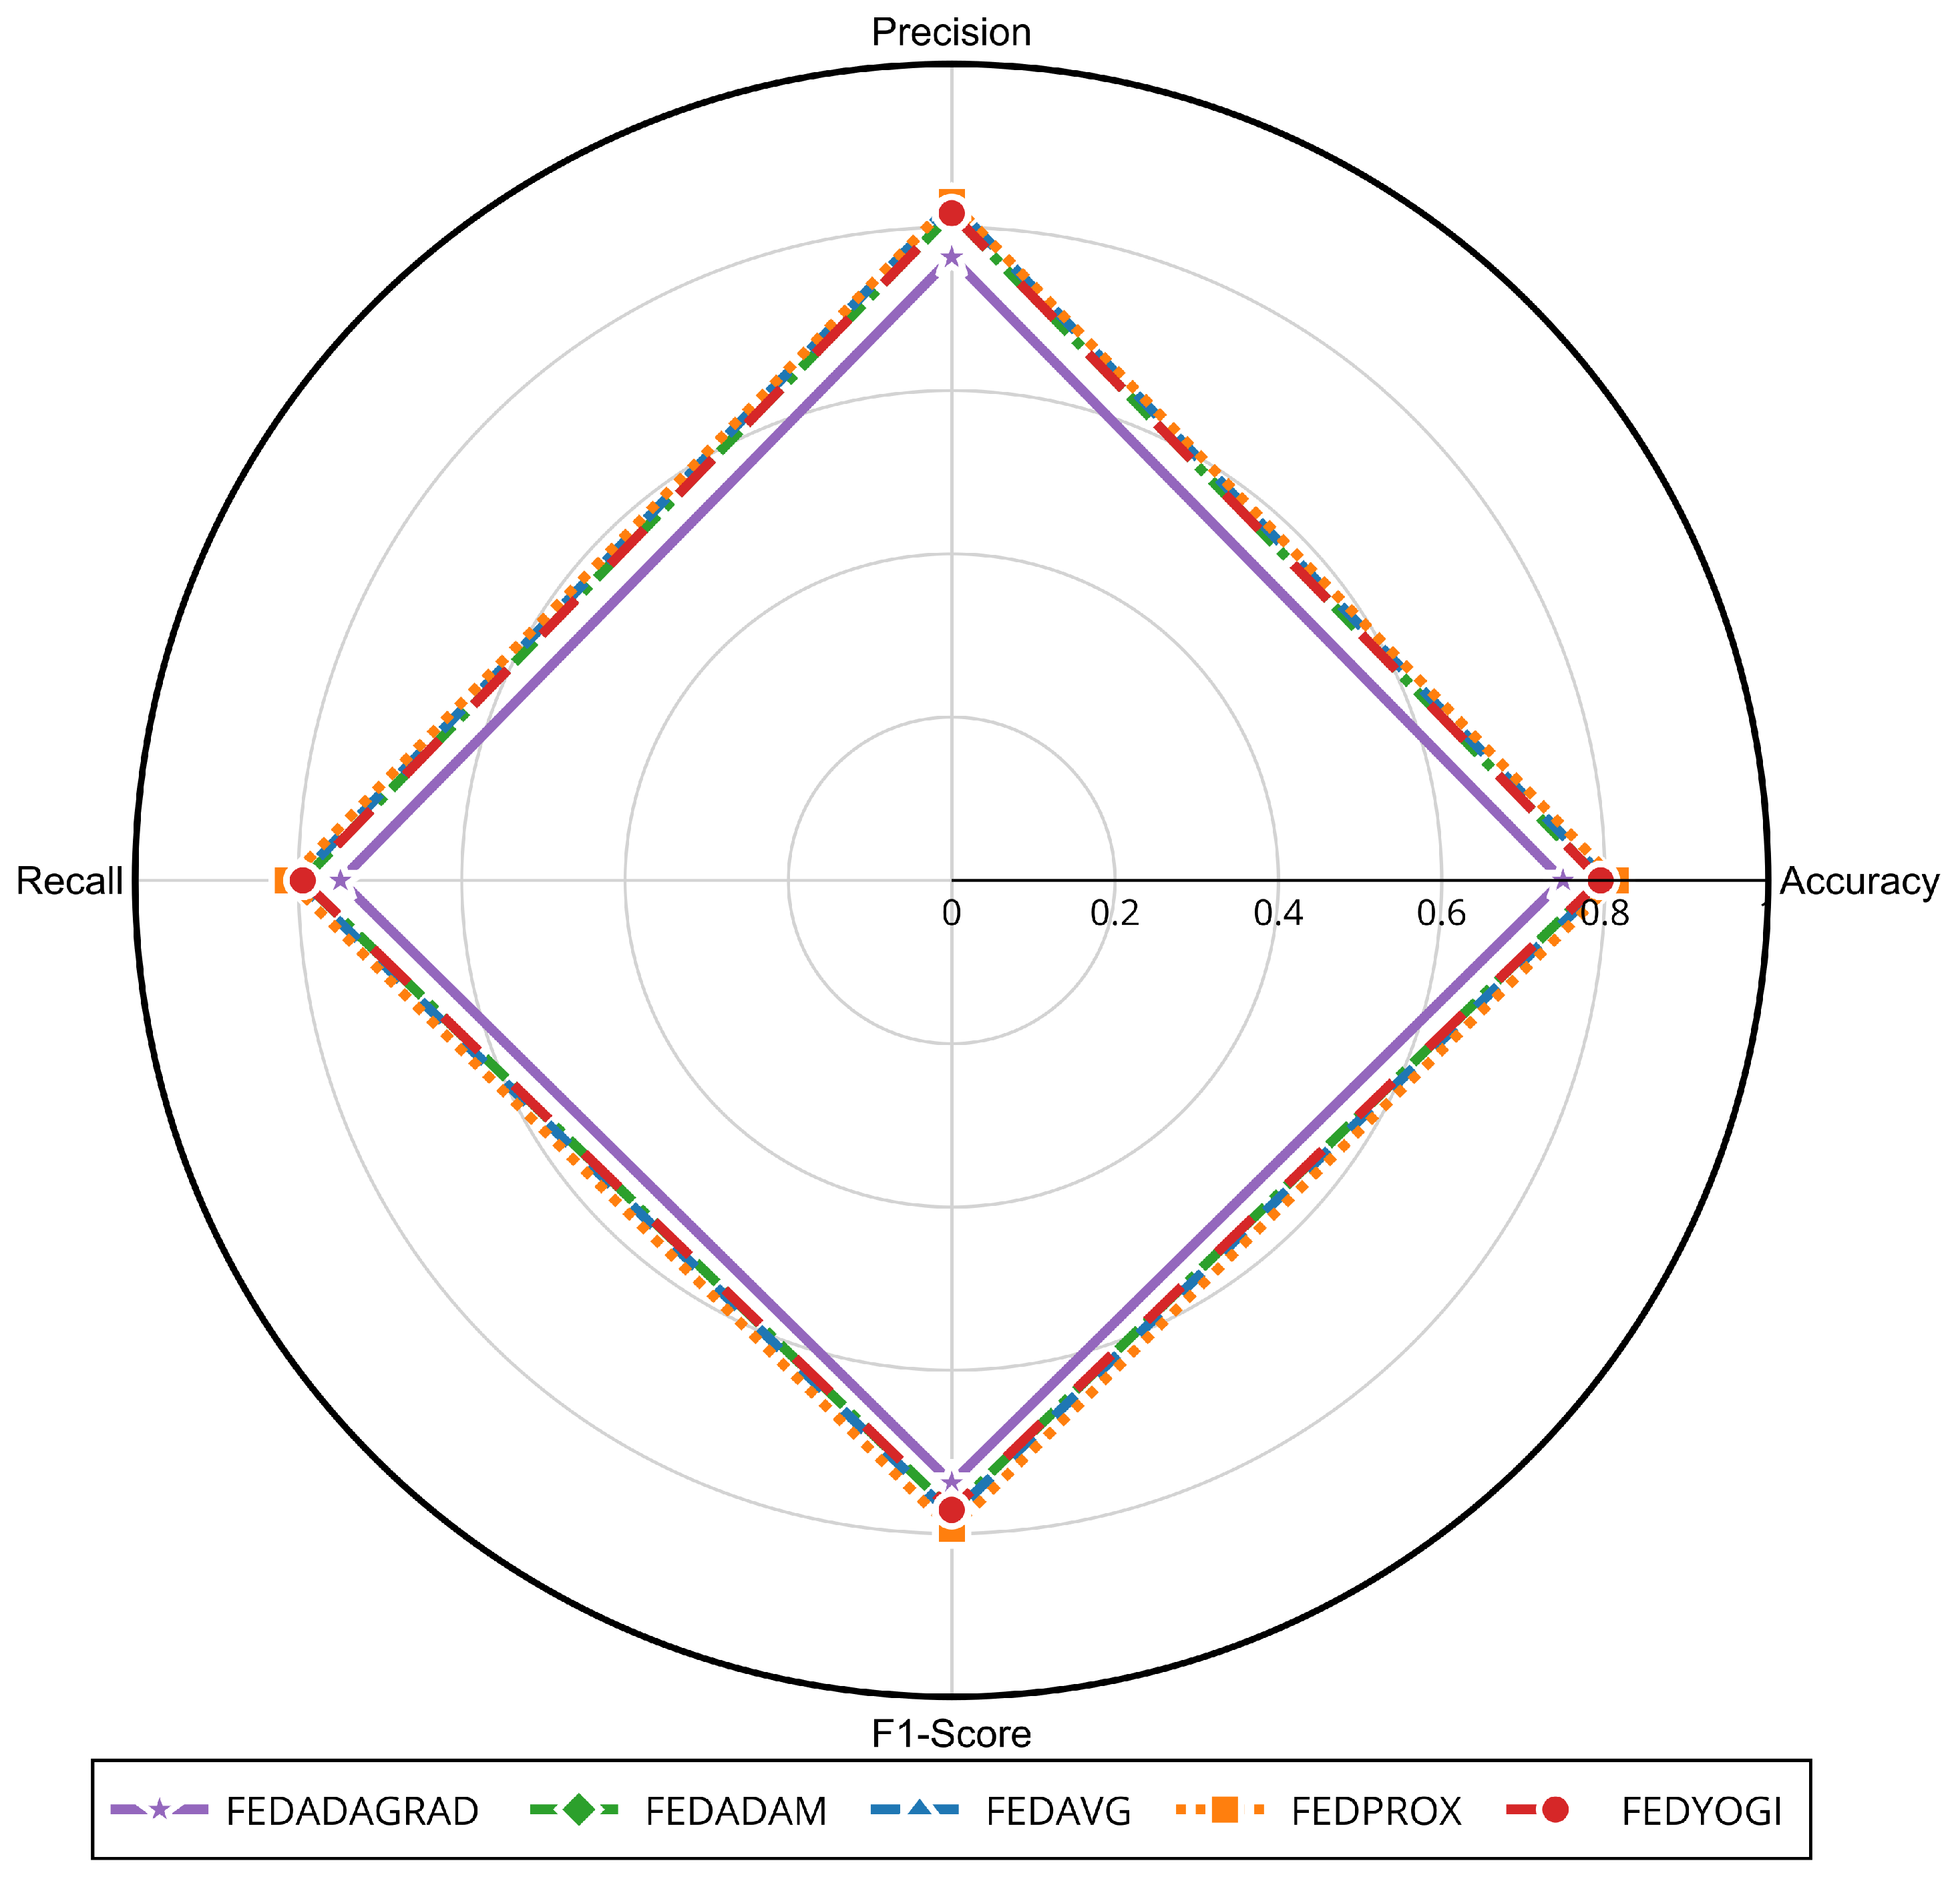
The radar chart in Figure 10 shows that FedAdam and FedYogi stand out in terms of precision and recall, whereas FedAvg and FedProx maintain intermediate performance, and FedAdagrad lags behind in all indicators.
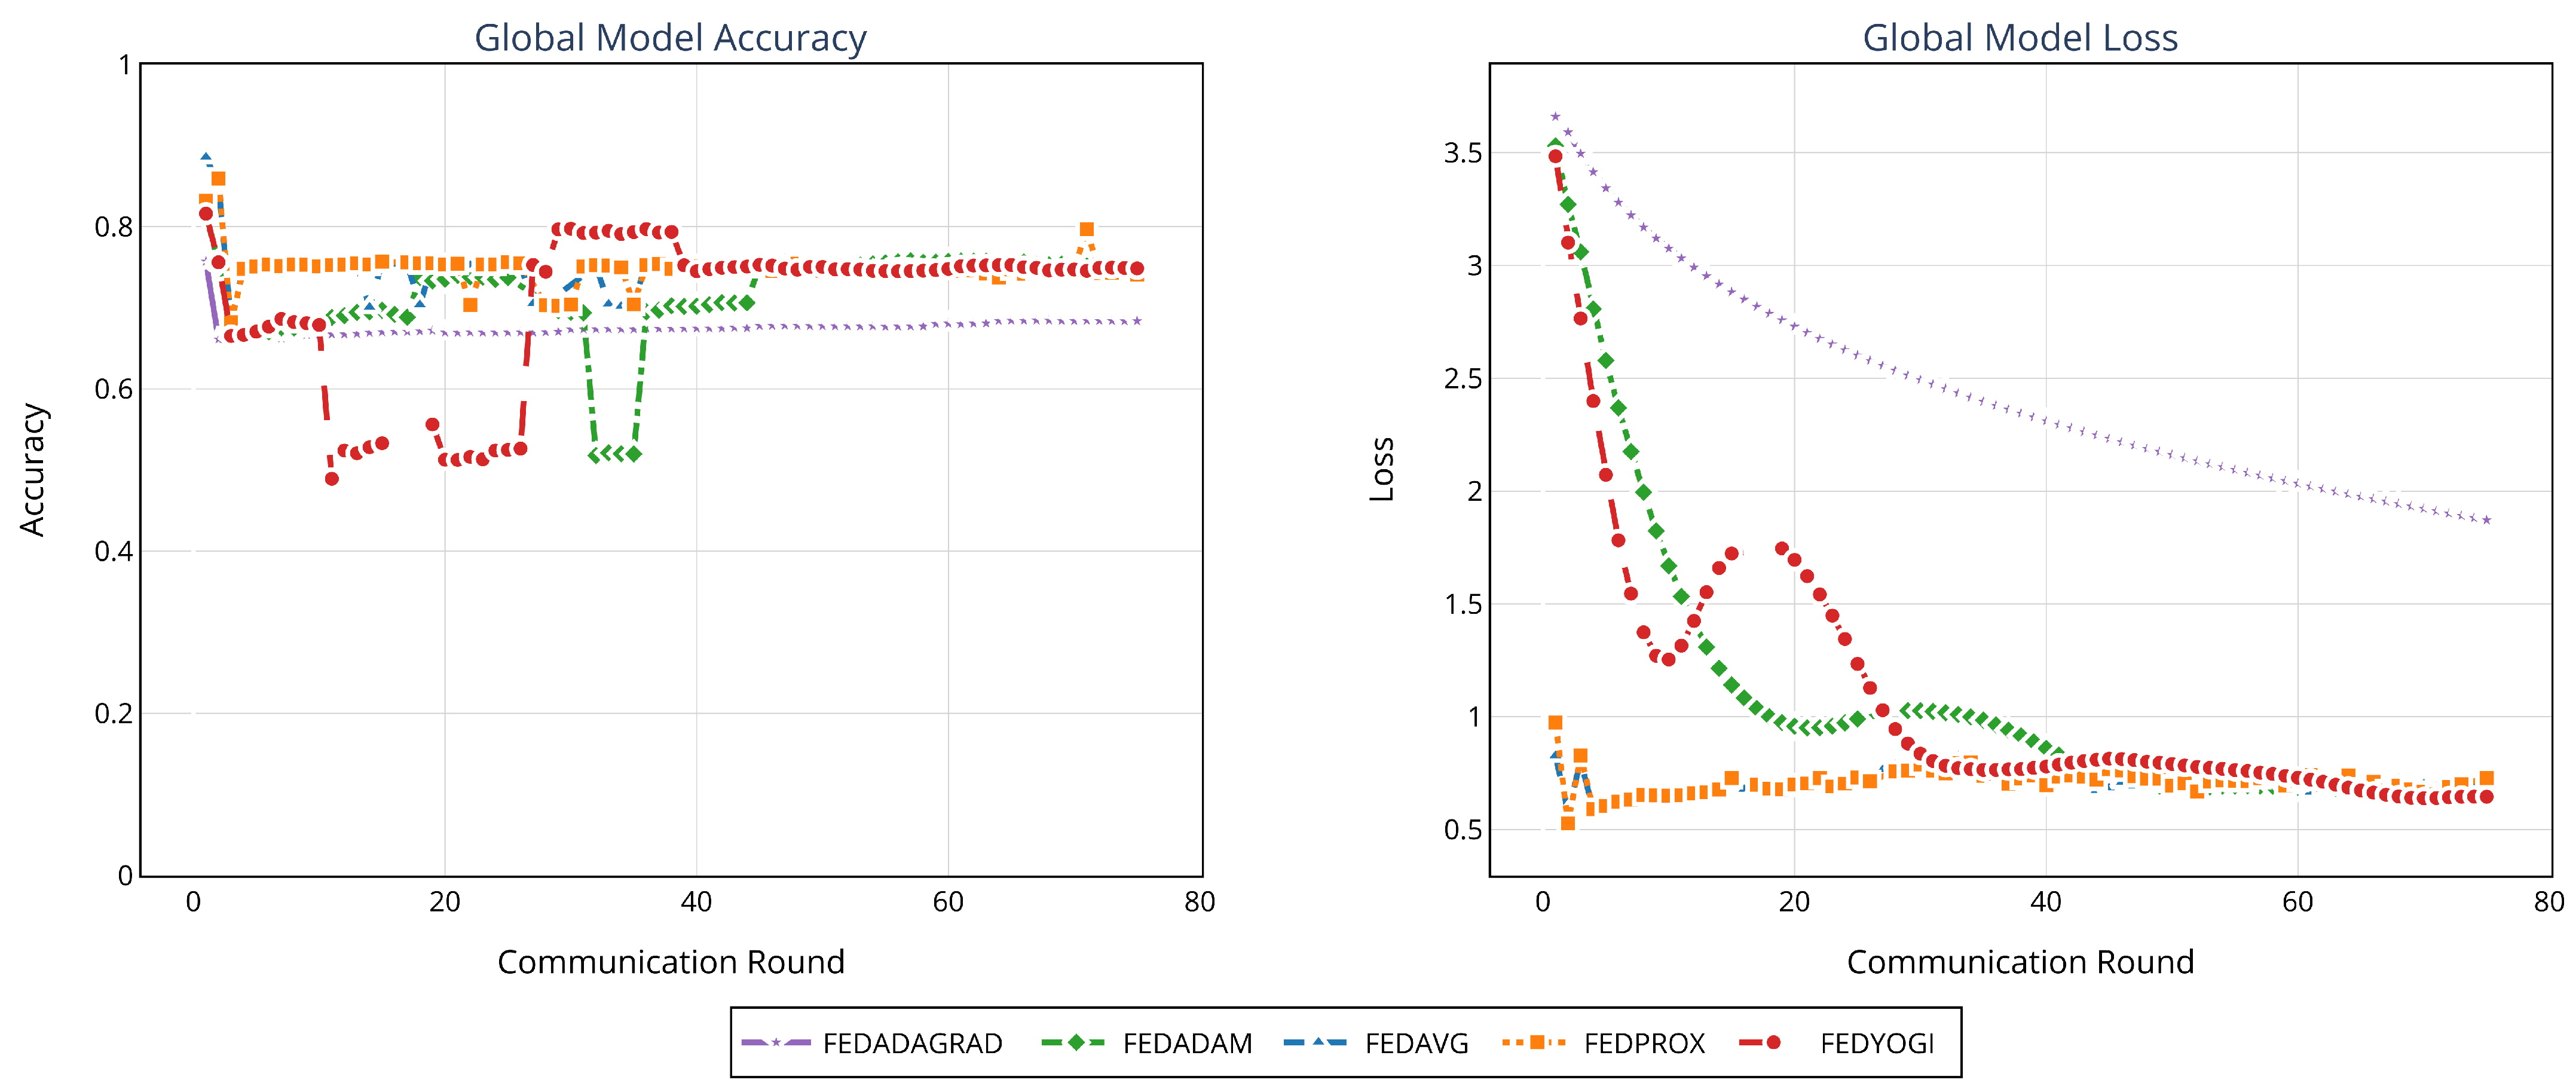
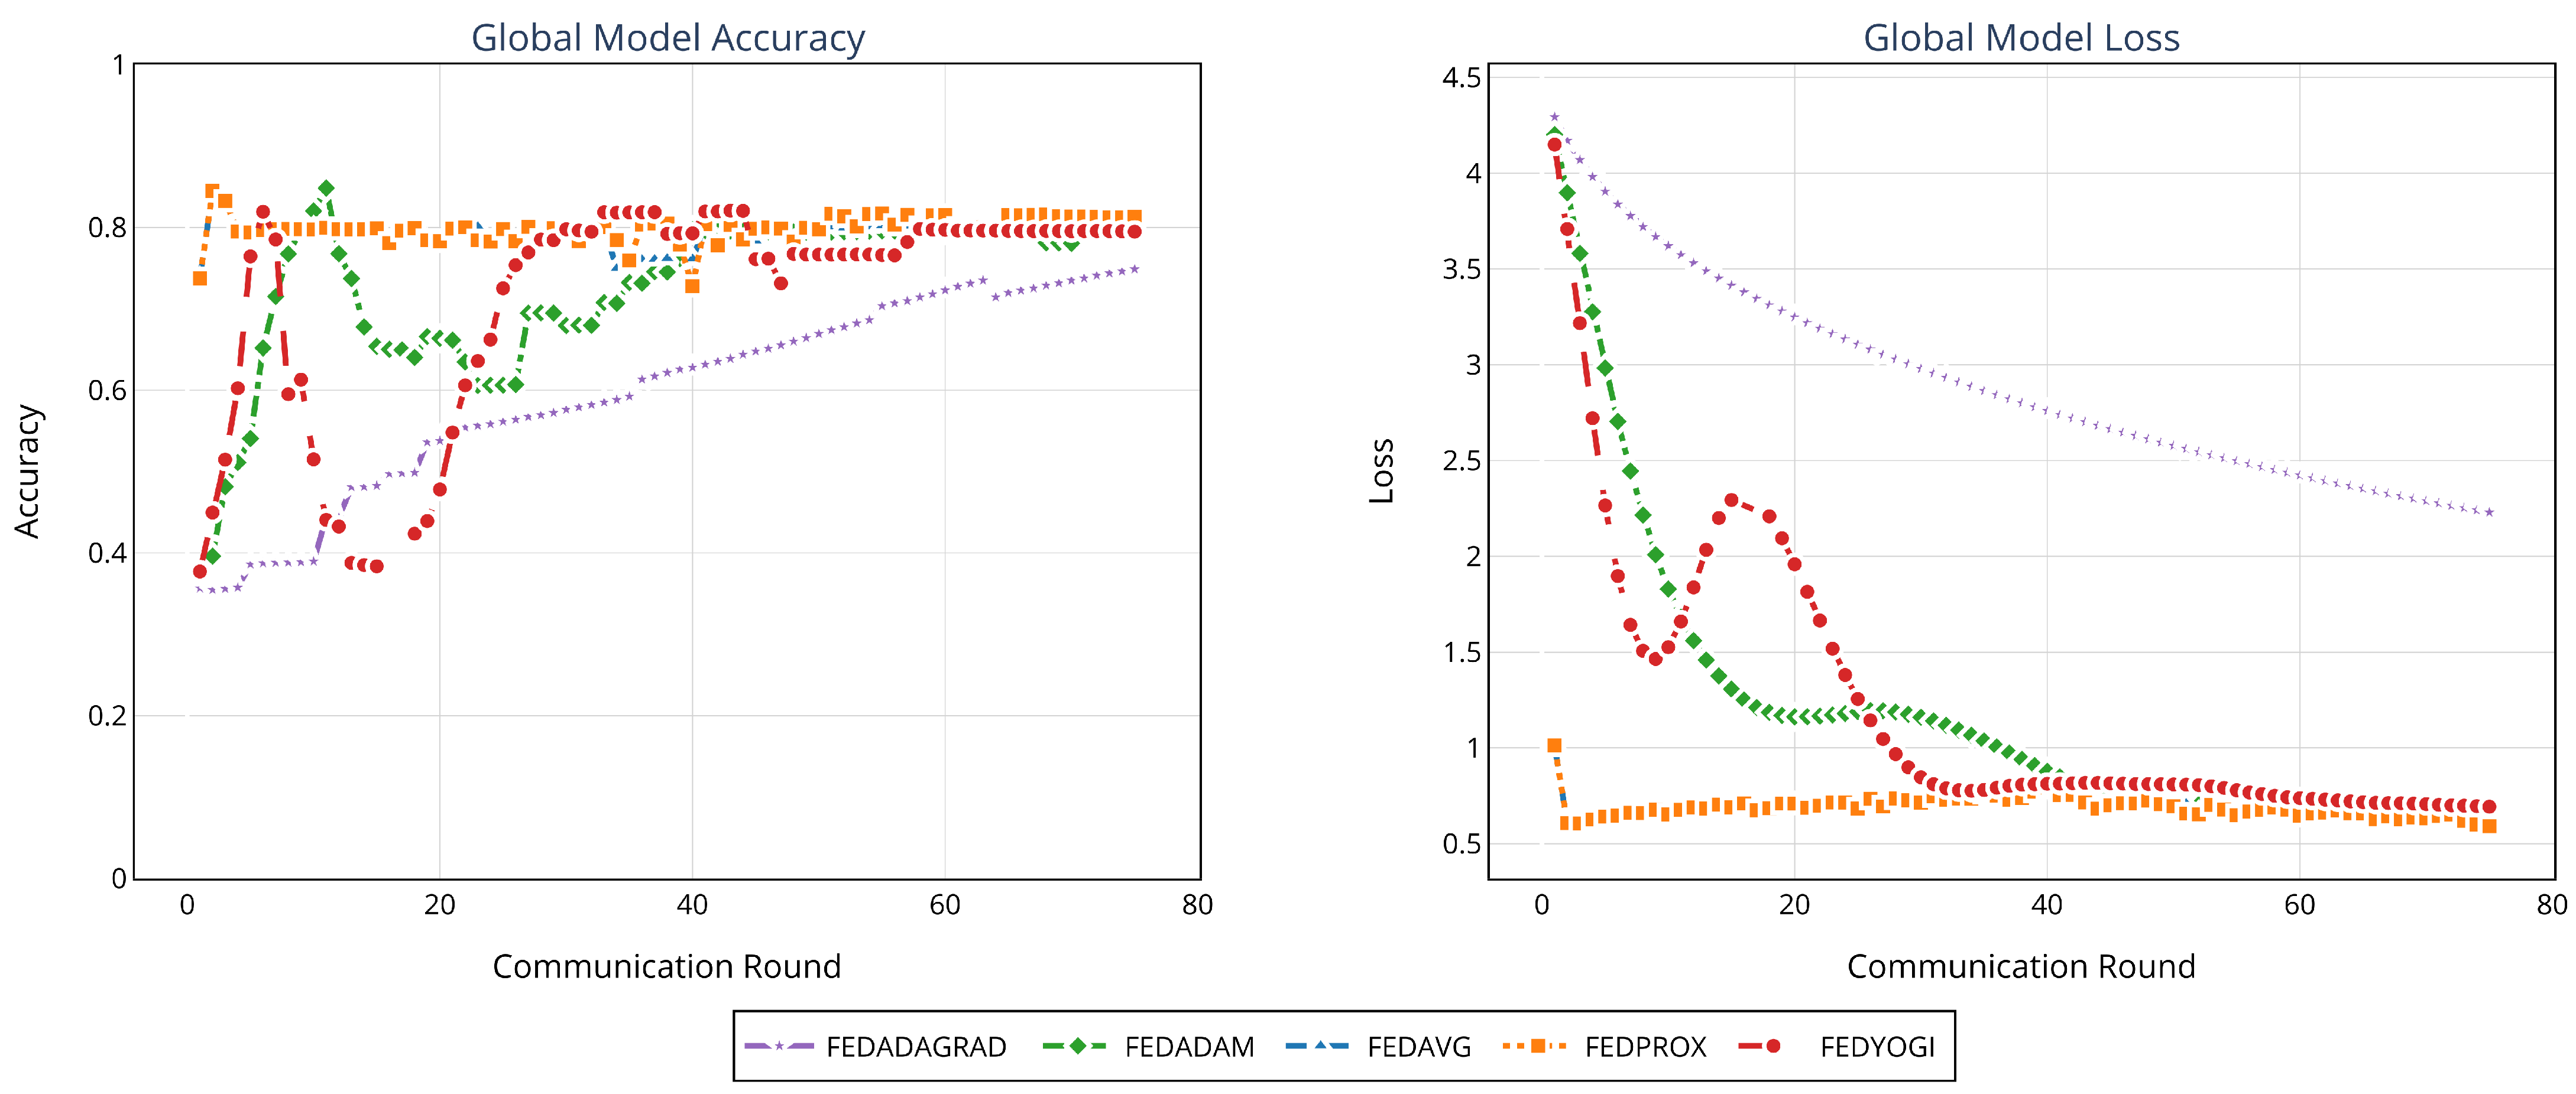
The line chart of global accuracy and loss presented in Figure 11 demonstrates that the methods based on adaptive optimizers (Adam [98], Yogi) converge more quickly and achieve better final values for accuracy and loss. The spread across rounds indicates stability in training around round 40 without abrupt fluctuations.
All methods, except FedAvg and FedAdagrad, completed training in approximately 2.3 min, showing that adaptive optimizers improve not only performance but also computational efficiency.
These results show that using FedAdam as the federated aggregation method provides a better balance between performance and efficiency, making it suitable for scenarios in which accuracy and convergence time are key factors. FedYogi and FedProx are also valid alternatives, although they have slight disadvantages in terms of metric balance. Owing to its low performance, FedAdagrad is not recommended for critical applications.
Data from Client 5 were used to assess the performance of the global model using the FedAdam aggregation method. The global model is completely unaware of the client’s data.
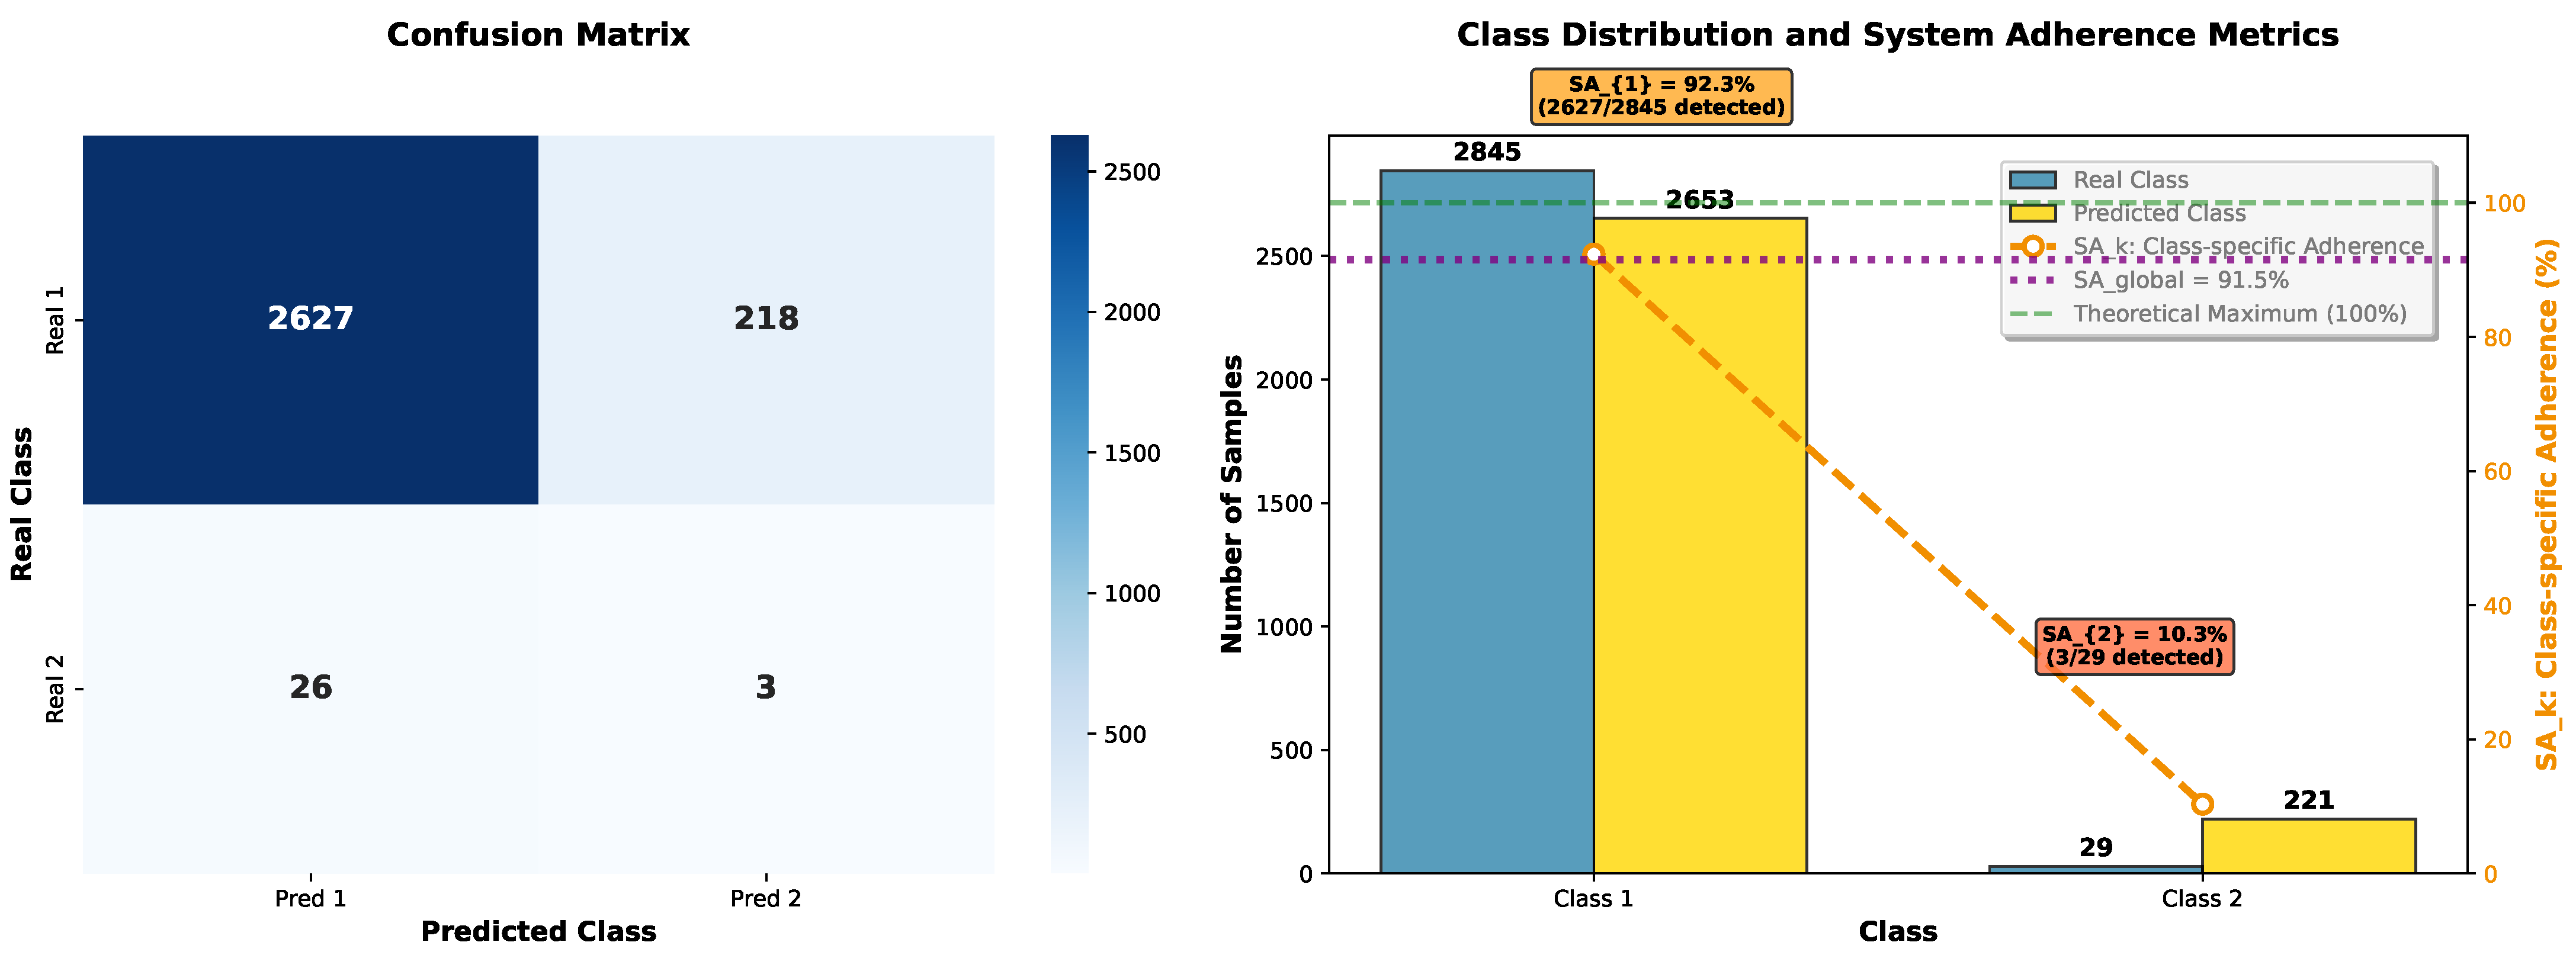
Figure 12 shows the adherence analysis of the FL model for LTE coverage under normal operational conditions, where it can be seen that the model demonstrated excellent reliability for good coverage with a S A global of 91.51%, indicating that 91.51% of the predictions achieved perfect adherence ( S A i = 100 % ), while 8.49% required human intervention ( S A i = 0 % ).
Table 6 shows the System Adherence analysis for client 5, where the actual non-IID data distribution consists of 98.99% for class 1 (LTE Good coverage) and 1.01% for class 2 (LTE Fair coverage). The table presents the SA metrics that demonstrate operational reliability through LTE coverage classifications in FL under normal network operating conditions.
Table 7 shows the S A k metrics, which indicate the recommendations for strategic decisions according to the LTE coverage classes. Class 1 (Good coverage) reached S A 1 = 92.34 % , indicating that 2627 of the 2845 samples were correctly identified. This suggests implementing automated monitoring for good areas with 92.3% confidence, requiring alerts in only 7.66% of cases. Class 2 (Fair coverage) showed S A 2 = 10.34 % , with three out of 29 samples correctly classified, requiring parallel detection systems for 89.66% of issues.
Table 8 presents the suggestions based on the bias factor. The model under-predicted good coverage by 0.93× (2653 predicted vs. 2845 actual), with 6.75% false negatives for minimal operational risk. The over-prediction of fair coverage by 7.62× (221 predicted vs. 29 actual) suggests excessive alerts but ensures that critical issues are detected.
The System Adherence analysis provides an operational guide for maintaining robust LTE networks, enabling risk-based and automated strategies. A high SA metric for “Good” coverage (92.34%) facilitates automated processing, while a low SA metric for “Fair” (10.34%) required improvements. SA metric enables companies to make decisions regarding automated LTE coverage monitoring, ensuring dependability.

6.2. Simulations of Natural Disaster Scenarios

The following four disaster simulation scenarios are presented as federated clients to evaluate the robustness of the model under extreme conditions. These scenarios are essential because (i) they generate non-IID data distributions that reflect the real-world federated network, (ii) they assess the global model’s ability to maintain accurate LTE coverage classification during infrastructure failures, and (iii) they ensure that the system can support emergency response operations when traditional network monitoring is compromised. Each scenario presented for each client represents a different pattern of network degradation induced by disasters, providing a comprehensive validation of the FL approach under catastrophic conditions.

6.2.1. Fire Scenario

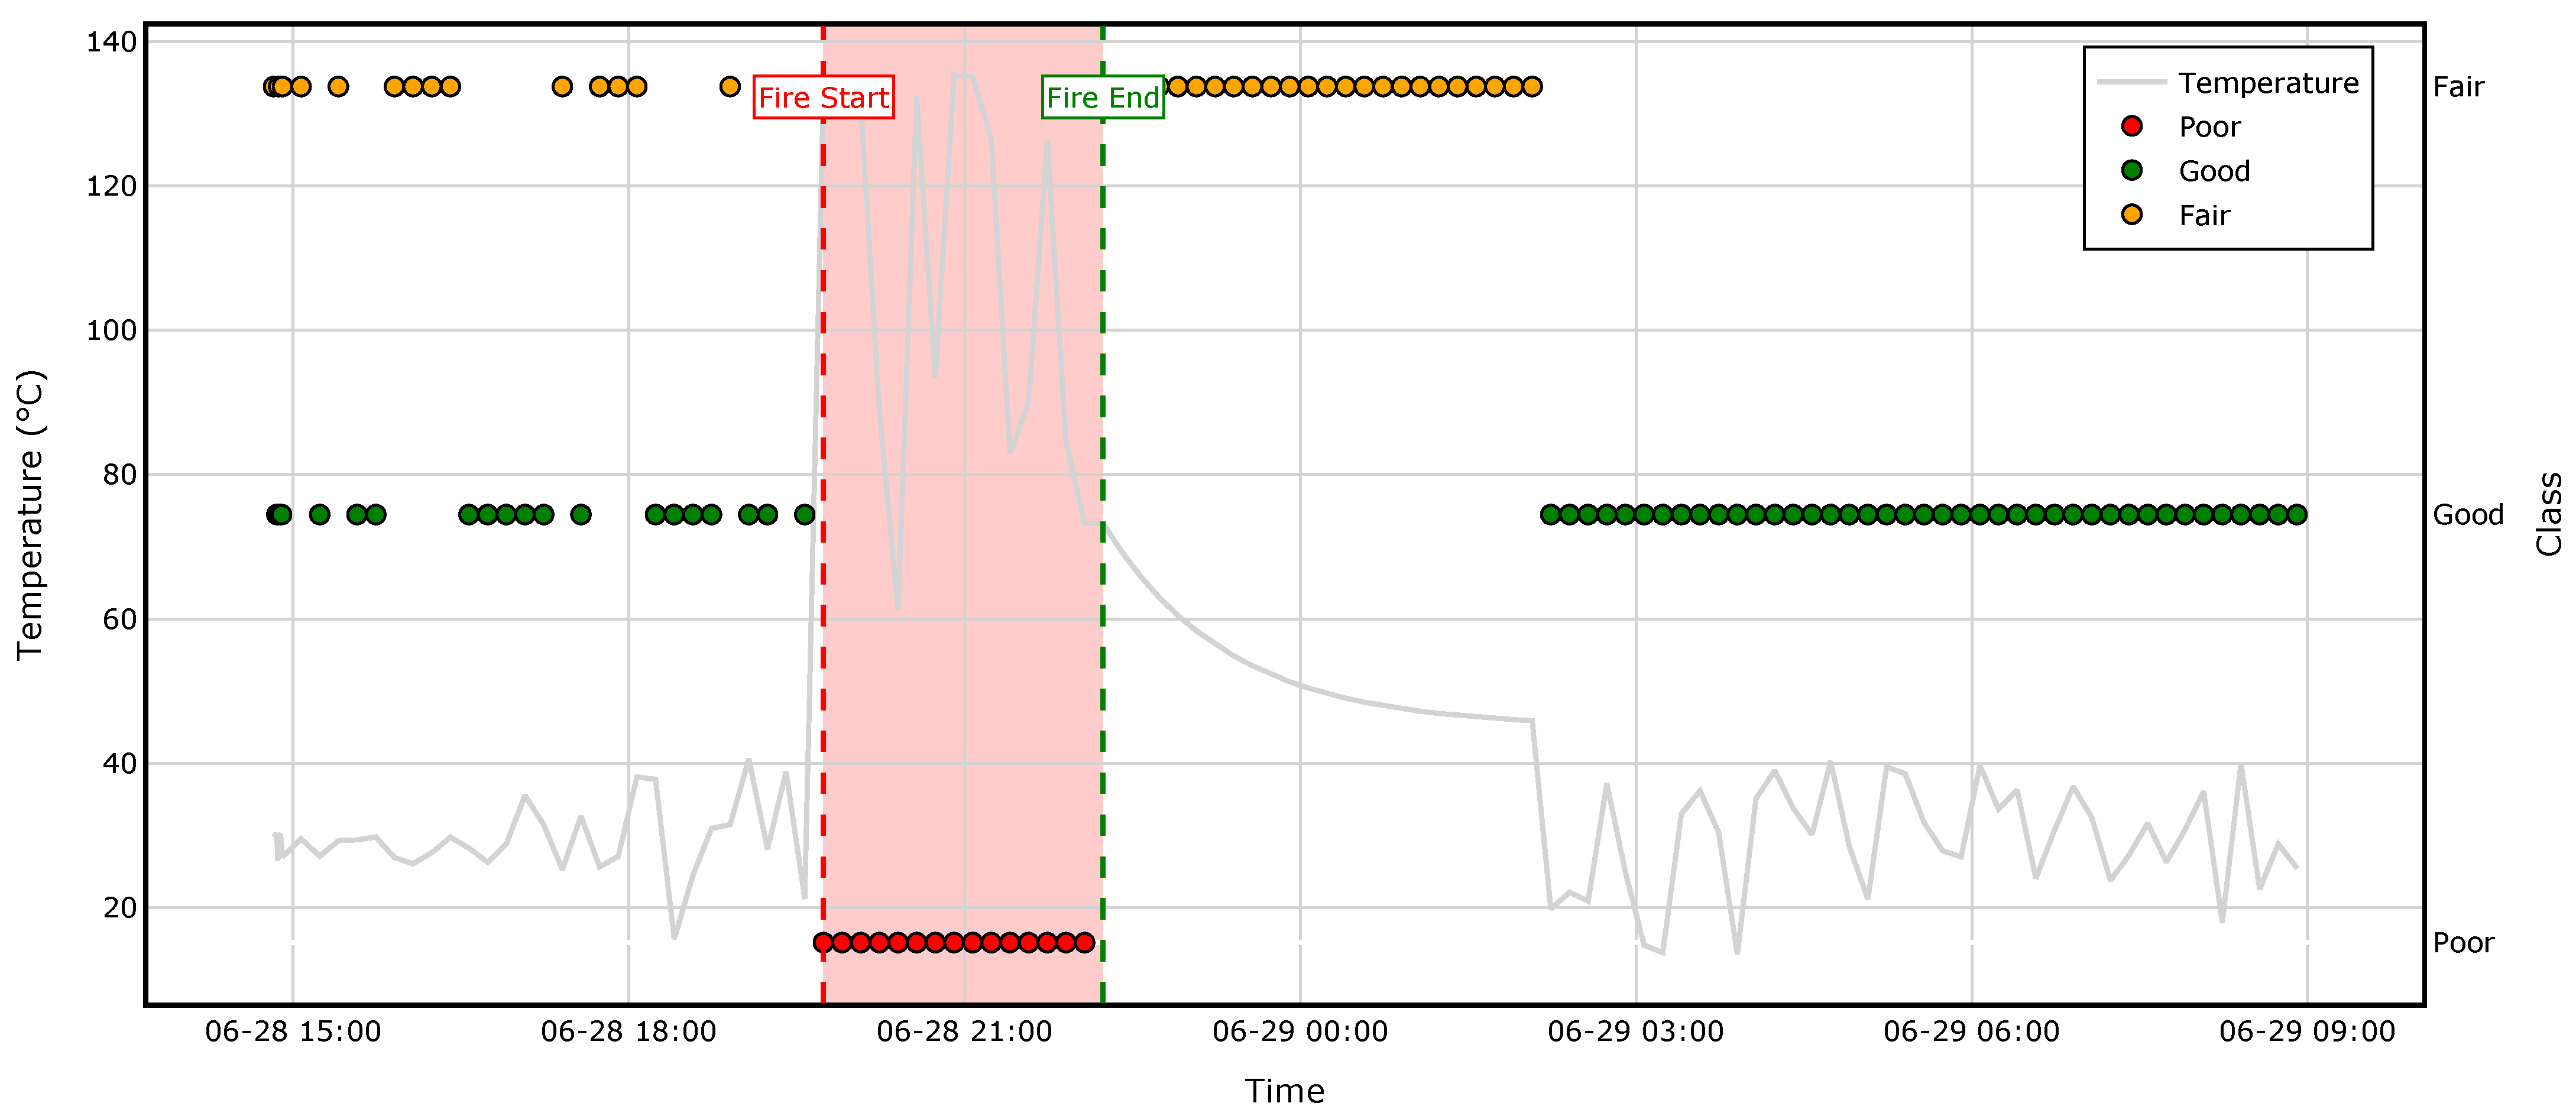
In Figure 13 it is evident that a fire occurred at client 1 on June 28, 2024, approximately between 7:44 PM and 10:04 PM, causing a temperature increase of approximately 130 °C. This event resulted in poor (Class 0) LTE network coverage. Once the fire was extinguished, efforts were made to restore the Internet connection. During this period, from 10:14 PM on June 28 to the early morning of June 29 at 2:04 AM, the coverage was regular (class 2). Finally, after 2:05 AM, the Internet connection was fully restored, achieving good coverage again (Class 1).
The fire scenario with a temperature of 130 ℃ was a simulation created to assess the extreme limits of the FedResilience system. It was designed to represent a real-life situation based on the temperature limits that the Honeywell Fire Systems Thermacable LHD-800 Linear Heat Detection Cable sensor can withstand to continue functioning after the fire has been extinguished.

6.2.2. Power Outage Scenario

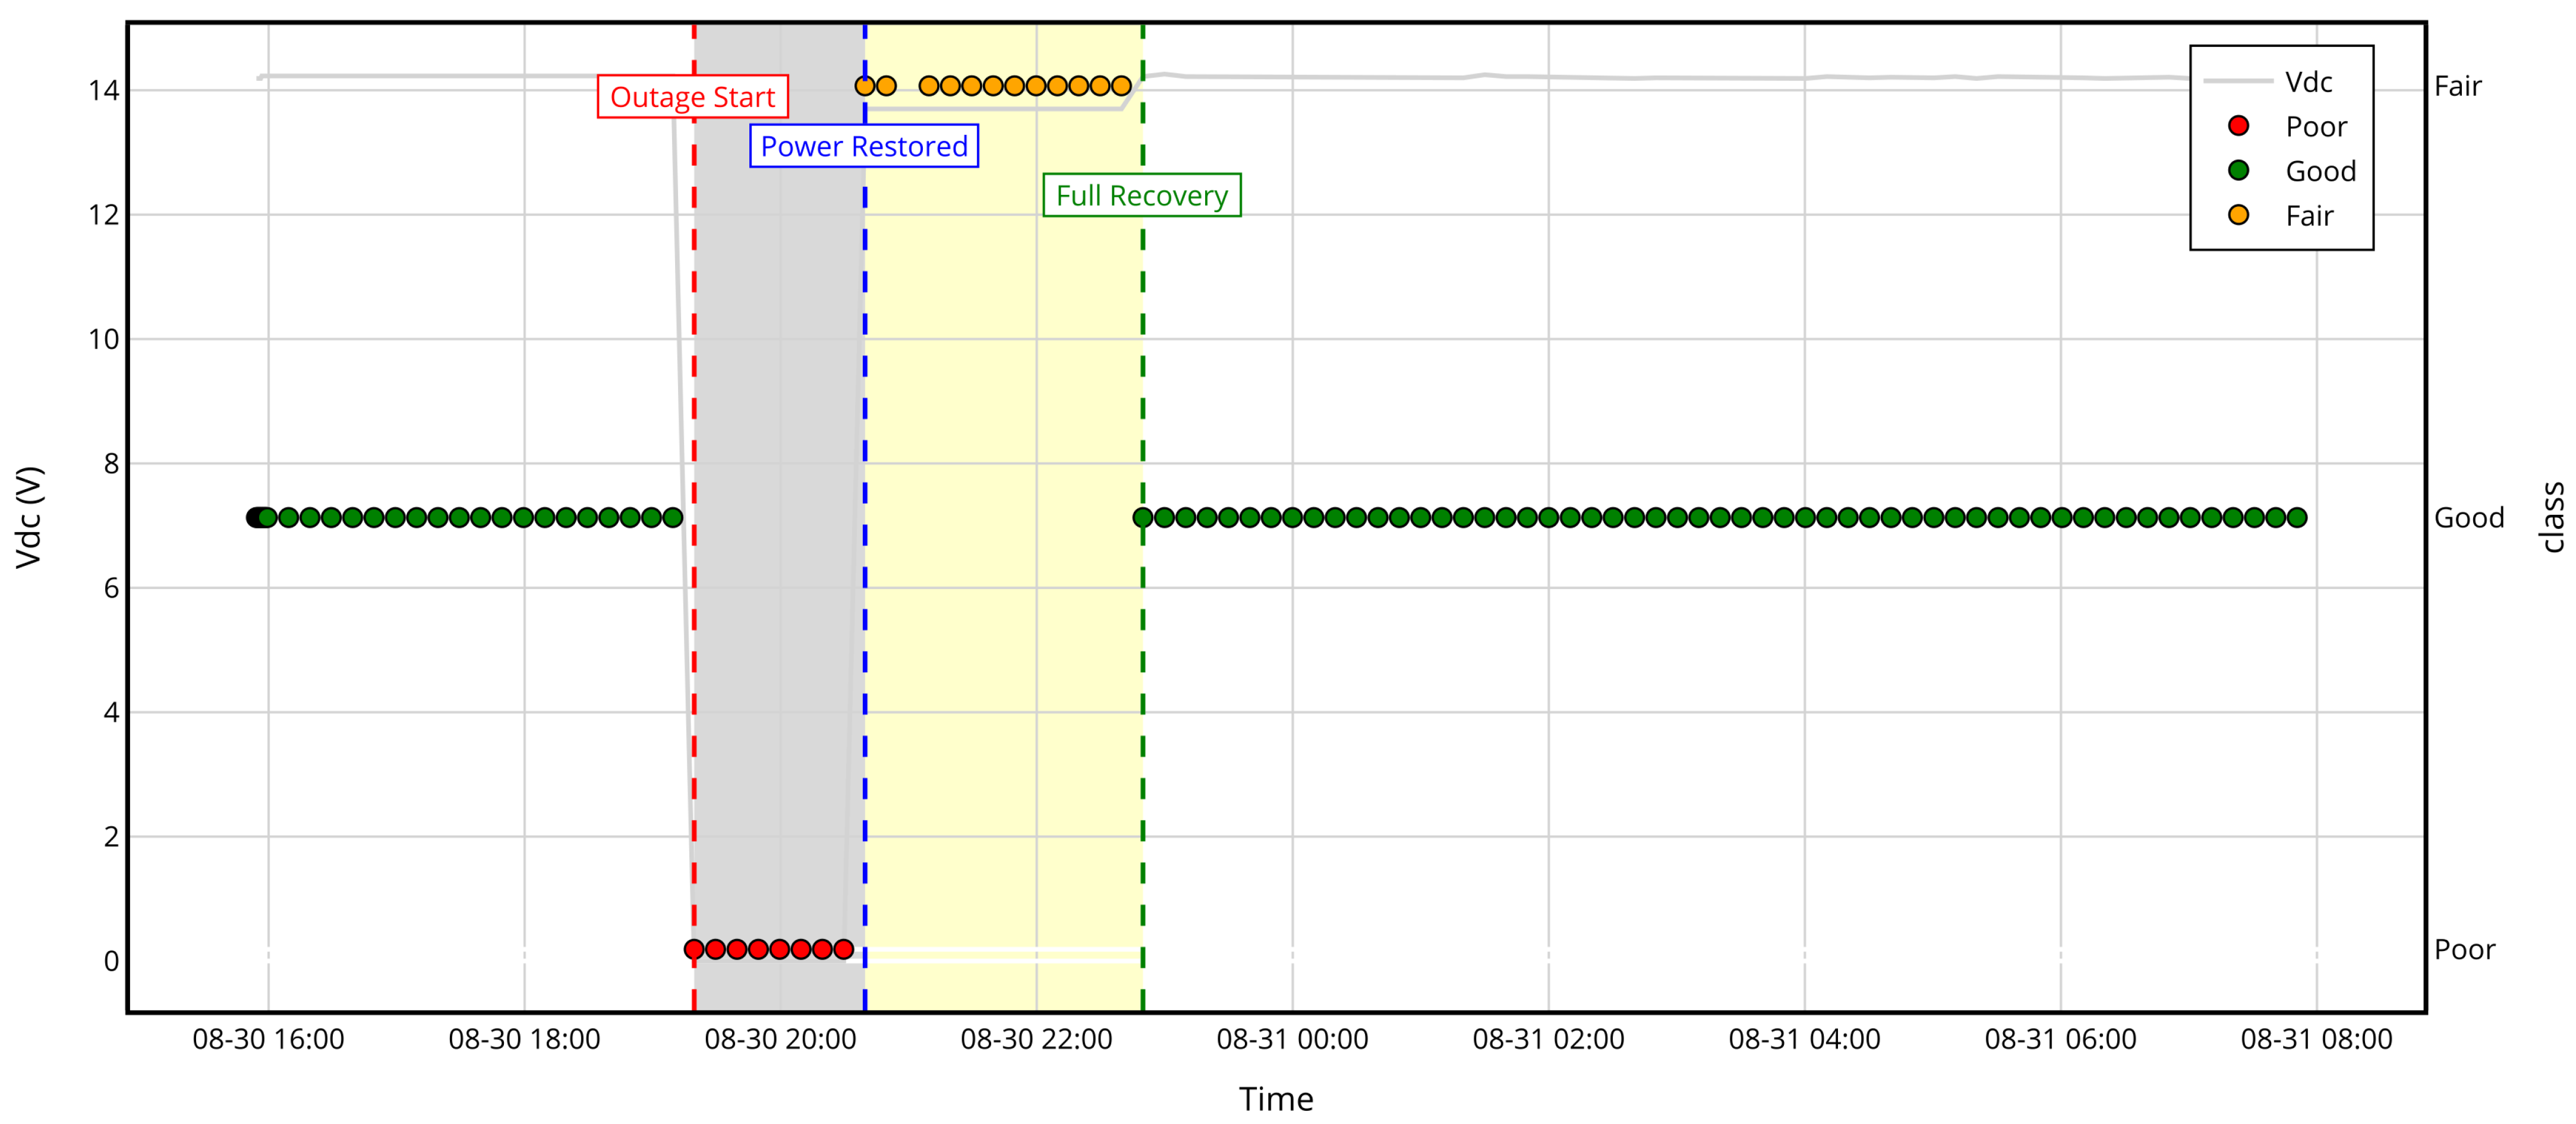
As illustrated in Figure 14, Client 2 experienced a power outage due to flooding, resulting in a voltage disruption at the node and total disconnection of the Internet connection. This event took place on 30 August 2024, approximately between 7:19 PM and 8:29 PM. During the power interruption period, the LTE network coverage was inadequate (Class 0). Subsequently, once the power outage was resolved, the systems started operating correctly; however, LTE network coverage took longer to stabilize, resulting in regular coverage (Class 2). Finally, at 10:49 PM, the network coverage improved to a good level (Class 1), and the system was fully recovered.

6.2.3. Storm Scenario

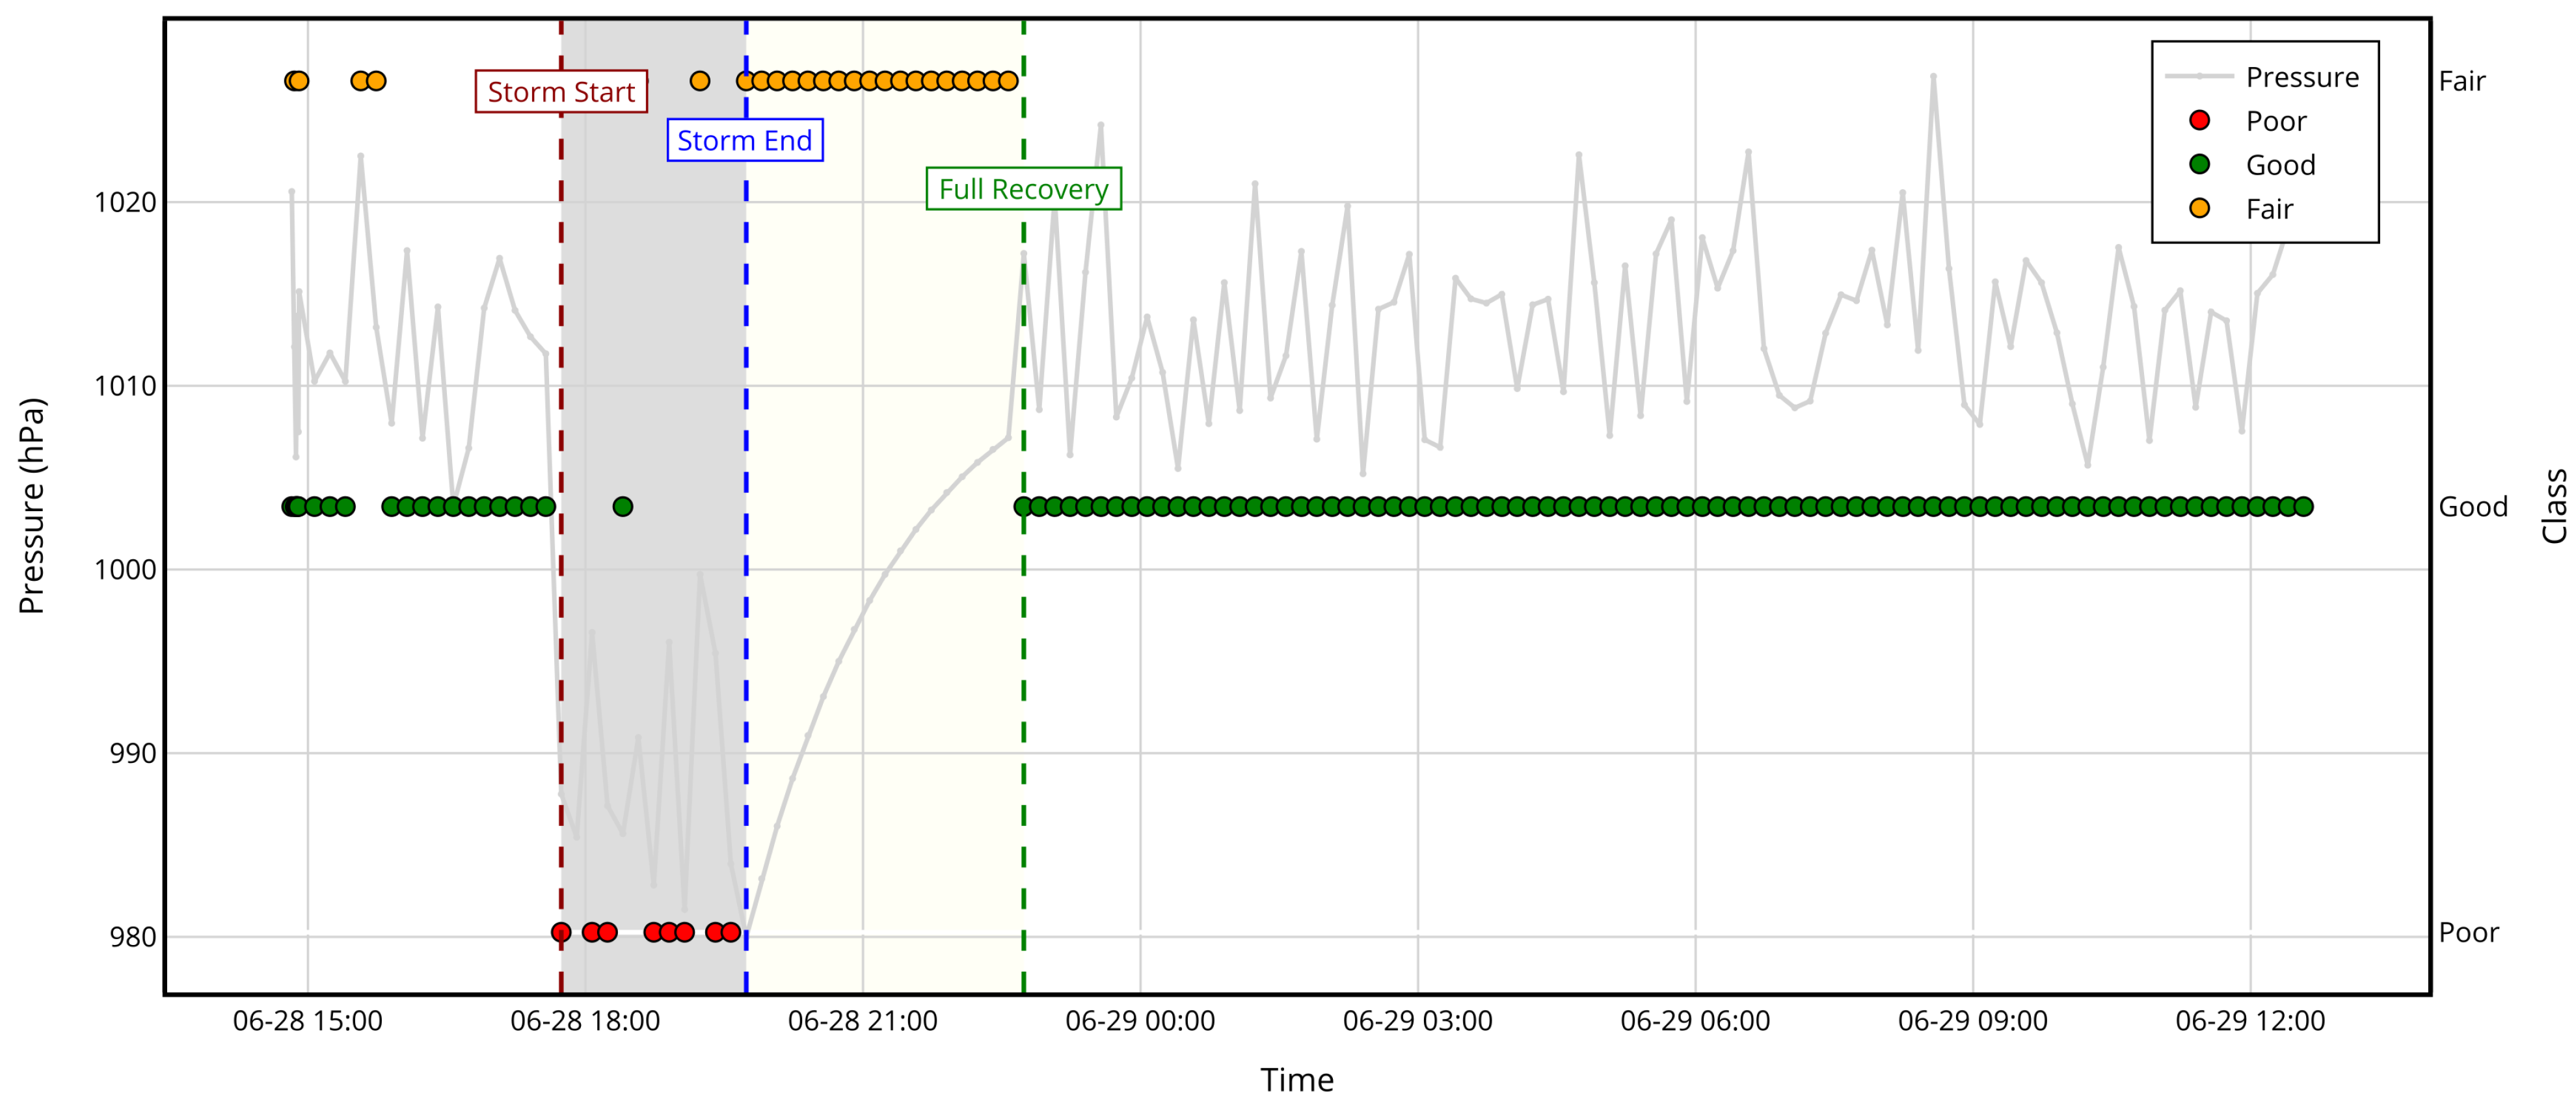
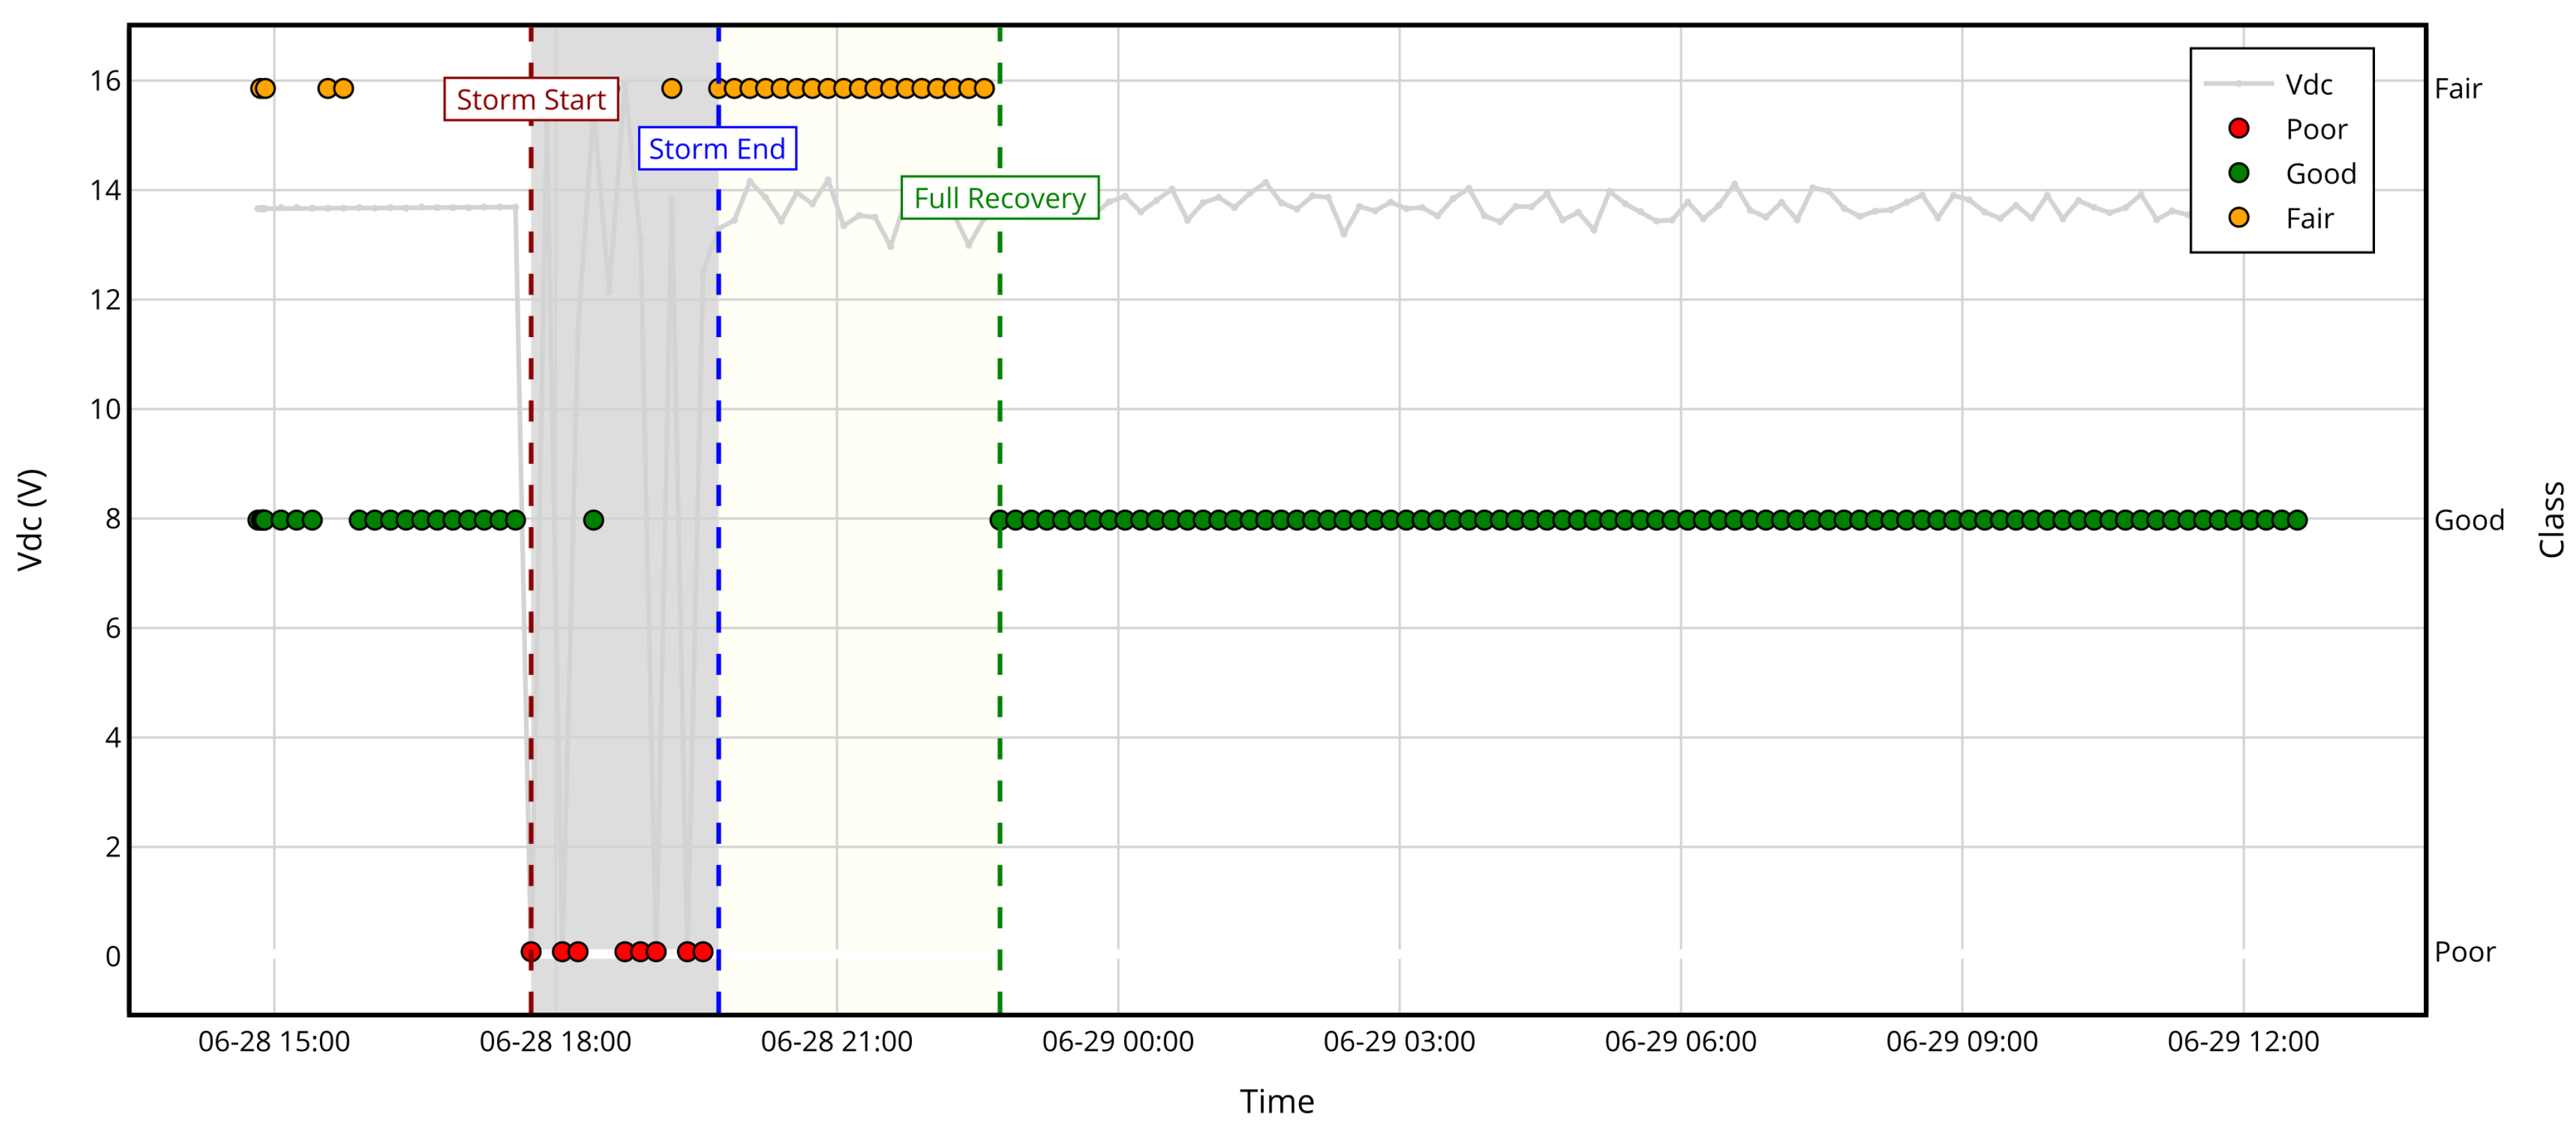
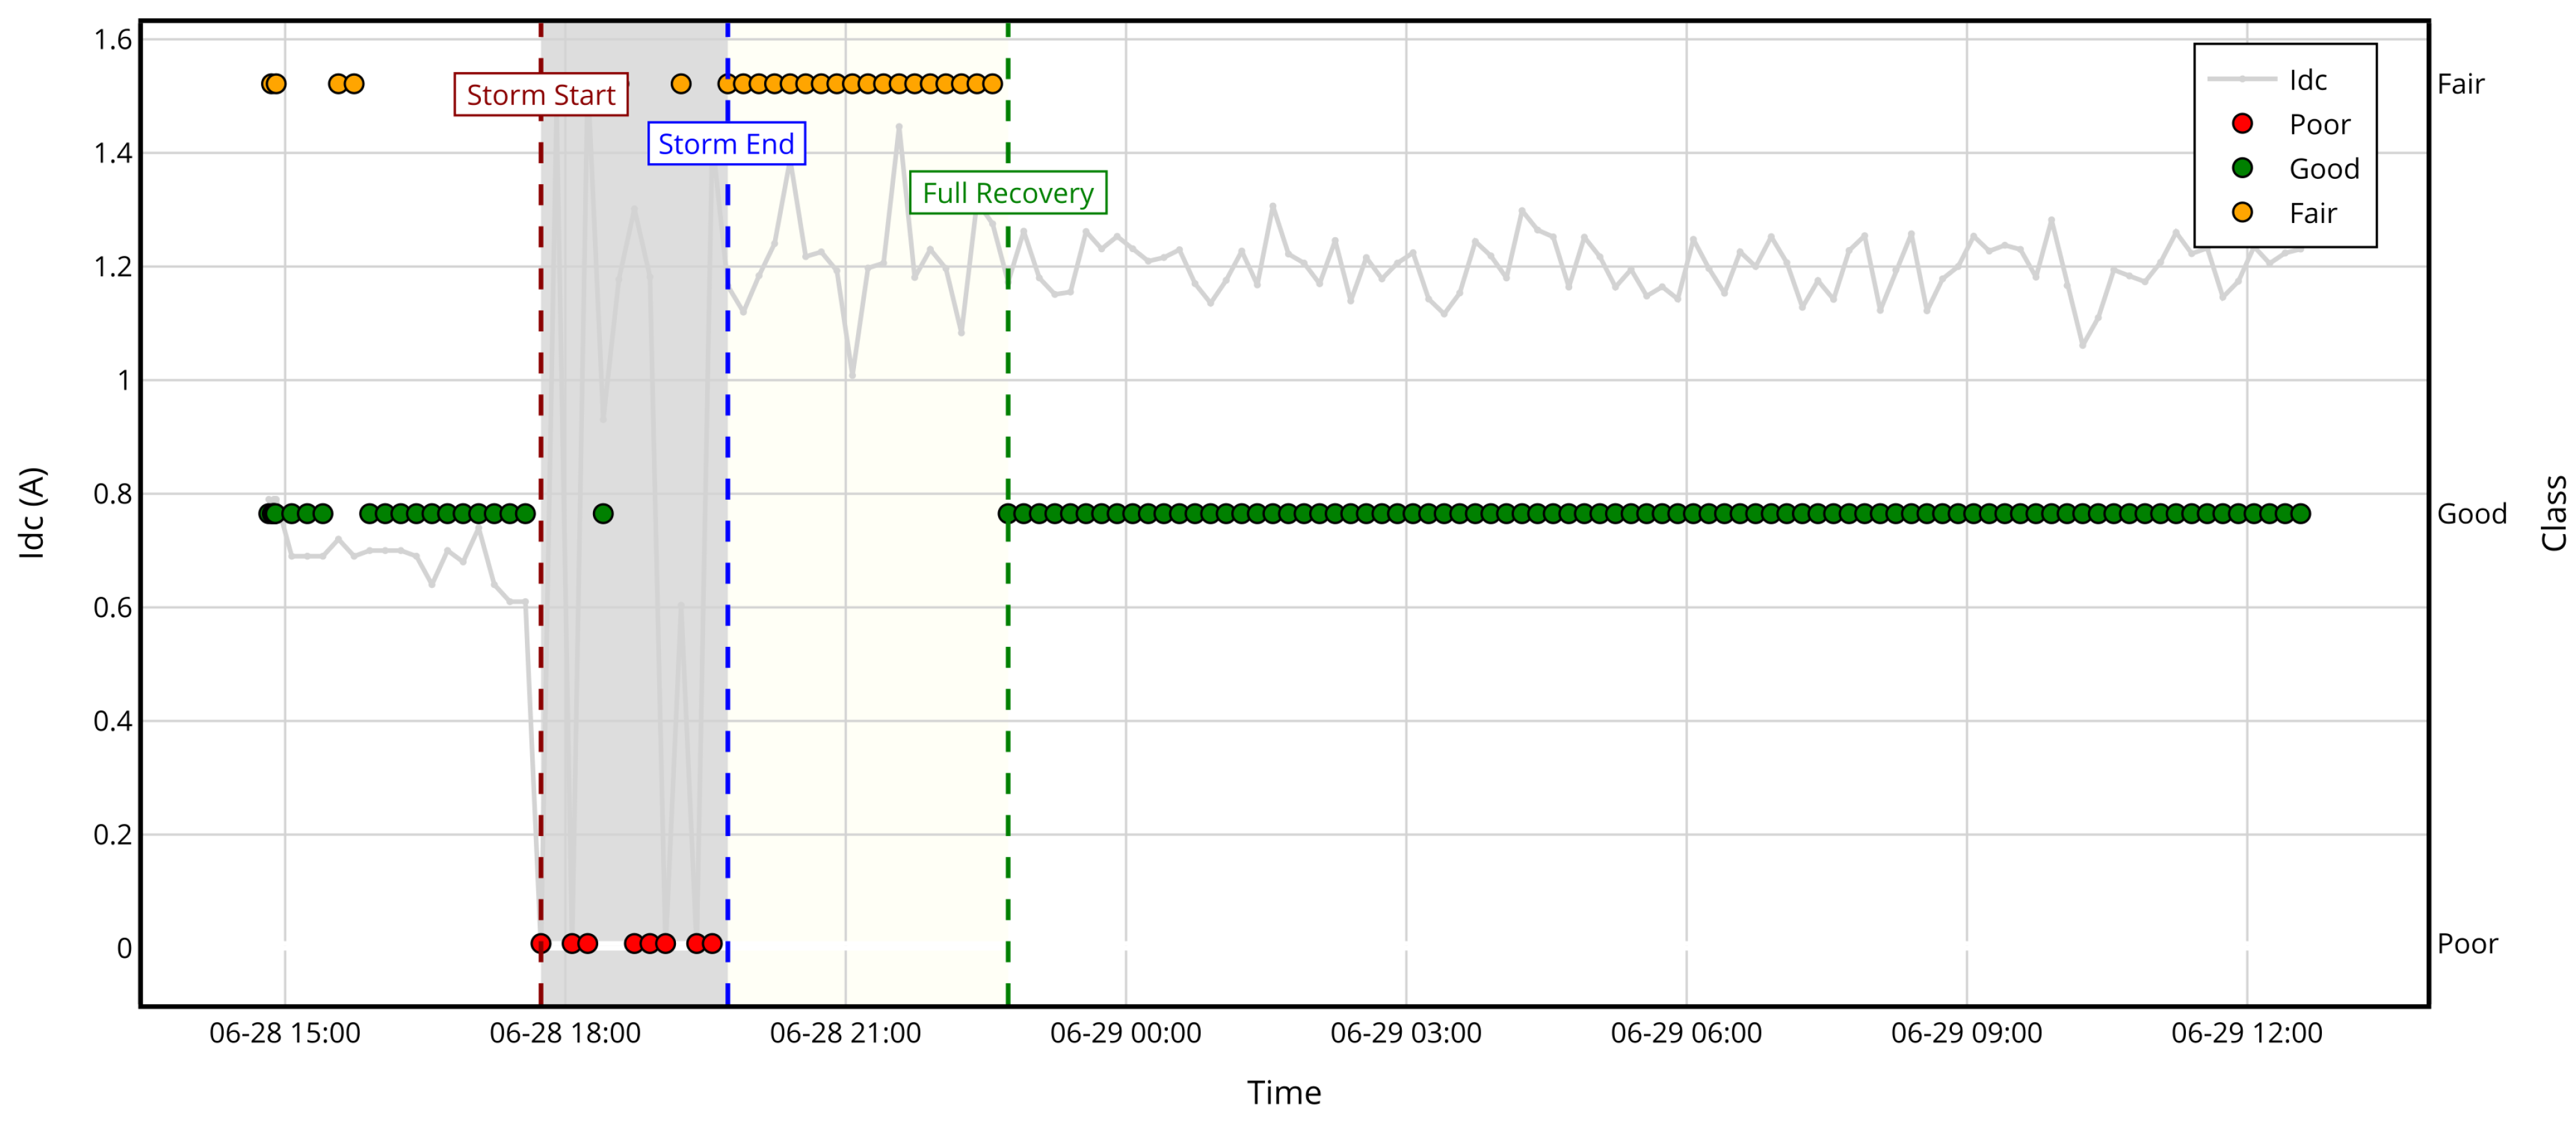
On 28 June 2024, a storm was registered at Client 3, which caused power outages and variations in atmospheric pressure. Figure 15 illustrates the variation in atmospheric pressure during the storm. Additionally, Figure 16 and Figure 17 show that, during the period between 5:44 PM and 7:44 PM, power outages caused voltage and current fluctuations, resulting in poor, good, and regular coverage (Class 0, Class 1, and Class 2). After the storm, efforts to restore the Internet connection began; however, both atmospheric pressure and current and voltage experienced gradual recovery owing to damage to cables and connectors, resulting in intermittent system operation with regular coverage (Class 2). After 10:44 PM, the coverage fully stabilized, and good coverage (Class 1) was achieved.

6.2.4. Earthquake Scenario

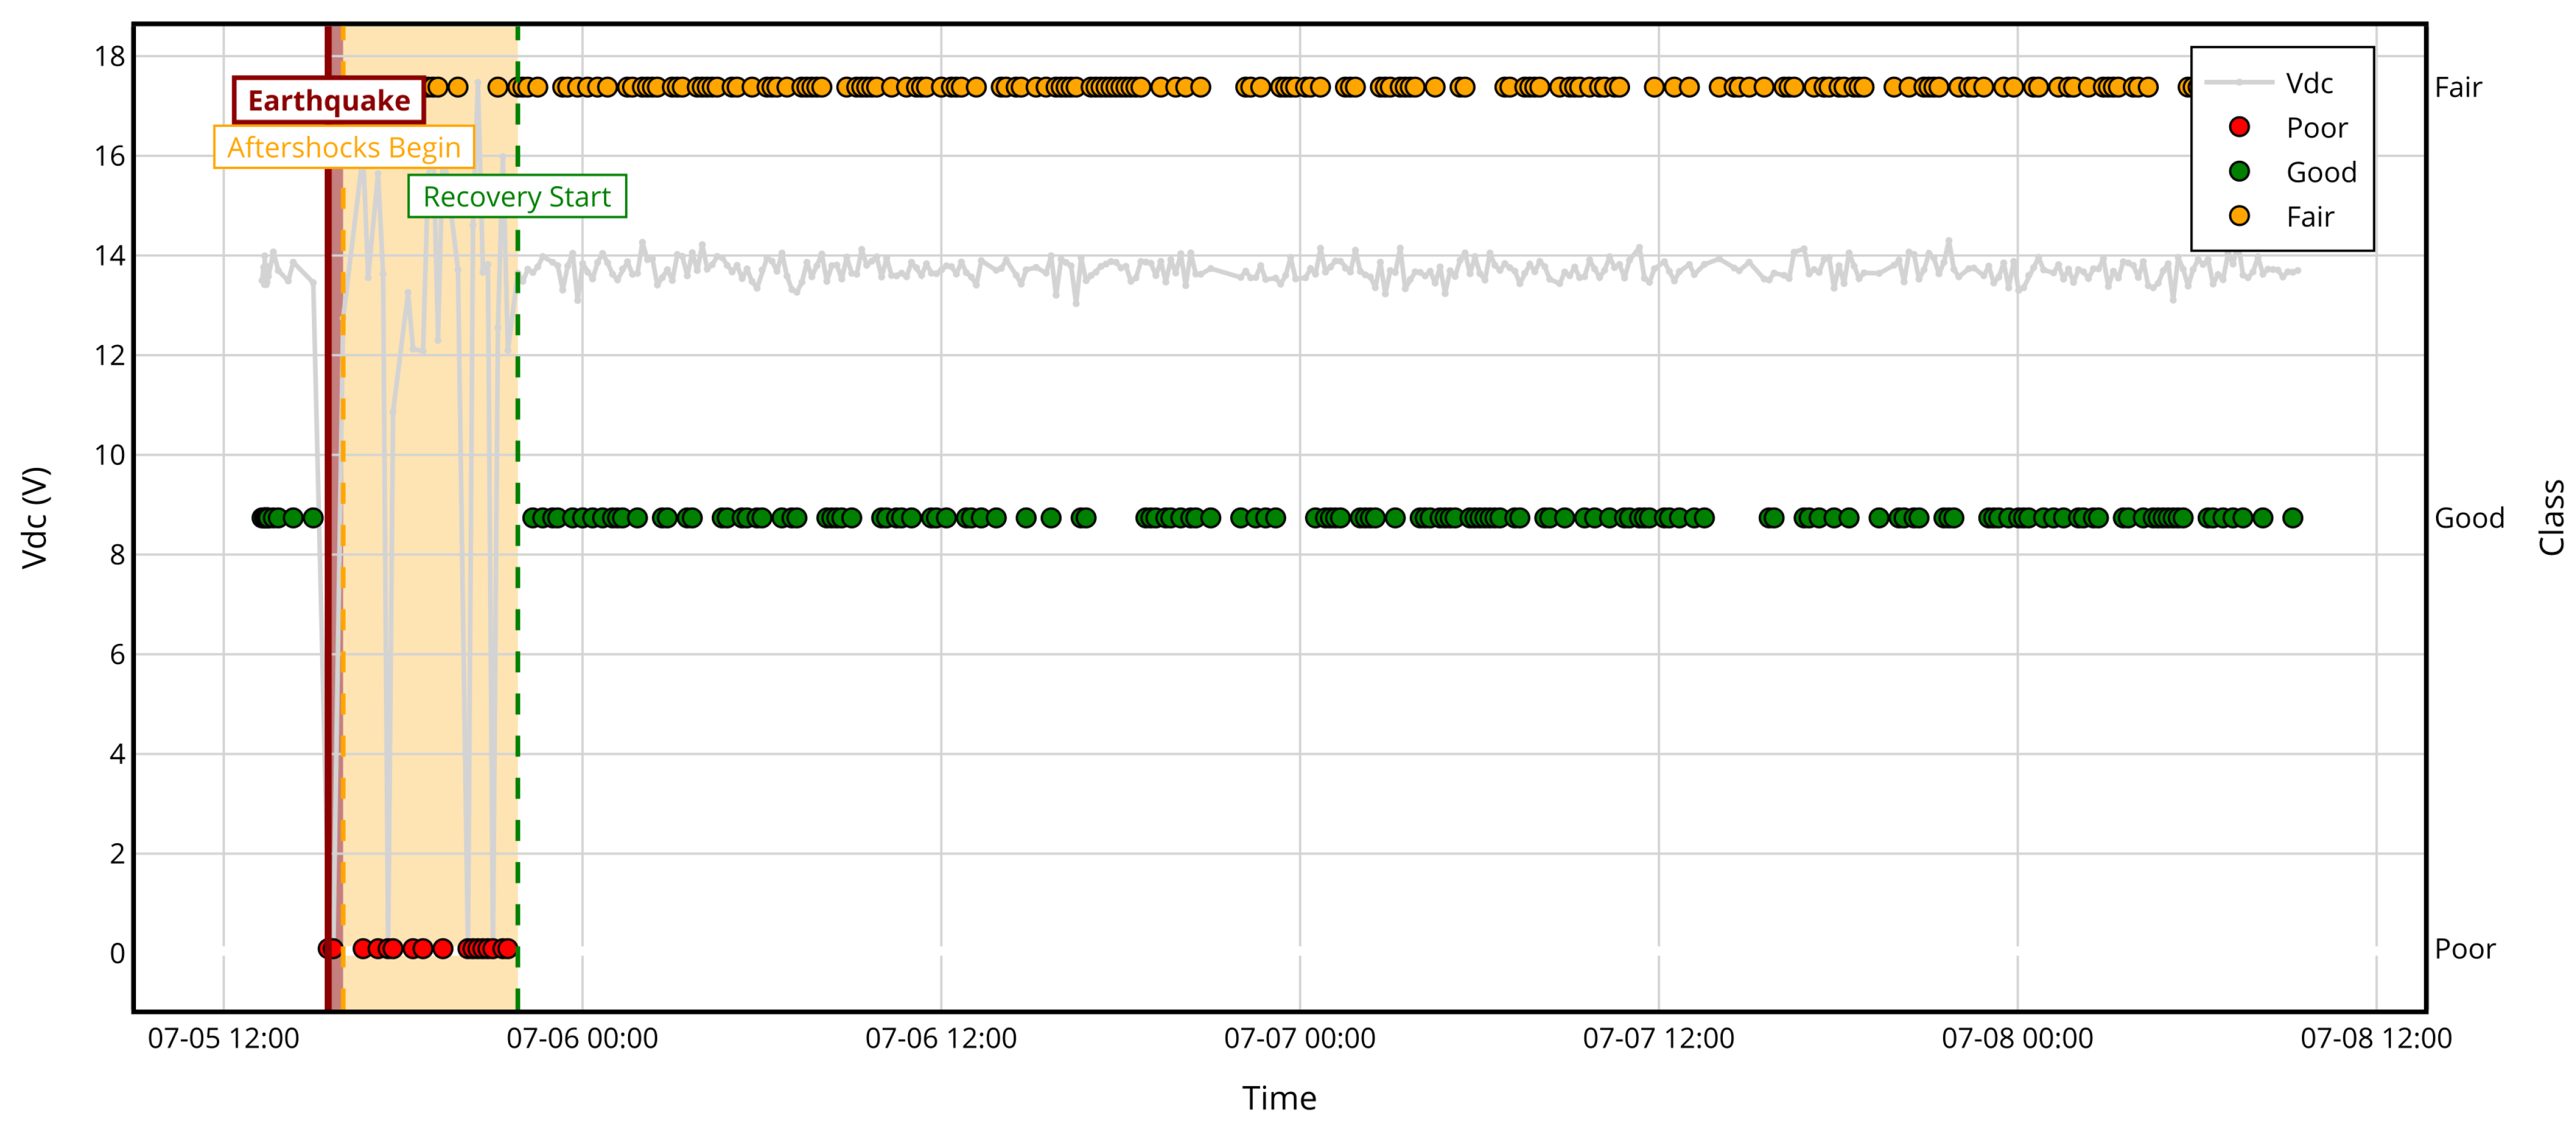
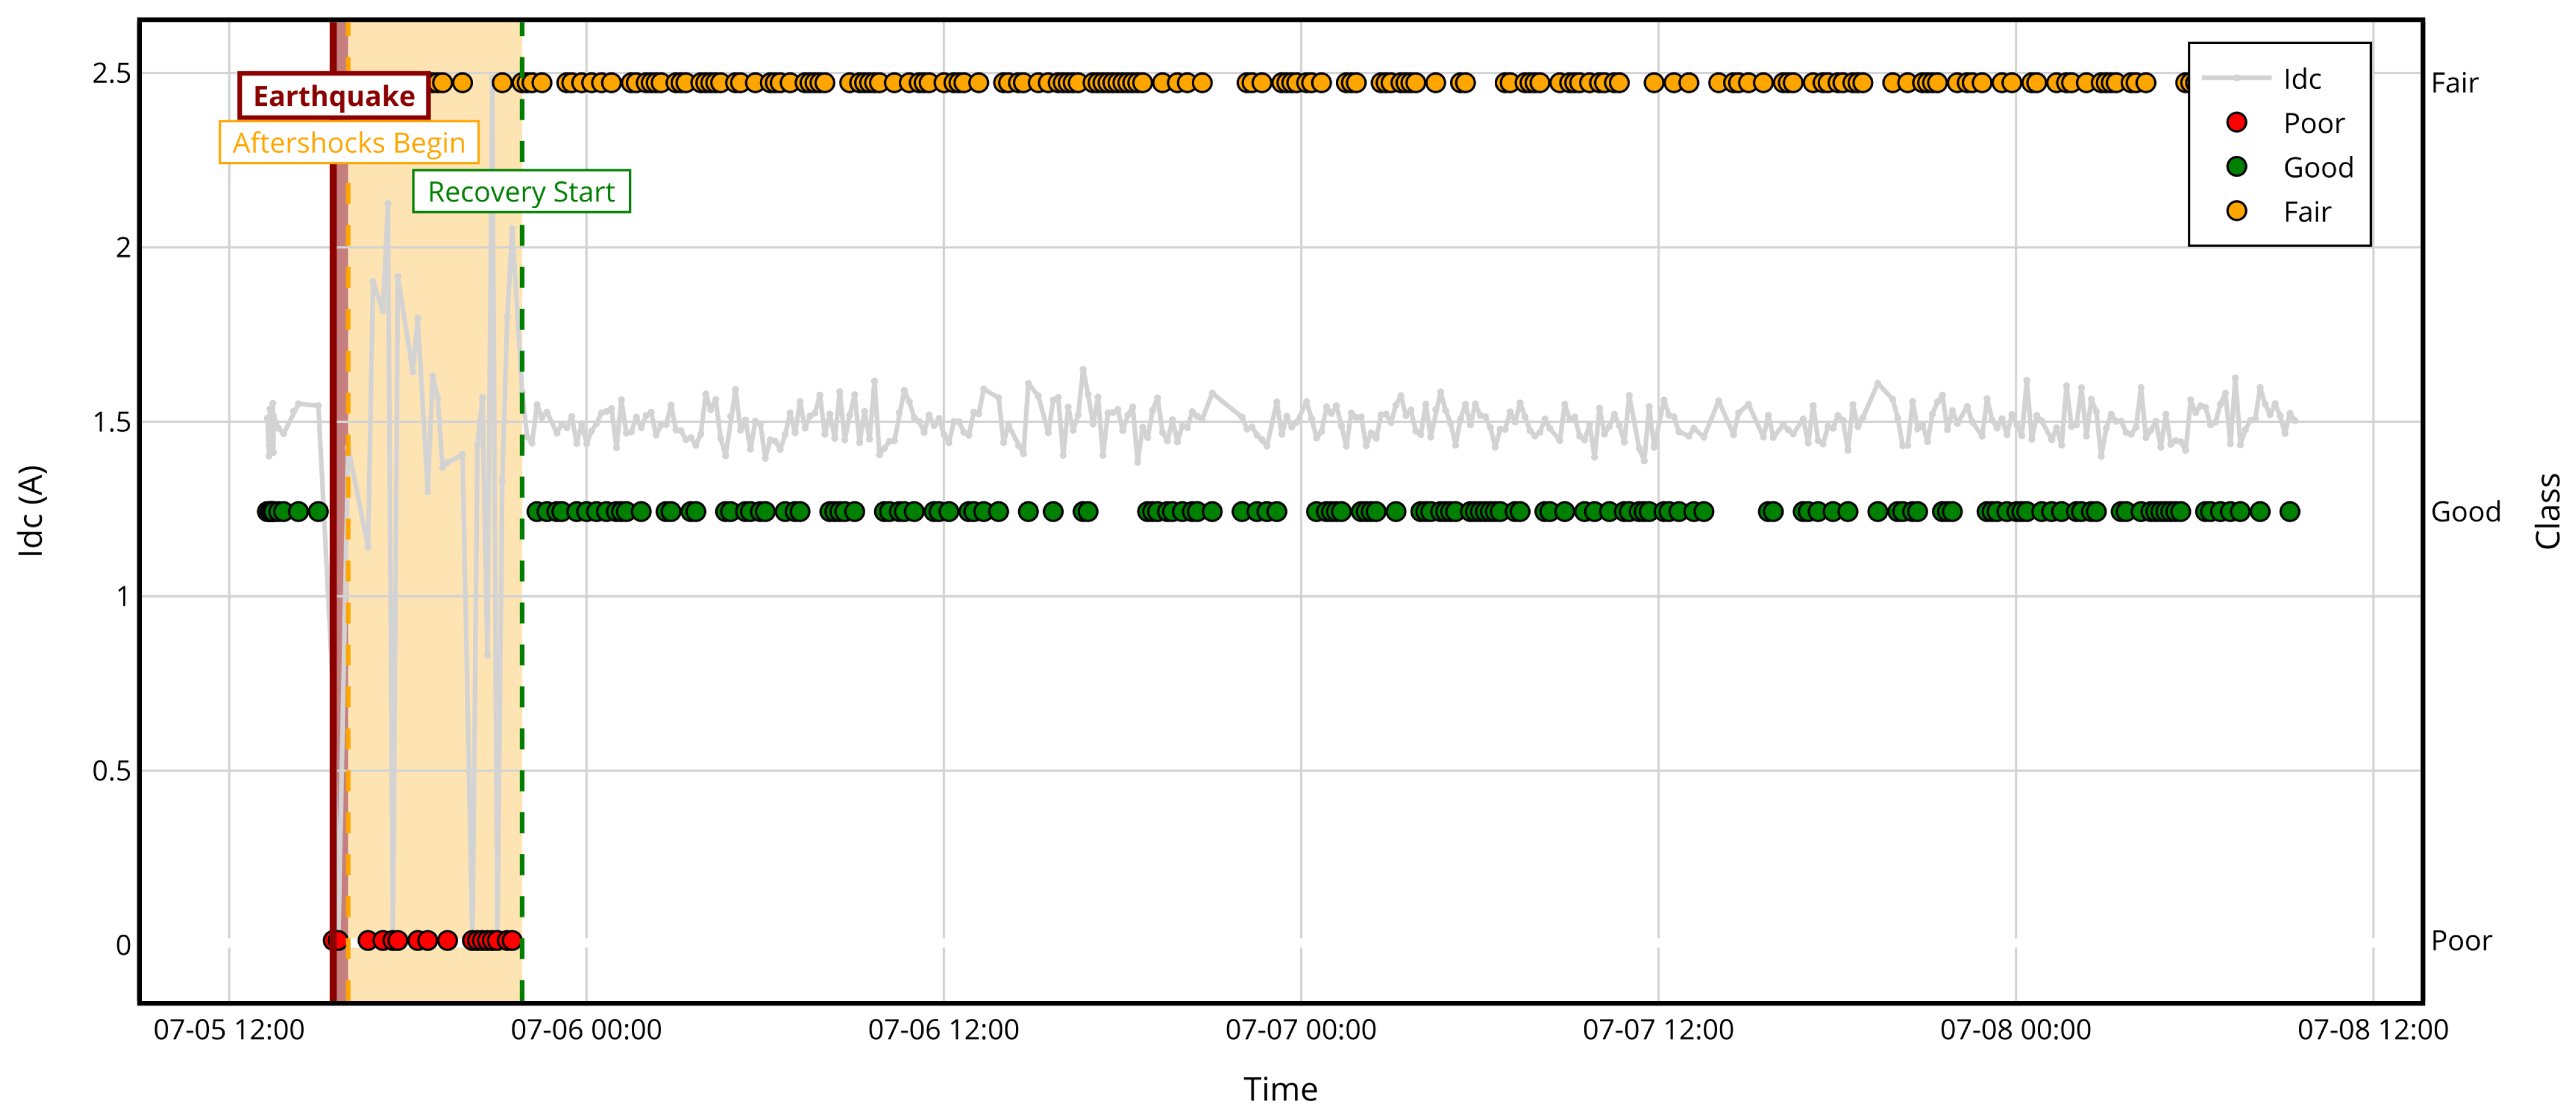
In the area of client 4, an earthquake was registered on 6 July 2024, at approximately 3:29 PM, with aftershocks lasting from 3:59 PM to 9:50 PM. During this period, variations in network coverage were observed, resulting in deficient (class 0), good (class 1), and regular (class 2) coverage. Figure 18 and Figure 19 show that after 10:20 PM, the aftershocks continued slightly, causing the coverage to vary between good (Class 1) and regular (Class 2).
With these natural disaster scenarios, which caused variations in LTE network coverage, a global FL model was trained using the architecture presented in Section 4.9.
The experimental results presented in Table 9 indicate significant differences in the performance of the five aggregation strategies evaluated in natural disaster scenarios, such as fires, power outages, storms, and earthquakes.
FedProx was the most effective strategy, achieving the highest F1-score of 0.7946 and a accuracy of 0.8131, followed by FedAvg (F1-score: 0.7777, accuracy: 0.8021) and FedAdam (F1-score: 0.7723, accuracy: 0.7951). All aggregation strategies reached convergence within 3.2 min.
In the radar chart illustrated in Figure 20, FedProx and FedAvg excelled in terms of precision and recall, whereas FedAdagrad showed the lowest performance among the five aggregation methods, with a accuracy of 0.7487 and an F1-score of 0.7380. Therefore, this aggregation method is not robust for classifying LTE network coverage.
Additionally, the line graph shown in Figure 21 demonstrates that FedProx and FedAdam converge more rapidly; in particular, FedProx achieves better accuracy and loss values. It is noted again that most aggregation methods achieve convergence at round 40 without abrupt fluctuations, except for FedYogi.
Finally, the adherence of the global model was evaluated using data from Client 5. However, on this occasion, the probability distribution corresponding to the client was modified.
Table 10 presents the System Adherence analysis for client 5 under disaster conditions, where the actual distribution consists of 9.99% for class 0 (poor coverage), 60.02% for class 1 (good coverage), and 29.99% for class 2 (acceptable coverage).
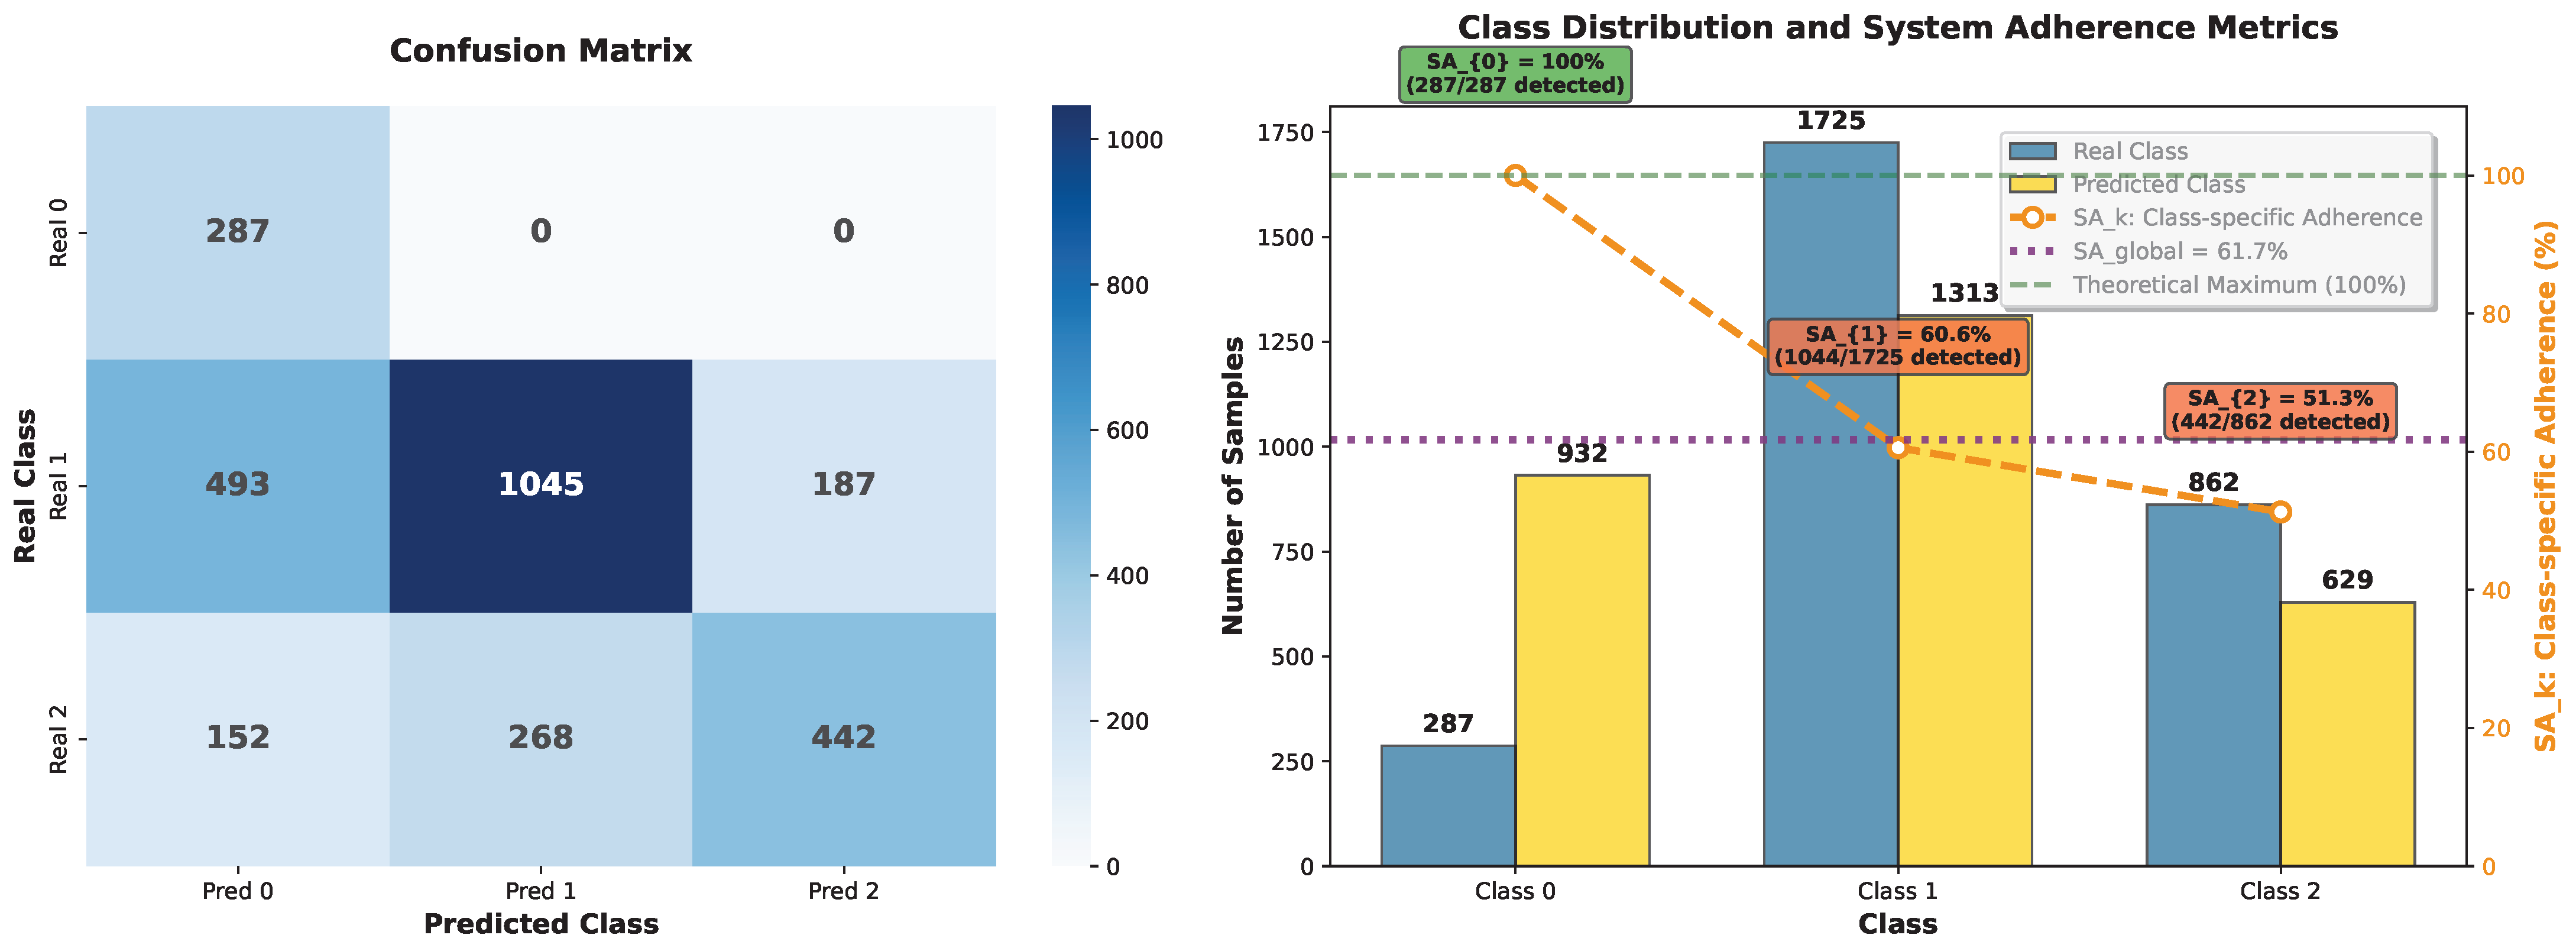
The adherence analysis presented in Figure 22 and Table 10 offers operational insights that contrast with those of traditional evaluations. The FL model showed variable reliability across classes, with a global S A global of 61.73%, indicating that 61.73% of the predictions achieved perfect adherence ( S A i = 100%), while 38.27% required human intervention by the industry ( S A i = 0%).
Class-Specific Operational Reliability: Table 11 presents the S A k for different readiness levels required for automation according to coverage classes. Class 0 (poor coverage) achieved S A 0 = 100%, indicating that all 287 samples with poor coverage were correctly identified. This suggests that the industries participating in this study should deploy automated alerts for critical coverage issues, followed by the implementation of predictive maintenance. Class 1 (good coverage) showed S A 1 = 60.58%, meaning that 1045 out of 1725 samples were correctly classified, which will require human supervision in 39.42% of cases. Class 2 (fair coverage) presented S A 2 = 51.28%, correctly identifying 442 out of 862 samples, thus necessitating human supervision in 48.72% of predictions.
Operational vs. Traditional Interpretation of Metrics: Traditional recall metrics would report identical values (class 0: 100%, class 1: 60.58%, class 2: 51.28%), while the SA metric framework provides an operational guide that transforms performance into implementation decisions. The crucial distinction lies in operational confidence: S A _ 0 = 100% allows an automatic response for low-coverage alerts without risk, because all areas are correctly identified. SA metrics directly inform the levels of automation, intervention thresholds, and risk management strategies that companies must implement to ensure safety. This interpretation will enable the configuration of gradual policies: full automation for class 0, selective automation with thresholds for class 1, and supervised operation for class 2 for corrective action.
Analysis of Prediction Distribution and Operational Bias: Table 12 displays systematic trends in predictions with operational implications. The model overpredicted class 0 (poor coverage) by a factor of 3.25× (932 predicted vs. 287 real), generating more coverage alerts but ensuring the detection of critical areas. This bias is beneficial for network management because false alerts are preferable to missing areas that require immediate intervention. The underprediction of classes 1 and 2 by factors of 0.76× and 0.73× reflects the prioritization of detecting critical coverage over efficiency, aligning with operational priorities where service continuity prevails.
Readiness Assessment for Deployment and Risk Management: The SA metric framework enables risk-based deployment strategies that traditional accuracy metrics do not offer. According to the three-level SA metric assessment, operators can implement gradual automation policies: (1) Class 0 predictions are fully automated with S A 0 = 100%, eliminating delays in critical issues; (2) Class 1 predictions require human oversight in 40% of cases, with automation for predictions above 80% confidence; and (3) Class 2 predictions require human oversight with automated suggestions in 51% of cases. This approach contrasts with traditional deployment, which applies uniform levels across all classes and ignores the operational distinctions between severity levels.
Reliability of FL in Disaster Scenarios: Despite the non-IID distribution of data and conditions that affect quality, the S A global = 61.73% shows acceptable reliability for critical decisions in network management. The perfect detection of poor coverage ( S A 0 = 100%) validated the FL approach for infrastructure under natural disaster conditions. This level indicates that with 1774 out of 2874 predictions, automation is suggested, whereas human intervention is required for 1100 samples. A framework that enables the efficient allocation of resources between automated and supervised operations.
Strategic implications for resilient network operations: The SA metrics framework transforms model evaluation into practical insights for deployment. Operators can obtain guidelines for implementing automation levels, setting thresholds, and managing risks without requiring in-depth knowledge of ML. The conservative trend in predictions for coverage detection aligns with telecommunications priorities, where availability and early detection are essential for maintaining connectivity in the face of natural disasters. This alignment demonstrates the practical value of SA metrics in FL deployments within critical infrastructure.
Adherence to System Analysis provides an operational framework that bridges the gap between technical performance and practical trust, enabling informed decisions for automated management systems in disaster scenarios while maintaining reliability and operational safety.

6.3. Limitations

  • Investigating 5G and Massive MIMO. One limitation is exploring the scalability and generalisation of our approach to more advanced technologies, such as 5G and Massive MIMO.
  • The uses and effects of 6G are not considered.
  • The scope of this study focused on demonstrating the practical effectiveness of FedResilience in classifying LTE coverage under normal and disaster conditions, using established aggregation methods. A formal convergence analysis for non-IID disaster scenarios would be valuable in theoretically substantiating our empirical results. We add the Bhattacharyya distance metric and the coefficient of variation to quantify the differences in the non-IID data distributions of each participating customer.

7. Conclusions and Future Work

The FedResilience system has demonstrated its effectiveness in classifying LTE network coverage. FedAdam was established as the optimal strategy for normal operation scenarios, achieving an F1-score of 0.7271 and a global system adherence ( S A global ) of 91.51%. In disaster scenarios, FedProx performed better with an F1-score of 0.7946 and S A global of 61.73%. Beyond technical performance, the main practical implication of this study is the provision of an operational framework that transforms network data into actionable intelligence, enabling operators to move from reactive crisis management to a proactive, data-driven resilience strategy.
FedResilience effectively handles non-IID data and maintains consistent performance with heterogeneous distributions among clients. The introduction of the SA metric provides a standardized measure of reliability under both operational conditions.
As a decision support tool, FedResilience helps companies implement automated corrective actions and facilitates the predictive maintenance of LTE networks. By classifying LTE coverage, the system helps identify areas with poor infrastructure and establish automated, human-assisted, or hybrid routes, thereby improving network resilience during natural disasters.
In future work, we propose investigating techniques to mitigate the effects of non-IID data and explore methods for local personalization with FL. Such as:
  • Dynamic adaptation methods for algorithms based on network conditions should be developed, and the integration of reinforcement learning to optimize routes during disasters should be explored.
  • Investigate the applicability of emerging technologies such as 5G and 6G, and sectors such as smart cities.
  • Validate the SA metric in diverse contexts and explore its potential as a standard for evaluating FL models.
  • Explore the measurement errors of the RSRP and RSRQ parameters.
  • Investigate the performance of methods such as Multi-Krum, q-FedAvg, and Scaffold in the context of 4G, 5G, and 6G coverage classification.
  • Conduct a broader comparative analysis that includes both the methods used in this study and the additional methods mentioned.

Author Contributions

Conceptualization, A.A.-A., C.F.-C. and R.C.; methodology, A.A.-A., C.F.-C. and R.C.; software, A.A.-A.; validation, C.F.-C. and R.C.; formal analysis, A.A.-A., C.F.-C., H.K. and R.C.; investigation, A.A.-A., C.F.-C., H.K. and R.C.; resources, C.F.-C.; data curation, A.A.-A., C.F.-C. and R.C.; writing—original draft preparation, A.A.-A., C.F.-C., H.K. and R.C.; writing—review and editing, A.A.-A., C.F.-C., H.K. and R.C.; visualization, A.A.-A., C.F.-C. and R.C.; supervision, C.F.-C.; project administration, C.F.-C.; funding acquisition, C.F.-C. All authors have read and agreed to the published version of the manuscript.

Funding

This research was funded by University of Santiago of Chile (USACH) de Sant grant number 2025.

Institutional Review Board Statement

Not applicable.

Informed Consent Statement

Not applicable.

Data Availability Statement

The datasets generated and analyzed during the current study are not publicly available due to confidentiality agreements with industrial partners; however, anonymized and aggregated data supporting the main conclusions are available from the corresponding author upon reasonable request. Full datasets may be available to academic researchers following the completion of appropriate confidentiality agreements.

Acknowledgments

The authors wish to thank the Telematic Research Projects Group, part of the Department of Electrical Engineering at the University of Santiago de Chile, for their valuable support and resources provided during the course of this work.

Conflicts of Interest

The authors declare no conflicts of interest.

Notes

1
WeltRisikoBericht. https://weltrisikobericht.de/ accessed on 28 June 2025.
2
Disaster Dates in Chile—Emergency and Disaster. https://emergenciaydesastres.mineduc.cl/fechas-de-catastrofes/ accessed on 28 June 2025.

References

  1. Liu, X.; Deng, Y.; Nallanathan, A.; Bennis, M. Federated Learning and Meta Learning: Approaches, Applications, and Directions. IEEE Commun. Surv. Tutor. 2024, 26, 571–618. [Google Scholar] [CrossRef]
  2. Zhang, C.; Xie, Y.; Bai, H.; Yu, B.; Li, W.; Gao, Y. A survey on federated learning. Knowl.-Based Syst. 2021, 216, 106775. [Google Scholar] [CrossRef]
  3. Feng, C.; Yang, H.H.; Wang, S.; Zhao, Z.; Quek, T.Q.S. Hybrid Learning: When Centralized Learning Meets Federated Learning in the Mobile Edge Computing Systems. IEEE Trans. Commun. 2023, 71, 7008–7022. [Google Scholar] [CrossRef]
  4. Mistry, D.; Mridha, M.F.; Safran, M.; Alfarhood, S.; Saha, A.K.; Che, D. Privacy-Preserving On-Screen Activity Tracking and Classification in E-Learning Using Federated Learning. IEEE Access 2023, 11, 79315–79329. [Google Scholar] [CrossRef]
  5. Joseph, I. Joint Statistical and Machine Learning Approach for Practical Data-Driven Assessment of User Throughput Quality in Microcellular Radio Networks. Wirel. Pers. Commun. 2021, 119, 1661–1680. [Google Scholar] [CrossRef]
  6. Ahmed, F.Y.H.; Masli, A.A.; Khassawneh, B.; Yousif, J.H.; Zebari, D.A. Optimized Downlink Scheduling over LTE Network Based on Artificial Neural Network. Computers 2023, 12, 179. [Google Scholar] [CrossRef]
  7. Sivagar, M.; Prabakaran, N. Elite Opposition Based Metaheuristic Framework for Load Balancing in LTE Network. Comput. Mater. Contin. 2022, 71, 5765–5781. [Google Scholar] [CrossRef]
  8. Yang, C.C.; Chen, J.Y.; Mai, Y.T.; Wang, Y.C. Delay-Sensitive Network Selection and Offloading in LTE-A and Wi-Fi Heterogeneous Networks. J. Circuits, Syst. Comput. 2021, 30, 2150120. [Google Scholar] [CrossRef]
  9. Alam, M.J.; Hossain, M.R.; Azad, S.; Chugh, R. An overview of LTE/LTE-A heterogeneous networks for 5G and beyond. Trans. Emerg. Telecommun. Technol. 2023, 34, e4806. [Google Scholar] [CrossRef]
  10. Ahamed, M.M.; Faruque, S. 5G Network Coverage Planning and Analysis of the Deployment Challenges. Sensors 2021, 21, 6608. [Google Scholar] [CrossRef]
  11. Han, S.I. Survey on UAV Deployment and Trajectory in Wireless Communication Networks: Applications and Challenges. Information 2022, 13, 389. [Google Scholar] [CrossRef]
  12. He, H.; Yu, X.; Zhang, J.; Song, S.; Letaief, K.B. Cell-Free Massive MIMO for 6G Wireless Communication Networks. J. Commun. Inf. Netw. 2021, 6, 321–335. [Google Scholar] [CrossRef]
  13. Yuliana, H.; Iskandar; Hendrawan. Comparative Analysis of Machine Learning Algorithms for 5G Coverage Prediction: Identification of Dominant Feature Parameters and Prediction Accuracy. IEEE Access 2024, 12, 18939–18956. [Google Scholar] [CrossRef]
  14. Yi, Z.; Zhiwen, L.; Rong, H.; Ji, W.; Wenwu, X.; Shouyin, L. Feature Extraction in Reference Signal Received Power Prediction Based on Convolution Neural Networks. IEEE Commun. Lett. 2021, 25, 1751–1755. [Google Scholar] [CrossRef]
  15. Ben Chikha, H.; Alaerjan, A. Automatic Clustering for Improved Radio Environment Maps in Distributed Applications. Appl. Sci. 2023, 13, 5902. [Google Scholar] [CrossRef]
  16. Sun, K.; Yu, J.; Huang, W.; Zhang, H.; Leung, V.C.M. A Multi-Attribute Handover Algorithm for QoS Enhancement in Ultra Dense Network. IEEE Trans. Veh. Technol. 2021, 70, 4557–4568. [Google Scholar] [CrossRef]
  17. Benson, M.E.; Okafor, K.C.; Ezema, L.S.; Chukwuchekwa, N.; Adebisi, B.; Anthony, O.C. Heterogeneous cyber-physical network coexistence through interference contribution rate and uplink power control algorithm (ICR-UPCA) in 6G edge cells. Internet Things 2024, 25, 101031. [Google Scholar] [CrossRef]
  18. Gao, H.; Thai, M.T.; Wu, J. When Decentralized Optimization Meets Federated Learning. IEEE Netw. 2023, 37, 233–239. [Google Scholar] [CrossRef]
  19. Abbas, S.R.; Abbas, Z.; Zahir, A.; Lee, S.W. Federated Learning in Smart Healthcare: A Comprehensive Review on Privacy, Security, and Predictive Analytics with IoT Integration. Healthcare 2024, 12, 2587. [Google Scholar] [CrossRef]
  20. Jianping, W.; Guangqiu, Q.; Chunming, W.; Weiwei, J.; Jiahe, J. Federated learning for network attack detection using attention-based graph neural networks. Sci. Rep. 2024, 14, 19088. [Google Scholar] [CrossRef]
  21. Li, D.; Han, D.; Weng, T.H.; Zheng, Z.; Li, H.; Liu, H.; Castiglione, A.; Li, K.C. Blockchain for federated learning toward secure distributed machine learning systems: A systemic survey. Soft Comput. 2021, 26, 4423–4440. [Google Scholar] [CrossRef] [PubMed]
  22. Schoinas, I.; Triantafyllou, A.; Ioannidis, D.; Tzovaras, D.; Drosou, A.; Votis, K.; Lagkas, T.; Argyriou, V.; Sarigiannidis, P. Federated Learning: Challenges, SoTA, Performance Improvements and Application Domains. IEEE Open J. Commun. Soc. 2024, 5, 5933–6017. [Google Scholar] [CrossRef]
  23. SUBTEL. Subsecretaría de Telecomunicaciones de Chile. 2025. Available online: https://www.subtel.gob.cl (accessed on 29 June 2025).
  24. AlaiSecure. La Tecnología 5G Revoluciona los Servicios de Emergencia en Chile. 2025. Available online: https://alaisecure.cl/la-tecnologia-5g-revoluciona-los-servicios-de-emergencia-en-chile/ (accessed on 22 June 2025).
  25. Xu, G.; Guo, Z. Resilience enhancement of distribution networks based on demand response under extreme scenarios. IET Renew. Power Gener. 2024, 18, 48–59. [Google Scholar] [CrossRef]
  26. Beyza, J.; Yusta, J.M. Integrated Risk Assessment for Robustness Evaluation and Resilience Optimisation of Power Systems after Cascading Failures. Energies 2021, 14, 2028. [Google Scholar] [CrossRef]
  27. Khowaja, S.A.; Dev, K.; Khowaja, P.; Bellavista, P. Toward Energy-Efficient Distributed Federated Learning for 6G Networks. IEEE Wirel. Commun. 2021, 28, 34–40. [Google Scholar] [CrossRef]
  28. Manias, D.M.; Shami, A. Making a Case for Federated Learning in the Internet of Vehicles and Intelligent Transportation Systems. IEEE Netw. 2021, 35, 88–94. [Google Scholar] [CrossRef]
  29. Zhao, Z.; Feng, C.; Hong, W.; Jiang, J.; Jia, C.; Quek, T.Q.S.; Peng, M. Federated Learning With Non-IID Data in Wireless Networks. IEEE Trans. Wirel. Commun. 2022, 21, 1927–1942. [Google Scholar] [CrossRef]
  30. Sun, J.; Wang, Y.; Sun, X.; Li, N.; Nie, G. Time efficient joint optimization federated learning over wireless communication networks. China Commun. 2022, 19, 169–178. [Google Scholar] [CrossRef]
  31. Gheisari, M.; Mughal, M.R.; Sun, P.; Mnkandla, E.; Tahaei, H.; Webber, J.L.; Mehbodniya, A.; Sibiya, M.; Malik, M.; Wang, Z.; et al. A Flexible Software-Defined Networking-Based Privacy-Preserving Method for Internet of Things-Based Smart City Environment Based on the Neighbors Situation. Computer 2025, 58, 27–36. [Google Scholar] [CrossRef]
  32. Behjati, M.; Nordin, R.; Alobaidy, H.A.H.; Zulkifley, M.A.; Abdullah, N.F. Reliable Aerial Mobile Communications with RSRP & RSRQ Prediction Models for the Internet of Drones: A Machine Learning Approach. Sensors 2022, 22, 5522. [Google Scholar] [CrossRef]
  33. Guijarro, V.R.F.; Osorio, D.P.M.; Paredes, M.C.P.; Sánchez, J.D.V.; Arévalo, F.G. Comparative Evaluation of Radio Network Planning for Different 5G-NR Channel Models on Urban Macro Environments in Quito City. IEEE Access 2024, 12, 5708–5730. [Google Scholar] [CrossRef]
  34. Kurnaz, C.; Kola, A.F.; Esenalp, M.O. Performance analysis and modeling based on LTE-A field measurements: A city center example. Int. J. Inf. Technol. 2023, 15, 1919–1925. [Google Scholar] [CrossRef]
  35. Robles-Enciso, R.; Morales-Aragón, I.P.; Serna-Sabater, A.; Martínez-Inglés, M.T.; Mateo-Aroca, A.; Molina-Garcia-Pardo, J.M.; Juan-Llácer, L. LoRa, Zigbee and 5G Propagation and Transmission Performance in an Indoor Environment at 868 MHz. Sensors 2023, 23, 3283. [Google Scholar] [CrossRef] [PubMed]
  36. Garcia-Fernandez, M.A.; Sanchez-Hernandez, D.A. Beamforming Evaluation of 5G User Equipment through Novel Key Performance Indicators. Electronics 2021, 10, 1319. [Google Scholar] [CrossRef]
  37. Górecki, P. Compact Thermal Modeling of Power Semiconductor Devices with the Influence of Atmospheric Pressure. Energies 2022, 15, 3565. [Google Scholar] [CrossRef]
  38. Ho, W.T.; Chang, S.W.; Chiu, C.Y. Low ambient temperature correlates with the severity of dry eye symptoms. Taiwan J. Ophthalmol. 2021, 12, 191–197. [Google Scholar] [CrossRef]
  39. Vitelli, M.; Cerro, G.; Gerevini, L.; Miele, G.; Ria, A.; Molinara, M. SENSIPLUS-LM: A Low-Cost EIS-Enabled Microchip Enhanced with an Open-Source Tiny Machine Learning Toolchain. Computers 2023, 12, 23. [Google Scholar] [CrossRef]
  40. Pekar, A.; Makara, L.A.; Biczok, G. Incremental federated learning for traffic flow classification in heterogeneous data scenarios. Neural Comput. Appl. 2024, 36, 20401–20424. [Google Scholar] [CrossRef]
  41. Carreras-Coch, A.; Navarro, J.; Sans, C.; Zaballos, A. Communication Technologies in Emergency Situations. Electronics 2022, 11, 1155. [Google Scholar] [CrossRef]
  42. Llasag Rosero, R.; Silva, C.; Ribeiro, B.; Santos, B.F. Label synchronization for Hybrid Federated Learning in manufacturing and predictive maintenance. J. Intell. Manuf. 2024, 35, 4015–4034. [Google Scholar] [CrossRef]
  43. Parra-Ullauri, J.M.; Zhang, X.; Bravalheri, A.; Moazzeni, S.; Wu, Y.; Nejabati, R.; Simeonidou, D. Federated Analytics for 6G Networks: Applications, Challenges, and Opportunities. IEEE Netw. 2024, 38, 9–17. [Google Scholar] [CrossRef]
  44. Soltani, S.; Shojafar, M.; Taheri, R.; Tafazolli, R. Can Open and AI-Enabled 6G RAN Be Secured? IEEE Consum. Electron. Mag. 2022, 11, 11–12. [Google Scholar] [CrossRef]
  45. Wu, J.; Jin, J.; Wu, C. Challenges and Countermeasures of Federated Learning Data Poisoning Attack Situation Prediction. Mathematics 2024, 12, 901. [Google Scholar] [CrossRef]
  46. Xu, J.; Du, W.; Jin, Y.; He, W.; Cheng, R. Ternary Compression for Communication-Efficient Federated Learning. IEEE Trans. Neural Netw. Learn. Syst. 2022, 33, 1162–1176. [Google Scholar] [CrossRef] [PubMed]
  47. Sun, Z.; Xu, Y.; Liu, Y.; He, W.; Kong, L.; Wu, F.; Jiang, Y.; Cui, L. A Survey on Federated Recommendation Systems. IEEE Trans. Neural Netw. Learn. Syst. 2025, 36, 6–20. [Google Scholar] [CrossRef]
  48. García, C.E.; Koo, I. Extremely Randomized Trees Regressor Scheme for Mobile Network Coverage Prediction and REM Construction. IEEE Access 2023, 11, 65170–65180. [Google Scholar] [CrossRef]
  49. Yuliana, H.; Iskandar.; Hendrawan; Ridwan, A.M.; Charisma, A.; Somantri, N.T. Performance Evaluation of Coverage Prediction in 4G Networks Using Machine Learning Classification Algorithm. In Proceedings of the 2024 10th International Conference on Wireless and Telematics (ICWT), Batam, Indonesia, 4–5 July 2024. [Google Scholar] [CrossRef]
  50. Eyceyurt, E.; Egi, Y.; Zec, J. Machine-Learning-Based Uplink Throughput Prediction from Physical Layer Measurements. Electronics 2022, 11, 1227. [Google Scholar] [CrossRef]
  51. Ahmad Fauzi, M.F.; Nordin, R.; Abdullah, N.F.; Alobaidy, H.A.H. Mobile Network Coverage Prediction Based on Supervised Machine Learning Algorithms. IEEE Access 2022, 10, 55782–55793. [Google Scholar] [CrossRef]
  52. Fauzi, M.F.A.; Nordin, R.; Abdullah, N.F.; Alobaidy, H.A.H.; Behjati, M. Machine Learning-Based Online Coverage Estimator (MLOE): Advancing Mobile Network Planning and Optimization. IEEE Access 2023, 11, 3096–3109. [Google Scholar] [CrossRef]
  53. Curipallo, M.; Pozo, G.; Lupera-Morillo, P.; Párraga, V. Modelo de aprendizaje automático para la predicción de calidad en modo estático-inactivo y modo móvil-conectado en redes LTE. Rev. Investig. Tecnol. Inf. 2022, 10, 110–119. [Google Scholar] [CrossRef]
  54. Azoulay, R.; Edery, E.; Haddad, Y.; Rozenblit, O. Machine learning techniques for received signal strength indicator prediction. Intell. Data Anal. 2023, 27, 1167–1184. [Google Scholar] [CrossRef]
  55. Imoize, A.L.; Tofade, S.O.; Ughegbe, G.U.; Anyasi, F.I.; Isabona, J. Updating analysis of key performance indicators of 4G LTE network with the prediction of missing values of critical network parameters based on experimental data from a dense urban environment. Data Brief 2022, 42, 108240. [Google Scholar] [CrossRef] [PubMed]
  56. Makino, I.; Wang, Z.; Terai, J.; Miki, N. Throughput and Delay Performance Measurements in Multi-Floor Building Employing Private LTE. IEEE Access 2022, 10, 24288–24301. [Google Scholar] [CrossRef]
  57. Tarhuni, N.; Al Saadi, I.; Asif, H.M.; Mesbah, M.; Eldirdiry, O.; Hossen, A. Machine-Learning-Based Ground-Level Mobile Network Coverage Prediction Using UAV Measurements. J. Sens. Actuator Netw. 2023, 12, 44. [Google Scholar] [CrossRef]
  58. Kranda, Y.T.; Samli, R. A novel clustering based algorithm to mitigate the demand of forecasting errors for newly deployed LTE cells with insufficient historical data. Comput. Commun. 2022, 190, 190–200. [Google Scholar] [CrossRef]
  59. Na, H.; Shin, Y.; Lee, D.; Lee, J. LSTM-based throughput prediction for LTE networks. ICT Express 2023, 9, 247–252. [Google Scholar] [CrossRef]
  60. Qiu, L.; Liu, B. Adaptive RSRP/RSRQ judgment switching algorithm based on improved gray prediction models. In Proceedings of the 2024 7th International Conference on Computer Information Science and Application Technology (CISAT), Hangzhou, China, 12–14 July 2024; pp. 255–260. [Google Scholar] [CrossRef]
  61. Minovski, D.; Ögren, N.; Mitra, K.; Åhlund, C. Throughput Prediction Using Machine Learning in LTE and 5G Networks. IEEE Trans. Mob. Comput. 2023, 22, 1825–1840. [Google Scholar] [CrossRef]
  62. Kuboye, B.M.; Adedipe, A.I.; Oloja, S.V.; Obolo, O.A. Users’ Evaluation of Traffic Congestion in LTE Networks using Machine Learning Techniques. Artif. Intell. Adv. 2023, 5, 8–24. [Google Scholar] [CrossRef]
  63. Panda, H.; Das, M.; Sahu, B. Received signal strength prediction model for wireless underground sensor networks using machine learning algorithms. J. Inf. Optim. Sci. 2022, 43, 949–962. [Google Scholar] [CrossRef]
  64. Yuan, J.; Ding, X.; Liu, F.; Cai, X. Disaster cassification net: A disaster classification algorithm on remote sensing imagery. Front. Environ. Sci. 2023, 10, 1095986. [Google Scholar] [CrossRef]
  65. Iparraguirre-Villanueva, O.; Melgarejo-Graciano, M.; Castro-Leon, G.; Olaya-Cotera, S.; Ruiz-Alvarado, J.; Epifanía-Huerta, A.; Cabanillas-Carbonell, M.; Zapata-Paulini, J. Classification of Tweets Related to Natural Disasters Using Machine Learning Algorithms. Int. J. Interact. Mob. Technol. (iJIM) 2023, 17, 144–162. [Google Scholar] [CrossRef]
  66. Abdellatif, S.; Tibermacine, O.; Bechkit, W.; Bachir, A. Heterogeneous IoT/LTE ProSe virtual infrastructure for disaster situations. J. Netw. Comput. Appl. 2023, 213, 103602. [Google Scholar] [CrossRef]
  67. Lekhak, K. An Intelligent Disaster Prediction in Communication Network Using OAN-ANFIS Technique Based on TEM Feature Selection Approach. Int. J. Res. Appl. Sci. Eng. Technol. 2023, 11, 1234–1252. [Google Scholar] [CrossRef]
  68. Aamir, M.; Ali, T.; Irfan, M.; Shaf, A.; Azam, M.Z.; Glowacz, A.; Brumercik, F.; Glowacz, W.; Alqhtani, S.; Rahman, S. Natural Disasters Intensity Analysis and Classification Based on Multispectral Images Using Multi-Layered Deep Convolutional Neural Network. Sensors 2021, 21, 2648. [Google Scholar] [CrossRef] [PubMed]
  69. Amin, M.S.; Loh, W.K. Federated Learning-Based Analysis of Human Sentiments and Physical Activities in Natural Disasters. Appl. Sci. 2023, 13, 2925. [Google Scholar] [CrossRef]
  70. Ling, X.; Chi, W.; Zhang, J.; Li, Z. Federated Learning Convergence Optimization for Energy-Limited and Social-Aware Edge Nodes. IEEE Access 2024, 12, 107844–107854. [Google Scholar] [CrossRef]
  71. Orlandi, F.C.; Dos Anjos, J.C.S.; Leithardt, V.R.Q.; De Paz Santana, J.F.; Geyer, C.F.R. Entropy to Mitigate Non-IID Data Problem on Federated Learning for the Edge Intelligence Environment. IEEE Access 2023, 11, 78845–78857. [Google Scholar] [CrossRef]
  72. Nguyen, D.C.; Hosseinalipour, S.; Love, D.J.; Pathirana, P.N.; Brinton, C.G. Latency Optimization for Blockchain-Empowered Federated Learning in Multi-Server Edge Computing. arXiv 2022. [Google Scholar] [CrossRef]
  73. Du, J.; Qin, N.; Huang, D.; Jia, X.; Zhang, Y. Lightweight FL: A Low-Cost Federated Learning Framework for Mechanical Fault Diagnosis With Training Optimization and Model Pruning. IEEE Trans. Instrum. Meas. 2024, 73, 1–14. [Google Scholar] [CrossRef]
  74. Nguyen, D.C.; Ding, M.; Pathirana, P.N.; Seneviratne, A.; Li, J.; Vincent Poor, H. Federated Learning for Internet of Things: A Comprehensive Survey. IEEE Commun. Surv. Tutor. 2021, 23, 1622–1658. [Google Scholar] [CrossRef]
  75. Zhou, X.; Deng, Y.; Xia, H.; Wu, S.; Bennis, M. Time-Triggered Federated Learning Over Wireless Networks. IEEE Trans. Wirel. Commun. 2022, 21, 11066–11079. [Google Scholar] [CrossRef]
  76. Wang, K.; Zhong, S.; Mao, Y.; Hong, R. Secure solution for decentralized federated learning with blockchain. Sci. Sin. Informationis 2024, 54, 316. [Google Scholar] [CrossRef]
  77. Decimavilla-Alarcón, D.C.; Jama-Rodríguez, E.F. Optimización de redes inalámbricas rurales mediante aprendizaje automático: Mejora de la conectividad en áreas remotas. Rev. Mex. Investig. Interv. Educ. 2025, 4, 99–110. [Google Scholar] [CrossRef]
  78. Hu, C.H.; Chen, Z.; Larsson, E.G. Scheduling and Aggregation Design for Asynchronous Federated Learning Over Wireless Networks. IEEE J. Sel. Areas Commun. 2023, 41, 874–886. [Google Scholar] [CrossRef]
  79. Lee, H.Y.; Li, S.W.; Vu, N.T. Meta Learning for Natural Language Processing: A Survey. arXiv 2022, arXiv:2205.01500. [Google Scholar] [CrossRef]
  80. Xiao, B.; Yu, X.; Ni, W.; Wang, X.; Poor, H.V. Over-the-air federated learning: Status quo, open challenges, and future directions. Fundam. Res. 2024, 5, 1710–1724. [Google Scholar] [CrossRef]
  81. Xu, C.; Qu, Y.; Xiang, Y.; Gao, L. Asynchronous federated learning on heterogeneous devices: A survey. Comput. Sci. Rev. 2023, 50, 100595. [Google Scholar] [CrossRef]
  82. Kamp, M.; Fischer, J.; Vreeken, J. Federated Learning from Small Datasets. arXiv 2023, arXiv:2110.03469. [Google Scholar] [CrossRef]
  83. Ghosh, A.; Chung, J.; Yin, D.; Ramchandran, K. An Efficient Framework for Clustered Federated Learning. IEEE Trans. Inf. Theory 2022, 68, 8076–8091. [Google Scholar] [CrossRef]
  84. Ma, Y.; Zhao, S.; Wang, W.; Li, Y.; King, I. Multimodality in meta-learning: A comprehensive survey. Knowl.-Based Syst. 2022, 250, 108976. [Google Scholar] [CrossRef]
  85. Jeong, E.; Oh, S.; Kim, H.; Park, J.; Bennis, M.; Kim, S.L. Communication-Efficient On-Device Machine Learning: Federated Distillation and Augmentation under Non-IID Private Data. arXiv 2023, arXiv:1811.11479. [Google Scholar] [CrossRef]
  86. Li, T.; Sahu, A.K.; Zaheer, M.; Sanjabi, M.; Talwalkar, A.; Smith, V. Federated Optimization in Heterogeneous Networks. arXiv 2020, arXiv:1812.06127. [Google Scholar] [CrossRef]
  87. Shi, Y.; Sagduyu, Y.E.; Erpek, T. Federated learning for distributed spectrum sensing in NextG communication networks. In Proceedings of the SPIE 12113, Artificial Intelligence and Machine Learning for Multi-Domain Operations Applications IV, San Diego, CA, USA, 21–25 August 2022; Volume 12113, pp. 472–478. [Google Scholar] [CrossRef]
  88. Advantech Czech s.r.o. LTE Industrial Router SmartFlex SR304: User Manual; Technical Report; Advantech Czech s.r.o.: Orlici, Czech Republic, 2023. [Google Scholar]
  89. Riccio, C.; Zazzaro, G.; Martone, A.; Pavone, L. Training Datasets for Epilepsy Analysis: Preprocessing and Feature Extraction from Electroencephalography Time Series. Data 2024, 9, 61. [Google Scholar] [CrossRef]
  90. Bagui, S.; Li, K. Resampling imbalanced data for network intrusion detection datasets. J. Big Data 2021, 8, 6. [Google Scholar] [CrossRef]
  91. Acuña-Avila, A.; Kaschel, H.; Zamora, M.E.; Fernandez, C.G.; Fernandez-Campusano, C. Boosting Federated Learning for Optimization LTE-RSRP Networks. In Proceedings of the 2024 IEEE International Conference on Automation/XXVI Congress of the Chilean Association of Automatic Control (ICA-ACCA), Santiago, Chile, 20–23 October 2024; pp. 1–6. [Google Scholar] [CrossRef]
  92. Yurdem, B.; Kuzlu, M.; Gullu, M.K.; Catak, F.O.; Tabassum, M. Federated learning: Overview, strategies, applications, tools and future directions. Heliyon 2024, 10, e38137. [Google Scholar] [CrossRef] [PubMed]
  93. Zhao, Z.; Wang, J.; Hong, W.; Quek, T.Q.S.; Ding, Z.; Peng, M. Ensemble Federated Learning With Non-IID Data in Wireless Networks. IEEE Trans. Wirel. Commun. 2024, 23, 3557–3571. [Google Scholar] [CrossRef]
  94. Lee, S.; Sung, J.; Shin, M.K. Layer-Wise Personalized Federated Learning for Mobile Traffic Prediction. IEEE Access 2024, 12, 53126–53140. [Google Scholar] [CrossRef]
  95. Luo, Y.; Chen, X.; Sun, H.; Li, X.; Ge, N.; Feng, W.; Lu, J. Securing 5G/6G IoT Using Transformer and Personalized Federated Learning: An Access-Side Distributed Malicious Traffic Detection Framework. IEEE Open J. Commun. Soc. 2024, 5, 1325–1339. [Google Scholar] [CrossRef]
  96. Zhang, R.; Pan, C.; Wang, Y.; Yao, Y.; Li, X. Federated Deep Reinforcement Learning for Multimedia Task Offloading and Resource Allocation in MEC Networks. IEICE Trans. Commun. 2024, E107-B, 446–457. [Google Scholar] [CrossRef]
  97. Luo, G.; Liu, T.; Lu, J.; Chen, X.; Yu, L.; Wu, J.; Chen, D.Z.; Cai, W. Influence of Data Distribution on Federated Learning Performance in Tumor Segmentation. Radiol. Artif. Intell. 2023, 5, e220082. [Google Scholar] [CrossRef]
  98. Fernandez-Grandon, C.; Soto, I.; Zabala-Blanco, D. Extreme Learning Machine for Iris-Based Diabetes Detection. In Proceedings of the 2023 IEEE CHILEAN Conference on Electrical, Electronics Engineering, Information and Communication Technologies (CHILECON), Valdivia, Chile, 5–7 December 2023; pp. 1–6, ISSN 2832-1537. [Google Scholar] [CrossRef]
Figure 1. LTE network coverage classification process using FL.
Systems 13 00866 g001
Figure 2. Correlation matrix of client 1.
Systems 13 00866 g002
Figure 3. Distribution of numerical attributes for Client 1.
Systems 13 00866 g003
Figure 4. Client 1, Time series of attributes from July to December of 2024.
Systems 13 00866 g004
Figure 5. Client 1, Average RSRQ during the week.
Systems 13 00866 g005
Figure 6. Client 3, Class balancing techniques.
Systems 13 00866 g006
Figure 7. Coefficient of Variation Across Clients.
Systems 13 00866 g007
Figure 8. Average Bhattacharyya Distance Between Clients Distributions.
Systems 13 00866 g008
Figure 9. Centralized synchronous FL architecture.
Systems 13 00866 g009
Figure 10. Radar performance of federated learning aggregation methods in normal operation.
Systems 13 00866 g010
Figure 11. Accuracy and loss of federated learning aggregation methods in normal operation.
Systems 13 00866 g011
Figure 12. Adherence analysis of the federated learning model in normal operation.
Systems 13 00866 g012
Figure 13. Impact of fire on temperature.
Systems 13 00866 g013
Figure 14. Impact of power outage.
Systems 13 00866 g014
Figure 15. Variation of Atmospheric Pressure during a Storm.
Systems 13 00866 g015
Figure 16. Voltage variation during a storm.
Systems 13 00866 g016
Figure 17. Current variation during a storm.
Systems 13 00866 g017
Figure 18. Voltage variation during a earthquake.
Systems 13 00866 g018
Figure 19. Current variation during a earthquake.
Systems 13 00866 g019
Figure 20. Radar performance of federated learning aggregation methods during natural disasters.
Systems 13 00866 g020
Figure 21. Accuracy and loss of federated learning aggregation methods during natural disasters.
Systems 13 00866 g021
Figure 22. Adherence analysis of the federated learning model with natural disasters.
Systems 13 00866 g022
Table 1. ML Applications in Communication Networks and Disaster Management.
Category   Description
Coverage and Throughput Prediction in Mobile Networks Using ML:
Mobile coverage prediction using Extremely Randomized Trees Regressor (ERTR) to improve mobile networks [48].
Analysis of machine learning algorithms for 5G prediction, highlighting Random Forest and CNN  [13].
Evaluation of ML algorithms for 4G prediction, highlighting Random Forest [49].
Terrestrial cellular networks can provide aerial coverage for BVLOS drone operations depending on distance and altitude [32].
Prediction of uplink data rate using ML, comparing algorithms for three locations and their accuracy [50].
Coverage and Throughput Prediction in Mobile Networks Using ML:
Evaluated ML models for predicting signal strength in mobile networks, recommending the Tree Ensemble with Random Forest as the most practical for efficiently predicting RSRP [51].
Proposes a Machine Learning-based coverage estimation tool (MLOE) that uses Random Forest to improve mobile network planning, outperforming traditional techniques with an RMSE of 2.65 dB and R2 of 0.93 [52].
Prediction of signal quality and connection in LTE networks using ML in Quito, Ecuador [53].
ML Techniques for Prediction and Optimization of Mobile Networks:
Prediction of RSSI using ML to improve connection and address localization and handover [54].
Used PCHIP to predict missing data in LTE measurements in dense urban environments, improving the radioelectric characterization of the terrain [55].
Private LTE/5G networks offer security indoors, but require optimization of coverage and latency, investigated through measurements in a building with sXGP [56].
Used drones and neural networks to measure and predict mobile signal strength, offering a safe alternative to drive-testing [57].
Clustering algorithm to improve demand forecasting in new LTE cells, reducing the prediction error from 133% to 35% [58].
LSTM with attention to predict performance in LTE networks, showing better results in normalized RMSE [59].
ML Applications in Communication Networks and Disaster Management:
Enhanced grey prediction-based switching to address communication problems in high-speed railways, improving transitions between areas [60].
Machine learning models to predict link performance in LTE and 5G networks, achieving high predictive accuracy [61].
Uses machine learning techniques to predict congestion in LTE networks based on users [62].
RSSI prediction for underground wireless sensors using machine learning outperforms theoretical models for network optimization [63].
D-Net classification network that outperforms CNN and Transformer in efficiency and accuracy, applicable to disasters and other tasks [64].
Uses machine learning algorithms to identify and classify tweets about natural disasters, achieving high accuracy rates in text classification [65].
Communication Networks and Technology for Disaster Management:
Post-disaster communication network based on LTE Device-to-Device ProSe and IoT to improve rescue operations [66].
Develops intelligent disaster prediction in networks using advanced techniques to improve disaster management [67].
Deep convolutional neural network detects and classifies natural disaster events with high accuracy to mitigate losses [68].
Advances and Applications of Federated Learning in Distributed Networks:
Proposes a federated learning paradigm with active learning, demonstrating efficacy in reducing annotation and improving performance in applications [69].
Online learning offers global opportunities but presents distraction challenges addressed with private detection [4].
Proposes FL algorithms to improve performance on devices with limited energy and unbalanced data, considering social relationships [70].
Proposes a FedAvg-BE method to mitigate Non-IID data in FL, improving convergence in IoT [71].
Combines hybrid learning elements of centralized and federated learning to improve accuracy and optimize resources [3].
Latency optimization for blockchain FL in edge computing through offloading strategies, decentralized aggregation, and deep reinforcement learning to improve training efficiency [72].
Lightweight FL improves federated learning by reducing costs through lightweight networks, unstructured pruning, and optimal model selection [73].
FL emerges as a solution to enable AI in IoT networks, allowing distributed training without compromising privacy [74].
Presents TT-Fed, an FL algorithm for wireless networks that improves accuracy and reduces communication overhead versus traditional approaches [75].
Describes an alternative decentralized FL approach with blockchain that addresses confidentiality and fairness through a production-consumption model and APoS protocol [76].
Advances and Applications of Federated Learning in Distributed Networks:
Analyzes optimization strategies with ML for rural wireless networks, highlighting FL and ANN algorithms, and identifying challenges to improve connectivity in remote areas [77].
Proposes an asynchronous FL design with periodic aggregation and scheduling based on channel quality and data representation to improve resource-limited systems [78].
Reviews meta-learning in natural language processing, presenting concepts and approaches to drive innovation in this field [79].
Over-the-air FL enables efficient model aggregation in wireless networks, addressing bottlenecks, but faces performance and security challenges requiring research [80].
Asynchronous FL is a distributed machine learning approach that addresses privacy and efficiency challenges in IoT [81].
FL allows training models without sharing local data, and proposes combining aggregation with permutations to improve training in domains with scarcity [82].
Proposes the Iterative Federated Clustering Algorithm (IFCA) to address FL in clustered users, alternating between estimating clusters and optimizing parameters [83].
Multimodal meta-learning is an emerging field that seeks to improve efficiency in complex tasks, addressing challenges such as few-shot learning [84].
On-device machine learning is optimized through federated distillation and augmentation, reducing overhead and improving Non-IID accuracy [85].
FL is a distributed learning paradigm that addresses heterogeneity through FedProx, a generalization of FedAvg that improves convergence [86].
NextG networks employ distributed FL in wireless networks to train a deep neural network for signal identification, improving accuracy and privacy [87].
Table 2. Data were captured from client node 1.
Metrics°ChPaIDCVDCVACRSRQ
Count22,80022,80022,80022,80022,80022,800
Mean28.34769.153.3413.61224.79−5.55
Std7.541.990.680.044.321.81
Min13.50765.700.1413.39214.98−85.00
25%23.48767.413.3313.59221.66−7.00
50%28.17769.133.5013.62223.54−6.00
75%33.47770.873.6413.63227.34−4.00
Max43.40772.635.0413.75237.90−2.00
Table 3. Comparison between SA metric and Traditional ML Metrics.
AspectAccuracy/RecallSA Metric
Primary FocusStatistical performanceOperational reliability
Application ContextModel evaluationProduction decision-making
Interpretation“How well does it work?”“Can I trust it operationally?”
Threshold SettingTechnical optimizationOperational risk management
Decision SupportModel adjustmentsAutomation vs. supervision
FL SpecificityGeneral purposeDistributed system reliability
Operational OutcomePerformance improvementDeployment confidence
Table 4. Aggregation Methods for Federated Learning: Mathematical Formulation and Comparative Analysis.
MethodAggregation FormulaKey FeaturesAdvantagesLimitationsOptimal Scenario
FedAvg w t + 1 = k = 1 K n k n w k t + 1
where n = k = 1 K n k
Weighted average by data size. No adaptivity.Simplicity, communication efficiency, low overheadSevere degradation on non-IID dataIID data, limited resources, baseline [91]
FedProxLocal objective:
min w F k ( w ) + μ 2 w w t 2
Aggregation: same as FedAvg
Proximal regularizer term. Parameter μ controls proximity to the global model.Robustness to statistical heterogeneity, stable convergenceRequires tuning of μ , 2x computational overheadModerate non-IID data, system heterogeneity [86]
FedAdam m t = β 1 m t 1 + ( 1 β 1 ) Δ t
v t = β 2 v t 1 + ( 1 β 2 ) Δ t 2
w t + 1 = w t + η m t v t + τ
First and second order adaptive moments. Typical values: β 1 = 0.9 , β 2 = 0.99 .Fast convergence, adaptive to the geometry of the problemSensitive to hyperparameters, may oscillate during early trainingComplex models, requires fast convergence [92]
FedYogi m t = β 1 m t 1 + ( 1 β 1 ) Δ t
v t = v t 1 ( 1 β 2 ) Δ t 2 · sign ( v t 1 Δ t 2 )
w t + 1 = w t + η m t v t + τ
Sign operator for adaptive variance control. Greater stability than Adam.Maximum robustness to outliers, more stable convergenceImplementation complexity, additional server memoryVery heterogeneous gradients, data with noise [92]
FedAdagrad v t = v t 1 + Δ t 2
w t + 1 = w t + η Δ t v t + τ
Monotonic accumulation of squared gradients. No exponential decay.Effective for sparse features, simpleCan over-penalize, learning rate decreases aggressivelysparse features, early training [92]
Table 5. Performance and Efficiency Comparison of Federated Learning Aggregation Methods.
MethodAccuracyPrecisionRecallF1-ScoreLossTime (min)
FedAdam0.74980.78830.74980.72710.65332.3
FedYogi0.74860.79220.74860.72290.64552.3
FedProx0.74090.78460.74090.71240.72802.3
FedAvg0.73890.78080.73890.71020.70482.5
FedAdagrad0.68380.63650.68380.60891.87172.5
Note: • Bold values indicate best performance for each metric. Rankings based on F1-Score. • Metrics evaluated after 75 rounds of federated training with 4 clients. • Time represents total training duration in minutes. Bold time indicates fastest convergence.
Table 6. System Adherence Analysis in Normal Operations. Comprehensive SA metric evaluation demonstrating operational reliability across LTE coverage classifications in FL under routine network conditions (75-round training scenario).
CategoryMetricValue
System Adherence Metrics
Global System Adherence ( S A global )91.51%
Class-specific Adherence ( S A 1 )92.34%
Class-specific Adherence ( S A 2 )10.34%
Operational Reliability Assessment
Total samples evaluated2874
Perfect individual predictions ( S A i = 100 % )2630 (91.51%)
Imperfect individual predictions ( S A i = 0 % )244 (8.49%)
LTE Coverage Class Distribution Analysis
Class 1 (Good): Real samples2845 (98.99%)
Class 1 (Good): Predicted samples2653 (92.31%)
Class 1 (Good): Under-prediction factor 0.93 ×
Class 2 (Fair): Real samples29 (1.01%)
Class 2 (Fair): Predicted samples221 (7.69%)
Class 2 (Fair): Over-prediction factor 7.62 ×
Table 7. Operational Decision Framework: SA Metrics for LTE Network Automation. System Adherence metrics and their corresponding operational deployment strategies for LTE coverage classification automation in normal operations.
LTE Coverage Class SA k (%)Operational Decision Strategy
Class 1 (Good)92.34Production-ready deployment, 92.34% confidence-based automation, 7.66% require monitoring alerts, Efficient resource allocation.
Class 2 (Fair)10.34Critical enhancement required, Manual verification mandatory, 89.66% require secondary detection, Parallel coverage systems needed.
Table 8. Prediction Bias Analysis and Operational Impact. Analysis of systematic prediction tendencies and their implications for LTE network coverage management in normal operational scenarios.
ClassReal CountPredicted CountBias FactorOperational Impact
Good (1)284526530.93× underOptimistic approach; Less monitoring than necessary; Efficient processing allocation; Risk of missing edge cases.
Fair (2)292217.62× overConservative approach; More alerts than necessary; Better coverage of threats; Higher operational costs.
Table 9. Comparison of the performance and effectiveness of federated learning aggregation methods with natural disasters.
MethodAccuracyPrecisionRecallF1-ScoreLossTime (min)
FedProx0.81310.83100.81310.79460.59183.2
FedAvg0.80210.82950.80210.77770.70283.2
FedAdam0.79510.81710.79510.77230.68573.2
FedYogi0.79480.81720.79480.77110.69313.3
FedAdagrad0.74870.76330.74870.73802.22963.2
Note: • Bold values indicate best performance for each metric. Rankings based on F1-Score. • Metrics evaluated after 75 rounds of federated training with 4 clients. • Time represents total training duration in minutes. Bold time indicates fastest convergence.
Table 10. System Adherence Analysis in Disaster Scenarios. Comprehensive SA metric evaluation demonstrating operational reliability across coverage classifications in federated learning under natural disaster conditions (75-round training scenario).
CategoryMetricValue
System Adherence Metrics
Global System Adherence ( S A global )61.73%
Class-specific Adherence ( S A 0 )100.00%
Class-specific Adherence ( S A 1 )60.58%
Class-specific Adherence ( S A 2 )51.28%
Operational Reliability Assessment
Total samples evaluated2874
Perfect individual predictions ( S A i = 100 % )1774 (61.73%)
Imperfect individual predictions ( S A i = 0 % )1100 (38.27%)
Coverage Class Distribution Analysis
Class 0 (Poor): Real samples287 (9.99%)
Class 0 (Poor): Predicted samples932 (32.43%)
Class 0 (Poor): Over-prediction factor 3.25 ×
Class 1 (Good): Real samples1725 (60.02%)
Class 1 (Good): Predicted samples1313 (45.69%)
Class 1 (Good): Under-prediction factor 0.76 ×
Class 2 (Fair): Real samples862 (29.99%)
Class 2 (Fair): Predicted samples629 (21.89%)
Class 2 (Fair): Under-prediction factor 0.73 ×
Table 11. Operational Decision Framework: SA metrics for Network Automation. SA metrics and their corresponding operational deployment strategies for coverage classification automation.
LTE Coverage SA k (%)Operational Decision Strategy
Class 0 (Poor)100.0Full automation enabled, All critical alerts automated, Zero tolerance for missed detections, Immediate response protocols.
Class 1 (Good)60.58Graduated automation strategy, 60.58% confidence-based automation, 39.42% require human oversight, Selective deployment thresholds.
Class 2 (Fair)51.28Human-supervised operation, 51.28% automated suggestions only, 48.72% mandatory manual verification, Conservative deployment approach.
Table 12. Prediction Bias Analysis and Operational Impact. Analysis of systematic prediction tendencies and their implications for network coverage management in disaster scenarios.
ClassReal CountPredicted CountBias FactorOperational Impact
Poor (0)2879323.25× overConservative approach, More alerts than necessary, Better coverage of critical areas, Higher maintenance costs.
Good (1)172513130.76× underOptimistic bias, May miss some good areas, Efficient resource allocation, Risk of service degradation.
Fair (2)8626290.73× underUnder-detection tendency, Potential QoS issues, Requires proactive monitoring, Manual intervention needed.
Disclaimer/Publisher’s Note: The statements, opinions and data contained in all publications are solely those of the individual author(s) and contributor(s) and not of MDPI and/or the editor(s). MDPI and/or the editor(s) disclaim responsibility for any injury to people or property resulting from any ideas, methods, instructions or products referred to in the content.