Article

Riding Risk: Factors Shaping Helmet Use Among Two-Wheeled Electric Vehicle Riders in Fuzhou, China

1
College of Civil Engineering, Fuzhou University, Fuzhou 350116, China
2
Guangxi Communications Design Group Co., Ltd., Nanning 530022, China
3
Fuzhou Fuda Automation Technology Co., Ltd., Fuzhou 350028, China
*
Author to whom correspondence should be addressed.
Systems 2025, 13(3), 171; https://doi.org/10.3390/systems13030171
Submission received: 10 February 2025 / Revised: 26 February 2025 / Accepted: 28 February 2025 / Published: 1 March 2025
(This article belongs to the Special Issue Modelling and Simulation of Transportation Systems)

Abstract

:
With the rapid increase in the number of two-wheeled electric vehicles, the number of accidents related to them has also greatly increased. However, despite facing a huge threat from accidents, the helmet, an efficient and legally required protection for riders, is not popular with Chinese two-wheeled electric vehicles riders. To study the factors affecting helmet use for these riders, this paper conducted an observational study to collect helmet use data for 16,207 two-wheeled electric vehicle riders in Fuzhou, China. With these data, this paper built a multivariate logistic regression model to study the main effects of various factors on helmet use, and analyze the interaction effects of these factors. Results showed that, on the one hand, area, weather, temperature, controller, separated non-motor-vehicle lanes, time, rider’s age, and type of vehicle had significant effects on helmet use and the interaction between these factors is significant, especially the interaction between weather, temperature and other factors. On the other hand, level of service, gender and whether the riders are food delivery workers have no significant impact on helmet use, but show significant interaction effects with other factors.

1. Introduction

The widespread use of two-wheeled electric vehicles (TWEVs) has become a global phenomenon, with the total number exceeding 300 million worldwide [1]. This surge is attributed to TWEVs’ affordability, convenience, and environmental benefits. However, the increase in TWEV usage has been accompanied by a corresponding rise in traffic-related accidents, significantly impacting public safety [2]. Globally, traffic crashes involving TWEVs are a major concern, with TWEV riders facing disproportionately higher risks compared to users of other vehicle types [3]. Electric bicycle accidents are more severe than traditional bicycle accidents due to higher speeds and greater momentum. This heightened risk presents new challenges for road safety, requiring updated measures to protect riders and pedestrians alike [4].
Effective interventions, including red-light cameras, wearing helmets, seat belts, and addressing safety incidents, can reduce road traffic accidents by 25–40% [5]. Helmet use, a critical factor in reducing the severity of injuries, has been identified as a primary means of mitigating these risk [6]. Studies have consistently demonstrated that helmets reduce the risk of severe head injuries by 69% and fatalities by 42% in the event of a crash [7,8]. Despite this evidence, helmet usage among TWEV riders remains suboptimal. However, progress in helmet use is not satisfactory, although many countries have enacted legislation to force riders to wear helmets when riding [9]. A large number of studies have shown that riding without wearing a helmet is still common, which is proved by observational studies, like that of Felix et al. [10] in Myanmar, Várheyi et al. [11] and Rusli R et al. [12] in Malaysia, and Xuequn [13] in China. Due to a significant number of motorcyclists not wearing helmets, ASEAN countries have implemented stricter enforcement of mandatory helmet laws for two-wheeler riders [14].
Understanding the reasons for this reluctance is essential to improving safety. Research indicates that helmet use is influenced by both subjective and objective factors. Subjective factors include individual attributes, such as education level, personal attitudes, and risk-taking behaviors [15,16,17]. However, these factors are challenging to address through short-term interventions. Consequently, researchers have turned to objective factors, such as secondary tasks during riding [18], law enforcement intensity [19], and demographic characteristics [13]. Despite this shift, there remains a lack of clarity regarding how these objective factors interact to influence helmet use, particularly among TWEV riders, whose behaviors may differ significantly from those of motorcyclists.
A review of existing studies reveals significant methodological gaps. Data collection often relies on direct observation or questionnaires, with analysis typically conducted using logistic or probit models to identify the relationships between variables and helmet use [20,21,22]. However, most studies have focused on isolated factors, neglecting the potential interaction effects that could provide deeper insights into rider behaviors. For example, while enforcement efforts are known to increase compliance, their interaction with other factors, such as rider demographics or traffic density, has not been adequately explored. Studies have shown, that for every 1% increase in police patrol time, the frequency of accidents during the same period decreases by 0.15% [23].
In response to these gaps, this study conducted a detailed observational analysis of TWEV riders in Fuzhou, China. A total of 16,206 TWEV riders were observed across eight locations, varying by traffic conditions, enforcement levels, and demographic composition. Using a multivariate logistic regression model, we analyzed the effects of factors such as gender, age, traffic density, and enforcement presence on helmet use, along with the interactions between these variables. This approach aims to provide policymakers and professionals with actionable insights into the factors driving helmet use and to support the development of targeted interventions. Ultimately, the findings are expected to enhance the effectiveness of helmet regulations and improve TWEV safety management.

2. Literature Review

2.1. Review of Research on TWEV Safety

In the field of traffic safety, research related to TWEV safety focuses mainly on the investigation of riding behavior and the analysis of crash data. Wang et al. conducted a questionnaire survey of TWEV riders in Guilin City and used structural equation modeling to analyze the relationship between safety knowledge, safety attitudes, and risk perception and risky driving behaviors, and used multiple regression modeling to test the effect of safety knowledge on various types of risky driving behaviors. The results showed that safety knowledge was significantly associated with risky driving behaviors in Chinese TWEV riders [24]. Chai et al. compared the behaviors of Chinese e-bike riders and bicycle riders at unsignalized intersections. They found that e-bike riders were less sensitive to inclement weather and intersection risk, but more sensitive to infrastructure quality [25]. Qian et al. developed a two-wheeled vehicle rider behavior questionnaire and conducted a survey in the city of Xi’an, finding that the characteristics of the abnormal behaviors of TWEV riders were more similar to those of motorcycle riders. They both showed a higher frequency of abnormal riding behavior compared to bicycle riders [26]. Gioldasis et al. conducted a face-to-face road survey of TWEV riders to explore the relationship between risk factors and user attributes and travel behavior [27].
In addition to surveys of TWEV riding behaviors, a number of scholars have analyzed crash data. Shah et al. used crash data from the Tennessee Integrated Transportation Analytics Network (TITAN) database from April 2018 to April 2020 and analyzed this using the Pedestrian and Bicycle Crash Analysis Tool (PBCAT), which showed that every 10 e-scooter and bicycle motorized vehicle collisions resulted in injury or death to a TWEV rider or bicyclist. In addition, there were statistically significant differences between TWEV and bicycle collisions in terms of spatial and temporal distribution, demographics, lighting conditions, and distance from home [28]. Sadeghi et al. combined the XGBoost algorithm with a stochastic parametric binary logit model and used likelihood ratio tests to validate the temporal instability of motorized vehicle collisions in the UK over different periods of the COVID epidemic [29]. Gao et al. categorized EV crashes into two-vehicle crashes and single-vehicle crashes, and used a random parameter approach with mean and variance heterogeneity to examine the factors affecting injury severity [30]. In addition, some studies have explored the factors affecting the frequency of TWEV crashes from a macroscopic perspective, combining crash data and environmental characteristics using crash counting models [31,32].

2.2. Review of Research on Helmets

Numerous studies have shown that failure to properly use seat belts and helmets is one of the leading causes of road traffic accidents [33,34]. Wearing a helmet can be effective in reducing the risk of head injuries [35]. Thompson et al. investigated the effectiveness of bicycle helmets in preventing and protecting against head injuries. The results showed that bicycle helmets, regardless of type, can provide protection for cyclists of all ages involved in collisions, including those involving motor vehicles [36]. The World Health Organization (WHO) produced the World Report on Road Traffic Injury Prevention [37]. It was found that proper wearing of motorcycle helmets reduced the risk of traffic fatalities by 40% and the risk of severe head injuries by 70%. Moftakhar et al. conducted a retrospective multicenter study of all consecutive patients admitted to hospitals for TWEV-related injuries (riders and non-riders) between 1 May 2018 and 30 September 2019, and the results showed that 17.7% had serious head injuries. Therefore, proper helmet wear may reduce the chance of injury in TWEV accidents [38]. Hamzani used a retrospective cross-sectional study design. All patients, including those referred to the emergency departments of tertiary care centers for oral and maxillofacial injuries involving TWEVs or P-scooters, from 2014–2020 were investigated. Results showed that patients who used helmets also had lower rates of fractures (18.2%) and alveolar injuries (23.7%) than those who did not (68.8% and 37.3%, respectively) [39].
However, despite the protective advantages of helmets, helmet use among e-bike riders is relatively low [19]. Some riders have low willingness to wear helmets because of their heaviness and inconvenience [40]. Yuan et al. found that helmet wearing among e-bike riders was influenced by area of residence, age, gender, marital status, and education level [41]. Yang et al. developed an integrated theoretical model combining the Theory of Planned Behavior (TPB) and the Health Belief Model (HBM) to test the influence of factors among college students on the willingness of TWEV riders to wear helmets, and the results showed that law enforcement emerged as the most influential factor, highlighting the key role of enforcing regulations and raising awareness [42]. Ma et al. used logistic regression to study the impact of helmet wearing regulations on TWEV riders, and the results showed that mandatory regulation was more effective than encouraging regulation in reducing head injuries [43].
This paper takes Fuzhou city as an example and analyzes the factors affecting the influence of helmet wearing on TWEV riders through video data. It provides a theoretical basis for the safety management of electric vehicles in Fuzhou city.

3. Materials and Methods

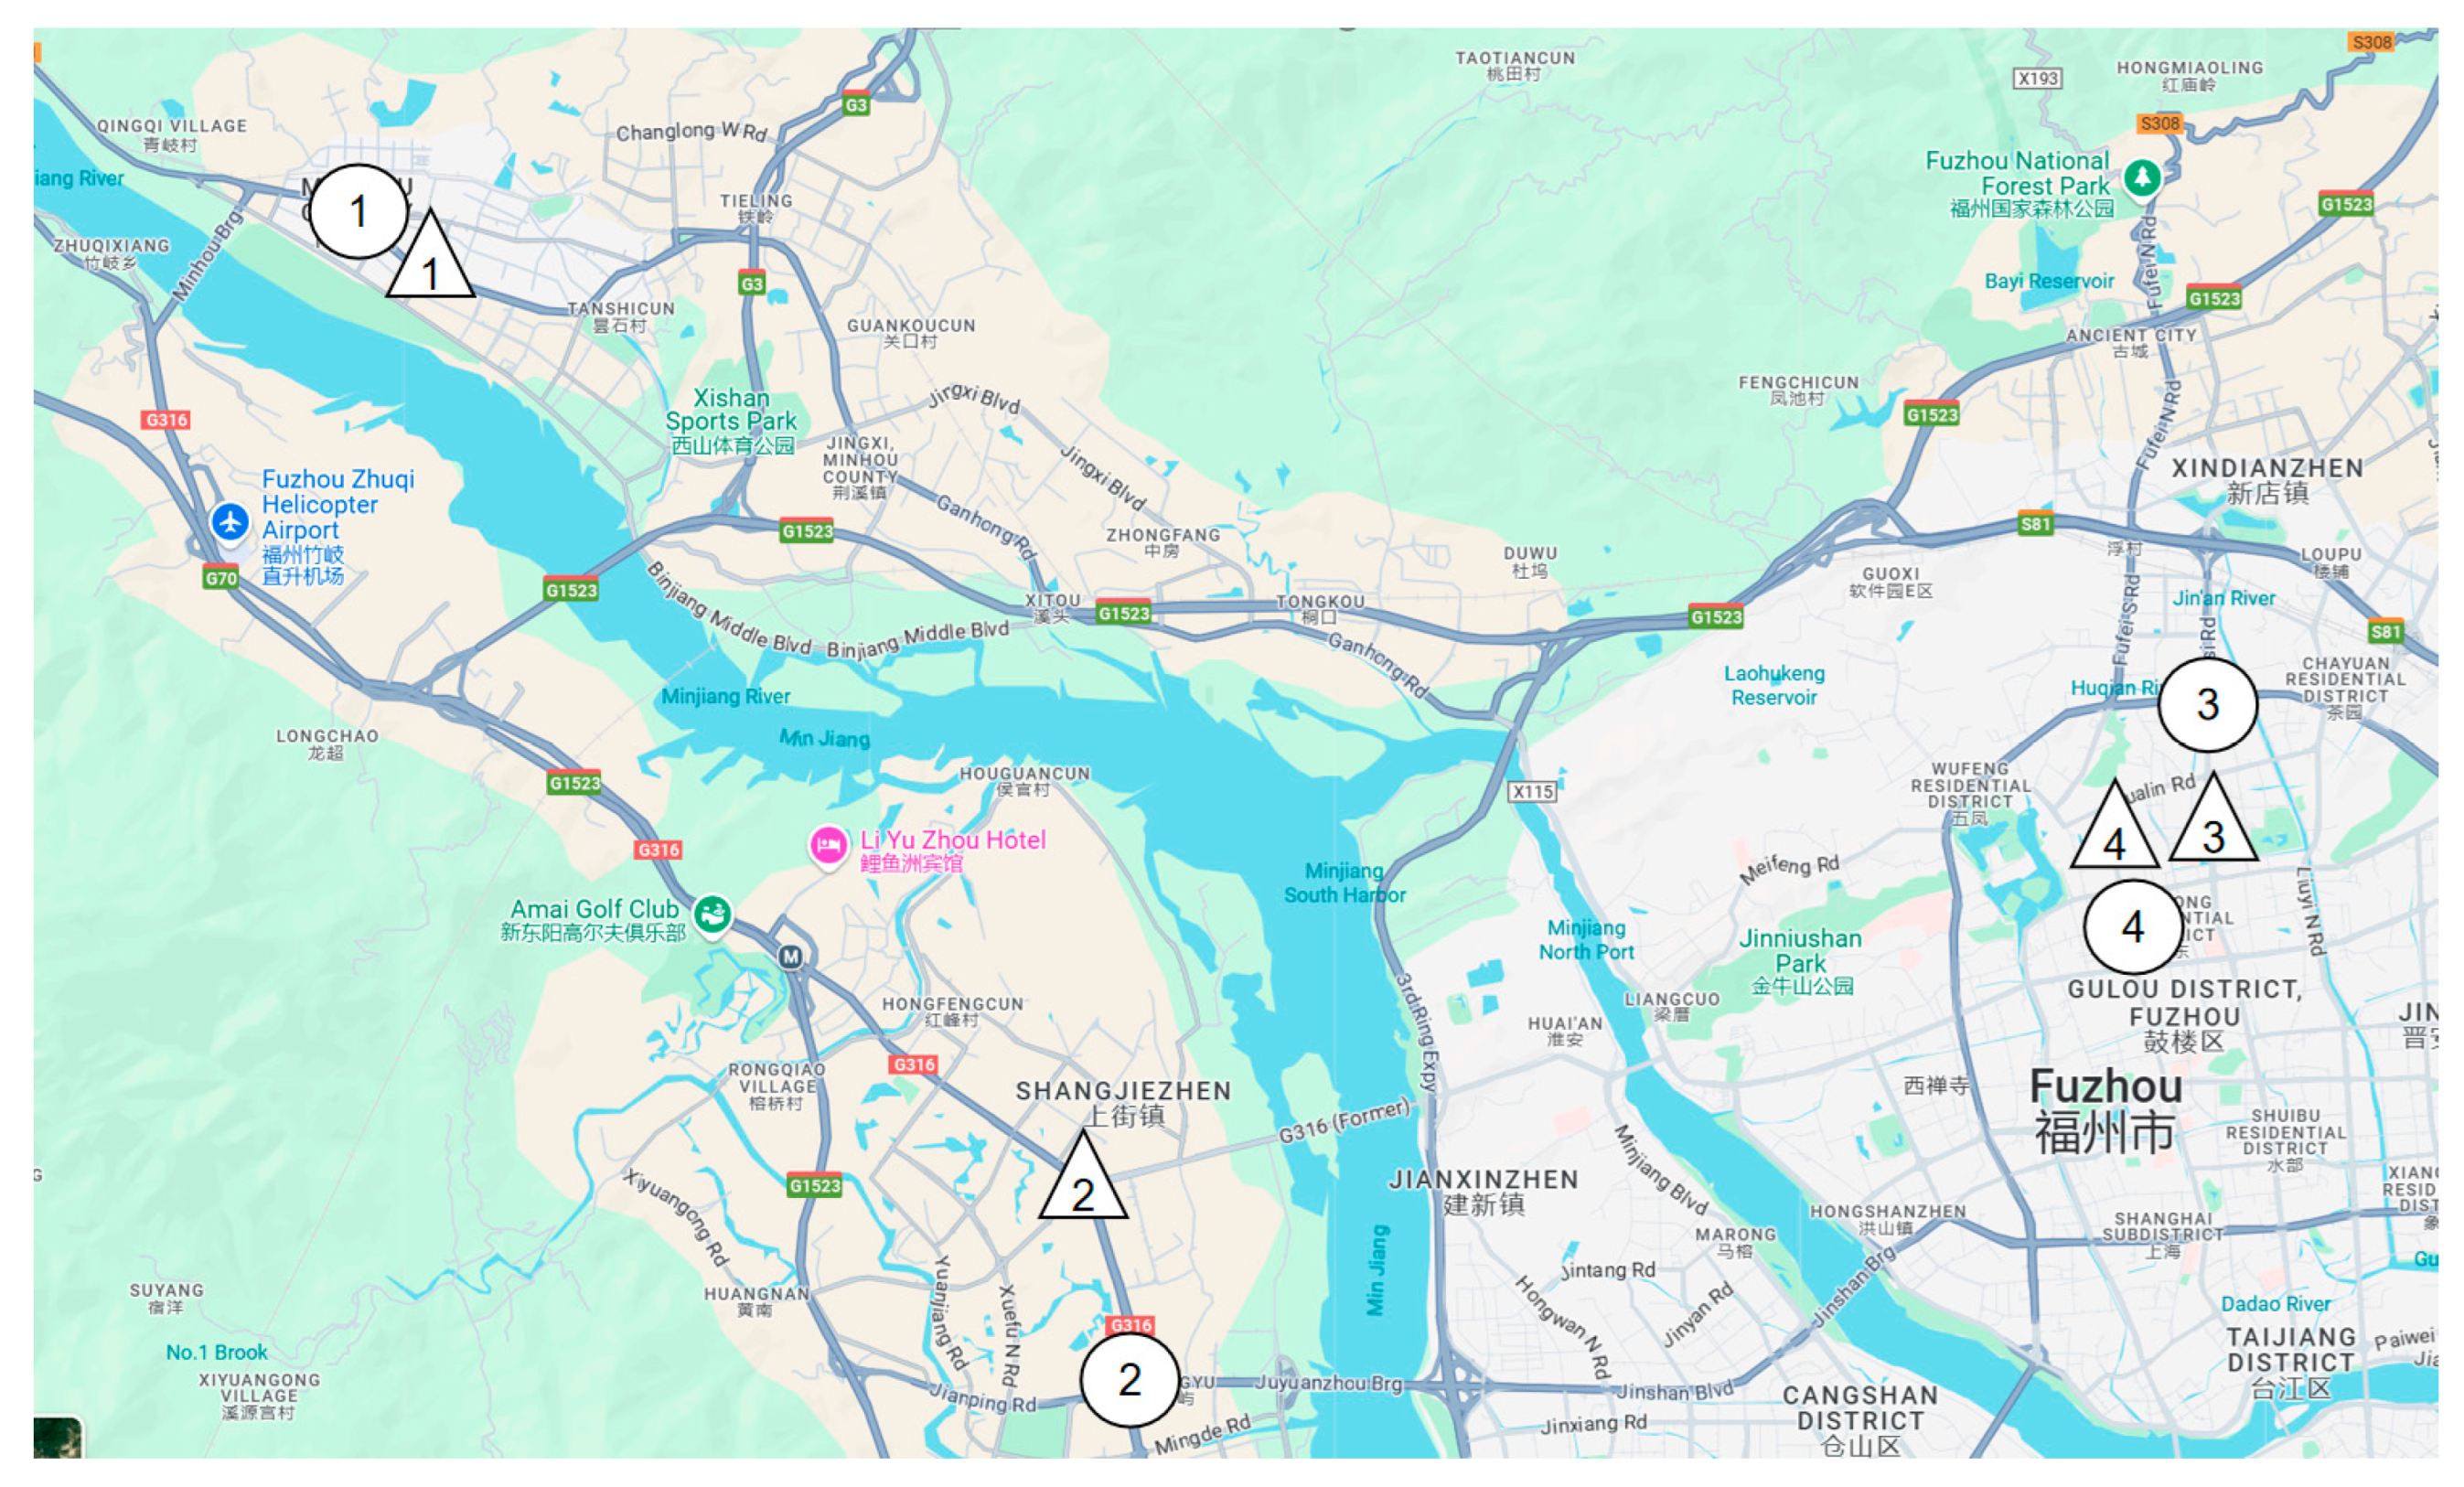
3.1. Site Characteristics

Four intersections and four road sections in Fuzhou, China were selected for investigation. The distribution of observation sites is shown in Figure 1, and their characteristics are shown in Table 1. The choice of sites was based on the data provided by the traffic police and the distribution of TWEV traffic volume. The observation was carried out through monitoring by traffic police. The view is shown in Figure 2.

3.2. Data Collection Procedure

The observational data came from the surveillance video of the observation site from 11 March to 10 April 2022, from which a sunny day and a rainy day were randomly selected as the survey dates. The survey time was from 7:30 am to 8:00 am (morning peak hours), from 12:00 to 12:30 pm (off peak hours) and from 17:30 pm to 17:30 pm (evening peak hours). Each site provided a total of 3 h of surveillance video, and the total amount of video material observed was 24 h.
All observation data were coded by 15 master’s degree students majoring in traffic and transportation. The data were collected in a pre-set table. All coders had been trained in different types of TWEV identification, rider characteristics identification and data quality control. The coding helmet use data was reviewed by three experts in the field of traffic engineering and traffic safety to ensure data quality.

4. Data Analysis

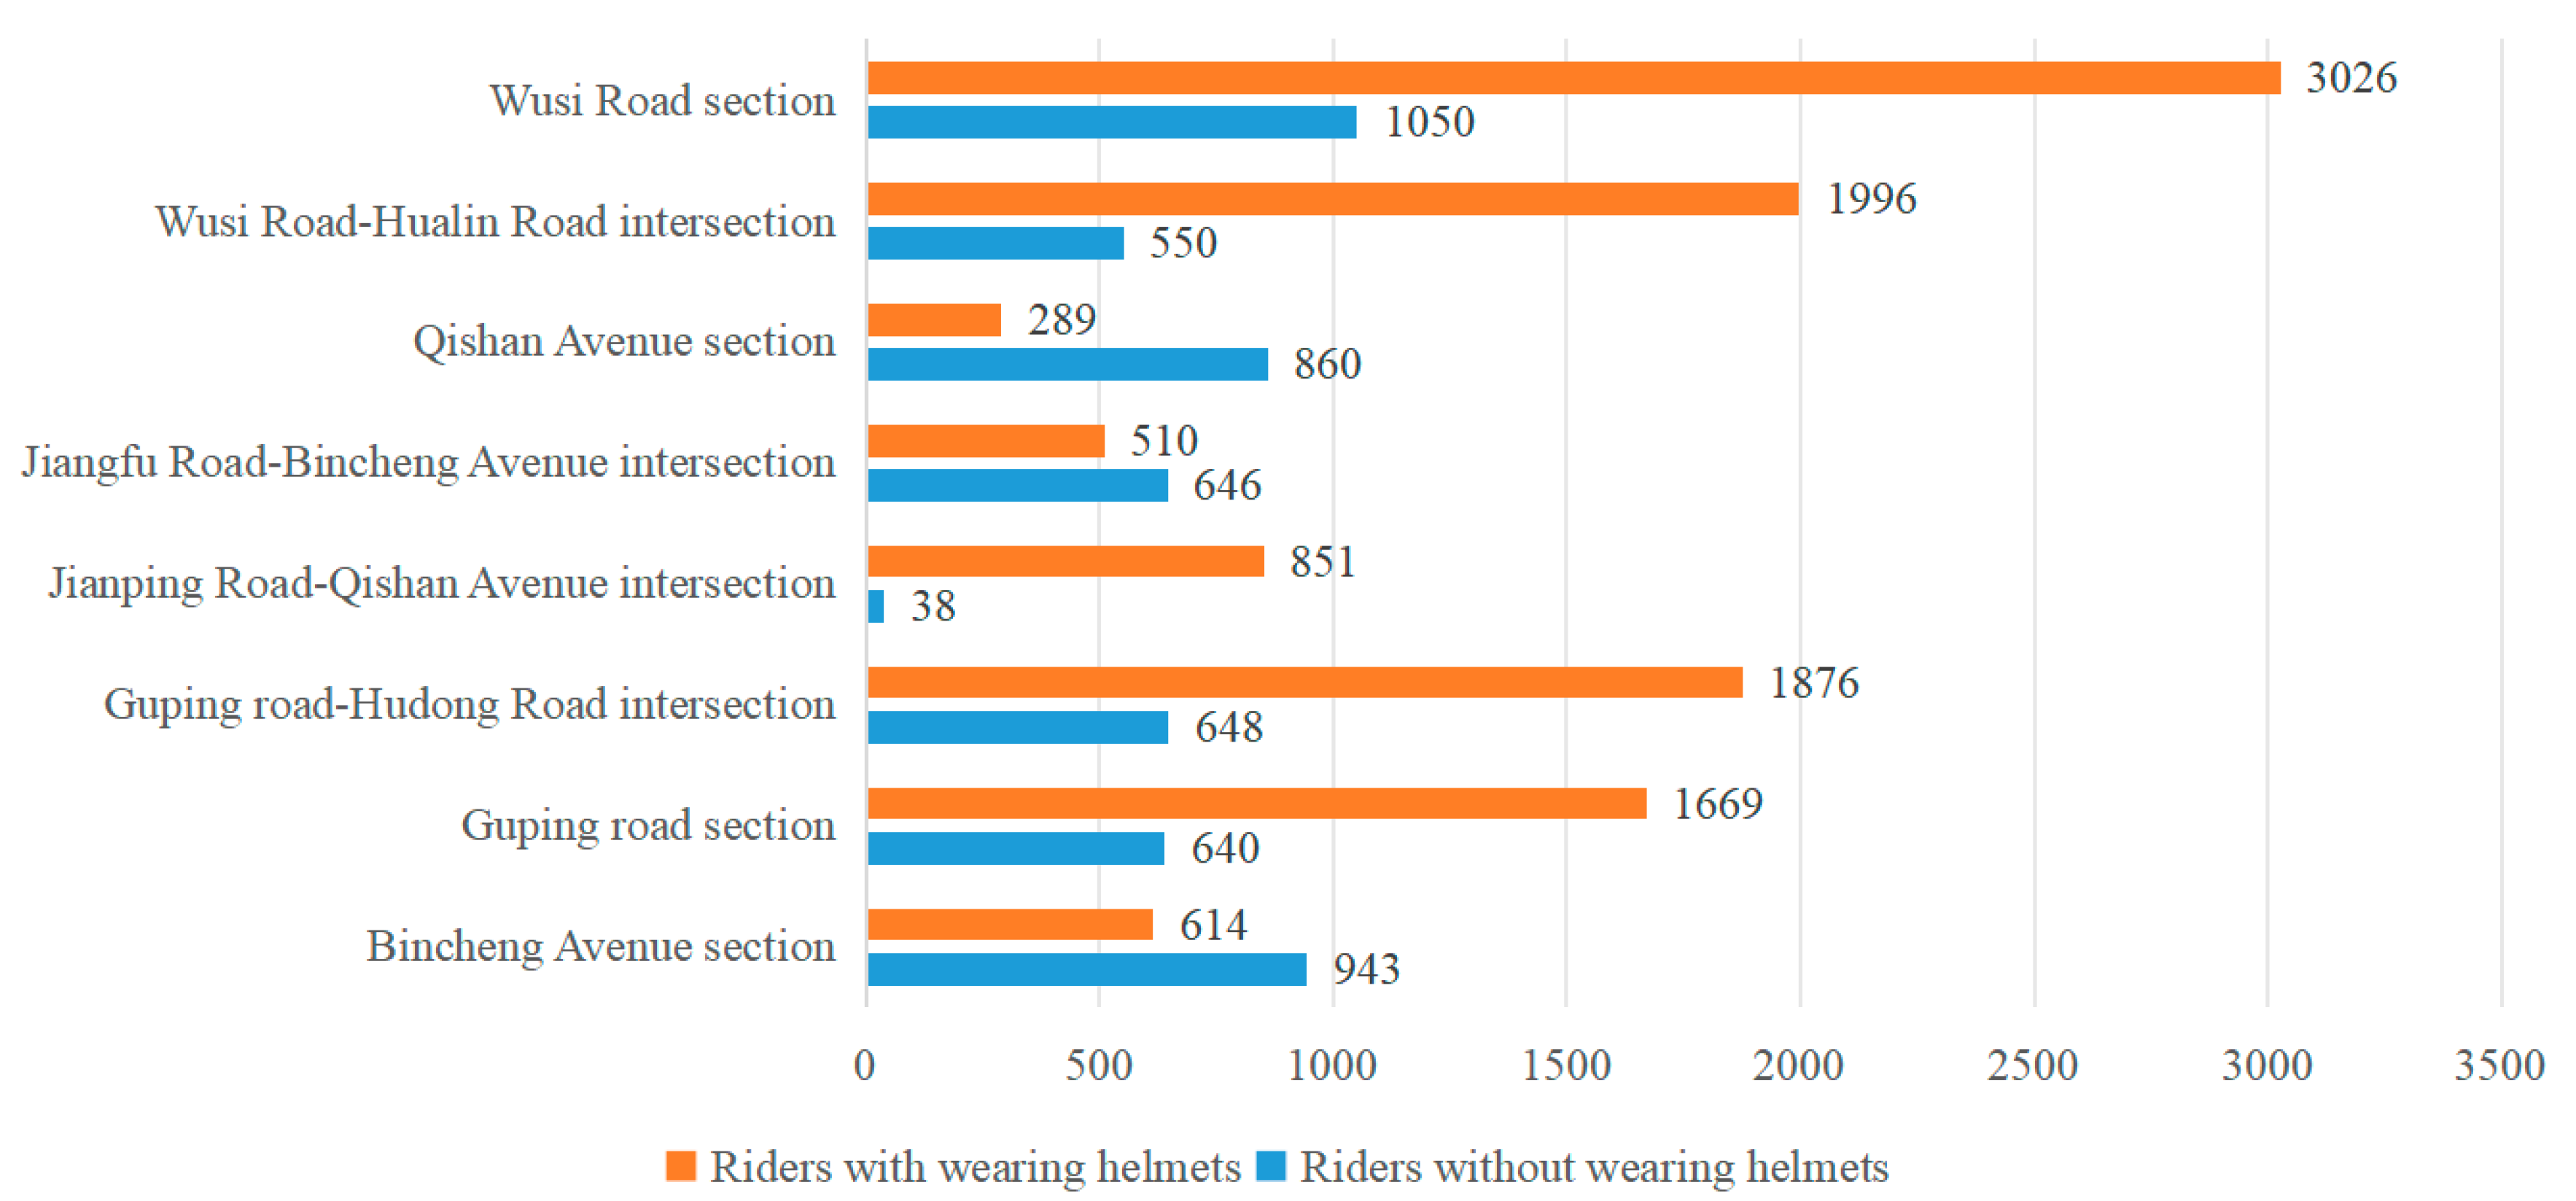
4.1. Descriptive Statistics

A total of 16,206 TWEV riders were observed, including 5375 riders not wearing helmets and 10,831 riders wearing helmets. The observed helmet use data at each site is shown in Figure 3. The number on the right side of the bar chart refers to the number of riders observed, and the x-axis as a percentage refers to the proportion of riders without helmets compared to all riders.

4.2. Multivariate Logistic Regression Model

The multivariate logit model is applicable in cases where the result variable is a category variable (with or without helmet), and multiple explained variables are classified variables or sequence variables. Therefore, a multivariate logistic regression model was built to analyze the relationship between helmet use and other factors. The formula for the model is shown in Equation (1) below:
l o g i t P y = j X = log P y = j X 1 P y = j X ) = α j x i β j ,
where j is the level of the result variable and i is the number of variables to be explained, i ϵ 1 , I , j ϵ 1 , J . y is the result variable. x i is the change value of the i-th explained variable. β i is the slope of the i-th explained variable. α j is the constant term of the result variable corresponding to the j-th level.
When y is the j-th level, the formula can be written as Equation (2):
P j = P y = j X = 1 1 + exp α j x i β j
In a logistic model, a certain group of explained variables is selected as the baseline to estimate the impact of other explained variables on the result variables. The impact is generally reflected in the odds ratio. Assuming that a selected baseline is the first group, then the impact of other explained variables on the result variable relative to the baseline can be written as follows in Equation (3):
P j P 1 = P y = j X P y = 1 X = e x i β j , j = 2 , , J
The effect of the change of l -th explained variables on the odds ratio can be written as e Δ x i l β j l , where, β j l is the l -th element in the j -th group coefficient vector β j . The equation shows that, when the other explained variables remain unchanged, for each additional unit of x i l , i.e., Δ x i l = 1 , the odds ratio of selecting the j -th groups relative to baseline is e β j l . It can be seen that if, and only if, β j l > 0, the odds ratio of the j -th group relative to the baseline is greater than 1, and the increase in x i l will increase the odds ratio of selecting the j -th group relative to the baseline.

4.3. Data Preparation

In this study, helmet use was the result variable. The other factors recorded during observation were explained variables. Finally, 16,206 rows of table data were obtained. Table 2 shows the result variable, explained variables and their codes. STATA 17.0 MP software was used to build the logistic model, with mlogit command.

5. Results

5.1. Multicollinearity Diagnostics

Multicollinearity diagnostics are used to examine whether there are correlations among the influencing factors in the electric bicycle rider helmet use model. Severe multicollinearity can increase the standard deviation and variance of model parameters, reduce the significance level of variables, and even cause the model to fail to converge, leading to ineffective predictions. Therefore, this study employs the Variance Inflation Factor (VIF) method and the correlation coefficient matrix method to diagnose multicollinearity among the 11 factor variables included in the model, and Pearson correlation analysis is used to analyze the correlation between variables.
Based on the diagnostic results of the VIF and the correlation coefficient matrix method, it can be concluded that there is no severe multicollinearity among the 11 factor variables in the model (Table 3). Specifically, the VIF values are all below 5 and within a reasonable range, indicating that the correlations among the factors are low and the variables are relatively independent. Therefore, the parameter estimates of the model are reliable, and the standard deviations or variances will not be inflated due to multicollinearity.
In the correlation coefficient matrix, the correlations between variables do not show significant multicollinearity issues, and the highest correlation coefficients between variable combinations are still within an acceptable range, with no near-perfect correlations close to 1 or −1 (Figure 4). This further indicates that the factor variables in the model can function independently, ensuring the stability of the model.
Overall, the multicollinearity diagnostics indicate that the correlations between selected variables do not significantly affect the regression results, and the model’s parameter estimation and predictive performance remain unaffected by multicollinearity. Therefore, the model can be used for further analysis and prediction.

5.2. Analysis of Multivariate Logistic Regression Model Results

After 8 iterations, the model converges (log likelihood = −8444.285). The model prob > χ2= 0.000, pseudo R2 = 0.2147, which indicates that the model fits better than the model containing only constant terms, but the ability of independent variable x to explain the total variation is low. The results of the multivariate logistic model are shown in Table 4. Among them, the odds ratio refers to the probability of using helmets when all other explained variables are controlled at the same level. Taking area as an example, riders in urban areas are more likely to use helmets than those in suburbs by 99.3%. After the main effect analysis, the interaction analysis was carried out. The following Table 5 lists all statistically significant (p < 0.05) interaction factors without singular values.

6. Discussion

The main effect analysis shows that the possibility of helmet use for riders in urban areas is higher than that of riders in suburban areas, and riders are more reluctant to wear helmets on rainy days. This finding aligns with previous studies, which indicate that stricter law enforcement and better infrastructure in urban areas contribute to higher helmet use rates [44,45,46]. However, our study further reveals that regulatory differences regarding TWEV modifications play a crucial role. An interaction is found, increasing the possibility of helmet use to 1322.7% relative to the baseline group of Area = Suburb * Weather = Sunny. Apart from the stricter enforcement of helmet use laws in urban areas, this enormous increase may be due to the different regulations regarding TWEV modification in suburbs and urban areas [47]. In urban areas, installing rain canopies on TWEVs is prohibited, making riders more likely to wear helmets on rainy days. However, in suburban areas, regulations on such modifications are more relaxed, leading riders to forgo helmets in favor of installing rain shelters for protection. Compared to similar studies that focus solely on law enforcement, our findings offer a novel perspective by highlighting the indirect effects of vehicle modifications on helmet use
The rise of ADT also reduces the probability of riders wearing helmets. This contradicts previous research suggesting that higher traffic density leads to increased safety awareness among riders [48]. Interaction analysis proves that this interacts with age. When the ADT rises, older riders are more willing to wear helmets. The reason may be that older riders are more safety conscious, which is also verified by the main effect analysis of age variables. This highlights that helmet use behavior is not only dependent on external traffic conditions but also significantly influenced by demographic factors, an aspect that previous models may have overlooked [44,49].
The existence of traffic controllers (EC) greatly increases the probability of helmet use. On the contrary, separated non-motor vehicle lanes (SNLs) do not improve the use of helmets but increase the probability of riders not wearing helmets. This contrasts with studies, which suggest that dedicated lanes improve overall traffic safety [50,51]. In interaction analysis, even if traffic controllers exist, the separated non-motor vehicle lane still reduces the possibility of helmet use. The source of this problem may be that riders overestimate the protective effect of lane separation, thus reducing helmet use, seen as implementation of an “over-protection” measure [52]. Unlike previous research that primarily focuses on the benefits of lane separation, our study reveals a potential unintended consequence—riders’ false sense of security leading to lower helmet use.
Time of day affects helmet use. Compared with the morning peak hours, the probability of riders wearing helmets during off peak hours and evening peak hours is reduced. The reasons for this situation may be very complicated, involving traffic flow, the characteristics of riders, the existence of controllers, etc. Our findings support previous research indicating that law enforcement intensity varies throughout the day [53], but we further highlight that this variation directly influences riders’ compliance behavior. Most likely, stricter law enforcement during morning peak hours may lead to this situation.
It is noteworthy that, in the main effect analysis, gender does not have a significant impact on helmet use (p > 0.05). However, regarding interaction, that between gender and age shows a significant impact. Over 35-years-old male riders are more likely to wear helmets, which may reflect the different attitudes of male and female riders of different ages towards helmet use. This nuanced finding extends previous studies that focus solely on gender differences by demonstrating the necessity of considering interaction effects between demographic variables [49,54]. At the same time, although being a food delivery worker has no influence on helmet use, in interactive analysis, the probability of the over 35-years-old food delivery worker wearing the helmet is less than that of under-35 years-old riders. This may indicate that work-related urgency or risk perception differences contribute to helmet use behavior, an area that warrants further study.
Types of TWEV have a significant influence on helmet use. Compared with electric bicycle riders, electric moped riders are more reluctant to wear helmets. This aligns with previous research suggesting that riders of larger, more powerful vehicles often exhibit greater risk-taking behavior [55,56]. However, in interactive analysis, when the control temperature is different, the possibility of electric moped riders wearing helmets is higher than that of electric bicycle riders. Further experiments are needed to check and verify this conclusion. This temperature-related factor has been rarely explored in prior studies, suggesting that external environmental conditions could play a more critical role than previously assumed. Further experiments are needed to check and verify this conclusion.
From Table 3 and Table 4, it seems that different LOS has no influence on helmet use. All the p values for this are greater than 0.05 in the main effect analysis. This result is inconsistent with previous studies on traffic density and risky behaviors [57], which often report a correlation between congestion levels and safety compliance. The reason for this phenomenon may be that helmet use is not closely related to aggressive riding behavior, which is obstructed by other vehicles in high-density traffic flow. Our findings suggest that helmet use decisions may be less about risk-taking tendencies and more about external regulatory and environmental factors, distinguishing our study from previous behavioral-focused research.
Despite the strong explanatory power of the multinomial Logit model, this study has several limitations. First, while the model provides valuable insights into the influence of various factors on helmet use, it assumes that the relationships between variables are linear and independent. This may oversimplify real-world behavior, as helmet use decisions are influenced by complex and dynamic factors that may require more flexible models, such as mixed-effects models or machine learning approaches. Second, the study relies on observational data collected at specific locations in Fuzhou, which may limit the generalizability of the findings to other cities or regions with different regulatory and cultural contexts. Third, some unobserved variables, such as individual risk perception, attitudes toward law enforcement, and socioeconomic factors, were not included in the model, potentially affecting the robustness of the conclusions. Future research should consider incorporating more comprehensive behavioral data and exploring alternative modeling techniques to enhance predictive accuracy and generalizability.

7. Conclusions

This study conducted an observational analysis to collect helmet use data from 16,206 two-wheeled electric vehicle (TWEV) riders in Fuzhou, China. A multivariate logistic regression model was developed to investigate the influence of various factors, including level of service (LOS), area type (urban/suburban), average daily traffic (ADT), weather, etc., on helmet use. The model demonstrated high goodness of fit, effectively explaining how these factors impact helmet-wearing behavior.
The findings revealed that several factors, such as area type, weather conditions, average daily temperature, the presence of traffic controllers, separated non-motor vehicle lanes, time of day, rider age, and vehicle type, significantly influenced helmet use. Moreover, the interactions among these factors were notable, with weather and average daily temperature showing particularly strong interaction effects. In contrast, LOS, gender, and whether the rider was a food delivery worker or not did not have significant direct effects on helmet use but exhibited significant interaction effects with other factors.
A key observation was that separated non-motor vehicle lanes might create a false sense of security, leading to lower helmet use among riders. Additionally, the analysis highlighted discrepancies between the conclusions drawn from interaction effect analysis and those from main effect analysis. These findings align with previous research but provide additional insights into the behavioral dynamics of helmet use, emphasizing the role of environmental and regulatory factors.
Future research should focus on several key areas to build upon these findings. First, alternative modeling approaches, such as mixed-effects models or machine learning methods, should be explored to better capture the complexity of helmet use behaviors. Second, additional behavioral variables, including riders’ individual risk perceptions, attitudes toward law enforcement, and socioeconomic factors, should be integrated to enhance the robustness of the analysis. Third, expanding the study to different cities or regions with varying regulatory environments will help assess the generalizability of the conclusions. Finally, controlled experiments could be conducted to further validate the interaction effects identified in this study, ensuring a more precise understanding of the factors influencing helmet use.

Author Contributions

Conceptualization, W.L. and C.L.; formal analysis, W.L. and W.Z.; methodology, W.Z. and Y.Y.; resources, Y.Y.; data curation, L.W.; writing—original draft, W.L. and C.L.; writing—review and editing, Y.Y. All authors have read and agreed to the published version of the manuscript.

Funding

This study was supported by the Evaluation Standard for the Effectiveness of Traffic Safety Facilities on National and Provincial Trunk Roads (2023 Guangxi Transportation Standardization Project), and the Central Government’s Special Fund for Local Scientific and Technological Development (Project No. 2023L3033).

Data Availability Statement

The datasets generated and analyzed during the current study are available from the corresponding author upon reasonable request.

Conflicts of Interest

Author Congying Li was employed by Guangxi Communications Design Group Co., Ltd. Author Weibin Zheng was employed by Fuzhou Fuda Automation Technology Co., Ltd. The remaining authors declare that the research was conducted in the absence of any commercial or financial relationships that could be construed as a potential conflict of interest.

References

  1. eBicycles. E-Bike Facts & Statistics for 2021. 2021. Available online: https://www.ebicycles.com/ebike-facts-statistics/ (accessed on 9 February 2025).
  2. Gibson, K. Big Jump in e-Scooter, e-Bike Injuries the Last Four Years, CPSC Finds. 2021. Available online: https://www.cbsnews.com/news/electric-scooter-electric-bike-accidents-rise-last-four-years/ (accessed on 9 February 2025).
  3. Bambach, M.R.; Mitchell, R.; Grzebieta, R.H.; Olivier, J. The effectiveness of helmets in bicycle collisions with motor vehicles: A case–control study. Accid. Anal. Prev. 2013, 53, 78–88. [Google Scholar] [CrossRef] [PubMed]
  4. Kwiatkowski, M.A.; Grzelak-Kostulska, E.; Biegańska, J. Could it be a bike for everyone? The electric bicycle in Poland. Energies 2021, 14, 4878. [Google Scholar] [CrossRef]
  5. Mohan, D. Evidence-based interventions for road traffic injuries in South Asia. J. Coll. Physicians Surg.-Pak. JCPSP 2004, 14, 746–747. [Google Scholar]
  6. Tang, T.; Guo, Y.; Wang, H.; Li, X.; Agrawal, S. Determinants of helmet use intention among E-bikers in China: An application of the theory of planned behavior, the health belief model, and the locus of control. Transp. Res. Rec. 2024, 2678, 753–769. [Google Scholar] [CrossRef]
  7. Branas, C.C.; Knudson, M.M. Helmet laws and motorcycle rider death rates. Accid. Anal. Prev. 2001, 33, 641–648. [Google Scholar] [CrossRef] [PubMed]
  8. Dodds, N.; Johnson, R.; Walton, B.; Bouamra, O.; Yates, D.; Lecky, F.E.; Thompson, J. Evaluating the impact of cycle helmet use on severe traumatic brain injury and death in a national cohort of over 11000 pedal cyclists: A retrospective study from the NHS England Trauma Audit and Research Network dataset. BMJ Open 2019, 9, e027845. [Google Scholar] [CrossRef]
  9. Karkhaneh, M.; Kalenga, J.-C.; Hagel, B.E.; Rowe, B.H. Effectiveness of bicycle helmet legislation to increase helmet use: A systematic review. Inj. Prev. 2006, 12, 76–82. [Google Scholar] [CrossRef] [PubMed]
  10. Siebert, F.W.; Albers, D.; Naing, U.A.; Perego, P.; Santikarn, C. Patterns of motorcycle helmet use–A naturalistic observation study in Myanmar. Accid. Anal. Prev. 2019, 124, 146–150. [Google Scholar] [CrossRef]
  11. Manan, M.M.A.; Várhelyi, A. Motorcyclists’ road safety related behavior at access points on primary roads in Malaysia–A case study. Saf. Sci. 2015, 77, 80–94. [Google Scholar] [CrossRef]
  12. Rusli, R.; Oviedo-Trespalacios, O.; Abd Salam, S.A. Risky riding behaviours among motorcyclists in Malaysia: A roadside survey. Transp. Res. Part F Traffic Psychol. Behav. 2020, 74, 446–457. [Google Scholar] [CrossRef]
  13. Li, Y.; Chen, Q.; Ma, Q.; Yu, H.; Huang, Y.; Zhu, L.; Zhang, H.; Li, C.; Lu, G. Injuries and risk factors associated with bicycle and electric bike use in China: A systematic review and meta-analysis. Saf. Sci. 2022, 152, 105769. [Google Scholar] [CrossRef]
  14. Peltzer, K.; Pengpid, S. Helmet use and associated factors among motorcyclists in the Association of Southeast Asian Nations: Prevalence and effect of interventions. Afr. Saf. Promot. A J. Inj. Violence Prev. 2014, 12, 72–86. [Google Scholar]
  15. Wang, X.; Chen, J.; Quddus, M.; Zhou, W.; Shen, M. Influence of familiarity with traffic regulations on delivery riders’e-bike crashes and helmet use: Two mediator ordered logit models. Accid. Anal. Prev. 2021, 159, 106277. [Google Scholar] [CrossRef]
  16. Buhler, T.; Comby, E.; Vaudor, L.; von Pape, T. Beyond ‘good’and ‘bad’cyclists. On compensation effects between risk taking, safety equipment and secondary tasks. J. Transp. Health 2021, 22, 101131. [Google Scholar] [CrossRef]
  17. Eccarius, T.; Leung, A.; Shen, C.-W.; Burke, M.; Lu, C.-C. Prospects for shared electric velomobility: Profiling potential adopters at a multi-campus university. J. Transp. Geogr. 2021, 96, 103190. [Google Scholar] [CrossRef]
  18. Huemer, A.K.; Banach, E.; Bolten, N.; Helweg, S.; Koch, A.; Martin, T. Secondary task engagement, risk-taking, and safety-related equipment use in German bicycle and e-scooter riders–An observation. Accid. Anal. Prev. 2022, 172, 106685. [Google Scholar] [CrossRef]
  19. Zhou, J.; Zheng, T.; Dong, S.; Mao, X.; Ma, C. Impact of helmet-wearing policy on e-bike safety riding behavior: A bivariate ordered probit analysis in Ningbo, China. Int. J. Environ. Res. Public Health 2022, 19, 2830. [Google Scholar] [CrossRef]
  20. Du, W.; Yang, J.; Powis, B.; Zheng, X.; Ozanne-Smith, J.; Bilston, L.; Wu, M. Understanding on-road practices of electric bike riders: An observational study in a developed city of China. Accid. Anal. Prev. 2013, 59, 319–326. [Google Scholar] [CrossRef]
  21. Debnath, A.K.; Haworth, N.; Heesch, K.C. Women cycling in Queensland: Results from an observational study. Accid. Anal. Prev. 2021, 151, 105980. [Google Scholar] [CrossRef]
  22. Pai, C.-W.; Hsu, J.-J.; Chang, J.-L.; Kuo, M.-S. Motorcyclists violating hook-turn area at intersections in Taiwan: An observational study. Accid. Anal. Prev. 2013, 59, 1–8. [Google Scholar] [CrossRef]
  23. Feng, M.; Wang, X.; Quddus, M. Developing multivariate time series models to examine the interrelations between police enforcement, traffic violations, and traffic crashes. Anal. Methods Accid. Res. 2020, 28, 100139. [Google Scholar] [CrossRef]
  24. Wang, C.; Xu, C.; Xia, J.; Qian, Z. The effects of safety knowledge and psychological factors on self-reported risky driving behaviors including group violations for e-bike riders in China. Transp. Res. Part F Traffic Psychol. Behav. 2018, 56, 344–353. [Google Scholar] [CrossRef]
  25. Chai, H.; Zhang, Z.; Xue, J.; Hu, H. A quantitative traffic performance comparison study of bicycles and E-bikes at the non-signalized intersections: Evidence from survey data. Accid. Anal. Prev. 2022, 178, 106853. [Google Scholar] [CrossRef]
  26. Qian, Q.; Qi, Y.; Shi, J. Description and analysis of aberrant riding behaviors of pedal cyclists, e-bike riders and motorcyclists: Based on a self-report questionnaire. Transp. Res. Part F Traffic Psychol. Behav. 2024, 107, 969–984. [Google Scholar] [CrossRef]
  27. Gioldasis, C.; Christoforou, Z.; Seidowsky, R. Risk-taking behaviors of e-scooter users: A survey in Paris. Accid. Anal. Prev. 2021, 163, 106427. [Google Scholar] [CrossRef] [PubMed]
  28. Shah, N.R.; Aryal, S.; Wen, Y.; Cherry, C.R. Comparison of motor vehicle-involved e-scooter and bicycle crashes using standardized crash typology. J. Saf. Res. 2021, 77, 217–228. [Google Scholar] [CrossRef]
  29. Sadeghi, M.; Aghabayk, K.; Quddus, M. A hybrid Machine learning and statistical modeling approach for analyzing the crash severity of mobility scooter users considering temporal instability. Accid. Anal. Prev. 2024, 206, 107696. [Google Scholar] [CrossRef] [PubMed]
  30. Gao, D.; Zhang, X. Injury severity analysis of single-vehicle and two-vehicle crashes with electric scooters: A random parameters approach with heterogeneity in means and variances. Accid. Anal. Prev. 2024, 195, 107408. [Google Scholar] [CrossRef]
  31. Ye, F.; Wang, C.; Cheng, W.; Liu, H. Exploring Factors Associated with Cyclist Injury Severity in Vehicle-Electric Bicycle Crashes Based on a Random Parameter Logit Model. J. Adv. Transp. 2021, 2021, 5563704. [Google Scholar] [CrossRef]
  32. Azimian, A.; Jiao, J. Modeling factors contributing to dockless e-scooter injury accidents in Austin, Texas. Traffic Inj. Prev. 2022, 23, 107–111. [Google Scholar] [CrossRef]
  33. Yadukul, S. A Study of Preventive Risk Factors in Fatal Road Traffic Injuries, with Special Emphasis to Helmets and Seatbelts. Ph.D. Dissertation, Rajiv Gandhi University of Health Sciences (India), Bengaluru, India, 2013. [Google Scholar]
  34. Bonnet, E.; Lechat, L.; Ridde, V. What interventions are required to reduce road traffic injuries in Africa? A scoping review of the literature. PLoS ONE 2018, 13, e0208195. [Google Scholar] [CrossRef] [PubMed]
  35. Cripton, P.A.; Dressler, D.M.; Stuart, C.A.; Dennison, C.R.; Richards, D. Bicycle helmets are highly effective at preventing head injury during head impact: Head-form accelerations and injury criteria for helmeted and unhelmeted impacts. Accid. Anal. Prev. 2014, 70, 1–7. [Google Scholar] [CrossRef] [PubMed]
  36. Thompson, D.C.; Rivara, F.P.; Thompson, R.S. Effectiveness of bicycle safety helmets in preventing head injuries: A case-control study. Jama 1996, 276, 1968–1973. [Google Scholar] [CrossRef] [PubMed]
  37. Peden, M.M. World Report on Road Traffic Injury Prevention; World Health Organization: Geneva, Switzerland, 2004. [Google Scholar]
  38. Moftakhar, T.; Wanzel, M.; Vojcsik, A.; Kralinger, F.; Mousavi, M.; Hajdu, S.; Aldrian, S.; Starlinger, J. Incidence and severity of electric scooter related injuries after introduction of an urban rental programme in Vienna: A retrospective multicentre study. Arch. Orthop. Trauma Surg. 2021, 141, 1207–1213. [Google Scholar] [CrossRef]
  39. Hamzani, Y.; Bar Hai, D.; Cohen, N.; Drescher, M.J.; Chaushu, G.; Yahya, B.H. The impact of helmet use on oral and maxillofacial injuries associated with electric-powered bikes or powered scooter: A retrospective cross-sectional study. Head Face Med. 2021, 17, 1–8. [Google Scholar] [CrossRef]
  40. Zamani-Alavijeh, F.; Bazargan, M.; Shafiei, A.; Bazargan-Hejazi, S. The frequency and predictors of helmet use among Iranian motorcyclists: A quantitative and qualitative study. Accid. Anal. Prev. 2011, 43, 1562–1569. [Google Scholar] [CrossRef]
  41. Yuan, Q.; Shi, H.; Zhao, J.; Li, R. Influencing factors analysis of helmet wearing for electric bicycle riders based on ordinal multinomial logistic model. Transp. Saf. Environ. 2022, 4, tdac001. [Google Scholar] [CrossRef]
  42. Yang, Y.; Li, C.; Cheng, K.; Hu, S. Factors affecting the intention to wear helmets for e-bike riders: The case of Chinese college students. Int. J. Inj. Control Saf. Promot. 2024, 31, 487–498. [Google Scholar] [CrossRef]
  43. Ma, W.; Liu, Z.; Li, R. Effect of helmet-wearing regulation on electric-bike riders: A case study of two cities in China. Transp. Saf. Environ. 2024, 6, tdad038. [Google Scholar] [CrossRef]
  44. Jomnonkwao, S.; Watthanaklang, D.; Sangphong, O.; Champahom, T.; Laddawan, N.; Uttra, S.; Ratanavaraha, V. A comparison of motorcycle helmet wearing intention and behavior between urban and rural areas. Sustainability 2020, 12, 8395. [Google Scholar] [CrossRef]
  45. Guzman, L.A.; Ortiz, A.I.V.; Mesa, V.G.; Camargo, J.P.; Allen, K.A.; Hyder, A.A. The relationships between correct helmet use, enforcement presence, and mortality in a Latin-America city: The case study of Bogotá, Colombia. Traffic Inj. Prev. 2020, 21, 500–505. [Google Scholar] [CrossRef] [PubMed]
  46. Satiennam, T.; Kumphong, J.; Satiennam, W.; Klungboonkrong, P.; Jaensirisak, S.; Ratanavaraha, V. Change in helmet use behavior enforced by CCTV cameras with automatic helmet use detection system on an urban arterial road. Traffic Inj. Prev. 2020, 21, 494–499. [Google Scholar] [CrossRef]
  47. Ruan, Y.; Hang, C.-C.; Wang, Y.; Ma, R. The role of government in an emerging disruptive innovation: The case of E-bikes in China. In Disruptive Innovation in Chinese and Indian Businesses; Routledge: London, UK, 2013; pp. 50–67. [Google Scholar]
  48. Thompson, J.H.; Wijnands, J.S.; Mavoa, S.; Scully, K.; Stevenson, M.R. Evidence for the ‘safety in density’effect for cyclists: Validation of agent-based modelling results. Inj. Prev. 2019, 25, 379–385. [Google Scholar] [CrossRef] [PubMed]
  49. Son, S.H.; Oh, S.H.; Kang, S.H.; Kim, D.-K.; Seo, K.M.; Lee, S.-U.; Lee, S.Y. Independent factors associated with bicycle helmet use in a Korean population: A cross-sectional study. Traffic Inj. Prev. 2018, 19, 399–403. [Google Scholar] [CrossRef] [PubMed]
  50. Rothenberg, H.; Goodman, D.; Sundstrom, C. Separated Bike Lane Crash Analysis. 2016. Available online: https://trid.trb.org/View/1393609 (accessed on 9 February 2025).
  51. Cicchino, J.B.; McCarthy, M.L.; Newgard, C.D.; Wall, S.P.; DiMaggio, C.J.; Kulie, P.E.; Arnold, B.N.; Zuby, D.S. Not all protected bike lanes are the same: Infrastructure and risk of cyclist collisions and falls leading to emergency department visits in three US cities. Accid. Anal. Prev. 2020, 141, 105490. [Google Scholar] [CrossRef]
  52. Ziakopoulos, A.; Nikolaou, D.; Yannis, G. Correlations of multiple rider behaviors with self-reported attitudes, perspectives on traffic rule strictness and social desirability. Transp. Res. Part F Traffic Psychol. Behav. 2021, 80, 313–327. [Google Scholar] [CrossRef]
  53. Bhatti, J.A.; Ejaz, K.; Razzak, J.A.; Tunio, I.A.; Sodhar, I. Influence of an enforcement campaign on seat-belt and helmet wearing, Karachi-Hala highway, Pakistan. Ann. Adv. Automot. Med. 2011, 55, 65–70. [Google Scholar]
  54. Mensah, E.; Ketemepi, G.; Bosompem-Acheampong, K.; Alhassan, M. Factors associated with helmet use among motorcyclists presenting with maxillofacial injuries to a tertiary hospital in Ghana. Ghana Dent. J. 2023, 20, 14–16. [Google Scholar]
  55. Qian, Y.; Sun, Q.; Fei, G.; Li, X.; Stallones, L.; Xiang, H.; Zhang, X. Riding behavior and electric bike traffic crashes: A Chinese case-control study. Traffic Inj. Prev. 2020, 21, 24–28. [Google Scholar] [CrossRef]
  56. Teoh, E.R.; Campbell, M. Role of motorcycle type in fatal motorcycle crashes. J. Saf. Res. 2010, 41, 507–512. [Google Scholar] [CrossRef]
  57. Ma, C.; Yang, D.; Zhou, J.; Feng, Z.; Yuan, Q. Risk riding behaviors of urban e-bikes: A literature review. Int. J. Environ. Res. Public Health 2019, 16, 2308. [Google Scholar] [CrossRef] [PubMed]
Figure 1. Distribution of observation sites.
Systems 13 00171 g001
Figure 2. Views observed by surveillance video: (a) intersection, (b) section of road/avenue.
Systems 13 00171 g002
Figure 3. Statistics on the number and proportion of riders riding without helmets.
Systems 13 00171 g003
Figure 4. Correlation heatmap.
Systems 13 00171 g004
Table 1. Observation site characteristics.
NameMark in the FigureTypeAreaSeparate Non-Motor Vehicle Lane
Jiangfu Road-Bincheng Avenue intersectiontriangle-1intersectionsuburbnothing
Jianping Road-Qishan Avenue intersectiontriangle-2intersectionsuburbyes
Wusi Road-Hualin Road intersectiontriangle-3intersectionurbanyes
Guping road-Hudong Road intersectiontriangle-4intersectionurbannothing
Bincheng Avenue sectioncircle-1road sectionsuburbnothing
Qishan Avenue sectioncircle-2road sectionsuburbyes
Wusi Road sectioncircle-3road sectionurbanyes
Guping road sectioncircle-4road sectionurbannothing
Table 2. Result variables, explained variables and their codes.
Result VariableExplained VariableData TypeClassificationCode
Helmet useAreaCategoryUrban, Suburban1, 0
TimeCategoryMorning Peak hours, Off Peak hours, Evening Peak hours0, 1, 2
Level of service (LOS)Sequence1, 2, 3, 4 Levels1, 2, 3, 4
WeatherCategoryRainy, Sunny1, 0
Existence of controller
(abbreviated as EC)
CategoryYes, No1, 0
Average daily temperature
(abbreviated as ADT)
Category≥20 °C, <20 °C1, 0
Whether the rider is a food delivery worker (abbreviated as FD)CategoryYes, No1, 0
Separate non-vehicle lane (abbreviated as SNL)CategoryYes, No1, 0
GenderCategoryMale, Female1, 0
AgeCategory≥35 Years old, <35 Years old1, 0
Vehicle typeCategoryElectric Moped, Electric Bicycle1, 0
Table 3. Results of multicollinearity diagnostics for the independent variables.
VariableVIF1/VIF
Los1.670.60
ADT1.670.60
SNL1.120.89
Age1.120.89
Vehicle type1.110.90
Weather1.080.92
EC1.080.93
Time1.060.94
Gender1.060.95
FD1.040.96
Mean VIF: 1.20.
Table 4. Results of main effect analysis.
Explained VariableOdds RatioPossibility of Helmet UseStandard ErrorzP > |z|95% Confidence Interval
Lower LimitUpper Limit
LOS1Baseline
22.798179.8%2.6301.0900.2740.44317.658
30.398−60.2%0.360−1.0200.3090.0672.349
40.115−88.5%0.171−1.4500.1460.0062.126
AreaSuburbBaseline
Urban0.007−99.3%0.002−14.4600.0000.0030.013
WeatherSunnyBaseline
Rainy0.062−93.8%0.026−6.5700.0000.0270.142
ADTBelow 20 °CBaseline
Above 20 °C0.000−100.0%0.000−6.6300.0000.0000.001
ECNoBaseline
Yes4.460346.0%2.8982.3000.0211.24815.940
FDNoBaseline
Yes3.466246.6%3.6451.1800.2370.44127.229
SNLNoBaseline
Yes0.204−79.6%0.141−2.2900.0220.0520.794
TimeMorning peak hoursBaseline
Off peak hours0.036−96.4%0.060−1.9800.0470.0010.962
Evening peak hours0.025−97.5%0.030−3.1100.0020.0020.258
GenderFemaleBaseline
Male1.31631.6%0.3261.1100.2690.8092.139
Age≤35 years old1 baseline
>35 years old2.922192.2%0.7514.1700.0001.7664.837
Vehicle typeElectric bicycleBaseline
Electric moped0.326−67.4%0.097−3.7600.0000.1820.585
Table 5. Result of the interaction analysis.
Explained VariableOddsPossibility of Using HelmetStandard ErrorzP > |z|95% Confidence Interval
Lower LimitUpper Limit
Area*WeatherArea = Suburb * Weather = SunnyBaseline
Area = Urban * Weather = Rainy14.2271322.7%4.4198.5500.0007.74026.151
Area*FDArea = Suburb * FD = NoBaseline
Area = Urban * FD = Yes0.032−96.8%0.039−2.7900.0050.0030.360
Area*GenderArea = Suburb * Gender = FemaleBaseline
Area = Urban * Gender = Male1.48348.3%0.2692.1700.0301.0402.117
Weather*ECWeather = Sunny * EC = NoBaseline
Weather = Rainy * EC = Yes0.608−39.2%0.072−4.1900.0000.4820.767
Weather*ADTWeather = Sunny * ADT = <20 °CBaseline
Weather = Rainy * ADT = ≥20 °C0.001−99.9%0.001−5.3500.0000.0000.010
Weather*FDWeather = Sunny * FD = NoBaseline
Weather = Rainy * FD = Yes3.957295.7%1.4243.8200.0001.9548.012
Weather*SNLWeather = Sunny * SNL = NoBaseline
Weather = Rainy * SNL = Yes1.40540.5%0.1473.2600.0011.1451.725
Weather*GenderWeather = Sunny * Gender = FemaleBaseline
Weather = Rainy * Gender = Male1.35635.6%0.1213.4000.0011.1381.615
Weather*Vehicle typeWeather = Sunny * Vehicle type = Electric bicycleBaseline
Weather = Rainy * Vehicle type = Electric moped1.35535.5%0.1353.0600.0021.1151.646
ADT*ECADT = <20 °C * EC = NoBaseline
ADT = ≥20 °C * EC = Yes0.002−99.8%0.002−7.4900.0000.0000.010
ADT*FDADT = <20 °C * FD = NoBaseline
ADT = ≥20 °C * FD = Yes0.179−82.1%0.139−2.2200.0270.0390.819
ADT*AgeADT = <20 °C * Age = ≥35 Years oldBaseline
ADT = ≥20 °C * Age = <35 Years old1.74674.6%0.3422.8500.0041.1892.564
ADT*Vehicle typeADT = <20 °C * Vehicle type = Electric bicycleBaseline
ADT = ≥20 °C * Vehicle type = Electric moped2.843184.3%0.7653.8800.0001.6774.819
EC*FDEC = No * FD = NoBaseline
EC = Yes * FD = Yes3.468246.8%1.5662.7500.0061.4318.404
EC*SNLEC = No * SNL = NoBaseline
EC = Yes * SNL = Yes0.399−60.1%0.051−7.1600.0000.3100.513
EC*GenderEC = No * Gender = FemaleBaseline
EC = Yes * Gender = Male1.71171.1%0.1765.2300.0001.3992.093
EC*AgeEC = No * Age = ≥35 Years oldBaseline
EC = Yes * Age = <35 Years old0.738−26.2%0.088−2.5500.0110.5840.932
FD*AgeFD = No * Age = ≥35 Years oldBaseline
FD = Yes * Age = <35 Years old0.374−62.6%0.131−2.8100.0050.1890.742
SNL*AgeSNL = No * Age = ≥35 Years oldBaseline
SNL = Yes * Age = <35 Years old0.764−23.6%0.082−2.5200.0120.6200.942
Gender*AgeGender = Female * Age = ≥35 Years oldBaseline
Gender = Male * Age = <35 Years old1.24224.2%0.1112.4300.0151.0431.479
Disclaimer/Publisher’s Note: The statements, opinions and data contained in all publications are solely those of the individual author(s) and contributor(s) and not of MDPI and/or the editor(s). MDPI and/or the editor(s) disclaim responsibility for any injury to people or property resulting from any ideas, methods, instructions or products referred to in the content.

