Abstract
In the contemporary and dynamic business landscape, the establishment of a loyal customer base is a fundamental imperative for long-term organizational viability. This research undertakes a comprehensive exploration into the formation of customer loyalty within the niche of pet-related vertical e-commerce, focusing on South Korea, and leverages advanced machine learning methodologies. We identify key factors that significantly impact customer loyalty development using various machine learning models, including logistic regression analysis, decision trees, support vector machines, random forests, and XGBoost. Our empirical study shows that encouraging customer transactions plays a crucial and transformative role in building loyalty regardless of the day of the week. Furthermore, the strategic promotion of mobile application notifications and the active encouragement of customer participation through product reviews are indispensable strategies for strengthening and solidifying customer loyalty. These findings have crucial implications not only for enterprises within the pet-related e-commerce sector but also for the broader e-commerce domain. We hereby propose a methodology to identify loyal customers and systematically analyze the key factors that influence their formation using machine learning in the vertical e-commerce pet industry.
1. Introduction
Contemporary society is experiencing a period of rapid digital innovation, which has precipitated the advent of the fourth industrial revolution. Prominent components of this revolution include artificial intelligence (AI), the Internet of Things, and big data. Among these, big data possesses distinct characteristics known as the 3Vs: Volume (referring to the vast amount of data generated), Velocity (highlighting the high rate of data growth), and Variety (indicating the diverse nature of the data). This involves generating large amounts of data in various formats at an unprecedented pace compared to previous times [1,2]. The concept of big data analysis has gradually evolved from previously mentioned 3Vs (Volume, Velocity, Variety) to the 5Vs (+Veracity, +Variability), subsequently to the 10Vs (+Value, +Validity, +Venue, +Vocabulary, +Vagueness), and has now evolved to the 14Vs (Volume, Velocity, Venue, Value, Variety, Veracity, Variability, Volatility, Validity, Verbality, Verbosity, Versatility, Viscosity, Visibility). This expansion is the result of an increased need to maximize the reliability, meaning, and usability of data, beyond simply storing and processing data [3,4,5], while early big data analytics focused on how quickly (speed), how much (volume), and how diverse (variety) data could be stored, today’s discussions are centered on higher-level factors, such as data veracity, value, and volatility. In particular, the advancement of AI and data analysis technologies is changing the environment to one where the interpretability and practical use of data are becoming more important. Accordingly, the expansion of the concept of big data is moving beyond simple data accumulation to reflect the increasing complexity of data, strengthen context and interpretability, and focus on improving data quality for business and practical application.
To illustrate this, the popularity and relevance of television broadcasting content were mainly expressed through viewership ratings in the past. However, with the recent advancements in technology and the advent of the digital age, how popularity and relevance of broadcasting content are conveyed have become considerably more diverse. Moreover, although traditional viewership ratings still play as a crucial role, indirect metrics about the video itself, such as the number of views and streams on platforms like YouTube and OTT (Over-The-Top) services, have become more abundant and varied than in the past. Furthermore, indirect data, including the number of online comments, social network content-searches, and related hashtags, are crucial indicators of broadcasting content popularity [6,7,8]. The success and failure of a business depends on its capacity to analyze and leverage such big data for marketing purposes. Consequently, it is essential for companies to thoroughly comprehend their data and employ it in a manner best suited to their needs.
Understanding the customer’s perspective and tailoring products and services to meet their preferences is a fundamental aspect of business and marketing. When customers encounter experiences that align with their tastes, they have positive buying experiences. These positive purchasing experiences lead to customer satisfaction and encourage repeat purchases. Through this cycle, loyal customers are cultivated and may potentially encourage others to become loyal customers as well [9,10,11]. In the digital age, customer experience has always been an important part of business; however, it is even more crucial in this era. In the past, positive or negative customer experiences were often shared only with friends and family. However, contemporary individuals actively share their experiences not only with those around them but also with an unspecified number of people online. Consequently, the impact and effect of these experiences extend not only to the direct social acquaintances but also to numerous anonymous individuals who do not know each other [12,13,14]. Apple is a representative example of a brand boasting an extensive base of loyal customers. The enthusiasm and dedication shown by loyal customers increase the desire to purchase the brand’s products and foster positive purchasing experiences, which are shared among potential consumers. Ultimately, these loyal customers highly contribute to increased sales, profits, and their market share [15].
In recent decades, companion animals have been globally recognized as precious family members rather than mere animals. Despite the economic difficulties caused by the COVID-19 pandemic, the global pet industry continued to grow steadily. In 2020, the market reached a size of USD 142.1 billion, recording a growth rate of 6.9%, indicating that consumer demand for pets has continued to expand, while the growth of developed countries that previously led the pet market has slowed down, with emerging markets such as China and Brazil showing strong growth potential. South Korea’s pet market is also showing rapid growth. As of 2020, 27.7% of Korean households are raising pets, and according to the Korea Rural Economic Institute, the domestic pet industry is recording an average annual growth rate of 14.5%. The size of the domestic pet market in South Korea increased from KRW 1.9 trillion (approximately USD 16 billion) in 2015 to KRW 4.58 trillion (approximately USD 36 billion) in 2023, and is expected to grow to 6 trillion won (approximately USD 47 billion) by 2027. In 2015, South Korea’s nominal GDP was about 1559 trillion won (equivalent to around USD 1378 billion), and the pet market accounted for about 0.12% of the total GDP at the time. In 2023, the nominal GDP is estimated to be about KRW 2543 trillion (equivalent to around USD 2171 billion), and the size of the pet market has expanded to about 0.18% of the total GDP. In 2027, the size of the pet market in South Korea is expected to account for about 0.20% of South Korea’s GDP. This trend shows that the pet industry is growing continuously and its share in the overall economy is gradually expanding [16,17]. Therefore, the companion animal-related industry is becoming more promising and a rising market than in the past [18,19]. Consequently, vertical e-commerce, a term denoting the concentrated sale of products within a specific category rather than a diverse range of products, has become increasingly prevalent [20]. This study proposes utilizing machine learning algorithms on customer data, specifically focusing on repurchase history, to identify the factors that influence the cultivation of loyal customers within the vertical e-commerce sector of the pet-related industry. The contributions of this paper can be summarized as follows: First, this paper is the first that sets out to identify the factors influencing the formation of loyal customers in the B2C vertical e-commerce sector of the pet-related industry. Existing studies and empirical analyses have not sufficiently identified the factors contributing to the formation of loyal customers in the vertical e-commerce area for companion animal-related industries. Although research related to vertical e-commerce exists, such as the study conducted in a B2B context [20], it does not directly handle the pet-related industrial domain. Second, this study utilizes various machine learning algorithms without direct involvement from domain experts or marketing specialists. Therefore, we aim to deeply analyze and explore crucial factors and insights for cultivating loyal customers, which specific domain experts might overlook. Finally, this study aims to discover factors and implications that companies in the companion animal industry can effectively employ by using and analyzing actual data of a vertical e-commerce company in the South Korean domestic companion animal industrial sector.
Our study builds on the extensive literature on customer loyalty by introducing recent machine learning algorithms that go beyond traditional statistical approaches or early machine learning models. Previous studies have utilized linear regression, logistic regression or early machine learning models [21,22,23]. On the other hand, our study facilitates more advanced machine learning models, such as support vector machines [24], random forests [25], and XGBoost [26], which can reflect non-linear interactions between variables, allowing for a nuanced understanding of loyalty drivers through feature importance extraction. By leveraging multiple extracted key features, it is possible to develop more refined and practical strategic plans or promotions. Furthermore, our study targets a niche, pet-related e-commerce sector, providing novel insights into how loyalty manifests in vertical-specific markets, which previous studies have not addressed. This study makes an academic contribution through the creation of a machine learning model for predicting customer loyalty in the field of e-commerce for pet supplies, a concept that has not been previously explored in extant studies. The model quantitatively analyzes repeat purchase patterns to identify the main factors in forming loyal customers. In particular, this study is one of the first studies to systematically analyze the key factors that affect customer loyalty in the specific market of pet supplies using machine learning techniques. By doing so, it aims to present a predictive model and provide practical insights. Unlike previous studies that focused on analyzing general e-commerce customer behavior or industries other than pet supplies, this study precisely analyzed the factors that shape customer loyalty in the pet supplies’ market in a special environment called vertical e-commerce [27,28]. In addition, even though existing studies are relevant to customer loyalty prediction, they often do not focus on e-commerce nor handle mobile application notifications and delivery related issues, which are important features for e-commerce. However, this study broadens the scope by incorporating these elements for customer loyalty prediction modeling, offering a more comprehensive approach tailored to the e-commerce environment. The findings of this study can be utilized to formulate effective customer retention strategies within the pet supplies’ market. Additionally, this study provides empirical evidence on the application of machine learning-based data analysis to the marketing and customer management strategies of vertical e-commerce companies operating within the pet supplies sector.
2. Research Background
2.1. Loyal Customers
Retention and repurchase of services by existing customers are as crucial to a business as attracting new customers. Businesses cannot thrive solely by acquiring new customers while neglecting the retention of their existing customer base. Identifying the factors that initially provided a satisfactory experience to new customers and continue to cater to their needs is imperative to promote repeat visits and repurchases. Rather than focusing solely on attracting new customers, successful companies and platforms share a common characteristic: a high level of customer loyalty. Customer orientation significantly influences customer loyalty, as loyal customers tend to repurchase products and recommend the brand to their acquaintances or other potential customers [29].
The consumer decision journey serves as a framework for understanding the processes and steps through which customers make purchasing decisions, as well as their subsequent experiences and behaviors [30,31]. Figure 1 visually represents this journey, illustrating the process that customers follow when purchasing a product or engaging with a service and the path to repeat purchases through the loyalty loop. Although specific processes or stages may differ based on detailed factors, like the industry sector, product category, market conditions, and customer preferences, there are generally significant similarities that are widely observed. Building customer loyalty requires a mechanism that allows customers to progress through the stages described in Figure 1, encompassing the purchase, experience, and advocacy stages, as well as the advocacy stage, and ultimately returning through the loyalty loop.
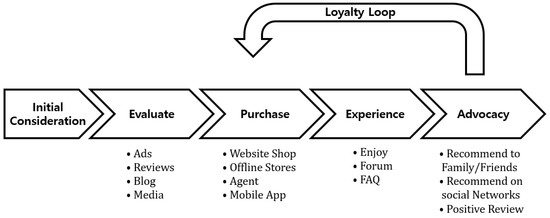
Figure 1.
The process of the consumer decision journey.
During the transition from an initial growth phase to a maturity phase, businesses often experience higher churn rates among existing customers compared to new customer acquisitions. In this phase, even with an influx of new customers, a business cannot thrive if more existing customers churn. Existing customers who continue to revisit, repurchase, and reuse services play a vital role in driving business growth once a certain level has been reached. Although marketing efforts to attract new customers are imperative, it is even more crucial to focus on creating loyal customers who will return. Marketing strategies and promotions centered solely on acquiring new customers may increase customer numbers, but they can result in stagnation if the rate of customer outflow matches that of new customer inflow. In general, loyal customers not only share and recommend their good experiences to others but also demonstrate their loyalty through repeated purchases, and it is essential to understand the causes of their repeated purchases. Positive relationships and long-term customer loyalty can be formed by identifying these causes and offering them to other new customers. Therefore, this study employs machine learning techniques to uncover the factors influencing the formation of loyal customers in the B2C companion animal-related industry.
In relation to the consumer decision journey, Lin et al. analyzed the factors that affect consumers’ repurchase intention and positive eWoM (electronic word-of-mouth) communication in online group buying, focusing on the psychological and behavioral factors of the consumer decision-making process [32]. The difference between our study and the previous study is that we define loyal customers based on the number of repurchases and use machine learning techniques to identify the main factors that influence the formation of loyal customers. Our approach is based on a data-driven approach derived from actual consumer behavior and information, rather than the perceptual factors that were mainly covered in Lin et al.’s study. Through this, we aim to quantitatively identify the characteristics that affect the formation of loyal customers. Sjoraida et al. emphasize that the construction of a meaning-based educational consumer journey plays an important role in modern marketing and can contribute to the strengthening of the relationship between brands and consumers. In particular, it suggests that the collaboration between academia, marketing practitioners, and IT developers can develop consumer experiences in a more immersive and meaningful way. In this study, we define loyal customers based on the number of repurchases and use machine learning to identify the main factors that influence the formation of loyal customers. These main factors are expected to provide important implications for collaborative approaches and meaning-focused educational consumer journeys. In other words, we aim to more quantitatively analyze the factors that can contribute to the formation of meaning in consumer experiences and the establishment of a continuous and loyal company–consumer relationships [33].
The RFM model, which stands for Recency, Frequency, and Monetary value, is a widely recognized criterion for assessing loyal customers [34,35,36]. The RFM model evaluates the recency of a customer’s last purchase, the frequency of purchases within a specific period, and the monetary value of purchases over time. This model finds application in various domains and is commonly used for customer segmentation. Figure 2 provides an example of customer segmentation visualized through the RFM model, representing a three-dimensional segmentation approach. The model can be adapted to incorporate additional dimensions or further divided into smaller segments depending on the marketer’s requirements. Zalaghi and Varzi proposed an extended RFM model for measuring customer loyalty [37]. The RFM model enables timely offers to be made to customers with similar purchasing patterns, allowing for more personalized and tailored promotions. Customers exhibiting different consumption patterns, such as those who frequently visit but have lower initial purchase amounts or those who visit intermittently but have higher initial purchase amounts, can benefit from customized promotions.
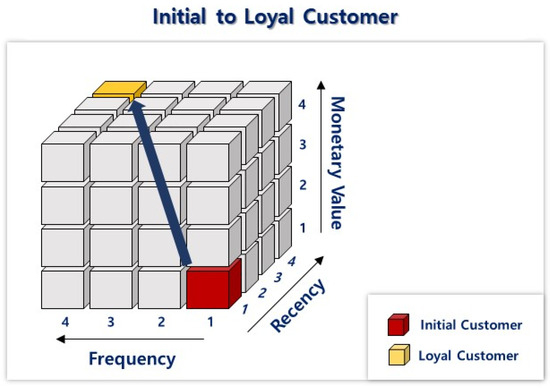
Figure 2.
Visual example of the RFM model.
In addition to the RFM model, the CLV (Customer Lifetime Value) model and NPS (Net Promoter Score) are two other models frequently used to evaluate customer loyalty [38,39]. The CLV model predicts the total revenue that an individual customer is expected to generate over the lifetime of their relationship with a company. It is useful for assessing loyalty from a long-term perspective because it reflects not only the customer’s current value but also the possibility of future purchases. The NPS model, on the other hand, is a method of scoring whether a customer is willing to recommend a brand or a company to others. The NPS model has strengths in measuring a customer’s subjective brand attachment and willingness to recommend it. However, the CLV model is limited in its ability to predict new customers, and the NPS tends to reflect preferences rather than actual purchases. In contrast, the RFM model we selected has the advantage of being simple in structure, but it quantitatively measures the activity and preference values of customers. Additionally, it allows for practical analysis based on purchasing behavior rather than just preferences.
In this study, the classification of existing customers was performed based on the RFM model, which served as a robust framework for segmenting and assessing customer loyalty. The identification of customers who exhibited a notable level of loyalty was made possible through utilizing this segmentation approach. Specifically, our analysis focused on the frequency of purchases made by customers who engaged in more than four transactions subsequent to their initial enrollment, ultimately classifying them as highly loyal customers. Additionally, within the subset of customers who made a third purchase, further classification was performed based on whether or not they proceeded to make a fourth purchase. Those who continued their purchasing behavior were classified as loyal customers, while those who did not were categorized as non-loyal customers. A more comprehensive understanding of customer loyalty was achieved by implementing this classification process, enabling the identification of distinct behavioral patterns and purchasing tendencies within various customer segments.
2.2. Machine Learning in Marketing
The provision of products and services that align with customer expectations and preferences, coupled with a comprehensive understanding of customer behavior and feedback, is key to creating a positive customer experience. In the realm of marketing, valuable insights can be gleaned from the collection and analysis of various customer behaviors, feedback, and reactions, all of which can be captured as data. Traditionally, marketing experts and consumer analysts relied on manual data analysis techniques for classifying customers and predicting future consumer behavior based on the collected data. However, a recent trend has emerged within both academic and practical spheres, emphasizing the integration of AI and machine learning to augment customer classification, customer behavior prediction, and market fluctuation forecasting [40,41,42]. This approach not only enables the identification of crucial factors that may have been overlooked by domain experts but also complements the expertise and insights of human analysts. Prominent global companies and platforms, including YouTube, Netflix, Amazon, Inrix, Opower, Zillow, Diabetes UK, and Viacom have successfully leveraged AI and machine learning algorithms to enhance customer experiences by tailoring personalized recommendations to individual users. These recommendations are generated based on factors, such as customer interests, purchase history, viewing history, and search history, resulting in improved business outcomes.
One of the notable advantages of employing machine learning and AI in marketing is the ability to provide personalized experiences for each customer. Marketers can offer products and services that are relevant and intriguing to individual customers by analyzing demographic information, including gender, age, location, purchase patterns, and customer behavior data. For instance, video-based platforms like YouTube and Netflix utilize machine learning algorithms to automatically suggest videos based on users’ viewing and search history. Similarly, e-commerce platforms such as Amazon utilize the user’s purchase history, search history, and click logs to recommend items that align with the user’s preferences. Inrix analyzes traffic data from mobile phones and other sources with the objective of providing user-customized travel information regarding real-time traffic conditions, parking, and roadway safety. Opower works with power and gas companies to analyze energy usage data from homes and businesses and provide customized energy-saving solutions. Zillow also analyzes real estate market data to recommend the best properties to customers, while Diabetes UK provides personalized medical support based on health data and food shopping history. Viacom, which owns popular brands, such as Comedy Central, Nickelodeon, and MTV, has built a real-time big data analytics platform using Apache Spark and Databricks. This technological advancement enables the company to assess the quality of video feeds and allocate resources in real time [43]. These recommendation systems fall within the purview of AI and machine learning and represent a highly active area of research. Although personalized recommendations can conceivably be generated by human experts, the manual examination of hundreds of thousands of user data points becomes prohibitively inefficient in terms of time and financial resources. The generation of personalized recommendations can be automated by incorporating machine learning into marketing practices, maximizing efficiency and cost-effectiveness.
AI and machine learning techniques are also extensively employed in predicting product demand. Accurate demand forecasting enables suppliers to prepare in advance and empowers companies and platforms to allocate marketing resources effectively [42,44,45]. In addition, recent studies have focused on using big data and machine learning to analyze consumer behavior and establish more sophisticated marketing strategies based on this. For example, Singh and Yousuf applied machine learning algorithms such as gradient boosting machines (GBMs) and random forests to predict consumer purchasing patterns and optimize customized marketing strategies [46]. In addition, Putra emphasized that AI and machine learning play an important role in analyzing consumer behavior and maximizing campaign performance [47]. In particular, the research suggested that personalized marketing is possible through the precise use of customer data through AI-based analysis, which can help build long-term relationships with consumers more effectively. Furthermore, the development of chatbots utilizing machine learning algorithms has been hailed as an innovative breakthrough in the marketing sector. For instance, the provision of round-the-clock customer service through chatbots significantly enhances customer convenience. Additionally, deploying chatbots has proven to be a more efficient use of time and financial resources for straightforward and repetitive chat interactions since it obviates the need for human counselors.
In short, marketing with machine learning and AI offers compelling advantages by facilitating personalized customer experiences, automating personalized recommendations, enabling demand prediction, and introducing innovative customer service solutions. The integration of these technologies empowers businesses to optimize their marketing strategies and enhance customer satisfaction, thereby fostering success in the dynamic marketplace.
3. Methodology
3.1. Study Design for Customer Loyalty Prediction
The present study employs a six-step methodology (illustrated in Figure 3) to analyze and comprehend the factors that determine customer loyalty in the context of pet-related vertical e-commerce. The first step is data collection, which involves obtaining transaction data from pet e-commerce platforms. This includes purchase history, the frequency of repeat purchases, and consumption patterns by product category, thereby enabling a quantitative analysis of customer shopping behavior. The collected data were stored in an anonymized form in compliance with the personal information protection regulations. Subsequently, an exploratory data analysis was conducted to ascertain the overall distribution and structure of the data, in addition to reviewing missing values and outliers. In the third step, rigorous data cleansing and feature engineering were performed. Several ratio feature variables, such as the purchase ratio by category, were added to more precisely analyze customers’ purchasing behavior. Next, in the step of selecting machine learning algorithms, various models that can effectively handle non-linear relationships in large datasets were used. The selected algorithms are described in the subsections that follow. Model tuning and validation were performed to maximize the performance of the selected models. Cross-validation was employed to prevent overfitting and enhance generalization performance, and hyperparameter tuning was also conducted. In the final step of the research, the model was evaluated and key features were analyzed. The performance of the model was evaluated using various indicators, including accuracy, precision, recall, and F1-score. Its robustness was verified through five-fold cross-validation. In addition, feature importance analysis was performed to derive key factors that determine customer loyalty. Through this, we identified the factors that have the greatest impact on customer loyalty and discussed how these factors can be applied to the company’s marketing strategy. The objective of this systematic analysis process was to quantitatively identify the key factors that form customer loyalty in the context of pet e-commerce and to derive a marketing strategy that is practically applicable.
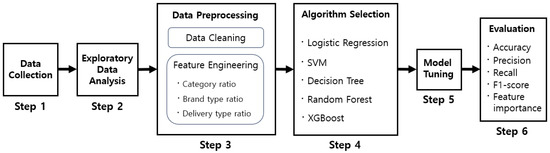
Figure 3.
Flowchart for pet-related vertical e-commerce loyal customer prediction and analysis.
The selection of algorithms was based on machine learning models that were extensively studied and practically verified on existing e-commerce platforms. These models were effectively applied to consumer behavior prediction, customized recommendation systems, and customer retention strategies in the e-commerce environment, and their performance and effectiveness were proven through numerous empirical studies. The present study aimed to systematically identify the factors that form customer loyalty in the vertical e-commerce environment of pet-related businesses—which has not been addressed in previous studies—whilst also reflecting the strengths of existing models [27,28,48,49].
3.2. Machine Learning Algorithms to Explore Factors Affecting Customer Loyalty
3.2.1. Logistic Regression
Logistic regression analysis is a statistical model employed for classification purposes when the dependent variable is categorical in nature. Specifically, it is used when the dependent variable in the dataset takes on values of 0 or 1, respectively, denoting the absence or occurrence of an event. Traditional linear regression models are not well suited for handling such categorical outcomes. In these instances, logistic regression provides a means to estimate the probability of the dependent variable event occurring. The concept of odds comes into play, where odds represent the ratio of the probability of an event occurring to the probability (p) of an event not occurring.
Logits is the log of the odds in the (1) above, and the logistic regression function is expressed as follows:
In the context of this study, a customer’s transition to becoming a loyal customer, defined as making more than four purchases, is considered the occurrence of an event, resulting in a dependent variable value of 1. Conversely, a customer who does not become a loyal customer by failing to make more than four purchases is considered a non-event, resulting in a dependent variable value of 0. In this case, depending on the magnitude of
, it is possible to detect crucial features that significantly affect the formation of loyal customers.
3.2.2. Decision Tree
Decision tree is a machine learning technique that utilizes a tree structure to systematically categorize data for decision-making purposes. In each node of a tree, the data are divided into two groups based on a specific threshold, and this process is repeated to form the final tree. In comparison to other machine learning models, decision trees possess a relatively straightforward structure, offer high interpretability, and do not require rigorous mathematical assumptions due to their non-parametric nature.
The decision tree construction process comprises two distinct steps: tree growth and pruning. Initially, the tree is expanded to its maximum extent. Subsequently, superfluous branches are eliminated to mitigate the risk of overfitting. Tree growth is executed in a manner that minimizes impurity—that is, uncertainty in the data—and maximizes information acquisition. The objective is to enhance the homogeneity of data at each node.
Entropy, or the Gini index, is commonly employed as an impurity measure for classification decision trees. The ID3 and C4.5 algorithms are decision tree algorithms that utilize entropy as the impurity measurement method. The entropy formula used in these algorithms is as follows [50]:
The Gini index can also be used as an impurity measure, and its formula is as follows:
Decision trees have been widely employed in diverse domains of marketing. For instance, ref. [51] utilized C4.5 decision tree models in the context of content marketing, demonstrating the attainability of reasonable and accurate outcomes. Similarly, ref. [52] proposed a method that leverages decision trees as predictive models to ascertain whether customers would subscribe to term deposits, aiding marketing initiatives within a banking environment. Moreover, ref. [53] employed a decision tree model as a marketing decision-making tool for customer behavior classification.
3.2.3. Support Vector Machines
Support vector machines (SVMs) are machine learning algorithms that find the optimal hyperplane to classify data. They are trained in a way that maximizes the margin between classes. Before the advent of deep learning, they were one of the best-performing models. Even today, they still outperform deep learning on certain datasets. SVMs form a decision boundary that most effectively separates each class in the n-dimensional space where data are located. The data point that lies closest to this boundary is designated as the support vector, while the distance between the support vector and the boundary is referred to as the margin. The objective of SVMs is to maximize this margin.
Depending on the approach adopted for handling outliers, SVMs can be classified into two categories: hard-margin SVMs and soft-margin SVMs. Hard-margin SVMs perform perfect classification without allowing outliers; however, they are susceptible to overfitting. Conversely, soft-margin SVM permits a certain degree of error, thereby ensuring more stable performance in real data scenarios and facilitating flexible adjustment through hyperparameters. Consequently, SVMs are trained to maximize margins, resulting in a model that offers robust performance even in data with noise. The choice between hard and soft margins depends on the characteristics of the data and the intended purpose.
In various industrial domains, SVMs are already being utilized to predict customer loyalty and churn. Previous studies have explored the use of SVMs for predicting loyal customers [24] and predicting churn customers [54,55,56].
3.2.4. Random Forest
As several trees gather to form a forest in nature, a random forest is a machine learning model using multiple decision trees. This kind of technique of using multiple models simultaneously is called an ensemble. In a random forest, each decision tree is trained by randomly selecting only some part of the features rather than using all the features. If all decision trees in a random forest use all features or use the same features, they only produce identical decision trees; this is no different from constructing only one decision tree. To prevent this, learning is proceeded by randomly selecting different feature sets for each decision tree. This model is called a random forest because the features selected for each decision tree that makes the forest are random [25].
Since each decision tree outputs one prediction value if the random forest model has N decision trees, a total of N predictions are produced in the random forest. For classification, we follow the rule of majority to select the class with the highest number of predictions from N decision trees. The random forest model has the advantage of being more robust than the decision tree model because it can solve the overfitting problem that can occur in a single decision tree. However, the random forest model is more computationally burdensome than a single decision tree because it requires building multiple decision trees. There is also a disadvantage that it is more difficult to interpret the process of making predictions than in a single decision tree.
3.2.5. XGBoost
Extreme gradient boosting (XGBoost) is an ensemble algorithm that uses multiple decision trees. Random forest is an algorithm that creates multiple datasets from the entire original dataset, generates decision trees from these multiple datasets, respectively, and integrate those results to induce stable performance. Conversely, the gradient boosting algorithm is an algorithm that improves performance by continuously learning in a direction in which the error is reduced; this algorithm proceeds training by adding new learners in the direction of minimizing the error of the previous model. Naive gradient boosting takes a lot of time to train because parallel learning is not supported, but XGBoost supports parallelization, so faster computation is possible [26].
3.3. Dataset Description
In this paper, we analyzed the factors for forming loyal customers using the vertical e-commerce data of the pet-related industry in the Republic of Korea. The data used in this study are customer information and purchase record data collected internally by a South Korean pet-related vertical e-commerce company. The data include the three-month transaction history of customers who completed membership registrations during the period from mid-August 2022 to October 2022, and a total of 86,633 customer data are analyzed. Rather than focusing on each individual item, we analyzed the composition of each purchase by major categories, such as food and toys. This enabled us to identify the overall purchasing patterns and preferences of customers from a more macro-perspective while minimizing the volatility of individual products. Table 1 shows the names of variables related to users used in the analysis and their descriptions. The survival status variable indicates whether the customer made the fourth purchase; that is, whether or not they were loyal customers, and other variables were used as independent variables to predict this target variable.

Table 1.
Each variable’s description of dataset.
In this dataset, the total number of customers is 86,633, of which 4133 are loyal customers. Among the customers who made the third purchase, about 57% of customers made a fourth purchase, and 43% of customers did not make a fourth purchase, showing a balanced ratio. The age of registered pets at the services varies from a minimum of 1 month to a maximum of 274 months, with an average of 44 months and a median of 34 months. Moreover, 42% of all registered customers agreed to receive push notifications from the mobile application, and about 58% of customers refused to receive push notifications. There were 38,334 customers who purchased more than once, 15,237 customers who purchased more than twice, and 7438 customers who purchased more than three times. Regarding the customer ratio in the following section, only customers with a purchase record were considered. Among customers with at least one purchase record, the date of their first purchase after signing up was the day they signed up, which was the largest portion at 58.6%. Moreover, although first and second purchases tended to be made closer to the date of membership registration, third purchases tend to be evenly distributed from 7 to 30 days after membership registration. Additionally, 91% of customers have had an experience of purchasing major brands, and only 9% have never purchased major brands. Conversely, 64% of customers have purchased private brand items, but 36% have not purchased private brand products, which shows a clear difference from the case of major brands. The proportion of customers who have purchased snacks and meals is 47%, while the proportion of customers who have purchased necessities and toys is 64% and 74%, respectively. About 38% of customers make purchases on weekends, and about 80% of customers make purchases during the week. We excluded customer data with many missing values through preprocessing and used a total of 34,522 data for learning and validation. We used 27,617 users (80% of the total users) as training data for machine learning, and 6905 users (20% of the total users) were used as test data to evaluate model performance.
3.4. Data Preprocessing
During the data preprocessing phase, we conducted a rigorous data cleaning step and feature engineering step. In the data cleaning step, we refined customer purchase transaction data collected from the pet e-commerce company into a suitable form for our research, including handling null values. This includes extracting the discount amounts or price from a wide range of coupon types. It allows for each coupon to be represented by its corresponding monetary value in a segmented manner. In the feature engineering phase, we leverage insights gained from exploratory data analysis to transform various simple count data into more meaningful ratio data. Regarding null value handling, if the n-th purchase record is a null value, this means that the n-th purchase was not actually performed, so all related null values are replaced with 0. If the number of weekend purchases or weekday purchases is null, this means that no purchases were made during that period; thus, the null values are replaced with 0. A direct count of the type of item that a customer purchases or a direct count of the type of a brand can be useful features as characteristics of loyal customers. However, if the number of purchases by a particular customer is not large enough, this cannot be a valid feature. Therefore, checking the relative ratio between types of items and types of brands enables consistent analysis even though the number of purchases by a specific customer is small, and we borrow this method. We created ratio features for four factors: purchase category, brand, delivery, and weekday purchase status.
First, since the percentage of categories purchased by customers can be more important than using the actual count of purchased food, snack, toy, and necessity categories, we created new rate features for these categories. This indicator will help in identifying the distribution of item categories in the form of purchases by loyal customers. Therefore, promotions targeting potential loyal customers with this distribution of purchasing categories will be effective. We defined the overall item count as overall item count = (purchased food count + purchased snack count + purchased toy count + purchased necessity count), and we defined a new feature, rate of purchased food, as purchased food count/overall item count. Similarly, rate of purchased snack, rate of purchased toy, and rate of purchased necessity were defined as purchased snack count/overall item count, purchased toy count/overall item count, and purchased necessity count/overall item count, respectively.
Second, the number of purchases of private and major brands can also generate a new feature because their relative ratio can be considered; this indicator will help in identifying the type of brand that loyal customers prefer. Private brand product purchase count and major brand product purchase count are combined to define the overall brand purchase count, and rate of private brand product purchase can be defined as the private brand product purchase count/overall brand purchase count. Similarly, the rate of major brand product is defined as the major brand product purchase count/overall brand purchase count.
Third, this proportional form feature generation was also applied to the delivery type data; this indicator may reflect which delivery type affects the formation of loyal customers. The overall delivery count, overall delivery count, is defined as the Same-day delivery count + overnight delivery count + courier delivery count. Rate of same-day delivery, rate of overnight delivery, and rate of courier delivery are defined as same-day delivery count/overall delivery count, overnight delivery count/overall delivery count and courier delivery count/overall delivery count, respectively.
Fourth, we calculated the percentage of whether or not a purchase was made during the week. Custom promotional offers will be available by determining whether loyal customers often buy during the week or on weekends. After passing all the above steps, the description of the preprocessed data used for actual machine learning modeling is listed in Table A1 in Appendix A.
3.5. Computing Resources
We used NVIDIA Titan XP GPU, Intel Xeon E5-2650 v4 CPU, and 128 GB of RAM for experiments. The analysis was conducted using Python 3.7. Scikit-learn 0.23.0 was used for decision trees, random forests, and SVM modeling, and the Python package XGBoost 1.7.6 was used for XGBoost modeling.
4. Results and Discussion
All machine learning algorithms, including XGBoost, outperform the baseline dummy classifier on various metrics, such as accuracy, precision, recall, and F1-score. Table 2 shows these results. The accuracy shows a high value of 0.800, even in the baseline model, because the portion of loyal customers is relatively small, about 4.8% of the entire data. Since the data are skewed, not only accuracy but also precision, recall, and F1-score should be considered for reliable analysis. Although the baseline model shows relatively high accuracy, machine learning algorithms can yield higher accuracy, and the best-performing model shows an accuracy of 0.912 with XGBoost. In the case of precision, machine learning models show much higher precision values than baseline models. Also, for recall, machine learning models perform better than the baseline except for the SVM. The SVM showed a significantly slower learning speed and showed worse performance indicator values than decision tree, random forest, and XGBoost; this suggests that the dimensions of the data are too high as there are many categorical variables in the data, and the SVM cannot be properly trained. Decision tree, random forest, and XGBoost, which are tree-based algorithms, outperform the baseline in all metrics, and XGBoost shows the best performance with an F1-score of 0.576. Table 3 shows the test data confusion matrix of the best-performing XGBoost model.
Table 2.
Prediction metrics of logistic regression and machine learning models.
Table 3.
Confusion matrix of XGBoost.
The top-seven feature importance for XGBoost algorithms is shown in Table 4. The feature rate of orders during weekends was ranked as the most important feature. This feature indicates the percentage of weekend purchase records among the customer’s total purchase records. Figure 4a illustrates the difference in the distribution of the relevant features between loyal and non-loyal customers. Approximately 64% of non-loyal customers have no record of purchasing on the weekend, and only 36% of non-loyal customers have experience of purchasing on the weekend. However, 44% of loyal customers have no weekend purchase records, and 56% have weekend purchase records. In addition, about 21% of non-loyal customers make purchases only on weekends, while only 2% of loyal customers make purchases only on weekends. In other words, 85% of non-loyal customers made purchases only on weekends or during the weekdays. Conversely, 46% of loyal customers made purchases only on weekends or only on weekdays; this implies that loyal customers do online pet shopping less sensitively, whether it is a weekend or weekday. Therefore, for customers who only have purchase records on weekends, discounts or other promotions for weekday purchases may contribute to inducing loyal customer generation. Conversely, for customers who have purchase records only on weekdays, providing discounts or other advantage promotions for weekend purchases will be effective in forming loyal customers.
Table 4.
Top-seven feature importance of XGBoost algorithms.
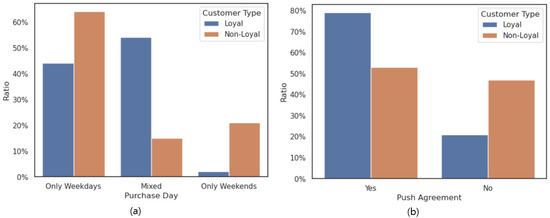
Figure 4.
(a) Distribution comparison of purchase records by date of purchase between loyal and non-loyal customers. (b) Comparison of purchase records by mobile notification agreement.
The mobile application notification status shows the second highest feature importance; that is, customers naturally engage more with the platform when they receive mobile application notifications. These notifications can encourage more customer interest in the platform and the products by providing product news, product offers, event alarms, and other information to customers. Additionally, it has the advantage of allowing customers to easily receive a variety of information without having to search for it themselves. Also, in terms of order transactions, there is a positive effect with regard to customers having the ability to easily obtain the order status and progress of their orders. Figure 4b compares the distribution of whether loyal customers agree to receiving mobile application notifications and whether non-loyal customers agree to receiving mobile application notifications. About 53% of non-loyal customers agreed to receive mobile application notifications, and 47% did not agree, while about 79% of loyal customers agreed to receive mobile application notifications, and only about 21% did not agree. This shows that the percentage of loyal customers who consent to mobile application notifications is much higher than that of non-loyal customers. Therefore, by providing discount coupons or other benefits to customers who set up these push notifications, we can encourage customers to interact more with the online shopping platform, which will lead to the formation of loyal customers.
The types of coupons customers use when purchasing products from the online shopping platform are also the main features related to loyal customers. The types of coupons used by customers on their third purchase are also a key feature related to loyal customers. The larger the coupon discount amount, the higher the feature importance tends to be, indicating that consumers are sensitive to price. Therefore, it will be important to provide customers with an appropriate level of discount coupons. The third-order coupon discount others-type coupons are not simple discount coupons amounting to a certain sum but correspond to a ’Happy birthday celebration coupon’, ’Friend invitation reward coupon’, or ’Cancellation apology coupon’. It is worth noting that these coupons are not simple one-time discount coupons but are coupons that companies and customers interact with, such as when the company celebrates a customer’s birthday, compensates for a wrong delivery, or when a customer recommends another customer to the company. Therefore, depending on whether customers prefer to use these interactive coupons or not, different customer customization strategies are needed.
The number of reviews written by customers also appears to be an important feature related to loyal customers. Customer reviews are a crucial factor in influencing other customers to purchase the product. Figure 5 shows a comparison of the distribution of the number of reviews written by loyal customers and the distribution of the number of reviews written by non-loyal customers. Only about 15.9% of non-loyal customers wrote at least one review, while 41.1% of loyal customers wrote at least one review, being 2.5 times higher. Only about 6.2% and 3.2% of non-loyal customers wrote reviews once and twice, respectively, while 7.6% of loyal customers wrote reviews once and 5.0% wrote reviews twice, with loyal customers tending to write more reviews. In addition, less than 1% of non-loyal customers have written five, six, seven, or more reviews, but loyal customers remained at consistent 2–3% proportions. Among loyal customers, around 8.9% had written more than eight reviews; this clearly shows that loyal customers tend to leave more reviews. Therefore, we can encourage existing customers to write more reviews by providing them with points or other benefits for writing reviews, which will lead to the formation of more loyal customers.
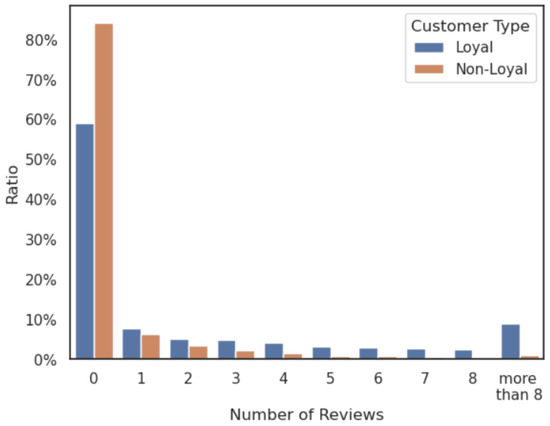
Figure 5.
Comparison of the number of reviews between loyal and non-loyal customers.
By combining the core features mentioned above, it is also possible to establish more detailed and actionable strategies. For example, by combining the three most critical features—rate of orders during weekends, mobile application notification status, and third-order coupon discount—we can offer more targeted and dedicate strategy to potential loyal customers. Specifically, if the mobile application notification status is set to “Yes”, a discount coupon will be issued that can be used during the weekdays. Another example is developing potential loyal customers into loyal customers by holding an event where a discount coupon will be issued if a customer writes a certain number of reviews. These refined, actionable marketing tactics which are tailored to customer behavior patterns will improve both customer retention and sales’ performance.
While this study focuses on pet-related vertical e-commerce, the machine learning-based approaches and developed insights can be extended to a wider range of vertical e-commerce sectors, such as fashion, electronics, and grocery, where customer loyalty plays a crucial role. For example, a predictive model used to anticipate customer purchasing behavior in the pet-related vertical sector could be applied to fashion e-commerce by swapping pet-related features for clothes-related features and inserting additional features that reflect seasonal trends.
Many of the factors identified, such as post-purchase engagement, product variety, and delivery related information, are applicable across a wide variety of sectors related to repeat purchases. By drawing common factors between pet-related vertical e-commerce and other broader sectors and utilizing the sector’s unique distinctive factors, we can apply our machine learning approaches and insights to other e-commerce industries to improve customer retention and to develop long-term loyalty strategies tailored to different customer bases.
5. Conclusions
5.1. Implications of the Study
While attracting new customers is crucial for business success, retaining existing customers is essential. Loyal customers, in particular, hold immense significance for companies as they provide steadfast support and express positive opinions about products and services. Loyal customers not only continue to purchase or repurchase existing offerings but also serve as advocates, introducing them to others in their network. Moreover, their impact and significance have grown exponentially with the proliferation of social network services driven by technological advancements. Consequently, fostering customer loyalty, both among new and existing customers, has become a key aspect of customer management for companies.
In this research, we investigated the factors influencing the formation of loyal customers in the pet-related industry vertical e-commerce sector in the Republic of Korea using machine learning techniques. We were able to enhance the efficiency of analysis in terms of both time and financial resources by harnessing the power of machine learning while uncovering potential key elements that may have been overlooked by traditional marketers or domain experts. In this study, various machine learning models, including logistic regression analysis, decision tree, support vector machine, random forest, and XGBoost, were employed, yielding outstanding performance. Following a comparative analysis of various models, XGBoost demonstrated the highest predictive performance, enabling the identification of the primary factors influencing customer loyalty.
The findings of this research indicated that customers demonstrating balanced purchasing patterns across weekends and weekdays exhibited higher levels of loyalty. Furthermore, customers who engaged with mobile push notifications also demonstrated notable loyalty. In addition, the higher the discount rate of the coupon provided at the third purchase, the more likely it was for a customer to be converted into a loyal customer. Moreover, customers who actively wrote product reviews were also more likely to become loyal customers. These findings offer valuable insights for companies seeking to develop effective customer retention strategies within the pet e-commerce industry. The findings suggest that a customized marketing strategy, tailored to customers’ actual purchasing patterns and behaviors, would be more effective than a simple promotion. It is also recommended that companies devise marketing strategies and promotions to increase the relevant indicators for both new and existing non-loyal customers. Based on the results of this study, marketing strategies that can be practically applied by companies can be proposed.
5.2. Business Strategies for Enhancing Customer Loyalty
In light of the factors that shape customer loyalty, as derived from the present study, companies can employ customized marketing strategies and data-driven approaches to develop more effective customer retention measures. The first strategy is to introduce a customized discount policy. For customers who only buy on weekends, it is possible to encourage them to buy on weekdays by offering weekday-only discount coupons. Conversely, for customers who only buy on weekdays, it is possible to encourage them to buy on weekends by offering weekend promotions. In addition, a strategy that encourages continuous purchases by offering VIP benefits to customers who consistently purchase on weekends and weekdays can be effective. The second strategy involves the utilization of mobile push notifications as a component of a customer retention plan. The findings of this study indicate that customers who have enabled mobile push notifications exhibit higher levels of loyalty. Consequently, companies may consider offering exclusive discount events to customers who have configured mobile push notifications or providing incentives for new members to enable such notifications. Furthermore, companies can enhance customer engagement by providing push notifications when specific products are restocked or during limited-time promotions. Third, introducing a program to encourage customers to write reviews is also an effective way to increase customer loyalty. According to research, customers who write reviews are more likely to become loyal customers. Therefore, companies can encourage customers to leave reviews by offering benefits such as earning points or receiving additional discount coupons when they write reviews. In particular, it would be more effective to provide additional rewards for photo reviews and long reviews to secure more reliable customer feedback. The fourth strategy is to introduce a pet-specific recommendation system using machine learning. This system analyzes customer purchase data, including the age of the pet, the type of product, and brand preferences, to provide customized recommendations. These recommendations can further strengthen customer loyalty by offering products like food or health supplements suitable for pets of a similar age, or by informing customers of new products from their preferred brands. Finally, it is important to optimize discount and coupons policies. Our research shows that the higher the discount on the coupon offered at the third purchase, the more likely the customer is to become a loyal customer. Therefore, companies need to consider running strategic coupons that encourage the first three purchases. For example, the company can consider offering a small discount on the first purchase to encourage customer inflow, a moderate discount on the second purchase, and the highest discount on the third purchase to encourage continued purchases.
5.3. Limitations and Direction of Future Research
Increasing and maintaining customer loyalty is a key challenge faced by all companies, and machine learning-based predictive models can play a pivotal role in effectively addressing this challenge. In particular, advances in customer relationship management (CRM) platforms and marketing automation technologies contribute to the sophisticated personalization of customer experiences, facilitating the analysis of the fundamental factors for building loyal customers. One of the most prominent applications of big data is the recommendation engine, which is a powerful tool that provides customized products and services based on customers’ past data. This engine has the capacity to enhance the shopping experience by analyzing individual customers’ preferences through sophisticated algorithms and providing them with suggestions that they might be interested in. The CRM platform can be used as a key element of such a recommendation engine. To build loyal customers and prevent existing customers from churning, the trained machine learning models can detect changes in purchasing patterns and contribute to the establishment of a retention strategy in advance. Through the integration of machine learning-based predictive techniques with CRM and marketing automation, companies are able to formulate strategies that more effectively align with customer expectations, thereby increasing loyalty. In particular, personalized recommendations not only provide customers with a more convenient shopping experience but also increase sales’ potential. This strengthens the bond between the company and the customer and enables the maximization of long-term relationships. This study has not yet addressed a direct integration with CRM platforms; however, in-depth research on this topic may be conducted in the future. By linking with CRM systems, the practical applicability of customer loyalty prediction models can be examined, and the study can be expanded to develop more effective customized marketing strategies.
Future research endeavors also could focus on conducting qualitative analysis of these key variables. Additionally, although the study has identified high-importance variables, a comprehensive explanation for why these variables are influential remains lacking. Further investigations drawing from disciplines, such as consumer science, consumer behavior, and psychology, could shed light on this aspect and serve as promising avenues for future research. Moreover, conducting similar research on the pet-related industry in other countries would enable the extraction of factors that affect the formation of loyal customers, irrespective of nationality. Also, social networks have been identified as a contributing factor to the formation of loyal customers and repeat purchases. In particular, this is considered to be even more important in the pet-related industry, where social media plays a critical role in activities related to the protection and resolution of stray animals. However, the present study does not examine the impact of social media on the formation of loyal customers in the pet industry. Rather, we focus on analyzing the factors that lead to the formation of loyal customers based on internal company data, such as customer information and purchase records. The analysis of factors leading to the formation of loyal customers based on social networks is an area that necessitates more extensive data collection and further investigation. This is one of the directions that can be considered in future research.
This study focuses on identifying the key factors of customer loyalty using machine learning, which suggests the possibility of more precise analysis and utilization based on quantitative data than the existing formalized marketing approach. Machine learning models can be used as a powerful tool for learning complex data patterns to predict loyal customers and for analyzing various factors that influence their continued positive or loyal relationships with companies. Notably, machine learning algorithms can identify features that may have been overlooked in conventional research, underscoring the necessity of a data-driven approach in customer loyalty research. Furthermore, analyzing loyal customers using machine learning can assist companies in developing more targeted marketing strategies, which can positively impact the cultivation of long-term customer relationships and the enhancement of loyalty.
In conclusion, this study highlights the significance of customer loyalty in driving business success and underscores the potential of machine learning in uncovering critical factors that contribute to customer loyalty formation. Companies can enhance their understanding of customer behavior and develop effective marketing strategies to foster loyalty among both new and existing customers by leveraging the insights gained from machine learning models. Further research efforts could focus on deeper qualitative analysis to explore the underlying reasons behind the variables that influence customer loyalty. Moreover, by conducting research that reflects the impact of social networks on customer loyalty through the collection of additional social network data, we can more precisely analyze how customers’ purchasing behavior is formed and spread. Furthermore, expanding the scope of research to an international context and comparing the factors that shape customer loyalty in various industries and markets will contribute to the development of effective loyalty customer strategies in the global market.
Author Contributions
Conceptualization, Y.L. and E.K.; methodology, Y.L., K.N., J.R. and E.K.; software, Y.L. and J.R.; validation, K.N. and E.K.; formal analysis, E.K.; investigation, Y.L., K.N. and J.R.; resources, E.K.; data curation, Y.L. and J.R.; writing—original draft preparation, Y.L. and E.K.; writing—review and editing, K.N., J.R. and E.K.; visualization, Y.L. and E.K.; supervision, J.R. and E.K.; project administration, J.R. and E.K.; funding acquisition, J.R. and E.K. All authors have read and agreed to the published version of the manuscript.
Funding
This research was supported by Regional Innovation Strategy (RIS) through the National Research Foundation of Korea (NRF) funded by the Ministry of Education (MOE) (2022RIS-005). This work was supported by the research fund of Hanyang University (HY-202400000003726).
Data Availability Statement
The research dataset can be obtained upon a proper request.
Acknowledgments
The authors would like to express sincere gratitude to anonymous reviewers for their valuable comments and insightful suggestions that greatly improved the quality of this work.
Conflicts of Interest
The authors declare no conflicts of interest.
Appendix A
Preprocessed Dataset Description
Table A1 is the refined dataset derived from original Table 1 data, following comprehensive data cleaning and feature engineering processes. These preprocessing steps have transformed the raw data into a structured, unified and actionable format for analysis and machine learning modeling.
Table A1.
Each variable’s description of the preprocessed dataset.
Table A1.
Each variable’s description of the preprocessed dataset.
| Variable | Description |
|---|---|
| User ID | Encrypted user identification key |
| Survival Status (Y/N) | 4th purchase status (Target value) |
| Membership Withdrawal Status (Y/N) | Whether or not the member has withdrawn from the service |
| Pet Registration Status (Y/N) | Whether or not pet-related information has been registered in the service |
| Pet Age | Age of registered pet |
| Mobile Application Notification Status (Y/N) | Notification or push reception setting in mobile application |
| Information Registration Status (Y/N) | Whether pet information was registered to the service before the first purchase |
| Days after Enrollment to the 1st Purchase | Days to take from registration of service/membership to the first order |
| Rate of Purchased Food | Rate of staple food category orders among the first to the third purchases |
| Rate of Purchased Snack | Rate of snack category orders among the first to the third purchases |
| Rate of Purchased Toy | Rate of toy category orders among the first to the third purchases |
| Rate of Purchased Necessity | Rate of necessity category orders among the first to the third purchases |
| Rate of Private Brand Product Purchase | Rate of orders for private brand products during the first to the third purchases |
| Rate of Major Brand Product Purchase | Rate of orders from major brands during the first to the third purchases |
| First-Order Coupon Label | Label of the coupon used on the first order |
| Second-Order Coupon Label | Label of the coupon used on the second order |
| Third-Order Coupon Label | Label of the coupon used on the third order |
| First-Order Month | Month of the customer place the first order (for seasonal effect) |
| Rate of Same-day Delivery | Rate of same day delivery orders up to the third order |
| Rate of Overnight Delivery | Rate of overnight delivery orders up to the third order |
| Rate of Courier Delivery | Rate of courier delivery orders up to the third order |
| Rate of Orders during Weekdays | Rate of orders during weekdays among three orders |
| Rate of Orders during Weekends | Rate of orders during weekends among three orders |
| Average Price of Orders | Average price of orders from the first purchase to the third purchase |
| Number of Reviews | Number of product reviews written among three orders |
| Date Elapsed since Enrollment | How many days have passed since enrollment |
References
- Erevelles, S.; Fukawa, N.; Swayne, L. Big Data consumer analytics and the transformation of marketing. J. Bus. Res. 2016, 69, 897–904. [Google Scholar] [CrossRef]
- Wedel, M.; Kannan, P. Marketing analytics for data-rich environments. J. Mark. 2016, 80, 97–121. [Google Scholar] [CrossRef]
- Rashid, A.B. Access methods for Big Data: Current status and future directions. EAI Endorsed Trans. Scalable Inf. Syst. 2017, 4, e2. [Google Scholar]
- Tiwari, A.; Masilamani, M.; Rao, T.S.; Zope, S.; Deepak, S.; Karthick, L. Shaping the Future: Emerging Trends and Strategic Predictions in Big Data and AI. In AI and the Revival of Big Data; IGI Global: Hershey, PA, USA, 2025; pp. 125–154. [Google Scholar]
- Ahmad, K. Machine Learning in the Era of Big Data: Advanced Algorithms and Real-world Applications. J. Environ. Sci. Technol. 2023, 2, 36–47. [Google Scholar]
- Zhu, C.; Cheng, G.; Wang, K. Big data analytics for program popularity prediction in broadcast TV industries. IEEE Access 2017, 5, 24593–24601. [Google Scholar] [CrossRef]
- Fortunato, A.; Gorgoglione, M.; Messeni Petruzzelli, A.; Panniello, U. Leveraging big data for sustaining open innovation: The case of social TV. Inf. Syst. Manag. 2017, 34, 238–249. [Google Scholar] [CrossRef]
- Zhao, Y.; Zhang, X.; Wang, J.; Zhang, K.; Ordonez de Pablos, P. How do features of social media influence knowledge sharing? An ambient awareness perspective. J. Knowl. Manag. 2020, 24, 439–462. [Google Scholar] [CrossRef]
- Gefen, D. Customer loyalty in e-commerce. J. Assoc. Inf. Syst. 2002, 3, 2. [Google Scholar] [CrossRef]
- Leninkumar, V. The relationship between customer satisfaction and customer trust on customer loyalty. Int. J. Acad. Res. Bus. Soc. Sci. 2017, 7, 450–465. [Google Scholar] [CrossRef]
- Helgesen, Ø. Are loyal customers profitable? Customer satisfaction, customer (action) loyalty and customer profitability at the individual level. J. Mark. Manag. 2006, 22, 245–266. [Google Scholar] [CrossRef]
- Agnihotri, R.; Dingus, R.; Hu, M.Y.; Krush, M.T. Social media: Influencing customer satisfaction in B2B sales. Ind. Mark. Manag. 2016, 53, 172–180. [Google Scholar] [CrossRef]
- Piccialli, F.; Jung, J.E. Understanding customer experience diffusion on social networking services by big data analytics. Mob. Netw. Appl. 2017, 22, 605–612. [Google Scholar] [CrossRef]
- Chae, H.; Ko, E.; Han, J. How do customers’ SNS participation activities impact on customer equity drivers and customer loyalty? Focus on the SNS services of a global SPA brand. J. Glob. Sch. Mark. Sci. 2015, 25, 122–141. [Google Scholar] [CrossRef]
- Cant, M.C.; Machado, R.; Seaborne, H.C. Brand advocates—An apple phenomenon? An exploratory study on brand advocacy amongst apple consumers. Corp. Ownersh. Control. 2014, 11, 535–541. [Google Scholar] [CrossRef]
- Pearson Korea. Growth Dynamics: Unveiling the Rising Pet Industry in South Korea. 2024. Available online: https://pearsonkorea.com/insights/Growth-Dynamics-Unveiling-the-Rising-Pet-Industry-in-South-Korea/ (accessed on 24 February 2025).
- Statista. South Korea: Market Size of the Pet Industry. 2024. Available online: https://www.statista.com/topics/7212/pet-industry-in-south-korea/ (accessed on 24 February 2025).
- Priya, R.J.; Nandhini, M. Evolving opportunities and trends in the pet industry—An analytical study on pet products and services. J. Appl. Sci. Comput. 2018, 5, 1161–1173. [Google Scholar]
- Zhang, W.; Cao, H.; Lin, L. Analysis of the future development trend of the pet industry. In Proceedings of the 2022 7th International Conference on Financial Innovation and Economic Development (ICFIED 2022), Harbin, China, 21–23 January 2022; Atlantis Press: Amsterdam, The Netherlands, 2022; pp. 1682–1689. [Google Scholar]
- Kim, G.; Kim, J.E.; Lee, J.; Cho, J.D. Understanding Buyers’ Behaviors in Vertical E-Commerce with Limited-edition Merchandise. In Proceedings of the 2022 IEEE International Conference on Consumer Electronics-Taiwan, Taipei, Taiwan, 6–8 July 2022; pp. 525–526. [Google Scholar]
- Buckinx, W.; Verstraeten, G.; Van den Poel, D. Predicting customer loyalty using the internal transactional database. Expert Syst. Appl. 2007, 32, 125–134. [Google Scholar] [CrossRef]
- Noorbehbahani, F.; Bajoghli, S.; Esfahani, H.H. Customer Loyalty Prediction of E-marketplaces Via Review Analysis. In Proceedings of the 2023 9th International Conference on Web Research (ICWR), Tehran, Iran, 3–4 May 2023; pp. 311–316. [Google Scholar]
- Hamdan, I.Z.P.; Othman, M.; Hassim, Y.M.M.; Marjudi, S.; Yusof, M.M. Customer Loyalty Prediction for Hotel Industry Using Machine Learning Approach. JOIV Int. J. Inform. Vis. 2023, 7, 695–703. [Google Scholar] [CrossRef]
- Sulistiani, H.; Muludi, K.; Syarif, A. Implementation of Dynamic Mutual Information and Support Vector Machine for Customer Loyalty Classification. J. Phy. Conf. Ser. 2019, 1388, 12050. [Google Scholar] [CrossRef]
- Biau, G.; Scornet, E. A random forest guided tour. TEST Off. J. Spa. Soc. Stat. Ope. Res. 2016, 25, 197–227. [Google Scholar] [CrossRef]
- Chen, T.; Guestrin, C. Xgboost: A scalable tree boosting system. In Proceedings of the 22nd ACM SIGKDD International Conference on Knowledge Discovery and Data Mining, San Francisco, CA, USA, 13–17 August 2016; pp. 785–794. [Google Scholar] [CrossRef]
- Zhang, X.; Guo, F.; Chen, T.; Pan, L.; Beliakov, G.; Wu, J. A brief survey of machine learning and deep learning techniques for e-commerce research. J. Theor. Appl. Electron. Commer. Res. 2023, 18, 2188–2216. [Google Scholar] [CrossRef]
- Liu, C.J.; Huang, T.S.; Ho, P.T.; Huang, J.C.; Hsieh, C.T. Machine learning-based e-commerce platform repurchase customer prediction model. PLoS ONE 2020, 15, e0243105. [Google Scholar] [CrossRef] [PubMed]
- Griffin, J. Customer Loyalty: How to Earn It, How to Keep It; John Wiley & Sons: Hoboken, NJ, USA, 2002. [Google Scholar]
- Lemon, K.N.; Verhoef, P.C. Understanding customer experience throughout the customer journey. J. Mark. 2016, 80, 69–96. [Google Scholar] [CrossRef]
- Santos, S.; Gonçalves, H.M. The consumer decision journey: A literature review of the foundational models and theories and a future perspective. Technol. Forecast. Soc. Change 2021, 173, 121117. [Google Scholar] [CrossRef]
- Lin, S.C.; Tseng, H.T.; Shirazi, F. Consumer decision journey for online group buying: Psychological and intentional procedure perspectives. Br. Food J. 2022, 124, 4387–4405. [Google Scholar] [CrossRef]
- Sjoraida, D.F.; Amrita, N.D.A.; Redjeki, F. Collaboration in creating an educational consumer journey: A meaningperspective formation. J. Econ. Account. Bus. Manag. Eng. Soc. 2024, 1, 1–13. [Google Scholar]
- Wei, J.T.; Lin, S.Y.; Yang, Y.Z.; Wu, H.H. Applying data mining and RFM model to analyze customers’ values of a veterinary hospital. In Proceedings of the 2016 International Symposium on Computer, Consumer and Control (IS3C), Xi’an, China, 4–6 July 2016; pp. 481–484. [Google Scholar]
- Dogan, O.; Ayçin, E.; Bulut, Z. Customer segmentation by using RFM model and clustering methods: A case study in retail industry. Int. J. Contemp. Econ. Adm. Sci. 2018, 8, 1–19. [Google Scholar]
- Dursun, A.; Caber, M. Using data mining techniques for profiling profitable hotel customers: An application of RFM analysis. Tour. Manag. Perspect. 2016, 18, 153–160. [Google Scholar] [CrossRef]
- Zalaghi, Z.; Varzi, Y. Measuring customer loyalty using an extended RFM and clustering technique. Manag. Sci. Lett. 2014, 4, 905–912. [Google Scholar] [CrossRef][Green Version]
- Zhang, J.Q.; Dixit, A.; Friedmann, R. Customer loyalty and lifetime value: An empirical investigation of consumer packaged goods. J. Mark. Theory Pract. 2010, 18, 127–140. [Google Scholar] [CrossRef]
- Eger, L.; Mičík, M. Customer-oriented communication in retail and Net Promoter Score. J. Retail. Consum. Serv. 2017, 35, 142–149. [Google Scholar] [CrossRef]
- Ma, L.; Sun, B. Machine learning and AI in marketing—Connecting computing power to human insights. Int. J. Res. Mark. 2020, 37, 481–504. [Google Scholar] [CrossRef]
- Vlačić, B.; Corbo, L.; e Silva, S.C.; Dabić, M. The evolving role of artificial intelligence in marketing: A review and research agenda. J. Bus. Res. 2021, 128, 187–203. [Google Scholar] [CrossRef]
- Ngai, E.W.; Wu, Y. Machine learning in marketing: A literature review, conceptual framework, and research agenda. J. Bus. Res. 2022, 145, 35–48. [Google Scholar] [CrossRef]
- Satish, L.; Yusof, N. A review: Big data analytics for enhanced customer experiences with crowd sourcing. Procedia Comput. Sci. 2017, 116, 274–283. [Google Scholar] [CrossRef]
- Tang, Z.; Dong, S. A total sales forecasting method for a new short life-cycle product in the pre-market period based on an improved evidence theory: Application to the film industry. Int. J. Prod. Res. 2021, 59, 6776–6790. [Google Scholar] [CrossRef]
- Bassamzadeh, N.; Ghanem, R. Multiscale stochastic prediction of electricity demand in smart grids using Bayesian networks. Appl. Energy 2017, 193, 369–380. [Google Scholar] [CrossRef]
- Singh, C.P.; Yousuf, R. Enhancing Marketing Strategies Through Big Data-Driven Customer Journey Mapping: An Analysis Using Machine Learning Algorithms. In Proceedings of the 2024 International Conference on Emerging Innovations and Advanced Computing (INNOCOMP), Sonipat, India, 25–26 May 2024; pp. 479–484. [Google Scholar]
- Putra, G.A. The Journey of Marketing Research in Driving Successful Marketing Strategies. Adv. Bus. Ind. Mark. Res. 2024, 2, 26–35. [Google Scholar] [CrossRef]
- Chen, N. Research on E-Commerce Database Marketing Based on Machine Learning Algorithm. Comput. Intell. Neurosci. 2022, 2022, 7973446. [Google Scholar] [CrossRef] [PubMed]
- Policarpo, L.M.; da Silveira, D.E.; da Rosa Righi, R.; Stoffel, R.A.; da Costa, C.A.; Barbosa, J.L.V.; Scorsatto, R.; Arcot, T. Machine learning through the lens of e-commerce initiatives: An up-to-date systematic literature review. Comput. Sci. Rev. 2021, 41, 100414. [Google Scholar] [CrossRef]
- Hssina, B.; Merbouha, A.; Ezzikouri, H.; Erritali, M. A comparative study of decision tree ID3 and C4.5. Int. J. Adv. Comp. Sci. App. 2014, 4, 13–19. [Google Scholar] [CrossRef]
- Liu, Y.; Yang, S. Application of decision tree-based classification algorithm on content marketing. J. Math. 2022, 2022, 6469054. [Google Scholar] [CrossRef]
- Karim, M.; Rahman, R.M. Decision tree and naive bayes algorithm for classification and generation of actionable knowledge for direct marketing. J. Soft. Engi. 2013, 4, 196–206. [Google Scholar] [CrossRef]
- Gkikas, D.C.; Theodoridis, P.K.; Beligiannis, G.N. Enhanced Marketing Decision Making for Consumer Behaviour Classification Using Binary Decision Trees and a Genetic Algorithm Wrapper. Informatics 2022, 9, 45. [Google Scholar] [CrossRef]
- Farquad, M.A.H.; Ravi, V.; Raju, S.B. Churn prediction using comprehensible support vector machine: An analytical CRM application. Appl. Soft Comp. 2014, 19, 31–40. [Google Scholar] [CrossRef]
- Dehghan, A.; Trafalis, T. Examining churn and loyalty using support vector machine. Bus. Man. Res. 2012, 1, 153–161. [Google Scholar] [CrossRef][Green Version]
- Na, K.; Lee, J.; Kim, E.; Lee, H. A Securities Company’s Customer Churn Prediction Model and Causal Inference with SHAP Value. J. Bigdata 2020, 5, 215–229. [Google Scholar] [CrossRef]


Disclaimer/Publisher’s Note: The statements, opinions and data contained in all publications are solely those of the individual author(s) and contributor(s) and not of MDPI and/or the editor(s). MDPI and/or the editor(s) disclaim responsibility for any injury to people or property resulting from any ideas, methods, instructions or products referred to in the content. |
© 2025 by the authors. Licensee MDPI, Basel, Switzerland. This article is an open access article distributed under the terms and conditions of the Creative Commons Attribution (CC BY) license (https://creativecommons.org/licenses/by/4.0/).