Abstract
Prior studies have shown mixed findings on the role of financial slack. This study examines how environmental factors such as munificence, dynamism, and complexity moderate the relationship between financial slack and innovation activity. Using data from Compustat and the Center for Research in Security Prices (CRSP) database on 578 computer-processing firms in innovation-intensive industries in the United States, our results reaffirm that financial slack is a strategic asset that enhances R&D investment. Further, we find that the positive consequences of financially abundant firms pursuing innovation are attenuated in munificent environments where firms increasingly rely on external resources. Similarly, in dynamic environments, unpredictable market changes divert slack resources from long-term R&D investments, further weakening the effect. However, there is no significant difference in complex environments. Our study contributes to the existing literature by integrating different environments and highlighting the importance of balancing internal resources with external environments in shaping innovation strategies. For managers, these findings provide practical guidance for resource allocation strategies to effectively support innovation in varying external environments.
1. Introduction
Innovation is critical to the competitiveness and long-term growth of organizations as social systems. Fundamental to innovation is investment in research and development (R&D) [1], which contributes to product development, securing patents, and the speed of innovation [2,3,4]. Through sustained R&D investments, firms can provide a structured path for exploration and implementation, supporting industry growth.
One of the important factors influencing a firm’s innovative efforts is grounded in its ability to allocate resources at a scale that is sufficient to help it become competitive. These capabilities include, but are not limited to, excess resources such as equipment, technology, scientists, and opportunity costs [5]. However, empirical studies have produced inconclusive results on how financial slack influences innovation [6,7,8]. Financial slack is recognized as a firm resource that can affect organizational outcomes, including innovation [6]. While slack provides a pool of resources for positive changes in an organization’s behavior [6,9,10,11], research has pointed out that slack resources can attract inefficiencies and complacencies within organizations. For example, Nohria and Gulati [10] document how slack leads to less disciplined project management, which in turn impairs innovation outcomes. These mixed empirical findings have led other studies to propose a curvilinear relationship [10,12]. These views suggest there is an optimal level at which financial slack encourages R&D investment. Indeed, a broad body of literature has already been dedicated to the financial slack–innovation relationship. However, studies have thus far overlooked external forces that may contribute to our understanding of the changes in the level of internal resources that influence a firm’s ability to invest.
This study explores how the varying environmental dimensions in which organizations compete affect the relationship between financial slack and innovation activities. Organizations within industries function as social systems in which they acquire an array of inputs from their environment, which subsequently transform into final products and services [13]. As such, environments exert pressure on the workings of organizations [14]. For example, environmental variability can affect firms’ performance [15,16,17,18], innovation behavior [13,19], and strategies [20,21,22]. According to Dess and Beard [23], the three underlying environmental dimensions that influence a firm’s innovation endeavors are munificence, dynamism, and complexity. Environmental munificence, which refers to the abundance of resources in an environment, establishes the conditions under which innovation activities are more likely to thrive [24]. These resources may include the availability of financing, skilled labor, and advanced technology. Environmental dynamism is characterized by economic volatility that forces organizations to adapt to unpredictable changes in market conditions; for example, rapid technological advances or sudden regulatory changes may force organizations to adapt quickly [25]. Finally, environmental complexity refers to the multifaceted and inter-connected nature of market forces, competition, and regulation, as seen in industries where companies navigate diverse consumer preferences, intense competition, and varying regulatory requirements across regions [26].
Building on these environmental dimensions, our study tests four key hypotheses. First, we propose that financial slack is positively associated with R&D investment because it provides firms with the necessary resources to finance innovative initiatives. Second, we hypothesize that this positive relationship is attenuated in highly munificent environments, where abundant external resources may reduce a firm’s reliance on internal slack for innovation. Third, in dynamic environments, we expect the positive effect of financial slack on innovation to be diminished, as firms may divert resources to meet immediate challenges. Finally, we contend that in complex environments, the positive effect of financial slack on innovation is also attenuated.
This study makes three important contributions. First, it provides evidence that financial slack is a positive predictor of innovation. Second, we extend previous research on the financial slack–performance relationship by simultaneously taking into account all three environmental factors in which firms operate, where prior research has largely examined the effects of only one or two environments. Finally, we show that the effect of financial slack on a firm’s innovation activities varies depending on the distinct environmental dimensions that firms face. We highlight the significance of how environments offer different stimuli to organizations and that managers should understand the role of financial slack and innovation in different environments. Managers who understand this interplay between internal slack resources and external environments can allocate resources more effectively and plan strategically. For example, amid volatile market conditions and fierce competition in the semiconductor industry in the early 2000s, Intel Corporation significantly increased its R&D investment to develop the Intel Core 2 Duo processor, which offered improved performance and energy efficiency. This strategy allowed Intel to maintain a competitive edge during uncertain market conditions and technology shifts, demonstrating how firms use R&D investments to navigate volatile environments.
The remainder of this paper is organized as follows: In Section 2, we review the related literature and develop hypotheses concerning the role of financial slack, innovation activities, and environmental forces. We discuss the research methodology in Section 3, the study’s results in Section 4, and discuss the study’s findings and practical implications in Section 5.
2. Theory and Hypotheses
2.1. Financial Slack and Innovation Activity
Innovation is a complex, organization-wide endeavor that requires proactive practices to structure, organize, and encourage it. This takes time because innovation is characterized by long-term orientation. It also necessitates investment in the development and exploration of new ideas, which implies that investment in innovation is heavily underpinned by resources to support it [6]. Financial slack refers to the excess resources—financial, human, and other—that organizations have at their disposal to support innovation and adaptation to changes in the environment [9]. Slack also buffers against uncertain outcomes that are common in innovation activities [27]. While different types of excess organizational resources may exist, we focus on financial resources since they provide firms with the necessary means to pursue experimentation, take risks, and innovate [28], because the acquisition of tangible and intangible assets aids innovation [29]. In particular, we focus on firms’ quick ratio, which is a common measure of financial slack [5,9]. Unabsorbed slack is defined as uncommitted resources that can be allocated to unanticipated opportunities [30]. Liquid assets, such as cash and short-term marketable securities, are resources that are not committed to operational items; thus, liquid assets can be freed for other uses, which could lead to greater maneuverability. Greater liquidity provides a firm with opportunities to take risks in their innovation investments because they have assets that are readily accessible for redeployment [31].
In general, financial slack is good to have because the availability of financial resources emboldens organizations to invest in creative endeavors [6,32]. In contrast, a likely consequence of insufficient financial slack is that innovation activities will be curtailed over time. Without financial slack, “dysfunctional organizational changes such as layoffs and cancellation of capital investments” can result [33] (p. 43). It is also important to note that potential constraints may affect the relationship between financial slack and innovative activity. Industries differ in their reliance on innovation; in pharmaceutical industries, where innovation is essential, financial slack may be used more effectively to finance R&D, whereas in more traditional industries, the benefits of slack for innovation may be less pronounced. Following the perspective of earlier studies that examined financial slack resources as a critical determinant of innovation activities [34,35], we contend that financial slack positively contributes to innovation endeavors. Therefore, we propose the following baseline hypothesis:
Hypothesis 1.
There is a positive relationship between financial slack and R&D investment.
2.2. Effects of Environmental Munificence on Financial Slack and Innovation Activity
Next, we focus on the moderating effect of environmental munificence on the relationship between financial slack and innovation activities. A munificent environment is one in which there are plentiful resources that enable business expansion and increase opportunities [23,36]. For example, firms operating in a highly munificent environment have greater flexibility in strategic planning [31,37,38]. Such a favorable environment offers a wealth of opportunities. However, we suspect that in resource-rich environments, the relative advantage of having additional internal financial resources diminishes. First, the environment provides abundant opportunities and resources, such as external financing, collaborations, and partnerships, which reduce firms’ dependence on financial slack for innovation initiatives. In such a favorable environment, managers may feel less need to rely on internal resources. Next, firms can exploit market opportunities, leading to a dispersion of financial slack for innovative activities. For example, reallocation of resources for market expansion and acquisition can hamper firms’ ability to achieve innovation initiatives [39]. In addition, greater munificence may bring about a sense of overconfidence in firms so that firms will underestimate the need for continuous innovation. With readily accessible resources and a reliance on market conditions for growth, this complacency diminishes the perceived need to allocate financial slack toward innovation endeavors. Consider, for example, a well-established technology firm in Silicon Valley. In this region, abundant venture capital, government incentives, and a rich network of industry partnerships create a munificent environment. Even if the firm has significant internal financial slack, it can easily access external funding to support its R&D initiatives. As a result, the firm may rely less on its internal resources for innovation, reducing the impact of financial slack.
In contrast, scarce resources can be a disruptive force in an industry with low munificence [23,36]. A scarcity of resources can affect every aspect of business operations and put pressure on profitability, capacity for innovation, and organizational structure [40,41,42]; moreover, firms can become more susceptible to the influence of legally questionable activities [43] and behave less socially responsible [44]. The general scarcity of resources imposed by low munificence can influence firms’ ability to allocate resources to innovation initiatives. To begin with, motivation will likely become a strong driver to engage in innovation activities. Since organizations competing in a less munificent environment will likely face a confluence of challenges, they will become more reliant on financial slack to survive. This will lead to a more strategic use of financial slack for innovation, as it becomes a critical buffer for developing unique capabilities. Furthermore, a resource-constrained environment may also foster a greater propensity for risk-taking within firms [45]. Miller and Friesen [46] define risk-taking as “the degree to which managers are willing to make large and risky resource commitments—i.e., those which have a reasonable chance of costly failure” (p. 923). Firms will be more proactive in using their financial slack resources to explore ideas that would not have been considered in a more resource-abundant setting. Therefore, we argue that firms operating in a non-munificent environment will engage in more innovative activities than firms operating in a munificent environment where there are abundant slack resources. Accordingly, we hypothesize the following:
Hypothesis 2.
The positive effect of financial slack and innovation activity is weaker when the environmental munificence is stronger.
2.3. Effects of Environmental Dynamism on Financial Slack and Innovation Activity
Environmental dynamism describes the degree of market volatility and unpredictability [23,36,47]. While different types of dynamism, such as technological or market dynamism, may have different effects on the relationship between financial slack and innovation, we conceptualize environmental dynamism as the overall volatility to which firms are exposed in their external environment: market fluctuations caused by technological, regulatory, economic, and social factors that may require firms to adapt and innovate. In industries characterized by high environmental dynamism, market change is accelerated [48], and greater uncertainty increases the pressure on firms’ operating margins [26,49]. In situations where environmental dynamism is high, a sense of urgency and market pressure can provide strong motivation to respond quickly to environmental change with innovative solutions, irrespective of the availability of financial slack resources. For instance, Paine and Anderson [50] found that organizations view innovation as a necessary means to competitiveness in a dynamic environment. In addition, there is more pressure to prioritize short-term responses and operational flexibility over investing in longer-term innovation projects. In other words, firms are more likely to focus on allocating funds toward financial obligations to stabilize business operations, including the need to secure immediate and necessary financial obligations [44]. Considering the high level of uncertainty in dynamic environments, firms will be inclined to practice extensive caution and conserve their resources, keeping them liquid for unforeseen challenges. Contrary to responding aggressively during a downturn, as suggested by Wan and Yiu [51], firms in uncertain environments are more inclined to hedge against market volatility by avoiding long-term commitments to innovation projects.
Typically, markets characterized by low environmental dynamism tend to be more stable and predictable because there are fewer external disruptions to manage. Although this may result in lower equity returns and fewer funding opportunities [52], we contend that firms can still capitalize on the opportunities presented by low environmental dynamism. To begin with, firms may be motivated to engage in more ambitious, long-term innovation projects. The lower rate of change in the market environment allows firms to plan and invest in innovation efforts and leverage their financial slack for sustainable growth. Indeed, organizations are more inclined to invest in innovation projects when they anticipate a relatively stable market, as this would reduce the risk of market shifts undermining their efforts. Thus, we argue that firms competing in a market with lower environmental dynamism tend to engage in more innovation activities than firms operating in a more dynamic environment as the level of financial slack resources rises. Therefore, we hypothesize the following:
Hypothesis 3.
The positive effect of financial slack and innovation activity is weaker when the environmental dynamism is stronger.
2.4. Effects of Environmental Complexity on Financial Slack and Innovation Activity
Environmental complexity, characterized by the degree of heterogeneity and dispersion of an organization’s activities within an industry [23,26,36], can influence organizational structure [26], complicate information processes for strategic decisions [23], and impact technological innovation [43,53]. High levels of environmental complexity heighten the differences between firms and complicate the challenges. As a result, firms tend to prioritize resources on managing these external challenges rather than on innovation activities [25]. For example, in industries facing a wide range of technologies, firms are more likely to allocate slack resources to operational flexibility in response to complex environmental demands than to R&D investment [27]. Complexity requires a firm to build capabilities across a broader range of activities to operate effectively. For instance, navigating through heterogeneous market segments and varied regulatory landscapes consumes resources, diverting attention and financial slack from innovative activities [54]. Moreover, high levels of complexity can overwhelm an organization’s decision-making processes [55]. Dealing with diverse and multifaceted challenges can lead to indecision or conservative strategies. As a result, financial slack is more likely to be allocated to the management of complexity than to innovation.
The opposite is generally true for low environmental complexity. In such settings, firms experience a relatively predictable market structure [56,57] due to reduced variability across firms, activities, and linkages [58]. This predictability reduces the risks associated with innovation. Accordingly, firms are able to allocate their financial resources to embark on more ambitious projects. In addition, firms in low-complexity environments tend to have a narrower operational scope. This, in turn, simplifies the process of identifying and prioritizing innovation strategies. With more focused innovation strategies, firms can pursue these targeted innovations more proactively, strengthening the relationship between financial slack and innovation. Therefore, we argue that firms operating in a market with lower environmental complexity tend to engage in more innovation activities than firms operating in a complex environment. We hypothesize as follows:
Hypothesis 4.
The positive effect of financial slack and innovation activity is weaker when environmental complexity is stronger.
3. Method
3.1. Data and Sample
We collected data from Compustat and the Center for Research in Security Prices (CRSP) database under the three-digit standard industrial code (SIC) 737 (computer programming, data processing, and other computer-related services). The United States leads the world in the software and information technology (IT) services industry, which is knowledge-intensive and plays a vital role in driving economic growth in the United States. The computer industry is an ideal subject for this study because firms in R&D-intensive industries engage in a continuous “arms race” for innovation. In addition, the United States’ computer industry offers a plethora of information on R&D effort implications. After excluding observations with missing financial information, our final sample provides unbalanced panel data for 578 firms, comprising 3718 firm-year observations from 1998 to 2019.
3.2. Measures and Variables
Dependent variable: Innovation activity. Firms’ innovation activities are observed in their R&D spending and can be used to assess inputs in the innovation process. We use R&D intensity, computed as the ratio of R&D expenditures to total sales in the focal year [59,60], which is commonly used as a proxy for innovation investment.
Independent variable: Unabsorbed slack. Annual financial accounting data are used to measure financial slack. Following prior research [33,60], we compute the quick ratio as the ratio of cash and short-term securities to current liabilities, which is a standard financial metric used to measure a firm’s short-term liquidity and ability to cover its immediate obligations. This measure reflects the amount of funds a firm can allocate toward innovation activities.
Moderating variables: Consistent with Dess and Beard [23] and Boyd [24], environmental munificence and dynamism are calculated using industry-level data over a five-year period. Munificence. The industry’s sales growth rate serves as an important signal of munificence as it reflects an expanding output [40]. We calculate the average growth of total sales over a five-year period for each three-digit classification in one industry by the year studied. Then, the regression slope coefficient divided by the mean value that captures the growth rate of industry sales is used to measure the industry’s munificent environment. Dynamism. The measure of dynamism has typically been the volatility of industry sales [26]. Adopting a similar approach to the one used to measure munificence, we measure dynamism as the standard error of the regression slope coefficient divided by the mean value to represent the volatility of industry growth sales. Complexity. Consistent with the extant literature, we operationalize complexity by assessing the heterogeneity and industry concentration of industry participants using the Herfindahl-Hirschman index (HHI) [36,61]. The HHI is calculated by summing the squares of the total market share and the sales of each firm within each three-digit industry. The HHI variable can take values between 0 and 1, where a value close to 1 indicates greater market concentration.
Control variables. Previous studies have shown that several variables can influence the level of innovation activities. First, we control the firm age by subtracting the initial public offering (IPO) date from the year of the data being analyzed [62]. Firm age is a common control in studies of innovation and financial slack because older firms tend to have more established routines and stable cash flows compared to younger firms that are more aggressive in R&D as they seek to establish themselves in the market. Second, firm size has been shown to influence R&D expenditure because larger firms typically have greater access to resources, while smaller firms may be subject to resource constraints [63,64]. We measure firm size by market capitalization. Market capitalization (market cap) is calculated by multiplying the closing price of a stock by the number of outstanding shares and then log-transformed to improve the distribution normality. To account for firms’ forward-looking performance, we measure Tobin’s Q as the market value of a firm relative to the replacement value of its assets [65,66]. Higher values of Tobin’s Q indicate that investors are expecting strong future performance [67], which may lead firms to allocate more resources to R&D. Next, to control the demand changes and stage of products’ life cycle, we control sales growth, measured as the percent change in annual sales. To control the effect of business operations, we use cash flow, which is rescaled to make the coefficient estimates more interpretable. As a multifaceted measurement of financial slack [9,68], it could lead to different outcomes for innovation; we control for absorbed and potential slack following prior literature on slack. Absorbed slack is calculated as selling, general, and administrative expenses divided by sales, while potential slack is calculated as total liabilities divided by shareholder equity [9,33,60,68]. Potential slack was also rescaled. Finally, we control differences in macroeconomic conditions by including year effects and annual changes in the Dow Jones Industrial Average (DJIA) Index.
We test our hypotheses using the fixed-effects regressions modeling to incorporate any omitted and unobserved firm-specific heterogeneity factors that may affect innovation activities. A Hausman test showed that the fixed-effects model is appropriate for the unbalanced panel data.
4. Results
Table 1 displays the means, standard deviations, and correlations of the key variables. Although the correlations between our variables are mostly low, the correlation between absorbed slack and R&D intensity is high (r = 0.90), suggesting that firms with higher absorbed slack tend to commit more resources to innovation. However, the results demonstrate the absence of multicollinearity, as indicated by our variance inflation factor (VIF; mean VIF = 1.04, maximum VIF = 1.09). These values are significantly below the accepted threshold of 10, suggesting that multicollinearity is not a concern in our estimations. We note the variability in financial slack and environmental variables, indicating that different financial management strategies and different environments can capture distinct conditions of the computer-related industry context.

Table 1.
Descriptive statistics and correlations.
Table 2 summarizes the results of the fixed-effects regression estimation. Model 1 serves as the control model. Model 2 tests Hypothesis 1 by including a main effect for the financial slack variable. Models 3–5 test Hypotheses 2–4 by introducing two-way interaction terms between financial slack and three environmental dimensions to the regression equation. Model 6 is the fully specified model for innovation activities.
Table 2.
Fixed-effects regression analysis of financial slack and innovation activities.
In Model 1, firm age, cash flows, market capitalization, changes in the DJIA Index, and absorbed slack are associated with higher levels of innovation activity, whereas Tobin’s Q, growth rate in sales, potential slack, munificence, dynamism, and complexity are associated with lower levels of innovation activity.
In Model 2, financial slack is positively associated with innovation activity (b = 0.049, p < 0.010), suggesting firms can allocate more financial resources to fund their innovation initiatives. In other words, when firms have available financial resources that are not already tied up in other ventures, they are better positioned to invest in innovative projects. Thus, our results support Hypothesis 1, consistent with earlier studies [68,69]. However, Sari [70] found a negative impact of financial slack on firm innovativeness, indicating that excess financial resources may sometimes lead to inefficiencies in innovation efforts. This contrast highlights the need to consider contextual factors when examining the relationship between financial slack and innovation.
Models 3, 4, and 5 include the two-way interaction effects between financial slack and the three environmental dimensions. In Model 3, environmental munificence has a statistically significant negative effect on financial slack and innovation activities (b = −0.029, p < 0.014), thus supporting Hypothesis 2. This suggests that a higher level of environmental munificence has a more negative impact on a firm’s innovation activities as they manage more financial slack resources. In an environment of plentiful resources, firms may not feel compelled to use internal slack because they have easier access to capital from alternative sources, such as venture capital or government grants. Similarly, in Model 4, environmental dynamism has a statistically significant negative effect on financial slack and innovation activities (b = −0.130, p < 0.041), supporting Hypothesis 4. This suggests that greater environmental dynamism has a more negative effect on a firm’s innovation activities as they manage more financial slack resources. In volatile and changing environments, firms may be reluctant to invest financial slack in R&D due to uncertainty. Instead, they may prioritize short-term cost control or defensive strategies. Uncertainty discourages firms from using financial slack to innovate, while slack is a strong enabler of R&D in stable environments. This effect remains significant in the full model, as indicated in Model 6. Finally, in Model 5, the interaction effect between financial slack and environmental complexity is positive and non-significant (b = 0.012, p < 0.223), thus failing to support Hypothesis 5. This finding suggests that greater financial slack does not result in different levels of innovation activity in a complex environment.
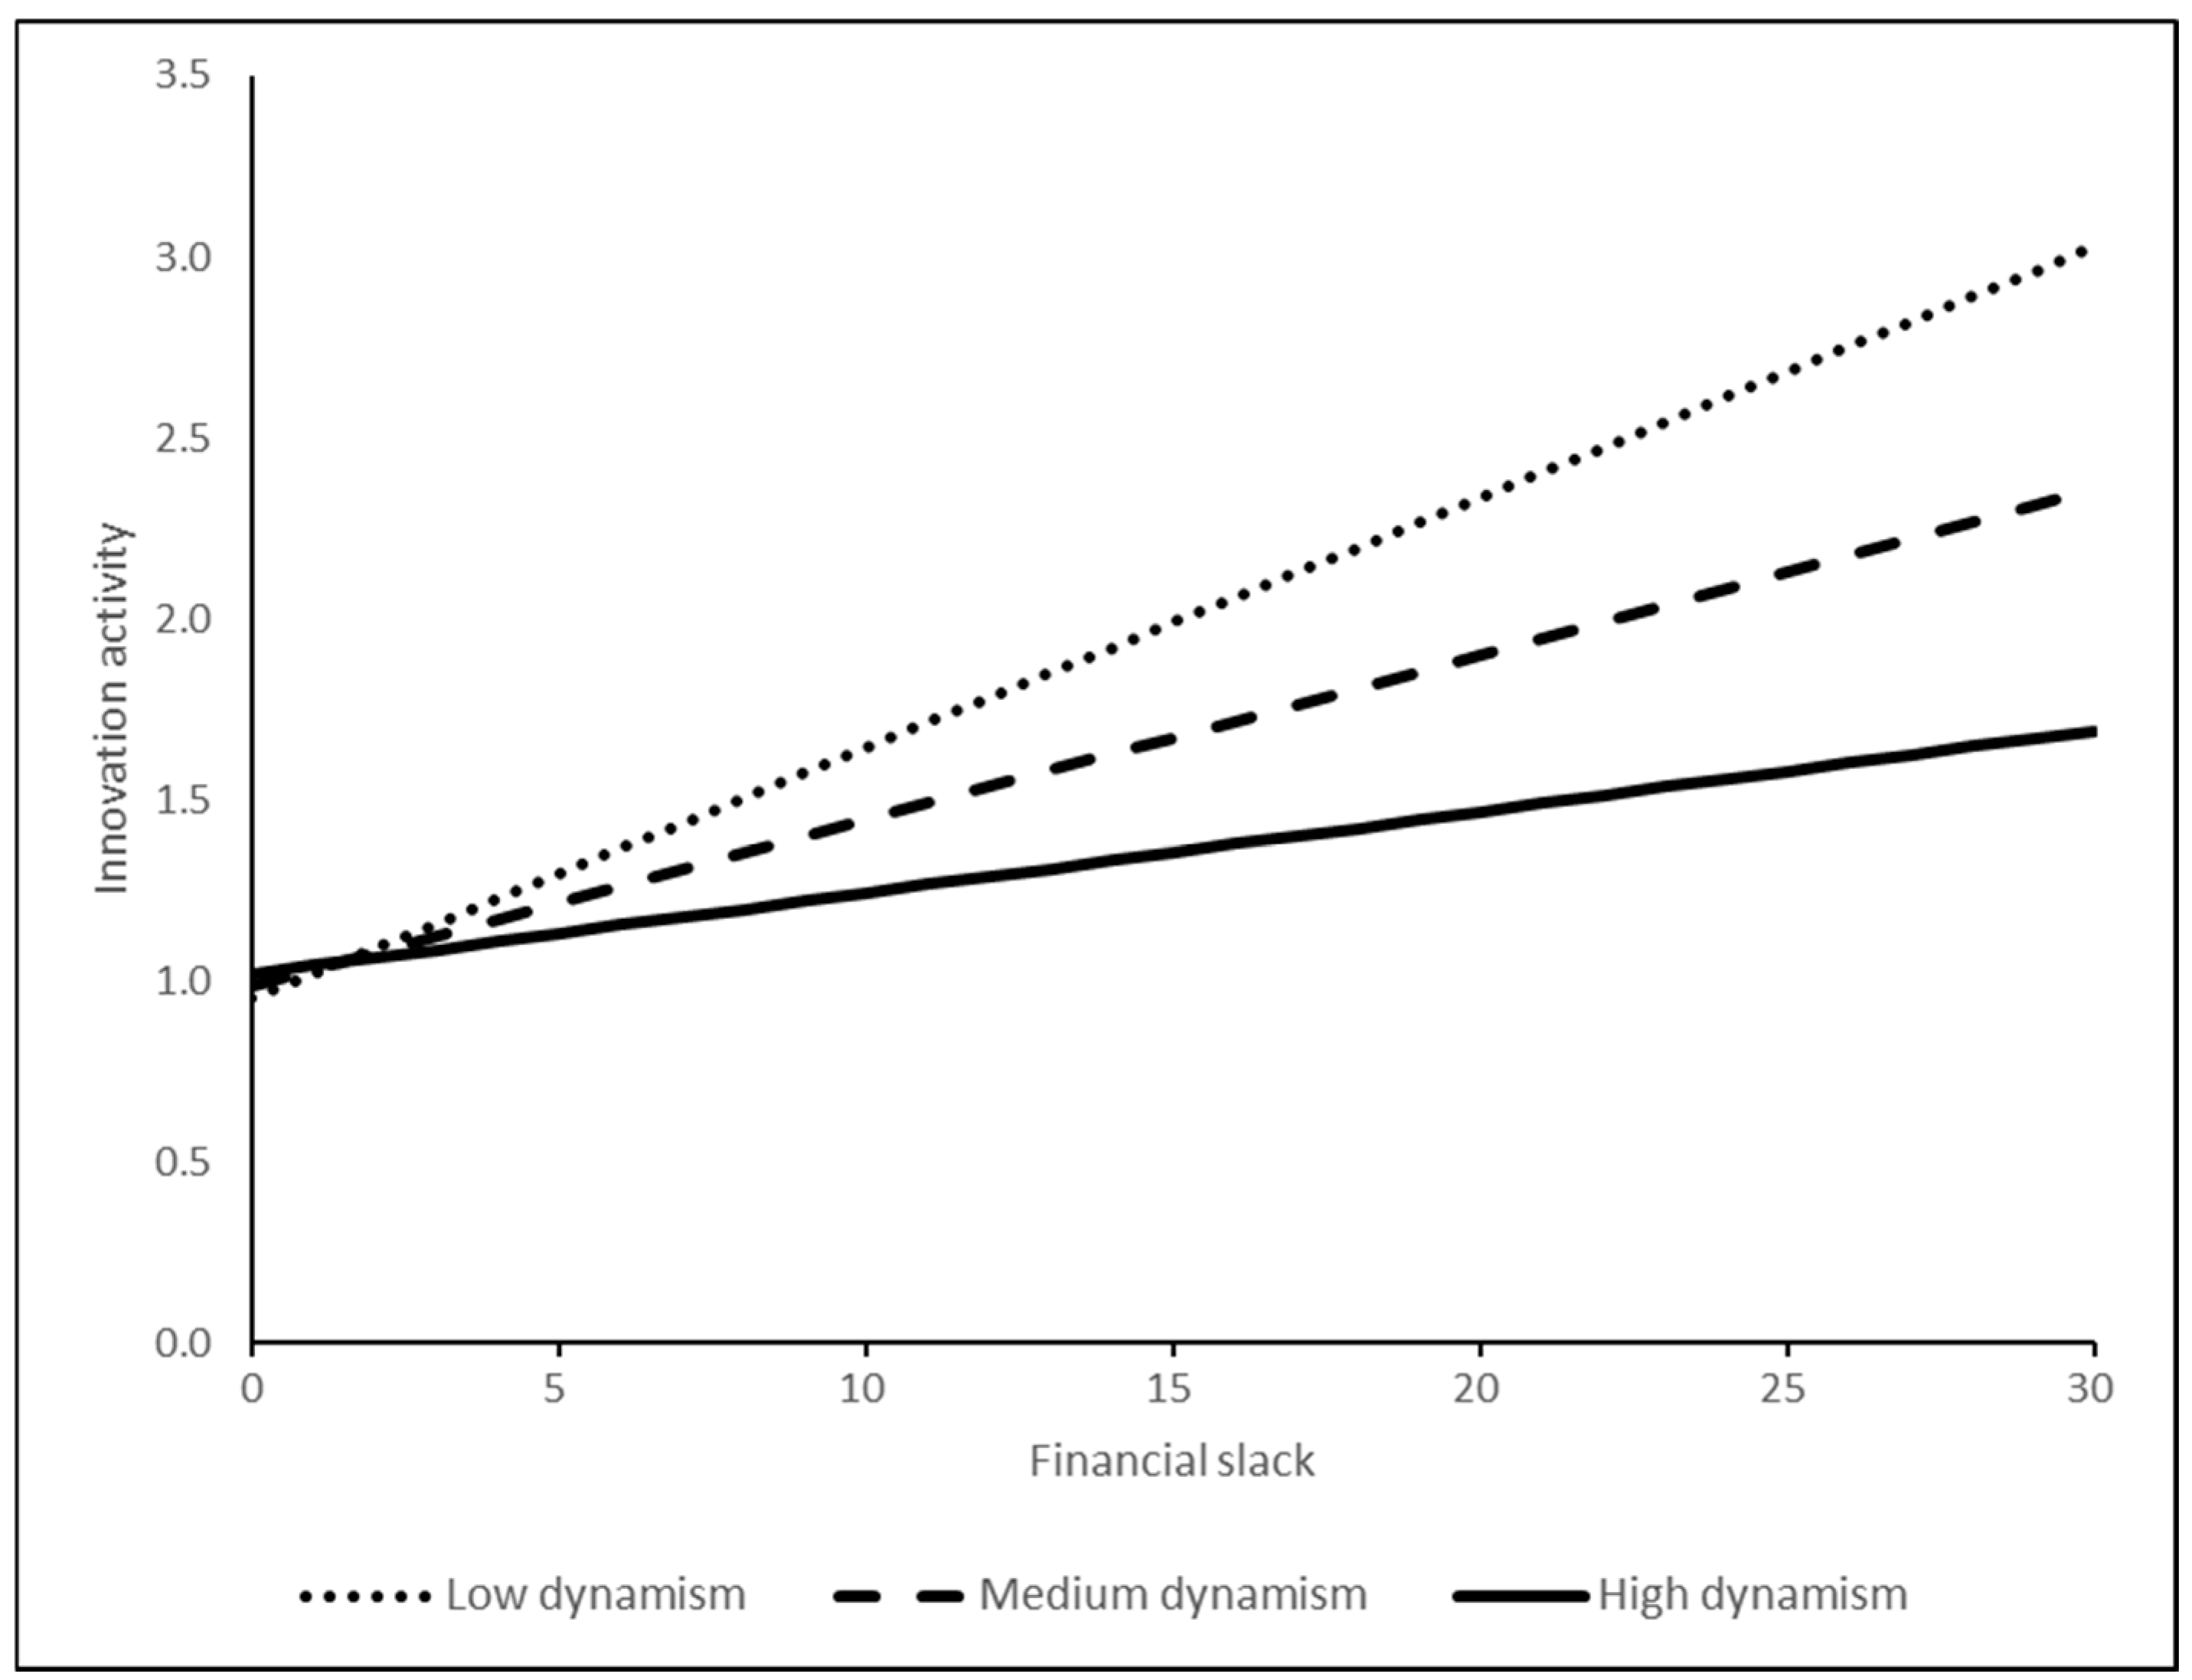
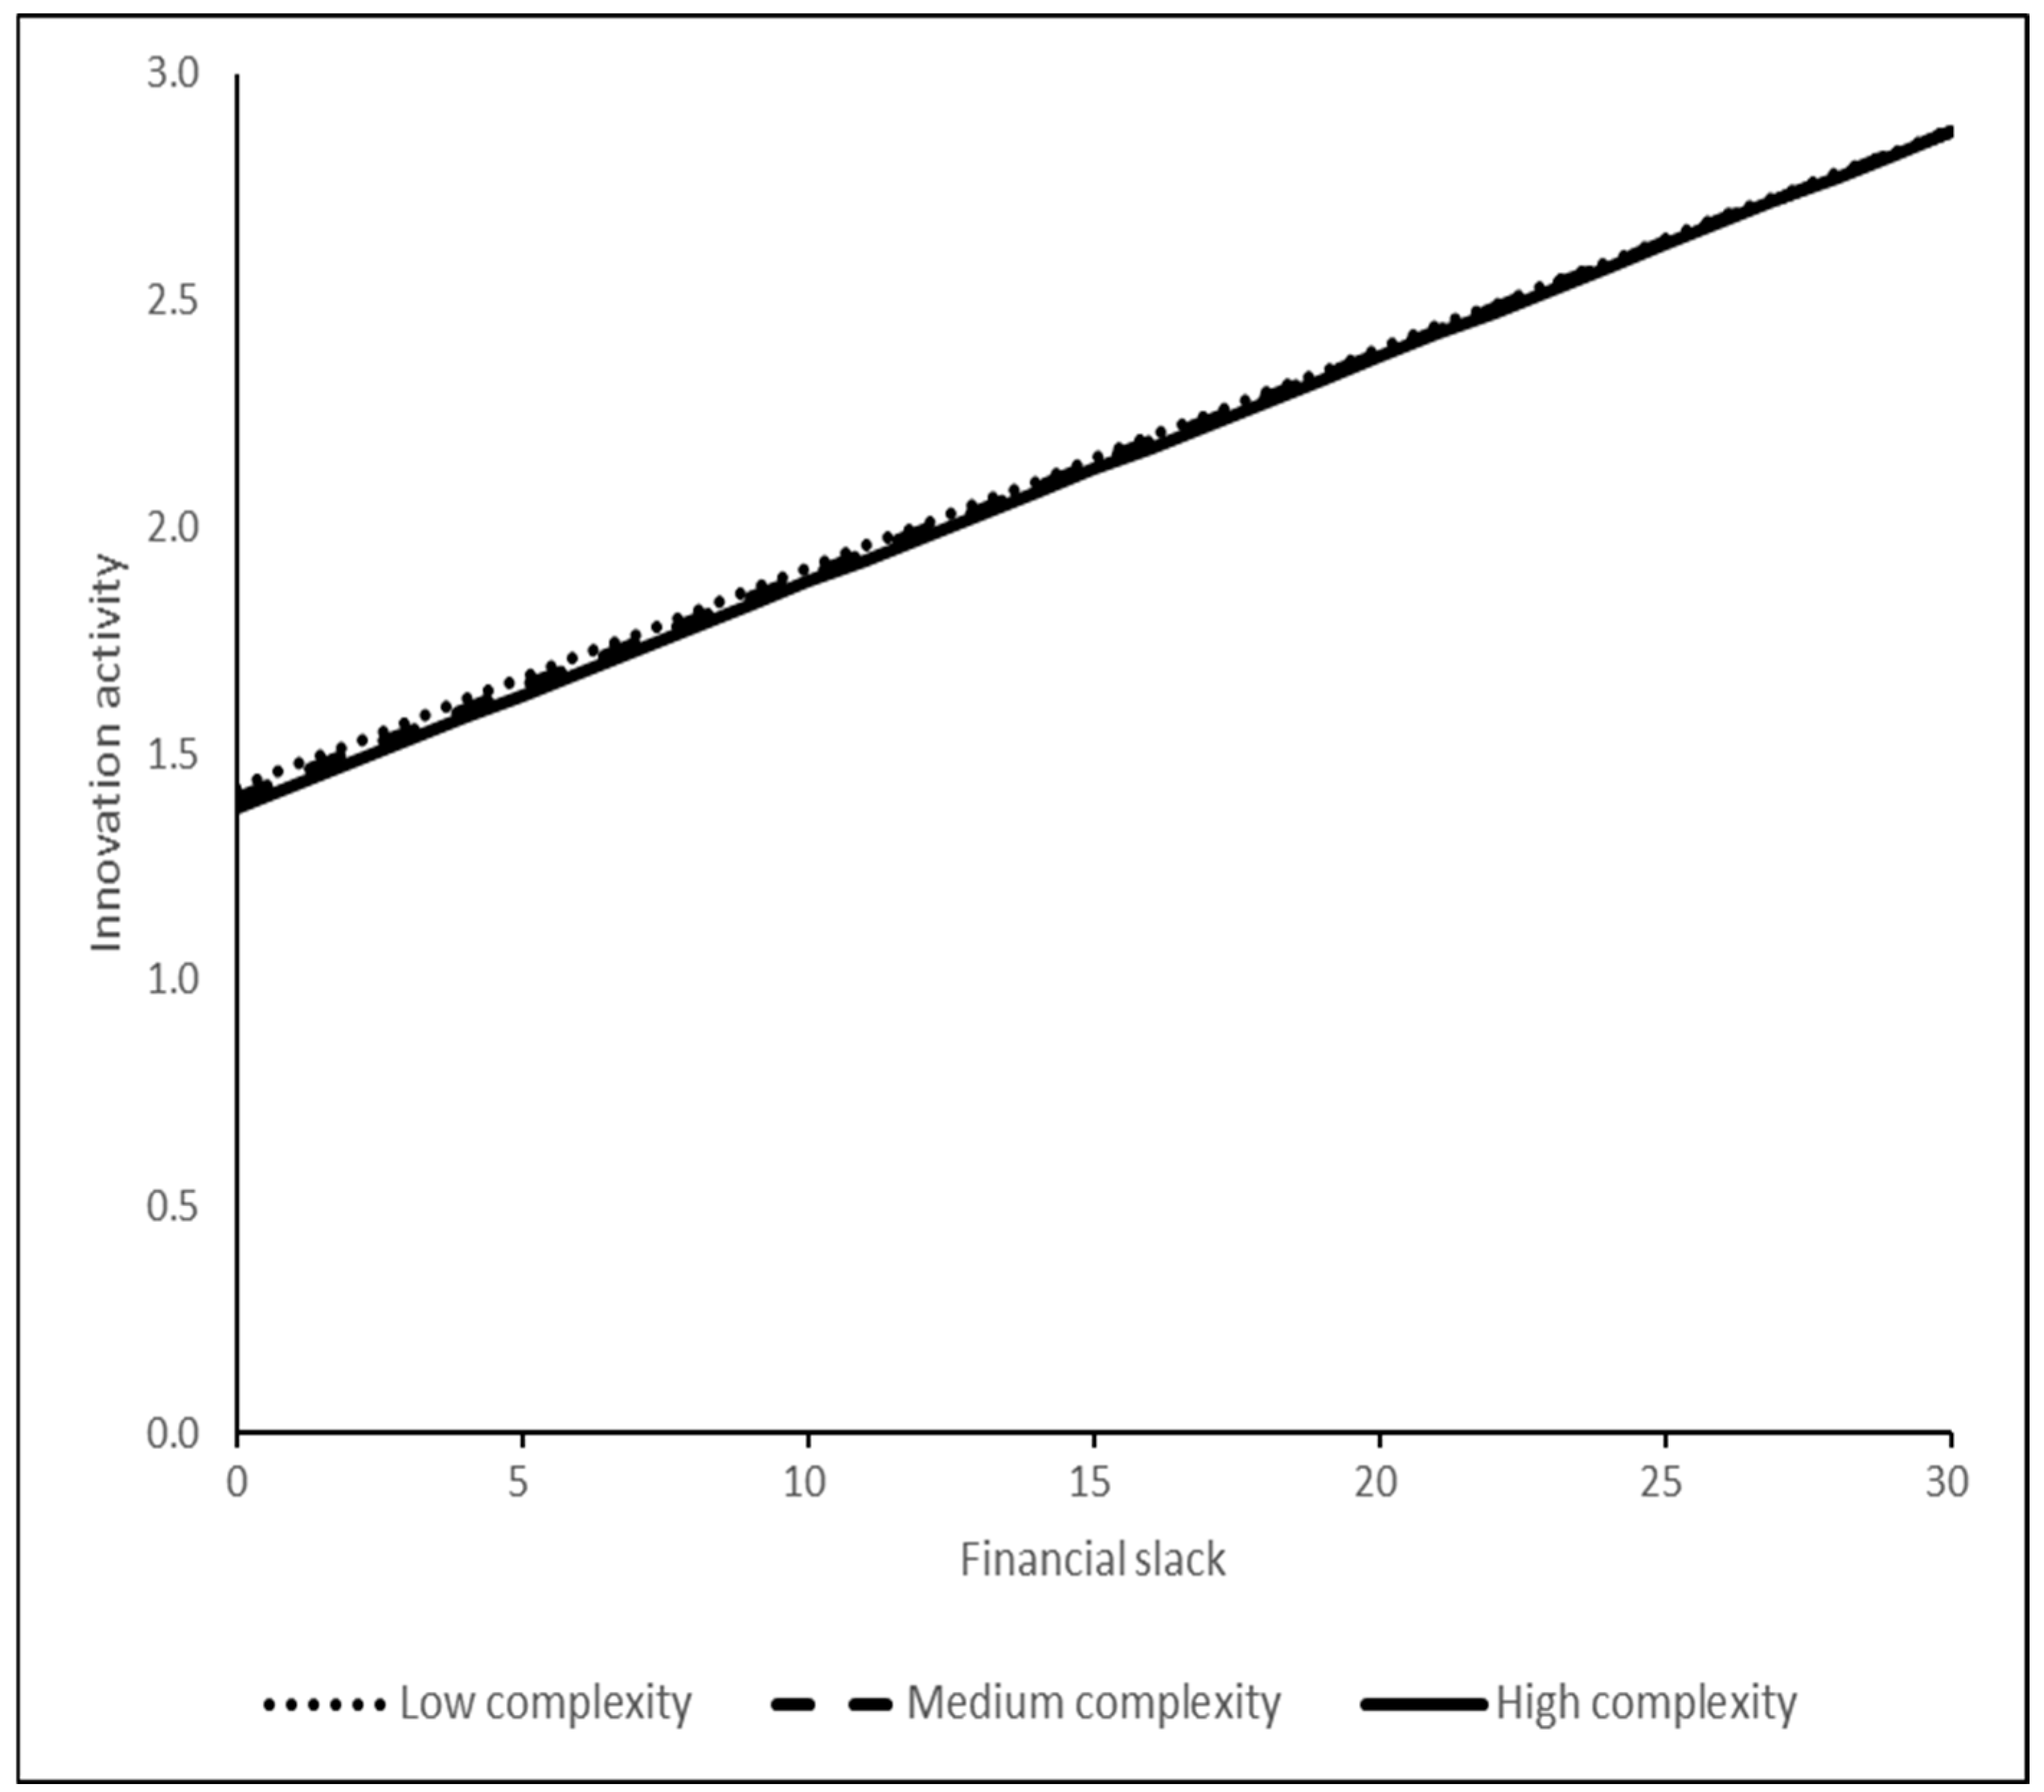
Figure 1 illustrates the innovation activities of computer-related firms in varying munificent environments and shows greater innovation activity losses for firms with more financial slack as munificence increases above the mean (0.07 dashed line; SD + 1, 0.55, solid line; SD − 1, −0.41, dotted line) from Model 3. Specifically, the steepest slope (dotted line) represents low munificence, suggesting that in less resourced environments, financial slack has the strongest positive effect on innovation activity. In contrast, the flattest slope (solid line) represents high munificence, indicating that in resource-abundant environments, the influence of financial slack on innovation activity is weaker. The marginal effects of financial slack are 0.05 (p < 0.001) for low munificence and 0.034 (p < 0.01) for high munificence, with their difference being statistically significant (χ2 = 4.32, p < 0.05). Figure 2 shows a similar trend in dynamic environments, in which increased financial slack leads to more innovation losses as dynamism increases above the mean (0.45 dashed line; SD + 1, 0.63, solid line; SD − 1, 0.27, dotted line) from Model 4. Specifically, the steepest slope (dotted line) represents low dynamism, implying that in stable environments, financial slack has the strongest positive effect on R&D investment. In contrast, the flattest slope (solid line) represents high dynamism, indicating that in volatile environments, financial slack has a more dampening effect on R&D investment. The marginal effects of financial slack are 0.104 (p < 0.001) for low dynamism and 0.022 (p < 0.1) for high dynamism, with their difference being statistically significant (χ2 = 9.77, p < 0.01). However, Figure 3, based on Model 5, indicates that in complex environments, firms’ innovation activities are not significantly affected by their financial slack levels. That is, the slopes of the lines nearly overlap, suggesting that environmental complexity does not appear to alter how firms use financial slack for innovation. The marginal effects of financial slack are 0.048 (p < 0.001) in low complexity and 0.049 (p < 0.01) in high complexity, and their difference is statistically non-significant (χ2 = 0; p > 0.10).
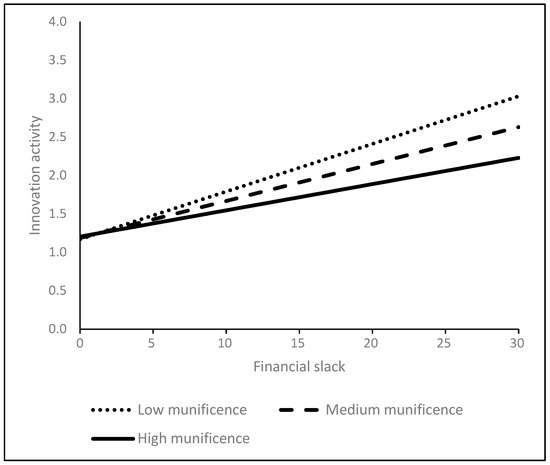
Figure 1.
The effects of environmental munificence on financial slack and innovation.
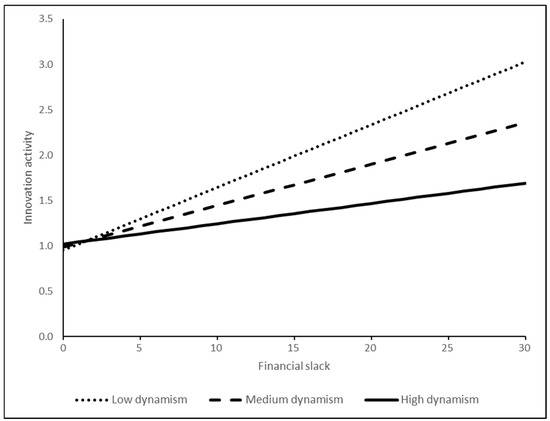
Figure 2.
The effects of environmental dynamism on financial slack and innovation.
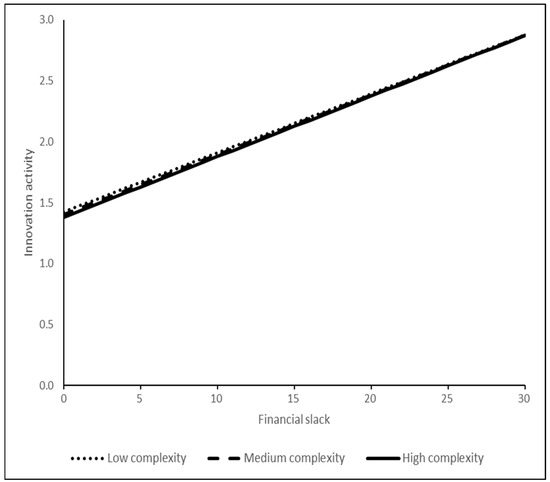
Figure 3.
The effects of environmental complexity on financial slack and innovation.
5. Discussion
Innovation is a continuous endeavor for organizations. While existing research has established a link between financial slack and performance relationships, we are still unclear about how the innovation activities of firms respond to financial slack resources. Chattopadhyay, Glick, and Huber [71] emphasized that changes in the external environment force organizations to adapt. This study sheds light on how varying external environments contribute to or challenge organizations’ efforts in innovation. We empirically test our hypotheses in the context of computer-related R&D investments between 1998 and 2019, arguing that each of the three environmental dimensions would weaken the benefits of financial slack resources and innovation activities. In our analysis, financial slack is a positive and significant predictor of innovation activities (Hypothesis 1, supported). Our findings also show that the financial slack–innovation relationship is weakened for firms operating in munificent and dynamic environments (Hypothesis 2 and 3, supported), but not in complex environments (Hypothesis 4, unsupported).
Our findings indicate that financial slack is a critical resource and that firms with financial slack resources undertake innovation initiatives by investing in R&D. This is in line with the behavior theory of the firm (BTOF) view that firms with financial slack resources are better positioned to capitalize on opportunities [6] and reinforces the resource-based view (RBV) perspectives [72]. This is because financial slack provides firms with the necessary funds and mitigates the risks associated with cash flow volatility, which allows firms to pursue innovation endeavors that may not yield immediate financial returns.
Our results also indicate that greater levels of financial slack have a more negative impact on a firm’s innovation activities when competing in a more munificent environment. As predicted, in resource-rich environments, the relative advantage of having additional financial resources diminishes. Firms in such environments may not feel the need to allocate their slack resources toward innovation activities, as the environment itself provides ample opportunities and resources. Conversely, firms competing in low munificent environments would be more compelled to direct their financial resources toward risky innovation activities that may yield significant outcomes [73].
Contrary to conventional beliefs, our findings also show that higher levels of financial slack resources have a negative association with a firm’s innovation activities when competing in a more dynamic environment. In dynamic environments, firms are exposed to greater uncertainty and risk [25]. In such volatile environments, the pressing need to stabilize operations can lead to a short-term focus, thereby reducing the benefits of financial slack for R&D investment. Our findings indicate that environments with lower dynamism offer a more conducive backdrop for innovation activities. Highly dynamic environments require adjustments to changing conditions, a shift in focus from long-term innovation to short-term survival, and necessitate the diversion of financial slack resources to address immediate needs. Conversely, in less dynamic environments, the motivation and opportunities for long-term innovation, along with fewer constraints on resource allocation, facilitate the ability of firms to effectively use financial slack for innovative purposes. This finding is consistent with Gilley et al.’s [45] observation that firms in stable and predictable environments tend to benefit more from risk-taking. We speculate that firms in stable environments find it easier to forecast returns, allowing them to make more confident long-term investments. With fewer unexpected market fluctuations or operational crises, managers can allocate financial slack to R&D investments rather than diverting resources to address short-term challenges. The non-significance of environmental complexity on a firm’s innovation activities when it manages more financial slack could be because innovation-driven competition can take place in any market context, from perfect competition to oligopoly, regardless of the level of environmental complexity. For instance, Samsung Electronics consistently allocates significant financial resources to its R&D efforts, enabling the company to address diverse challenges such as varying regulatory standards, rapidly changing consumer preferences, and intense competition. This strategic approach enabled Samsung to develop its flagship Galaxy smartphone series, thereby demonstrating Samsung’s ability to effectively navigate in complex markets. It is important to emphasize that our results show that financial slack continues to have a positive effect in complex environments. This implies that firms enjoying high financial slack are better positioned to manage challenges because they have access to a larger pool of resources dedicated to supporting innovation efforts that address the intricacies of complex environments. Consequently, firms that invest their financial slack in R&D could potentially address their complexities more effectively.
These results have important implications for organizational theory. Our findings extend the RBV by confirming that financial slack is a critical internal resource that facilitates R&D investment. However, we also show that the effectiveness of these internal resources is not uniform, but varies with the external environment, adding nuance to the traditional RBV. Moreover, our findings substantiate the importance of debates on financial slack and performance relationships. Given the contradictions in prior studies, it is necessary to investigate the moderating role of more context-specific factors, emphasizing that the effectiveness of internal resources depends on external conditions. By considering various environmental dimensions in which organizations operate, this study provides a more comprehensive understanding of the relationship between financial slack and innovation, recognizing that organizations within industries function as social systems. Understanding how the environment affects financial slack and innovation activities can help organizations develop more effective strategies to improve their innovation strategies in different environmental markets [14,68,74,75].
Our study also has some practical implications for managers. The results of this study highlight the importance of considering environmental dimensions when examining the relationship between financial slack and innovation. Managers should be cautious about assuming that an abundance of financial slack in munificent and dynamic environments inherently translates to increased innovation. Instead, a nuanced approach to allocating resources is essential for organizations to succeed in an ever-changing environment. For example, in abundant environments, managers should take advantage of the wide range of external resources available and reduce reliance on internal slack. In unpredictable environments, agile resource allocation is critical, enabling managers to quickly reallocate financial slack in response to market volatility and immediate operational challenges. Organizations should actively foster a culture that encourages continuous innovation, even in resource-abundant and stable settings, to avoid the potential pitfalls of complacency. By doing so, managers would benefit from assessing market movements prior to making commitments in innovation investments and allocating resources that best fit their organization.
This study has some limitations. First, we examined data on a specific computer service industry in the United States; therefore, our findings may not be generalizable to other industries or regions. Future research should examine different types of industries and geographical settings to increase generalizability. Next, our analysis focuses on publicly listed firms and excludes private firms because private firms tend to keep their financial information confidential. Private firms may have distinct financial and resource constraints relative to publicly listed firms. Therefore, researchers could consider collecting data through surveys or interviews to gain insights into their financial slack and innovation activities. Moreover, while our study focuses on financial slack, firms have different types of slack—such as human capital and social ties—that may affect innovation in different ways [76]. Similarly, other environmental factors, including regulatory changes, policy shifts, and technological heterogeneity, could also shape the relationship between slack and innovative activity. Examining these additional dimensions would provide a more complete understanding of how slack and environmental contingencies drive innovation. Lastly, it is important to note that higher R&D expenditure does not necessarily yield breakthroughs or marketable products. Therefore, future research could use alternative measures of innovation, such as patent citations and new product releases.
Author Contributions
Conceptualization, H.K.Y. and T.K.; writing—original draft preparation, H.K.Y.; methodology, H.K.Y. and M.K.; analysis, M.K.; writing—review and editing, M.K. and T.K.; supervision, T.K. All authors have read and agreed to the published version of the manuscript.
Funding
This research received no external funding.
Data Availability Statement
Authors may provide data upon request.
Conflicts of Interest
The authors declare no conflicts of interest.
References
- Qiao, N.; Niu, L. The Impact of the Industrial Innovation Ecosystem on Innovation Performance—Using the Equipment Manufacturing Industry as an Example. Systems 2023, 12, 578. [Google Scholar] [CrossRef]
- Bierly, P.; Chakrabarti, A. Generic knowledge strategies in the U.S. pharmaceutical industry. In Knowledge and Strategy; Zack, M.H., Ed.; Routledge: London, UK, 2009; pp. 231–250. [Google Scholar]
- Griliches, Z. Patent statistics as economic indicators: A survey. Natl. Bur. Econ. Res. 1990, 28, 1661–1707. [Google Scholar]
- Miller, D.J. Firms’ technological resources and the performance effects of diversification: A longitudinal study. Strateg. Manag. J. 2004, 25, 1097–1119. [Google Scholar] [CrossRef]
- Bourgeois, L.J., III; Singh, J.V. Organizational slack and political behavior among top management teams. Acad. Manag. Proc. 1983, 1983, 43–47. [Google Scholar]
- Cyert, R.; March, J. A Behavioral Theory of the Firm; Prentice-Hall: Englewood Cliffs, NJ, USA, 1963. [Google Scholar]
- Marlin, D.; Geiger, S.W. A reexamination of the organizational slack and innovation relationship. J. Bus. Res. 2015, 68, 2683–2690. [Google Scholar] [CrossRef]
- Nohria, N.; Gulati, R. What is the optimum amount of organizational slack? A study of relationship between slack and innovation in multinational firms. Acad. Manag. Proc. 1995, 1995, 32–36. [Google Scholar]
- Bourgeois, L.J., III. On the measurement of organizational slack. Acad. Manag. Rev. 1981, 6, 29–39. [Google Scholar] [CrossRef]
- Nohria, N.; Gulati, R. Is slack good or bad for innovation? Acad. Manag. J. 1996, 39, 1245–1264. [Google Scholar] [CrossRef]
- Agustí, M.; Velasco, F.; Galán, J.L. The dynamic slack-performance relationship from an efficiency perspective. Manag. Decis. Econ. 2021, 42, 850–862. [Google Scholar] [CrossRef]
- Herold, D.M.; Jayaraman, N.; Narayanaswamy, C.R. What is the relationship between organizational slack and innovation? J. Manag. Issues 2006, 18, 372–392. [Google Scholar]
- Baldridge, J.V.; Burnham, R.A. Organizational innovation: Individual, organizational, and environmental impacts. Adm. Sci. Q. 1975, 20, 165–176. [Google Scholar] [CrossRef]
- McArthur, A.W.; Nystrom, P.C. Environmental dynamism, complexity, and munificence as moderators of strategy-performance relationships. J. Bus. Res. 1991, 23, 349–361. [Google Scholar] [CrossRef]
- Barney, J. Firm resources and sustained competitive advantage. J. Manag. 1991, 17, 99–120. [Google Scholar] [CrossRef]
- Dahan, G.; Shoham, A. The relationship between strategic orientations and firm performance: Is environmental munificence the missing link? J. Strateg. Manag. 2023, 16, 264–281. [Google Scholar] [CrossRef]
- Hansen, G.S.; Wernerfelt, B. Determinants of firm performance: The relative importance of economic and organizational factors. Strateg. Manag. J. 1989, 10, 399–411. [Google Scholar] [CrossRef]
- Azeem, A.; Naseem, M.A.; Ali, R.; Ali, S.C. How does environmental performance contribute to firm financial performance in a multi-country study? Mediating role of competitive advantage and moderating role of voluntary environmental initiatives. J. Knowl. Econ. 2024, 15, 123–145. [Google Scholar] [CrossRef]
- Gao, Y.; Sun, X.; Liu, N.; Zhang, W.; Xu, J. Complex Business Environment Systems and Corporate Innovation. Systems 2024, 12, 360. [Google Scholar] [CrossRef]
- Alessandri, T.; Cerrato, D.; Depperu, D. Organizational slack, experience, and acquisition behavior across varying economic environments. Manag. Decis. 2014, 52, 967–982. [Google Scholar] [CrossRef]
- Hambrick, D.C. High profit strategies in mature capital goods industries: A contingency approach. Acad. Manag. J. 1983, 26, 687–707. [Google Scholar] [CrossRef]
- Rios, L.A. On the origin of technological acquisition strategy: The interaction between organizational plasticity and environmental munificence. Strateg. Manag. J. 2021, 42, 1299–1325. [Google Scholar] [CrossRef]
- Dess, G.G.; Beard, D.W. Dimensions of organizational task environments. Adm. Sci. Q. 1984, 29, 52. [Google Scholar] [CrossRef]
- Boyd, B. Corporate linkages and organizational environment: A test of the resource dependence model. Strateg. Manag. J. 1990, 11, 419–430. [Google Scholar] [CrossRef]
- Palmer, T.B.; Wiseman, R.M. Decoupling risk taking from income stream uncertainty: A holistic model of risk. Strateg. Manag. J. 1999, 20, 1037–1062. [Google Scholar] [CrossRef]
- Keats, B.W.; Hitt, M.A. A causal model of linkages among environmental dimensions, macro organizational characteristics, and performance. Acad. Manag. J. 1988, 31, 570–598. [Google Scholar] [CrossRef]
- Singh, J.V. Performance, slack, and risk taking in organizational decision making. Acad. Manag. J. 1986, 29, 562–585. [Google Scholar] [CrossRef]
- Kim, H.; Kim, H.; Lee, P.M. Ownership structure and the relationship between financial slack and R&D investments: Evidence from Korean firms. Organ. Sci. 2008, 19, 404–418. [Google Scholar]
- Nieto, M.; González-Álvarez, N. Product innovation: Testing the relative influence of industry, institutional context, and firm factors. Technol. Anal. Strateg. Manag. 2014, 26, 1023–1036. [Google Scholar] [CrossRef]
- Geiger, S.W.; Cashen, L.H. A multidimensional examination of slack and its impact on innovation. J. Manag. Issues 2002, 14, 68–84. [Google Scholar]
- Tan, J.J.; Peng, M.W. Organizational slack and firm performance during economic transitions: Two studies from an emerging economy. Strateg. Manag. J. 2003, 24, 1249–1263. [Google Scholar] [CrossRef]
- Thompson, J.D. Organizations in Action: Social Science Bases of Administrative Theory; McGraw-Hill: New York, NY, USA, 1967. [Google Scholar]
- Bromiley, P. Testing a causal model of corporate risk taking and performance. Acad. Manag. J. 1991, 34, 37–59. [Google Scholar] [CrossRef]
- Harrison, J.S.; Coombs, J.E. The moderating effects from corporate governance characteristics on the relationship between available slack and community-based firm performance. J. Bus. Ethics 2012, 107, 409–422. [Google Scholar] [CrossRef]
- Leyva-de la Hiz, D.I.; Ferron-Vilchez, V.; Aragon-Correa, J.A. Do firms’ slack resources influence the relationship between focused environmental innovations and financial performance? More is not always better. J. Bus. Ethics 2019, 159, 1215–1227. [Google Scholar] [CrossRef]
- Aldrich, H. Organizations and Environments; Stanford University Press: Stanford, CA, USA, 2008. [Google Scholar]
- Brittain, J.W.; Freeman, J.H. Organizational proliferation and density-dependent selection: Organizational evolution in the semiconductor industry. In The Organizational Life Cycle; Kimberly, J.R., Miles, R., Eds.; Jossey-Bass: San Francisco, CA, USA, 1980; pp. 291–338. [Google Scholar]
- Pfeffer, J.; Salancik, G.R. The External Control of Organizations: A Resource Dependence Perspective; Stanford University Press: Stanford, CA, USA, 2003. [Google Scholar]
- Lubatkin, M.; Chatterjee, S. The strategy-shareholder value relationship: Testing temporal stability across market cycles. Strateg. Manag. J. 1991, 12, 251. [Google Scholar] [CrossRef]
- Goll, I.; Rasheed, A.M. Rational decision-making and firm performance: The moderating role of the environment. Strateg. Manag. J. 1997, 18, 583–591. [Google Scholar] [CrossRef]
- Koberg, C.S. Resource scarcity, environmental uncertainty, and adaptive organizational behavior. Acad. Manag. J. 1987, 30, 798–807. [Google Scholar] [CrossRef]
- Miller, D.; Friesen, P.H. Strategy-making and environment: The third link. Strateg. Manag. J. 1983, 4, 221–235. [Google Scholar] [CrossRef]
- Staw, B.M.; Szwajkowski, E. The scarcity-munificence component of organizational environments and the commission of illegal acts. Adm. Sci. Q. 1975, 20, 345–354. [Google Scholar] [CrossRef]
- Campbell, J.L. Why would corporations behave in socially responsible ways? An institutional theory of corporate social responsibility. Acad. Manag. Rev. 2007, 32, 946–967. [Google Scholar] [CrossRef]
- Gilley, M.; Walters, B.; Olson, B. Top management team risk-taking propensities and firm performance: Direct and moderating effects. J. Bus. Strateg. 2002, 19, 95–114. [Google Scholar] [CrossRef]
- Miller, D.; Friesen, P.H. Archetypes of strategy formulation. Manag. Sci. 1978, 24, 921–933. [Google Scholar] [CrossRef]
- Mintzberg, H. The Structuring of Organizations; Pearson: Upper Saddle River, NJ, USA, 1979. [Google Scholar]
- Nelson, R.R. An Evolutionary Theory of Economic Change; Harvard University Press: Cambridge, MA, USA, 1985. [Google Scholar]
- Safi, A.; Chen, Y.; Wahab, S.; Zheng, L.; Rjoub, H. Does environmental taxes achieve the carbon neutrality target of G7 economies? Evaluating the importance of environmental R&D. J. Environ. Manag. 2021, 293, 112908. [Google Scholar]
- Paine, F.T.; Anderson, C.R. Contingencies affecting strategy formulation and effectiveness: An empirical study. J. Manag. Stud. 1977, 14, 147–158. [Google Scholar] [CrossRef]
- Wan, W.P.; Yiu, D.W. From crisis to opportunity: Environmental jolt, corporate acquisitions, and firm performance. Strateg. Manag. J. 2009, 30, 791–801. [Google Scholar] [CrossRef]
- Gompers, P.; Lerner, J. The venture capital revolution. J. Econ. Perspect. 2001, 15, 145–168. [Google Scholar] [CrossRef]
- Acs, Z.J.; Audretsch, D.B. Innovation in large and small firms: An empirical analysis. Am. Econ. Rev. 1988, 78, 678–690. [Google Scholar]
- Meyer, J.W.; Scott, W.R. Organizational Environments: Ritual and Rationality; SAGE Publications: Thousand Oaks, CA, USA, 1992. [Google Scholar]
- Tung, R.L. Dimensions of organizational environments: An exploratory study of their impact on organization structure. Acad. Manag. J. 1979, 22, 672–693. [Google Scholar] [CrossRef]
- Godoy-Bejarano, J.M.; Ruiz-Pava, G.A.; Téllez-Falla, D.F. Environmental complexity, slack, and firm performance. J. Econ. Bus. 2020, 112, 105933. [Google Scholar] [CrossRef]
- Xiao, P.; Sun, X. Does internationalization strategy promote enterprise innovation performance? The moderating effect of environmental complexity. Manag. Decis. Econ. 2022, 43, 1721–1733. [Google Scholar] [CrossRef]
- Anderson, P. Organizational environments and industry exit: The effects of uncertainty, munificence, and complexity. Ind. Corp. Chang. 2001, 10, 675–711. [Google Scholar] [CrossRef]
- Baysinger, B.; Hoskisson, R.E. Diversification strategy and R&D intensity in multiproduct firms. Acad. Manag. J. 1989, 32, 310–332. [Google Scholar]
- Greve, H.R. Performance, aspirations, and risky organizational change. Adm. Sci. Q. 1998, 43, 58–86. [Google Scholar] [CrossRef]
- Cannon, A.R.; John, C.H. Measuring environmental complexity: A theoretical and empirical assessment. Organ. Res. Methods 2007, 10, 296–321. [Google Scholar] [CrossRef]
- Mousa, F.T.; Chowdhury, J. Organizational slack effects on innovation: The moderating roles of CEO tenure and compensation. J. Bus. Econ. Manag. 2014, 15, 369–383. [Google Scholar] [CrossRef]
- Cohen, W.M.; Klepper, S. Firm size and the nature of innovation within industries: The case of process and product R&D. Rev. Econ. Stat. 1996, 78, 232–243. [Google Scholar]
- Shefer, D.; Frenkel, A. R&D, firm size and innovation: An empirical analysis. Technovation 2005, 25, 25–32. [Google Scholar]
- Deb, P.; David, P.; O’Brien, J.P.; Duru, A. Attainment discrepancy and investment: Effects on firm performance. J. Bus. Res. 2019, 99, 186–196. [Google Scholar] [CrossRef]
- Richard, P.J.; Devinney, T.M.; Yip, G.S.; Johnson, G. Measuring organizational performance: Towards methodological best practice. J. Manag. 2009, 35, 718–804. [Google Scholar] [CrossRef]
- Du, D. Investment risk, financial slack, and the value of capital: A dynamic stochastic model. J. Financ. Econ. 2024, 145, 123–145. [Google Scholar]
- Daniel, F.; Lohrke, F.T.; Fornaciari, C.J.; Turner, R.A. Slack resources and firm performance: A meta-analysis. J. Bus. Res. 2004, 57, 565–574. [Google Scholar] [CrossRef]
- Carnes, C.M.; Xu, K.; Sirmon, D.G.; Karadag, R. How competitive action mediates the resource slack–performance relationship: A meta-analytic approach. J. Manag. Stud. 2019, 56, 57–90. [Google Scholar] [CrossRef]
- Sari, P.A.M. The influence of financial slack on firm innovativeness: The moderating role of board size. Int. J. Acad. Res. Bus. Soc. Sci. 2023, 13, 1–20. [Google Scholar] [CrossRef]
- Chattopadhyay, P.; Glick, W.H.; Huber, G.P. Organizational actions in response to threats and opportunities. Acad. Manag. J. 2001, 44, 937–955. [Google Scholar] [CrossRef]
- Wernerfelt, B. A resource-based view of the firm. Strat. Manag. J. 1984, 5, 171–180. [Google Scholar] [CrossRef]
- Sitkin, S.B.; Pablo, A.L. Reconceptualizing the determinants of risk behavior. Acad. Manag. Rev. 1992, 17, 9–38. [Google Scholar] [CrossRef]
- Bradley, S.W.; Shepherd, D.A.; Wiklund, J. The importance of slack for new organizations facing ‘tough’ environments. J. Manag. Stud. 2011, 48, 1071–1097. [Google Scholar] [CrossRef]
- Du, Y.; Kim, P.H.; Fourné, S.; Wang, X. In times of plenty: Slack resources, R&D investment, and entrepreneurial firms in challenging institutional environments. J. Bus. Res. 2022, 145, 360–376. [Google Scholar]
- Teng, D.; Li, C.; Sun, X.; Tanna, S.C. Founder as the microfoundation of slack resource and firms’ RCD investment. J. Manag. Organ. 2023, 29, 77–98. [Google Scholar]
Disclaimer/Publisher’s Note: The statements, opinions and data contained in all publications are solely those of the individual author(s) and contributor(s) and not of MDPI and/or the editor(s). MDPI and/or the editor(s) disclaim responsibility for any injury to people or property resulting from any ideas, methods, instructions or products referred to in the content. |
© 2025 by the authors. Licensee MDPI, Basel, Switzerland. This article is an open access article distributed under the terms and conditions of the Creative Commons Attribution (CC BY) license (https://creativecommons.org/licenses/by/4.0/).