Article

An Integrated Optimization Framework for Connected and Automated Vehicles and Traffic Signals in Urban Networks

1
School of Maritime Economics and Management, Dalian Maritime University, Dalian 116026, China
2
Collaborative Innovation Center for Transport Studies, Dalian Maritime University, Dalian 116026, China
3
The Key Laboratory of Road and Traffic Engineering of the Ministry of Education, Tongji University, Shanghai 201804, China
*
Authors to whom correspondence should be addressed.
Systems 2025, 13(4), 224; https://doi.org/10.3390/systems13040224
Submission received: 15 January 2025 / Revised: 12 March 2025 / Accepted: 24 March 2025 / Published: 25 March 2025
(This article belongs to the Special Issue Performance Analysis and Optimization in Transportation Systems)

Abstract

:
This paper proposes an integrated sustainable optimization framework consisting of three modules to optimize vehicle routes, traffic signals, and CAV trajectories at the network level. The route guidance module determines optimal routes to maximize network throughput. The signal optimization module dynamically adjusts signal timings to improve network efficiency, and the trajectory planning module optimizes vehicle accelerations to enhance ride comfort and reduce travel time. All modules exchange their outputs immediately at each iteration. The optimization framework is solved using the Dijkstra algorithm, dynamic programming, and linear programming, with linearization and decomposition techniques employed to improve computational efficiency. Specifically, the network-level signal optimization and trajectory planning modules are decomposed into intersection-level and lane-level subproblems, respectively. The performance and scalability of the proposed optimization framework are demonstrated by experimental simulation, considering different traffic densities and road network sizes. The results show that the proposed framework is effective in improving traffic efficiency and sustainability, including ride comfort and travel delay, in urban road networks. A comparative analysis further evaluates the effectiveness of each module and reveals the significant impact of signal optimization on improving traffic efficiency, highlighting its importance in urban road networks.

1. Introduction

Traffic congestion in the vicinity of signalized intersections poses significant challenges to traffic control on urban roads. The emergence of connected and automated vehicles (CAVs) is key to leveraging cutting-edge communication technologies and advanced automated driving to mitigate traffic congestion in urban networks [1]. Nowadays, the concept of smart cities is being mentioned by more and more people. As an essential part of smart cities, smart mobility requires continuous innovation and iteration in digital technology to drive urban development and enhance residents’ quality of life [2].
Numerous researchers have studied various traffic and vehicle control approaches in the CAV environment to improve traffic operations. Existing research can be classified into the individual optimization of traffic signals or vehicle routes/trajectories and the integrated optimization of two or three individual optimizations. The individual optimization of traffic signals determines the signal control parameters to minimize travel delay and queue lengths by predicting traffic flow states using Vehicle-to-Vehicle (V2V) and Vehicle-to-Infrastructure (V2I) communications [3]. Network-level signal timing optimization is often approached in a distributed manner [4]. The individual optimization of route guidance aims to find the optimal route in road networks to minimize total travel time or maximize throughput, considering time windows and/or location constraints [5,6]. The individual optimization (or advice) of CAV trajectories treats the traffic signals as exogenous inputs, providing CAVs with optimal trajectories near intersections. Speed advisory systems [7] and eco-driving systems [8] typically provide individual CAVs with advisory speed, while the CAV trajectory optimization methods [9] focus on the effects of CAV platoons on the traffic flow by determining accelerations for optimal platoon performance, such as minimum fuel consumption and travel delay.
The individual optimization methods lack cooperation with the other individual optimization processes. To this end, numerous research efforts have been devoted to the integrated optimization of two or three individual optimizations. The integrated optimization of routes and trajectories determines optimal vehicle routes based on trajectories by predicting trip distributions and the future state of road networks. Ref. [10] addresses the challenges of ultra-low-frequency routes, which are essential yet infrequently traveled in large-scale networks. However, the existing research in this area has primarily focused on unmanned aerial vehicles rather than ground vehicles. Both types of vehicles aim to address dynamic environments by utilizing predictive models to improve route accuracy and adapt to complex networks [11,12].
In the field of integrated optimization of vehicle routes and traffic signals, traffic efficiency can be improved through global signal timing and dynamic route selection [13,14]. Researchers have developed a centralized flow equilibrium model under dynamic traffic assignment and signal control [15], while the computational complexity resulting from the centralized approach limits its application in real-time and urban networks with the growing data-processing needs and problem-solving complexity [16]. Later, the distributed approaches are proposed to solve the integrated optimization problems of vehicle routes and traffic signals for improved computational efficiency. A distributed approach combining dynamic routing algorithms and adaptive signal control strategies is presented to address traffic flow fluctuations and uncertainties in large-scale networks, where multiple potential routes are evaluated after formulating the decision-making process as a dynamic system [17]. To save the computational burden, mobile edge computing technology is used to establish a distributed framework that supports the environment of CAV [18]. In this line of research, most advancements highlight the shift from centralized to distributed approaches, enabling more efficient and scalable solutions for real-time traffic management.
The integrated optimization of traffic signals and vehicle trajectories is a complicated problem, owing to the codependency between traffic signals and vehicle motions. To reduce complexity, the hierarchical structure is widely employed to optimize signals and vehicles iteratively [19,20,21]. Numerous studies simply optimize the movements of an individual vehicle, typically the platoon leader, and simulate other vehicles using rule-based trajectories or car-following models. An intersection optimization algorithm for mixed traffic includes a signal controller that updates by cycle to handle stochastic traffic flow and a trajectory planning algorithm that fits the optimization conditions without deterministic signal plans or trajectory inputs [22]. Most efforts in this line of research have been devoted to jointly optimizing signals and vehicle trajectory at an individual signalized interSection [23,24], while few heuristic algorithms are proposed to extend the study scope to a corridor of multiple intersections [25,26].
Optimizing vehicle trajectories and traffic signals at the network level presents significant challenges due to the complex computations involved and the large scale of the system. The computational complexity in large urban networks limits the real-time optimization and scalability of existing algorithms. To address this, decomposition techniques, combined with distributed computing, have been applied to break down the network-level optimization problem into smaller sub-network-level problems [27]. Subsequently, ref. [28] introduced an integrated model that optimizes signal timing and vehicle speed to maximize throughput and minimize the number of stops across the network. This approach helps alleviate the scalability limitations typically encountered in large-scale network optimization. Additionally, a control framework has been proposed for both network-level traffic signal design and link-level trajectory planning, enhancing traffic management across the network [29]. However, existing studies in this area often overlook dynamic vehicle routes in urban road networks, which may reduce the efficiency of the proposed algorithms.
In conclusion, the existing studies mainly focus on the individual or pairwise optimization of vehicle routes, traffic signals, and vehicle trajectories. These approaches are limited by scalability challenges and computational complexity, particularly in multi-intersection or urban networks. To the best of our knowledge, an integrated optimization of vehicle routes, traffic signals, and vehicle trajectories has yet to be explored. To address this, we propose an integrated optimization framework that combines route guidance, signal optimization, and trajectory planning to optimize traffic flow and signal timing in urban road networks. The route guidance module identifies the optimal paths to maximize network throughput, while the signal optimization module adjusts signal timings dynamically to improve network efficiency. The trajectory planning module determines vehicle accelerations to enhance ride comfort and reduce travel time. Each module shares its outputs with the others in real time, enabling iterative optimization. The integrated optimization framework is solved within a unified solution approach, where each module—route guidance, signal optimization, and trajectory planning—is addressed using the Dijkstra algorithm, dynamic programming, and linear programming, respectively. To improve computational efficiency, the network-level signal optimization problem is decomposed into intersection-level subproblems, and the trajectory planning problem is first linearized and then broken down into lane-level subproblems. The performance and effectiveness of the proposed framework are validated through experimental and comparative simulations.
The contribution of this paper is three-fold. First, to solve the optimization problem of CAV platoon motions and traffic signals in urban networks, three modules are designed to optimize vehicle routes, traffic signals, and CAV trajectories, in a unified framework. Based on real-time traffic data and vehicle information, the route guidance module optimizes vehicle routes in the urban network, the signal optimization module determines traffic signal timings for each intersection, and the trajectory planning module optimizes vehicle trajectories in each lane for maximum comfort and minimum travel time. Since each module focuses on different traffic elements across various scopes, we present an integrated framework to coordinate the modules iteratively. Second, linearization and decomposition techniques are applied to reduce computational complexity. The network-level signal optimization problem is decomposed into intersection-level problems, which are then solved using dynamic programming techniques. The trajectory planning module is linearized using auxiliary variables and then solved using linear programming, after decomposing the network-level problem into lane-level subproblems. The proposed solution framework, along with the unsynchronized solution of the three modules using the Dijkstra shortest path algorithm, dynamic programming, and linear programming, ensures computational efficiency. Third, the simulation and comparative results of each module reveal that signal optimization has a significant impact on improving traffic efficiency. In contrast, route guidance has a minimal effect on performance in urban road networks.
The remainder of the paper is organized as follows. Section 2 describes the problem of integrated optimization of traffic signals, vehicle routes, and CAV trajectories in urban networks. Section 3 presents three modules to optimize vehicle routes, traffic signals, and CAV trajectories iteratively. Section 4 proposes the solution approaches integrated into a framework. In Section 5, the performance of the proposed optimization framework is demonstrated via experimental simulation. Finally, we conclude this work and discuss future work in Section 6.

2. Problem Description

In this section, the integrated optimization problem of CAV motions and traffic signals in urban road networks with multiple intersections is detailed; see Figure 1. The parameters and variables are listed in Table 1. It is assumed that the road network is equipped with perfect infrastructures to enable V2V and V2I communications. Each intersection is configured with a local controller that can optimize signal plans and vehicle motions in the vicinity of the intersection, and adjacent local controllers can cover the connected lane sections without interspace. A central controller in the road network is assumed to connect all local controllers and share the collected data once a local controller is required. All vehicles, controllers, and infrastructures are fully automated and connected with neglected delays. For instance, the sum of delays (e.g., transmission delay, packet loss, and actuator delay) is less than the updated time interval. The mapping between the lane index and the signal phase index is assumed to be pre-determined at all controlled intersections, and the amber time is overlooked owing to the fully CAV environment.
A 3 × 3 grid network is presented as an example in Figure 1a, where the road sections of different directions (i.e., links) and the intersections (i.e., nodes) are indexed using bold and white numbers, respectively. The right-turn and through movements share one lane, while the left-turn movement has an exclusive lane at each four-arm intersection; see Figure 1b. A signal controller is set at each intersection, and the signal phases are denoted by p, as shown in Figure 1c.

3. Model Formulation

The integrated optimization of CAVs and traffic signals in urban road networks consists of three modules including route guidance, signal optimization, and trajectory planning. This section introduces the constraints and the objective functions of each module.

3.1. The Route Guidance Module

The constraints and the objective function of the route guidance module are formulated in Section 3.1.1 and Section 3.1.2, respectively.

3.1.1. Constraints

Let K 1 and λ ( K 1 ) denote the set of time steps for route guidance and the time index for route guidance, respectively. Define A, A source , A suc , A sink , and  A pre as the set of all links, possible source links, planned successor links, possible sink links, and traveled predecessor links, respectively. a source ( A source ), a suc ( A suc ), a sink ( A sink ), and  a pre ( A pre ) represent the possible source links, planned successor links, possible sink links, and traveled predecessor links of the urban road network, respectively. Let f ( · , · ) ( λ ) denote the vehicle flows at time step λ , and thus, f ( a source , a suc ) ( λ ) is the number of vehicles from the source link a source to the planned successor link a suc , f ( a pre , a sink ) ( λ ) is the number of vehicles from the traveled predecessor link a pre to the sink link a sink , and  f ( a pre , a ) ( λ ) is the number of vehicles from the traveled predecessor link a pre to the link a.
The road network consists of the source links, the sink links, and the other links. The flow conservation of three types of links can be expressed by the temporal evolution of vehicle numbers on the corresponding links, as shown in Equations (1)–(3). In Equation (1), the number of vehicles on the possible source link a source at the next time step λ  + 1, θ a source ( λ + 1 ) , can be derived using the vehicle numbers at the current time step λ ; thus, θ a source ( λ + 1 ) equals to the number of vehicles entering the source link d a source , plus the number of vehicles on the source link θ a source , minus the number of vehicles from source links to planned successor links f ( a source , a suc ) for all successor links at the current time step λ .   
θ a source λ + 1 = d a source ( λ ) + θ a source ( λ ) a suc A suc f ( a source , a suc ) ( λ ) , a source A source , λ K 1
The number of vehicles on the sink link a sink at the next time step λ  + 1, θ a sink ( λ + 1 ) , as shown in Equation (2), is calculated by the vehicle numbers at the current time step λ . θ a sink ( λ + 1 ) equals to the vehicle numbers on the sink link θ a sink , plus the number of vehicles from the traveled predecessor link to the sink link f ( a pre , a sink ) at time step λ for all predecessor links.
θ a sink λ + 1 = θ a sink ( λ ) + a pre A pre f ( a pre , a sink ) ( λ ) , a sink A sink , λ K 1
In Equation (3), the number of vehicles on the other links (neither the source link nor the sink link, a ( A { A source A sink } )) at the next time step, θ a ( λ + 1 ) , is defined. θ a ( λ + 1 ) equals the number of vehicles on the link a, θ a , plus the number of vehicles from the predecessor links to the links a f ( a pre , a ) for all predecessor links, minus the number of vehicles from links a to the planned successor links f ( a , a suc ) for all traveled successor links, at time step λ .
θ a λ + 1 = θ a ( λ ) + a pre A pre f ( a pre , a ) ( λ ) a suc A suc f ( a , a suc ) ( λ ) , a A A source A sink , λ K 1
Let θ a ( a source , a sink ) ( λ ) represent the number of vehicles on link a at time step λ from the source link a source to the sink link a sink . The number of vehicles on the link a at time step λ , θ a ( λ ) , can be calculated using θ a ( a source , a sink ) ( λ ) for all source links and all sink links at time step λ , as described in Equation (4).
θ a ( λ ) = a source A source a sink A sink θ a ( a source , a sink ) ( λ ) , a A , λ K 1
The maximum number of vehicles that link a can accommodate is defined by q a . The number of vehicles on the link a at time step λ , θ a ( λ ) , cannot exceed q a but remain non-negative; see Equation (5).
0 θ a ( λ ) q a , a A , λ K 1
Let i denote the vehicle index. The route choice of vehicle i is defined as σ a i , where σ a i = 1 if link a is traveled by vehicle i and is otherwise 0. The total number of vehicles on link a must not exceed the maximum capacity q a ; see Equation (6).
i I σ a i q a , a A
The number of vehicles from the traveled predecessor links to the planned successor links at time step λ is denoted by f ( a pre , a suc ) . The sum of f ( a pre , a suc ) for all successor links should not exceed the saturation flow rate of the traveled predecessor link a pre ; see Equation (7). The sum of f ( a pre , a suc ) for all predecessor links cannot be larger than the saturation flow rate of the planned successor link w a suc , as shown in Equation (8).
a suc A suc f ( a pre , a suc ) ( λ ) w a pre , a pre A pre , λ K 1
a pre A pre f ( a pre , a suc ) ( λ ) w a suc , a suc A suc , λ K 1
f ( a , a suc ) ( λ ) represents the number of vehicles from links a to planned successor links a suc at time step λ , which can be calculated using the number of vehicles from the link a and to the planned successor link a suc when traveling from the source link a source to the sink link a sink , f ( a , a suc ) ( a source , a sink ) ( λ ) ; see Equation (9). f ( a , a suc ) ( λ ) cannot be negative, as shown in Equation (10).
f ( a , a suc ) ( λ ) = a source A source a sink A sink f ( a , a suc ) ( a source , a sink ) ( λ ) , a A , a suc A suc , λ K 1
f ( a , a suc ) ( λ ) 0 , a A A sink , a suc A suc , λ K 1
The maximum number of vehicles that the planned successor link a suc can accommodate, q a suc , should not be less than the sum of the number of vehicles from the traveled predecessor links to planned successor links f ( a pre a suc ) for all predecessor links and the current number of vehicles of planned successor links θ a suc at each time step λ .
θ a suc ( λ ) + a pre A pre f ( a pre , a suc ) ( λ ) q a suc , a suc A suc , λ K 1

3.1.2. Objective Function

The objective function of route guidance aims to maximize the total throughput within the optimization horizon considering all link-boundary link pairs ( a , a boun ) . In Equation (12), the overall number of vehicles that leave the network from the link a to the boundary link a boun , f ( a , a boun ) ( λ ) , is maximized for all link-boundary link pairs ( a , a boun ) and λ ( K 1 ) .
H 1 = max a A a boun A boun λ K 1 f ( a , a boun ) ( λ ) throughput
subject to Equations (1)–(12).

3.2. The Signal Optimization Module

The signal optimization module is discussed in this section, including the constraints (see Section 3.2.1) and the objective function (see Section 3.2.2). Hereinafter, K 2 is defined as the set of time steps and k ( K 2 ) denotes the time index for the signal optimization and the subsequent trajectory planning modules. The relationship between the time indexes λ and k is shown in Equation (13).
λ = k × Δ K 1 Δ K 2 , λ K 1 , k K 2

3.2.1. Constraints

Let N and n ( N ) denote the set of intersections and the intersection index in the road network, respectively. p denotes the index of the signal phase, with a pre-determined relationship between p and the traffic movements that are released in phase p. The decision variable g n p ( k ) represents the green time duration of phase p at intersection n at time step k, which is determined by the difference between the starting times of phase p and p + 1 , as shown in Equation (14).
g n p ( k ) = g n , p + 1 start ( k ) g n p start ( k ) , n N , k K 2
where g n , p start ( k ) is the starting time of phase p, and g n , p + 1 start ( k ) is the starting time of phase p + 1 .
Conflicting movements cannot be released simultaneously. Let y n p ( k ) denote the signal indication for phase p at intersection n at time step k. y n p ( k ) is a binary variable, where y n p ( k ) = 0 indicates a red signal, and  y n p ( k ) = 1 indicates a green signal. Assume the conflicting movements are released during phase p . Therefore, the signal indications of y n p ( k ) and y n p ( k ) cannot both be green simultaneously, as shown in Equation (15).
y n p ( k ) + y n p ( k ) = 1 , n N , k K 2
The green time duration g n p ( k ) should be less than or equal to the maximum green time G n p max of the phase p, as shown in Equation (16). Similarly, the green time duration g n p ( k ) should be greater than or equal to the minimum green time G n p min of phase p, as shown in Equation (17).
g n p ( k ) G n p max , n N , k K 2
g n p ( k ) G n p min , n N , k K 2

3.2.2. Objective Function

The objective of the signal optimization module is to minimize the total travel time of all vehicles. The objective function of the signal optimization module is given by Equation (18).
H 2 = min all vehicles t exit travel time
subject to Equations (14)–(17). t exit is the earliest time at which the vehicle has exited the road network, which can be obtained from the outputs of the trajectory planning module.

3.3. The Trajectory Planning Module

This section discusses the control variables and state variables (see Section 3.3.1), constraints (see Section 3.3.2), and the objective function (see Section 3.3.3) of the trajectory planning module.

3.3.1. Control and State Variables

J n and j ( { 1 , 2 , 3 , . . . , J n } ) denote the total number of traffic movements at intersection n and the index of traffic movement, respectively. Π n j denotes the controlled vehicle number in the j-th movement at intersection n. The control variable u n i j ( k ) is the acceleration of vehicle i in the j-th movement at intersection n at time step k (negative acceleration if the vehicle decelerates), as shown in Equation (19). The state variable x n i j ( k ) includes the position x n i j ( k ) and the speed v n i j ( k ) of the i-th vehicle in the j-th movement at intersection n. The state variable of the vehicle trajectory planning is shown in Equation (20).
u n i j ( k ) = u n i j ( k ) , n N , i { 1 , 2 , . . . , Π n j } , j { 1 , 2 , . . . , J n } , k K 2
x n i j ( k ) = x n i j ( k ) v n i j ( k ) , n N , i { 1 , 2 , . . . , Π n j } , j { 1 , 2 , . . . , J n } , k K 2
The system dynamics model of the trajectory planning module is described using a second-order equation, as shown in Equation (21).
x n i j ( k + 1 ) = A 0 x n i j ( k ) + B 0 u n i j ( k ) , n N , i { 1 , 2 , . . . , Π n j } , j { 1 , 2 , . . . , J n } , k K 2
where
A 0 = 1 Δ K 2 0 1 ; B 0 = 1 2 Δ K 2 2 Δ K 2
u and x are the control variable vector and the state variable vector of trajectory planning for all vehicles, which are arranged by indexes of n, i, j in sequence and in time.

3.3.2. Constraints

In trajectory planning, the control variables and state variables should satisfy physical motion constraints, including bounds on vehicle acceleration and speed, safe following gap, and vehicle position constraints during red phases.
The vehicle accelerations are bounded between the maximum and the minimum accelerations; see Equation (22). The speeds of all vehicles should not be higher than the maximum speed, and they should be non-negative, as shown in Equation (23).
u min u n i j ( k ) u max , n N , i I , j { 1 , 2 , . . . , J n } , k K 2
0 v n i j ( k ) v max , n N , i I , j { 1 , 2 , . . . , J n } , k K 2
where u min and u max denote the minimum and maximum acceleration, respectively, and  v max is defined as the maximum speed.
To ensure safe driving, the following vehicle is required to maintain at least the minimum safe distance from the preceding vehicle. The safe following gap constraint is expressed as Equation (24), as follows:
x n ( i 1 ) j ( k ) x n i j ( k ) v n i j ( k ) t min s 0 l n i j 0 , n N , i { 1 , 2 , . . . , Π n j } , j { 1 , 2 , . . . , J n } , k K 2
where l n i j is the length of the i-th vehicle in the j-th movement at intersection n; t min is the minimum safe following time interval; and s 0 is the minimum space gap at standstill conditions.
As for vehicles that cannot pass during the green time, their position should be restricted to stay behind the stop line of the intersection, so that the unpassable vehicle positions during the red time cannot exceed the longitudinal position of the stop line at the intersection n, x n j stop , as shown in Equation (25). ω n j denotes the passing vehicle number in the j-th movement at intersection n. Thus, the unpassable vehicles in traffic movement j at intersection n are represented by i { ω n j + 1 , ω n j + 2 , . . . , Π n j } . The red time duration at intersection n is expressed by k k | y n p ( k ) = 0 .
x n i j ( k ) x n j stop , n N , i { ω n j + 1 , ω n j + 2 , . . . , Π n j } , j { 1 , 2 , . . . , J n } , k k | y n p ( k ) = 0

3.3.3. Objective Function

The objective function of the trajectory planning module focuses on improving ride comfort and reducing the travel time of all vehicles. The first term in Equation (26) aims to diminish acceleration fluctuations by minimizing the absolute values of accelerations, and the second term encourages vehicles to travel at the maximum speed. The cost weight β 1 is measured in seconds and the cost weight β 2 is unitless.
H 3 = min j { 1 , 2 , 3 . . . J n } i I k K 2 n N β 1 u n i j ( k ) comfort β 2 v n i j ( k ) traveling time
subject to Equations (22)–(25).

4. Solution Approach

In this section, multiple solution techniques are customized to solve the modules in a unified framework. The route guidance, signal optimization, and trajectory planning modules are solved using the Dijkstra algorithm, dynamic programming, and linear programming, respectively. The overall solution framework is presented in Section 4.5.

4.1. Description of the Three-Level Framework

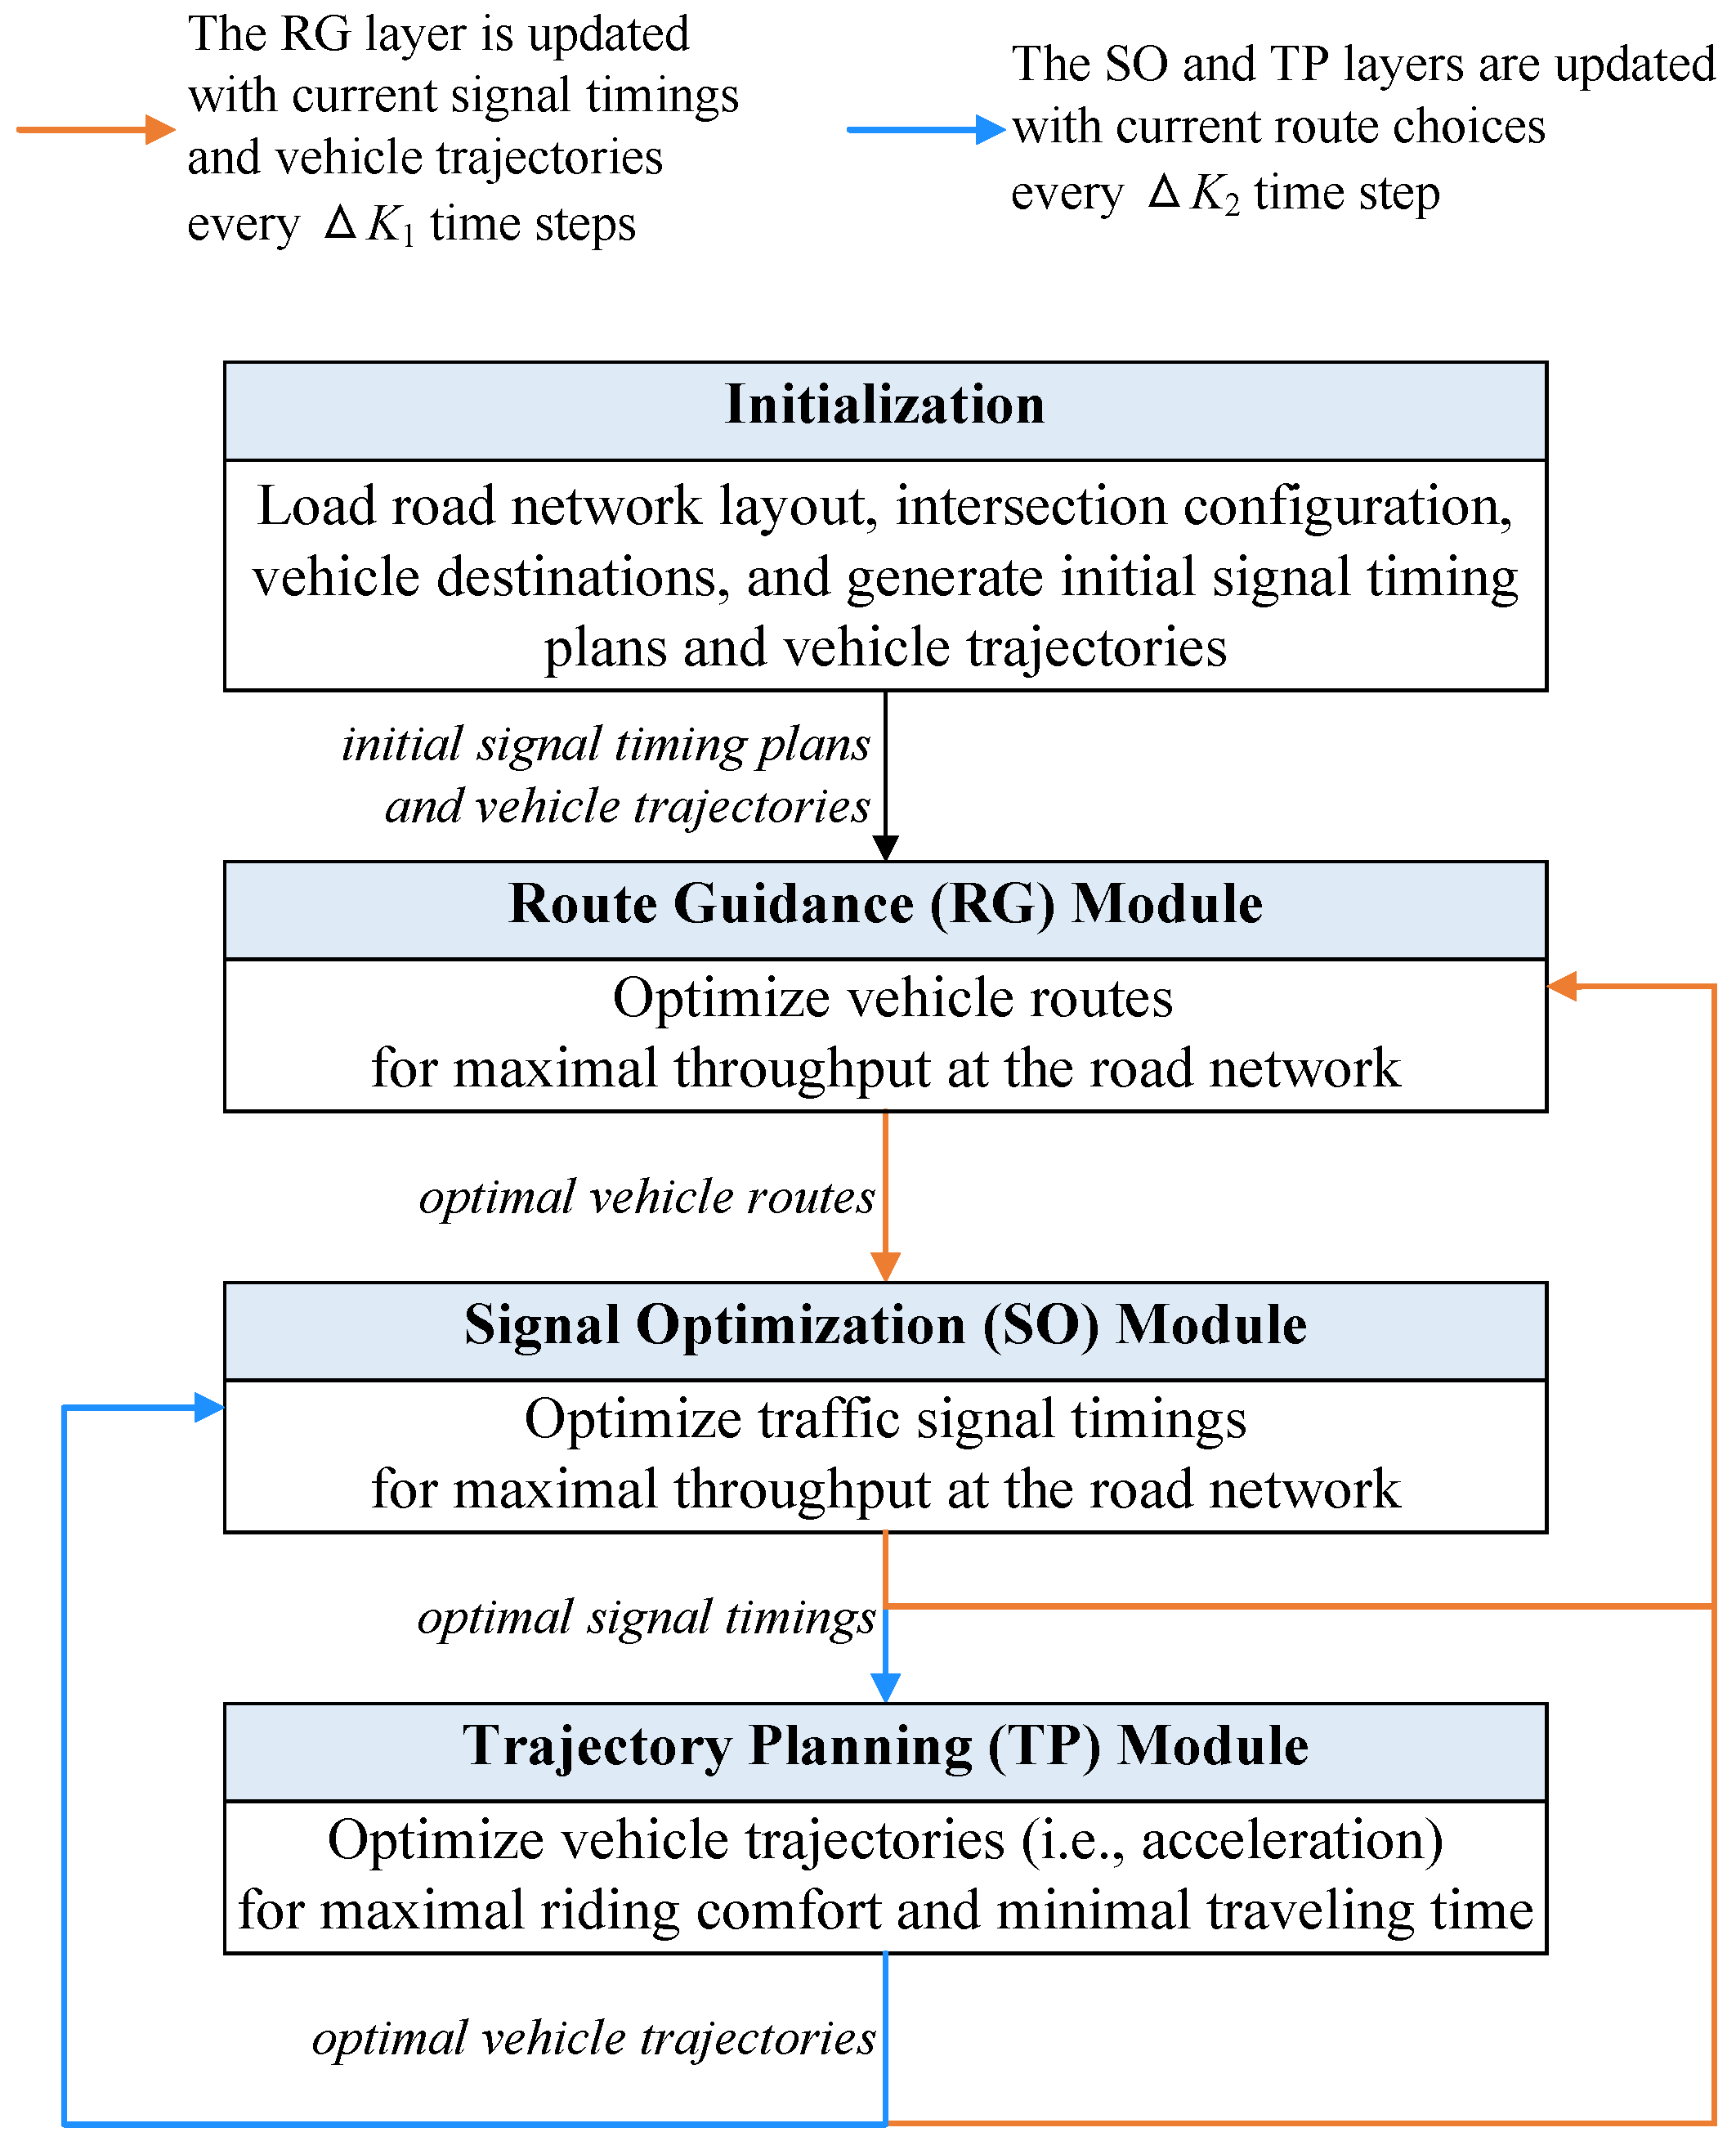
The optimization problem of CAV motions and traffic signals in urban networks can be cast into the route guidance module, the signal optimization module, and the trajectory planning module. To coordinate the three modules and take advantage of the updated vehicle and road information, a unified optimization framework is proposed, as shown in Figure 2. The framework starts with loading information (e.g., the road network layout, intersection configuration, and vehicle destinations) and generating initial signal timing plans and vehicle trajectories to the route guidance module. Then, the route guidance module, the signal optimization module, and the trajectory planning module are implemented iteratively, and the results generated by each module are immediately fed back to the other two modules.
The route guidance module aims to optimize vehicle routes for the maximum throughput of the road network based on the initial/current signal timings and vehicle trajectories. The signal optimization module determines the optimal traffic signals for maximum throughput based on the current results of the other modules. The trajectory planning module optimizes vehicle accelerations to maximize riding comfort (i.e., reduce acceleration fluctuations) and minimize travel time (i.e., stimulate vehicles to travel with the maximum speed).
As demonstrated by the orange and cyan arrow lines in Figure 2, three modules are updated at unsynchronized time intervals. Since vehicle routes do not change in a short time period, the route guidance module is updated every Δ K 1 (=5 s) to avoid the computational burden caused by frequent updates. In contrast, The signal optimization and trajectory planning modules require quick responses, so the time interval is Δ K 2 (=1 s). The cyclic optimization framework can articulate the three modules for optimal traffic performance at the network and vehicle levels, such as throughput, travel time, and vehicle riding comfort.

4.2. Dijkstra Algorithm for the Route Guidance Module

The route guidance module aims to find the shortest path based on the road information, current signal timing plans, and vehicle trajectories. The route guidance module is solved using the Dijkstra algorithm via the shortestpath function on MATLAB R2023a. The Dijkstra algorithm can find the shortest path between two specified nodes within a road network [30], the main procedure of which is as follows.
  • Initialization: Set tentative link lengths for all intersections. The tentative link length of the source intersection is set to zero, while the tentative link lengths from the source intersection to other inaccessible intersections are set to infinity. Meanwhile, sort all intersections by tentative link length.
  • Selection of the shortest distance intersection: The intersection with the shortest tentative link length is selected and marked as the shortest link.
  • Relaxation: Calculate the lane lengths from the selected intersection to each adjacent intersection for all adjacent intersections. If the length of this link is less than the tentative link length of the adjacent intersection currently recorded, update the tentative link length of the adjacent intersection and record them by length.
  • Repetition: Steps 2 and 3 are repeated until all shortest links are determined or all intersections are considered.
  • Completion: The algorithm ends when all reachable intersections find their shortest routes. The shortest routes are therefore found by tracing the predecessor intersections.

4.3. Dynamic Programming for the Signal Optimization Module

The signal optimization module adjusts phase durations based on feedback from the other two modules. Initially, a signal plan is generated based on the number of traffic movements released during each phase. The network-level signal optimization problem is then decomposed into multiple intersection-level problems. Each intersection-level problem is formulated as a dynamic programming problem, and each signal phase is treated as a stage. A forward recursion process explores the feasible solutions, while a backward recursion process retrieves the optimal solution.
The solution algorithm is outlined in Algorithm 1. First, the arrival times of all vehicles at the nearest downstream intersection are calculated based on their maximum speed and the distance from their current position to the stop bar. A platoon identification scheme is then applied as follows: if the time gap between the arrival of two consecutive vehicles is 10 s or less, they are grouped into a platoon. The green phase should ideally accommodate the entire platoon. An initial signal plan is generated by setting the arrival time of the platoon leader as the start of the green phase and the arrival time of the platoon’s last vehicle as the phase end. However, this initial signal plan may violate the constraints, as defined in Equations (15)–(17). To address this, a forward recursion process is initiated to recover feasible solutions. All feasible signal plans that satisfy these constraints are enumerated and evaluated based on the objective function in Equation (18). In the backward recursion process, the solutions are compared, and the optimal plan is retrieved. Finally, the signal parameters g n p ( k ) and y n p ( k ) for phase p are updated for the next iteration. The process continues by incrementing p and repeating the steps until the optimal g n p ( k ) values for all phases are determined.
Algorithm 1 Dynamic programming to solve the signal optimization module.
Require: current vehicle condition and signal plan
Ensure:  g n p ( k )
    for each vehicle do
          calculate the shortest arrival time at the downstream intersection
          identify platoons according to the space gaps
          for each platoon do
                record the arrival times of the leader and tail vehicles in the platoon
          end for
    end for
    for each phase p do
          initialize the signal plan using the arrival times of the leader and tail vehicles in the platoon
          while  g n p ( k ) do not satisfy all constraints of Equations (15)–(17) do
                forward recursion
                obtain the feasible solutions that satisfy all constraints
                calculate the values of the objective function Equation (18) using the feasible solutions
                backward recursion
                retrieve the optimal solution
          end while
          update the signal parameters g n p ( k ) and y n p ( k ) for phase p
    end for

4.4. Linear Programming for the Trajectory Planning Module

In this section, the control problem in the trajectory planning module is first linearized by introducing auxiliary variables and then decomposed into lane-level problems in a distributed manner.

4.4.1. Linearization

The comfort cost term in the objective function Equation (26) is linearized to simplify the trajectory planning module. Two auxiliary non-negative variables, μ n i j ( k ) and r n i j ( k ) , are introduced, which are defined by accelerations, see Equations (27) and (28), as follows:
μ n i j k = u n i j k + u n i j k 2 , μ n i j k 0
r n i j k = u n i j k u n i j k 2 , r n i j k 0
Consequently, the acceleration and the ride comfort cost term in the objective function can be represented by Equation (29) and Equation (30), respectively.
u n i j k = μ n i j k r n i j k , μ n i j k 0 , r n i j k 0
u n i j k = μ n i j k + r n i j k , μ n i j k 0 , r n i j k 0
Therefore, the control variable u n i j ( k ) can be replaced by μ n i j ( k ) and r n i j ( k ) to decrease the control dimension. The control variables are reformulated as Equation (31).
u n i j ( k ) = μ n i j ( k ) r n i j ( k ) , n N , i { 1 , 2 , . . . , Π n j } , j { 1 , 2 , . . . , J n } , k K 2 ,
Accordingly, B 0 in the system dynamics model is updated as follows.
B 1 = 1 2 Δ K 2 2 1 2 Δ K 2 2 Δ K 2 Δ K 2
Equations (21), (22), and (26) can be reformulated using Equations (29) and (30). The objective function is reformulated as Equation (32), which substitutes the ride comfort cost term for linearization.
H 4 = min j { 1 , 2 , . . . , J n } i I k = 1 K 2 β 1 μ n i j ( k ) + r n i j ( k ) comfort β 2 v n i j ( k ) traveling time
subject to Equations (23)–(25), and
x n i j ( k + 1 ) = A 0 x n i j ( k ) + B 1 u n i j ( k )
u min μ n i j ( k ) r n i j ( k ) u max , n N , i I , j { 1 , 2 , . . . , J n } , k K 2

4.4.2. Distribution

To further simplify the solution approach for the trajectory planning module, the overall trajectory control problem is decomposed into lane-level subproblems. Local controllers gather and share vehicle information with neighboring controllers and the central controller at each time step. Once a vehicle enters the control zone of a neighboring local controller, the previous controller ceases to optimize the vehicle trajectory. Each local controller is responsible for optimizing the trajectories of vehicles on all lanes at the intersection, treating each lane-level trajectory problem as an individual subproblem. Vehicles from different directions merging into a lane section are organized in chronological order.
The lane-level trajectory control subproblems are solved using the linear programming techniques of the linprog solver via MATLAB. The system dynamics, as described in Equation (33), are implemented as linear equality constraints. The constraints on state variables, such as speed and position (Equations (23)–(25)), are transformed into constraints on the control variables μ n i j ( k ) and r n i j ( k ) , using the system dynamics model in Equation (33).

4.5. Solution Framework

To integrate the solution methods outlined in Section 4.2, Section 4.3 and Section 4.4, a unified solution framework is presented to iteratively solve three modules. To begin with, the model inputs are loaded and the time indexes are initialized. The inputs include the vehicle destinations, initial vehicle conditions, road network layout, intersection configuration, and initial signal timing plans. The time indexes λ and k are both set to be 1. The initial vehicle motions are assumed to be uniform. Subsequently, the vehicle routes are determined using the shortest path algorithm based on the current data. Then, the signal timing plan at each intersection is solved using dynamic programming. Next, the vehicle trajectories are optimized using linear programming at the lane level in a distributed manner. Each iteration proceeds to a condition check. If k × Δ K 1 / Δ K 2 is not satisfied, the optimization process continues for signal optimization and trajectory planning, while k is incremented ( k k + 1 ). If the condition is met, the convergence criteria are assessed. If the convergence criteria are not satisfied, the solution framework proceeds to solve the vehicle routes with an incremented λ . The solution framework converges when the iteration counter reaches its maximum (i.e., 200) or when the difference in the network throughput between two consecutive iterations is less than or equal to a threshold (i.e., 0.01), which means all vehicles have departed the road network.
The flowchart in Figure 3 illustrates the iterative optimization process that determines the optimal vehicle routing, signal timing, and trajectory planning at an urban network. The overall solution framework is implemented via MATLAB on a desktop with an Intel(R) Core(TM) i7-11700F CPU with 16 GB memory. The shortestpath and linprog solvers are applied to solve the optimal routes and vehicle trajectories, respectively.

5. Simulation Results and Discussions

This section first introduces the experiment design and then analyzes the operational performance of three modules. Finally, the comparisons are made with the pairwise optimization which incorporates only two modules.

5.1. Experiment Design

To evaluate the performance of the proposed framework, a 3 × 3 grid network with 9 intersections is designed, as shown in Figure 1a. The parameter settings are detailed in Table 1, most of which come from our previous studies [9]. The designed initial conditions in Table 1 are representative, and similar settings and initial conditions do not increase the complexity of implementation. The cost terms of the objective function in the trajectory module are leveraged using linear weighting. The optimal vehicle trajectories are smooth, and vehicles can reach the maximum speed during green phases by setting β 1 = 10 s and β 2 = 1  [31]. The initial green phase durations at all intersections are p 1 = 18 s, p 2 = 12 s, p 3 = 18 s, and p 4 = 12 s.
Two cases are designed to test the performance of the proposed approach in various traffic demand levels and link lengths. The vehicles are initially distributed on links 7, 26, and 39 and then optimized to leave the network as soon as possible. Case 1 involves 20 vehicles traveling on a network with the link length l a = 400 m, whereas Case 2 considers 40 vehicles with each link length of l a = 800 m. These variations provide a basis for evaluating the scalability and performance of the proposed framework under different traffic densities and road network layouts. All vehicles have a uniform length of 3 m.

5.2. Performance Analysis

This section discusses the results of the integrated optimization framework applied to urban road networks. Section 5.2.1 presents the performance outcomes for optimal vehicle routing, signal timing, and vehicle trajectories. Section 5.2.2 compares the proposed optimization framework with the joint optimization of two individual modules.

5.2.1. Operational Performance

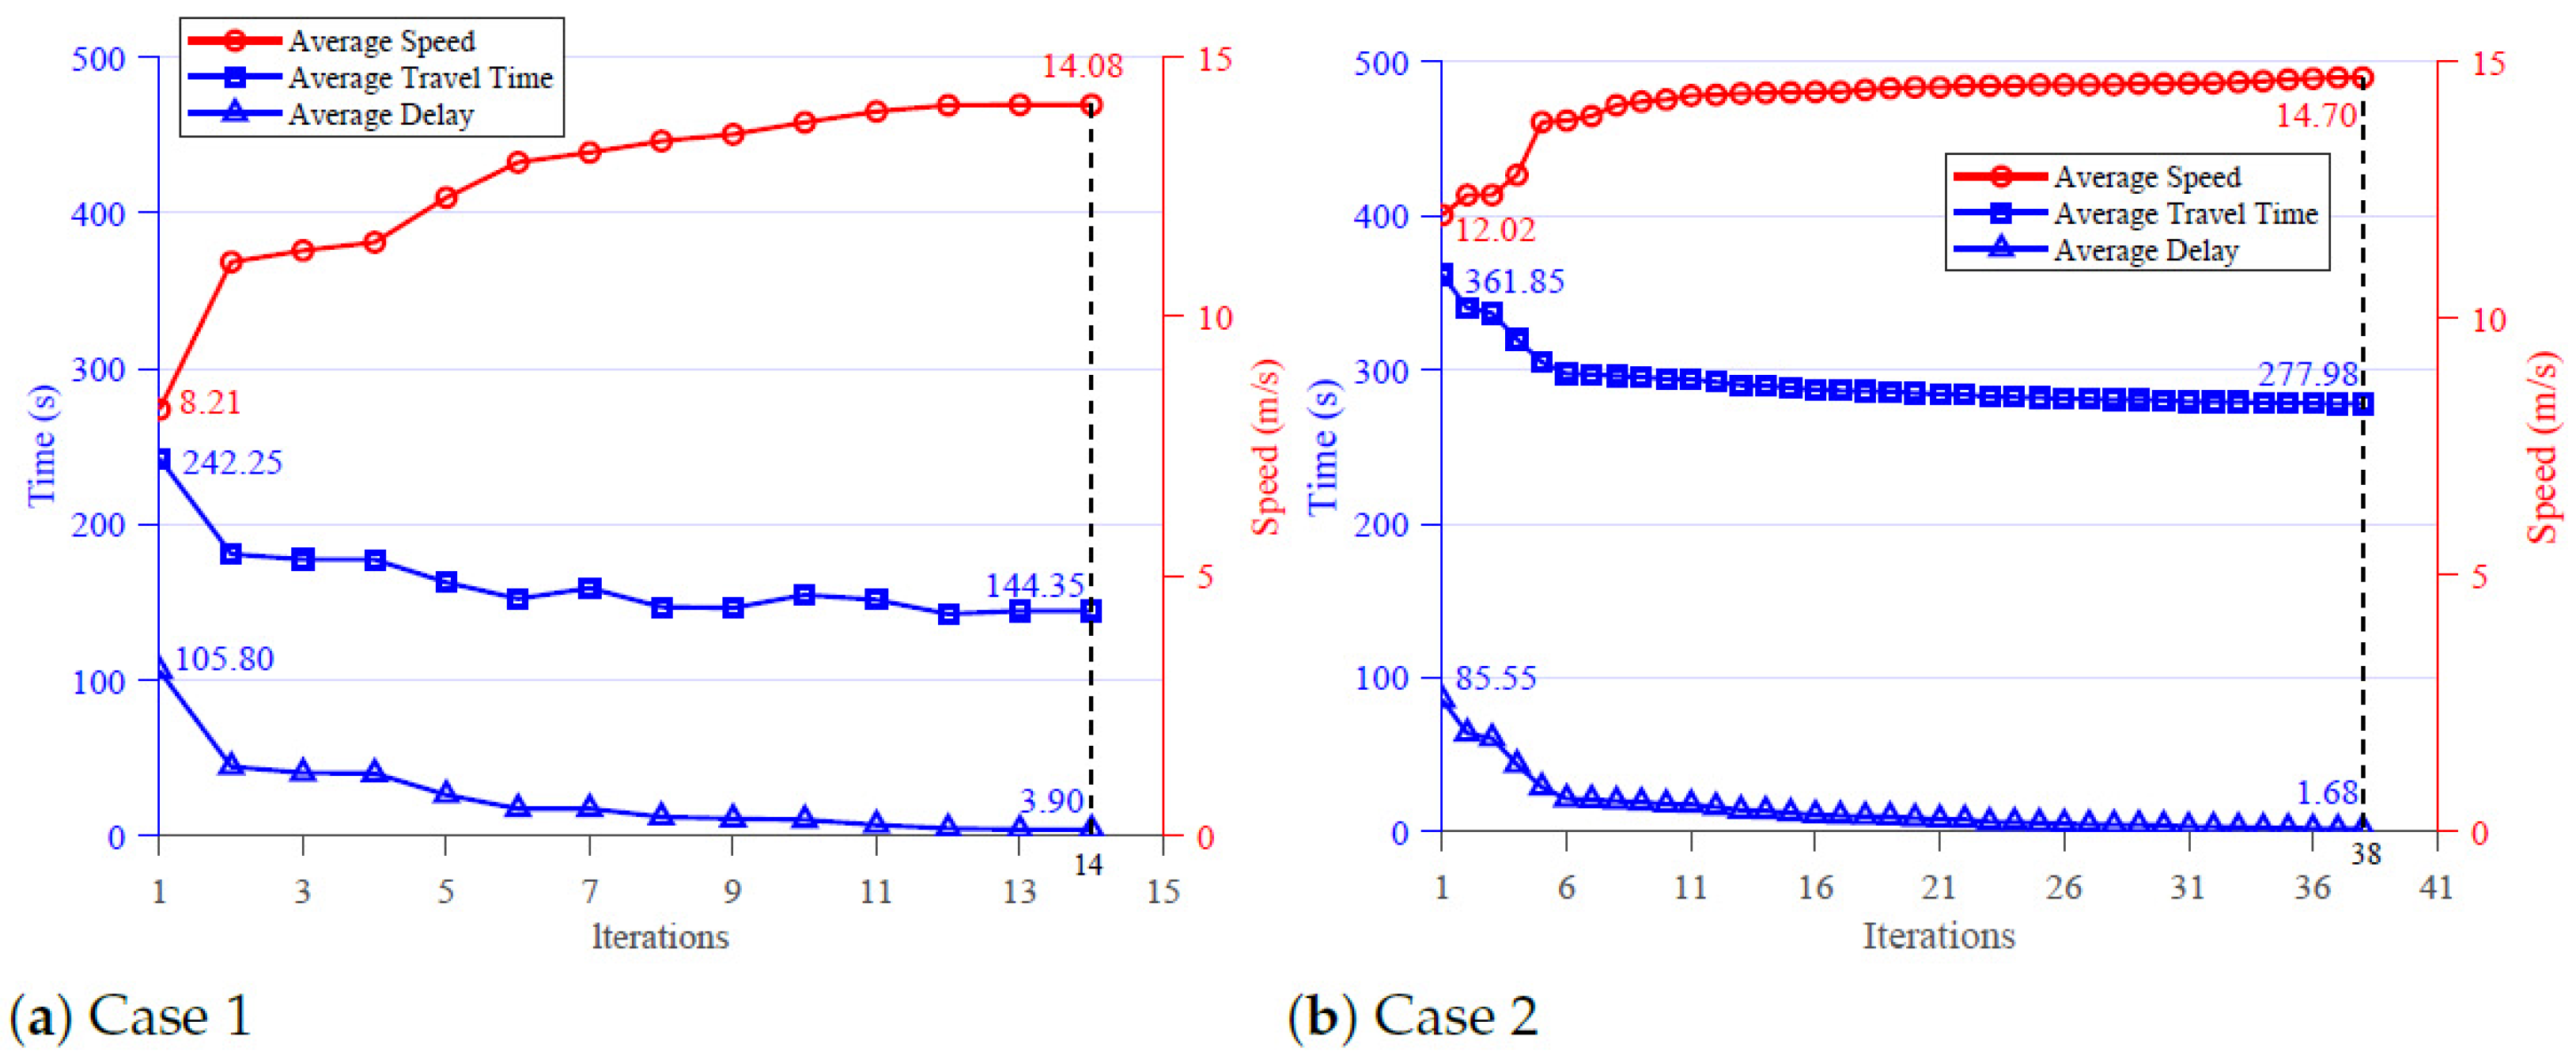
The operational performance is discussed in this section. Cases 1 and 2 are analyzed using performance metrics for the average speed, average travel time, and average delay, as shown in Figure 4. The average speed is calculated by dividing the total vehicle speed over all time steps by the total simulation time. Travel time refers to the duration a vehicle spends traveling through the road network. Vehicle travel delay is defined as the difference between the actual travel time and the minimum possible travel time (i.e., traveling at maximum speed). The average values of speed, travel time, and delay are computed across all vehicles to assess the overall traffic efficiency in the urban road network.
In Figure 4, the horizontal axis represents the iteration counter, while the left and right vertical axes correspond to time and speed, respectively. As shown, Case 1 requires fewer iterations compared to Case 2, as fewer vehicles are controlled in a smaller road network in Case 1. In both cases, the average speed increases, while the average travel time and delay decrease as the iterations progress. This demonstrates that the proposed optimization framework significantly enhances traffic efficiency, particularly in the first and second iterations. To further highlight the effectiveness of the proposed integrated optimization and solution methods, the optimal performance of each module is analyzed below.
A.
Route Guidance Module
This section presents and analyzes the optimal performance of vehicle routing. Table 2 and Table 3 detail the vehicle routes (i.e., the sequence of traveled links) at the initial, intermediate, and final iterations for Cases 1 and 2. In both cases, all vehicles are controlled to exit the road network as quickly as possible. As a result, some vehicles change their departure links to minimize travel time (e.g., vehicles 2, 3, 4, 6, 9, 11, 12, and 14 to 16 in Case 1). After optimization, certain vehicles—such as vehicles 1, 5, 7, 8, 10, 13, and 17 to 20 in Case 1—do not require route changes, indicating that their initial routes were already optimal or near-optimal. In Case 2, the initial and optimal routes are sometimes identical, but the intermediate routes during iterations differ, as shown in Table 3. The outputs from the route guidance module may vary or remain the same after each iteration, depending on the updated data from the trajectory planning and signal optimization modules. The size and layout of the road network also affect the generated routes. The results from the final iteration show that the vehicle routes are iteratively optimized, as evidenced by the improvements in the performance metrics—average speed, travel time, and travel delay—across iterations.
B.
Signal Optimization Module
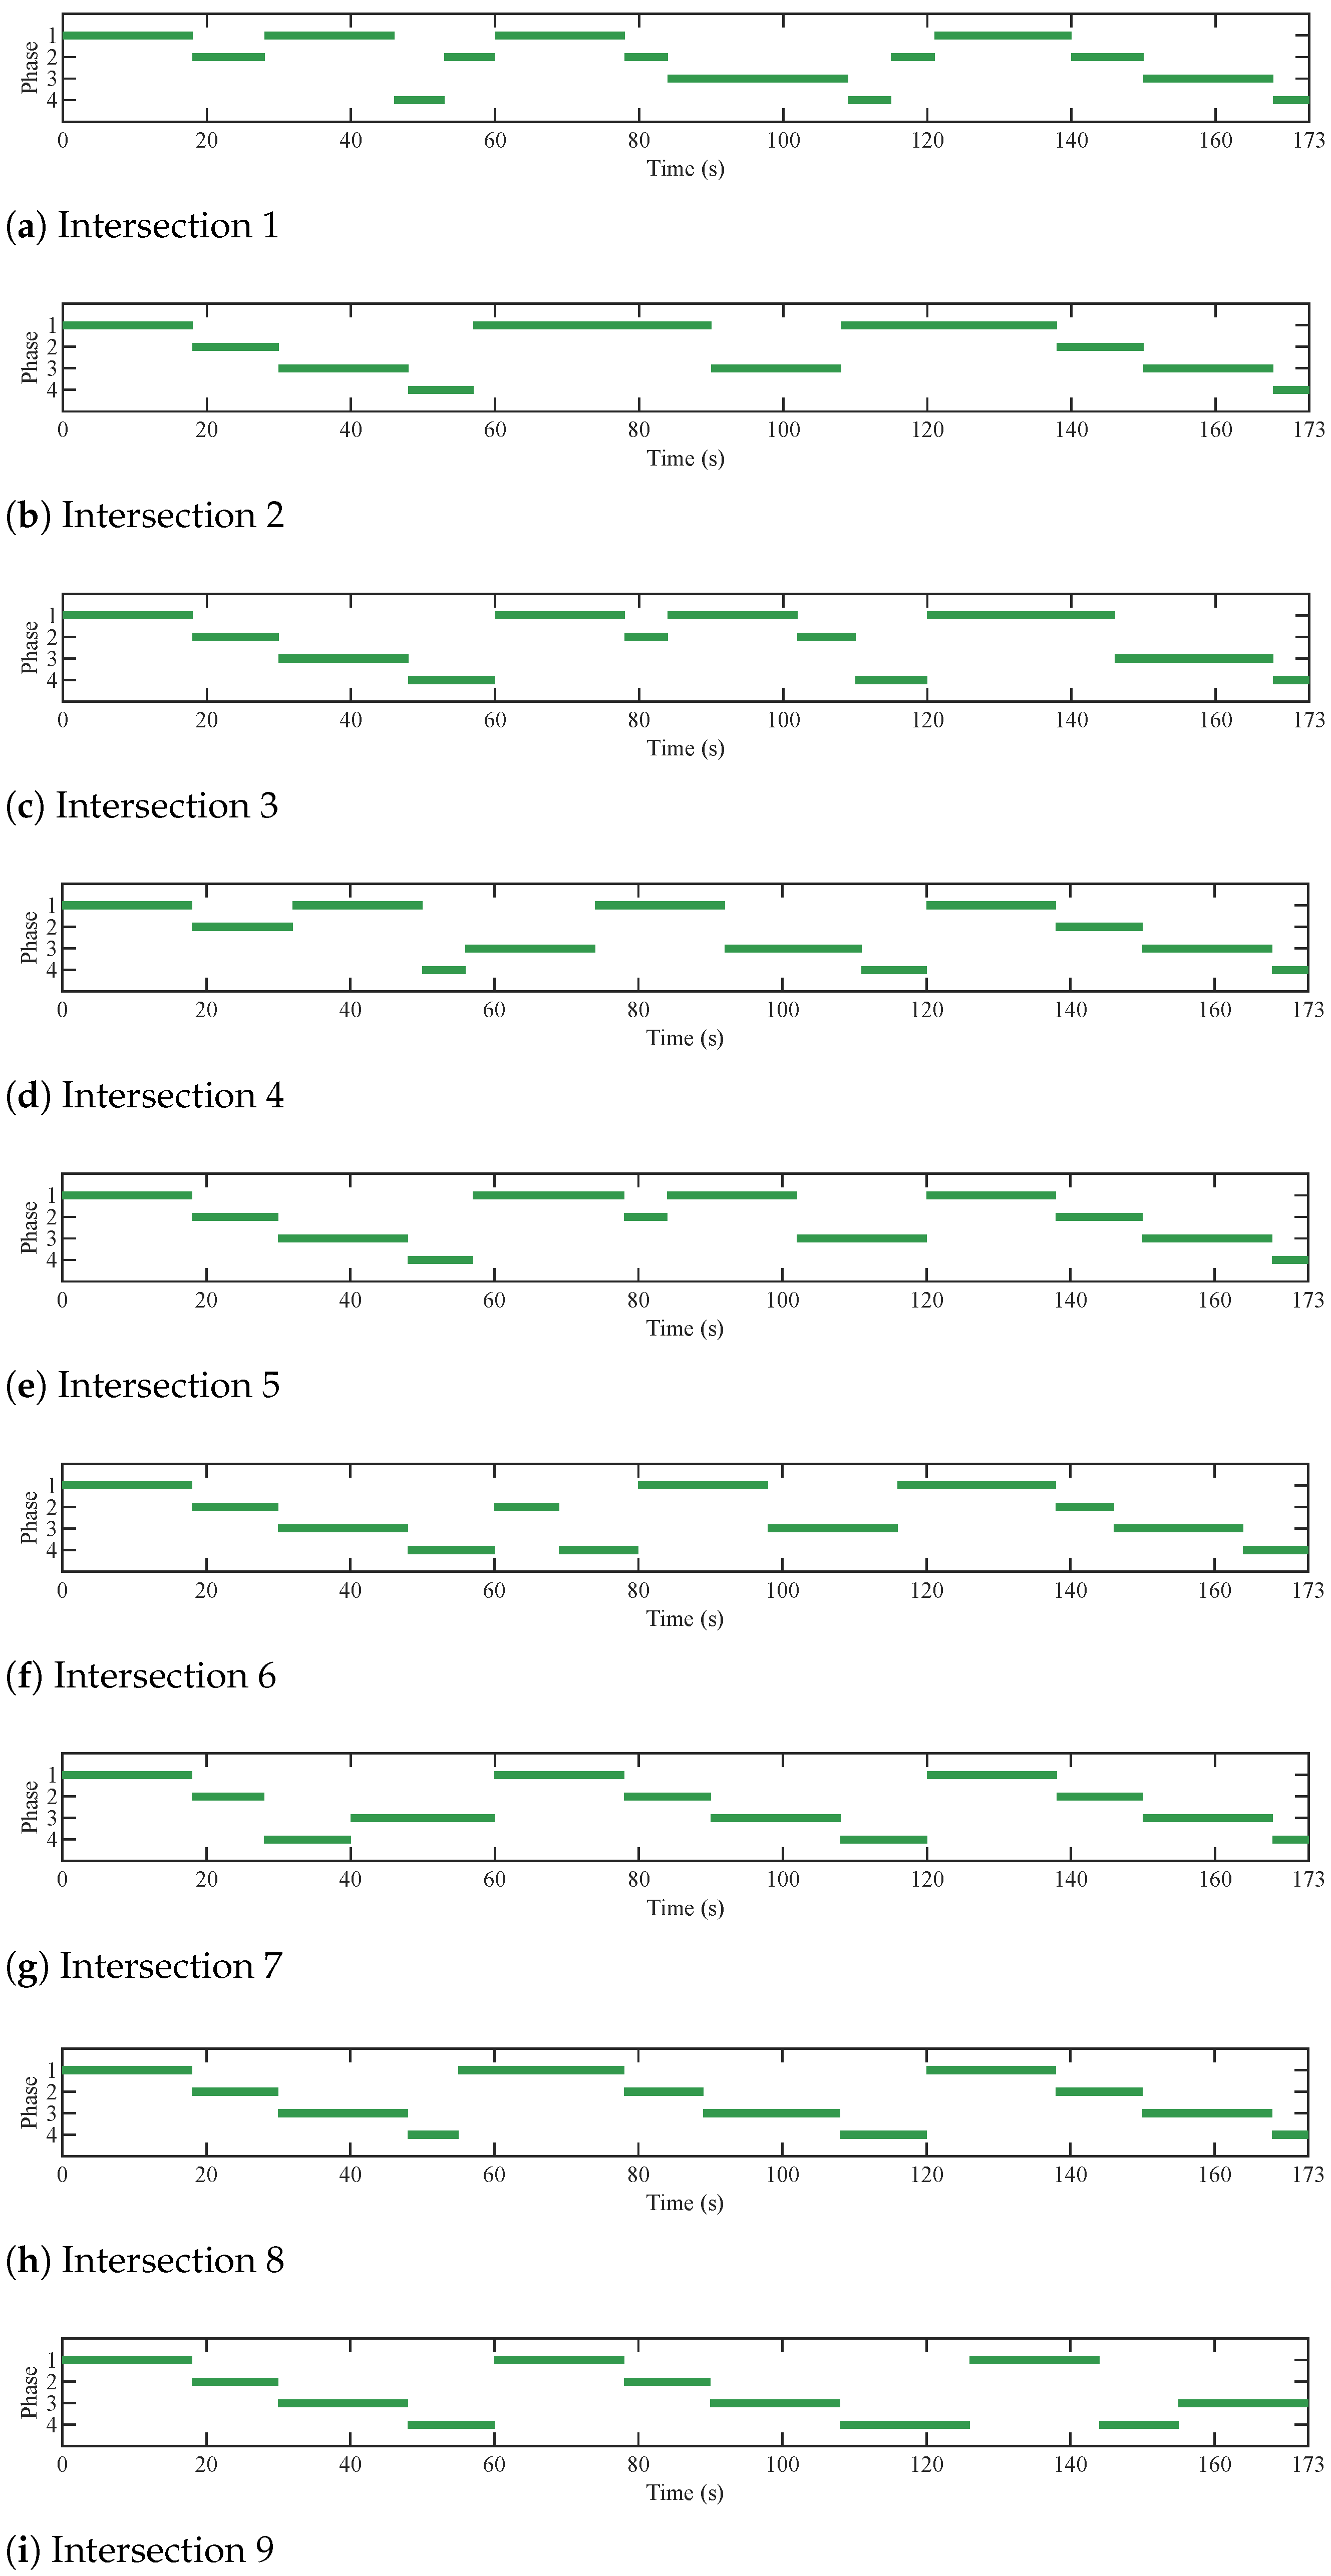
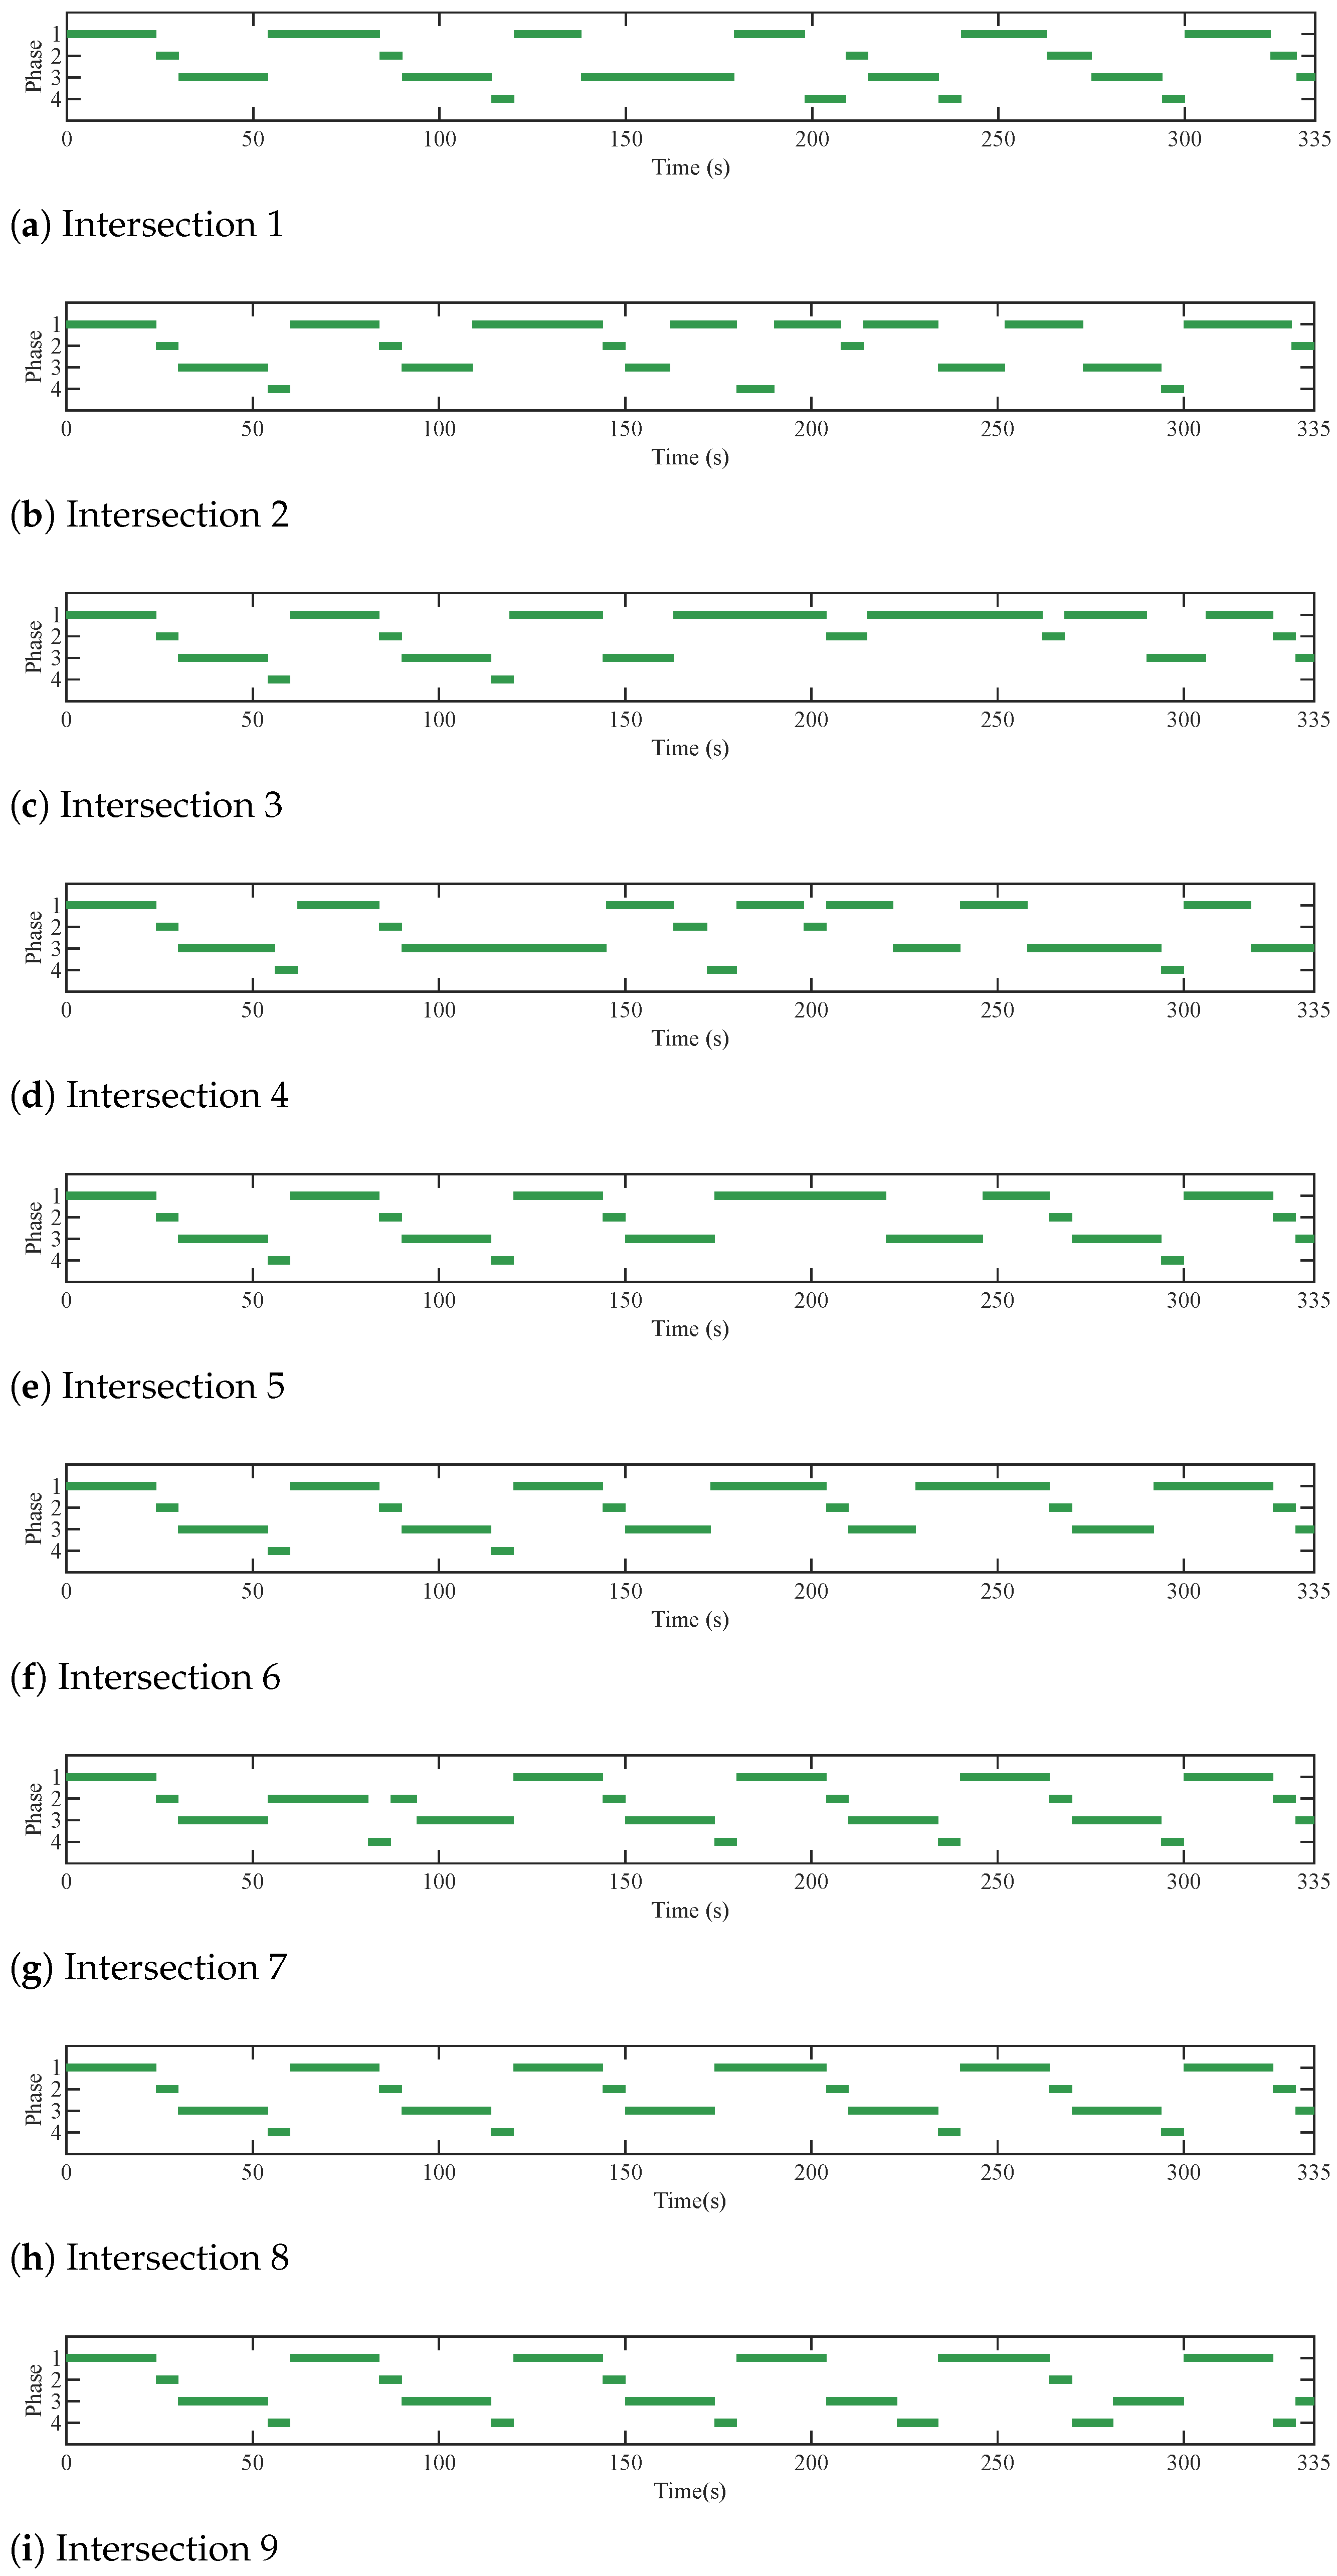
The initial signal timings at all intersections are uniform, with p 1 = 18 s, p 2 = 12 s, p 3 = 18 s, and p 4 = 12 s. In contrast, the optimal signal timings differ from the initial plans, as the green light durations are adjusted to better accommodate dynamic traffic flow in the network. The total simulation time required for all vehicles to exit the network is 173 s for Case 1 and 335 s for Case 2. Figure 5 and Figure 6 illustrate the optimized signal plans for all intersections in Cases 1 and 2, respectively.
The signal optimization module ensures that the constraints on the maximum and minimum phase durations are satisfied. Green phase durations are adjusted between these limits to accommodate traffic flow demands. For instance, in Case 1, at Intersection 2, the green time for Phase 1 lasts 33 s (from 57 s to 90 s) to release five vehicles, and 30 s (from 108 s to 138 s) to clear three vehicles, as shown in Figure 5b. In Case 2, as illustrated in Figure 6a,c, Phase 3 at Intersection 1 releases nine vehicles between 137 s and 180 s, while Phase 1 at Intersection 3 allows six vehicles to pass from 162 s to 204 s. The minimum duration for the left-turn phase is 6 s, ensuring that left-turn green phases last at least this long. For example, in Case 1, Phase 2 at Intersection 1 lasts from 54 s to 60 s and from 78 s to 84 s, as shown in Figure 5a. Similar durations are observed in Phase 2 at Intersection 3 (78 s to 84 s in Figure 5c), Phase 4 at Intersection 4 (50 s to 56 s in Figure 5d), and Phase 2 at Intersection 5 (78 s to 84 s in Figure 5e). In Case 2, the green phase durations also comply with the minimum left-turn phase requirement. For example, Figure 6 shows green phases lasting for 6 s, such as from 24 s to 30 s and 84 s to 90 s in Phase 2 at Intersection 6, and from 54 s to 60 s and 114 s to 120 s in Phase 4 at Intersection 9.
Figure 5 illustrates how the signal optimization module adjusts signal plans in response to dynamic traffic flows, aiming to minimize travel time while adhering to all constraints. The optimal signal performance varies under different traffic demand levels. Under lower traffic demand, the optimal signal durations change only slightly compared to the initial plans, and the signal phase sequences follow a regular sequence from p = 1 to p = 4 . For example, in Case 1, the signal plans at Intersection 8 (Figure 5h), at Intersection 7 from 60 s to 180 s (Figure 5g), and at Intersection 9 from 0 s to 126 s (Figure 5i) reflect this regular pattern. In contrast, under higher traffic demand, the optimal signal durations change more significantly, and the phase sequences become irregular. In some cases, phases may be skipped entirely if no vehicles arrive. For instance, at Intersection 1, the signal phase durations from p = 1 to p = 4 between 58 s and 138 s differ substantially from the initial plan, as shown in Figure 5a. The optimal signal performance in Case 2, depicted in Figure 6, shows a similar pattern, further demonstrating how the optimization adapts to varying traffic conditions.
C.
Trajectory Planning Module
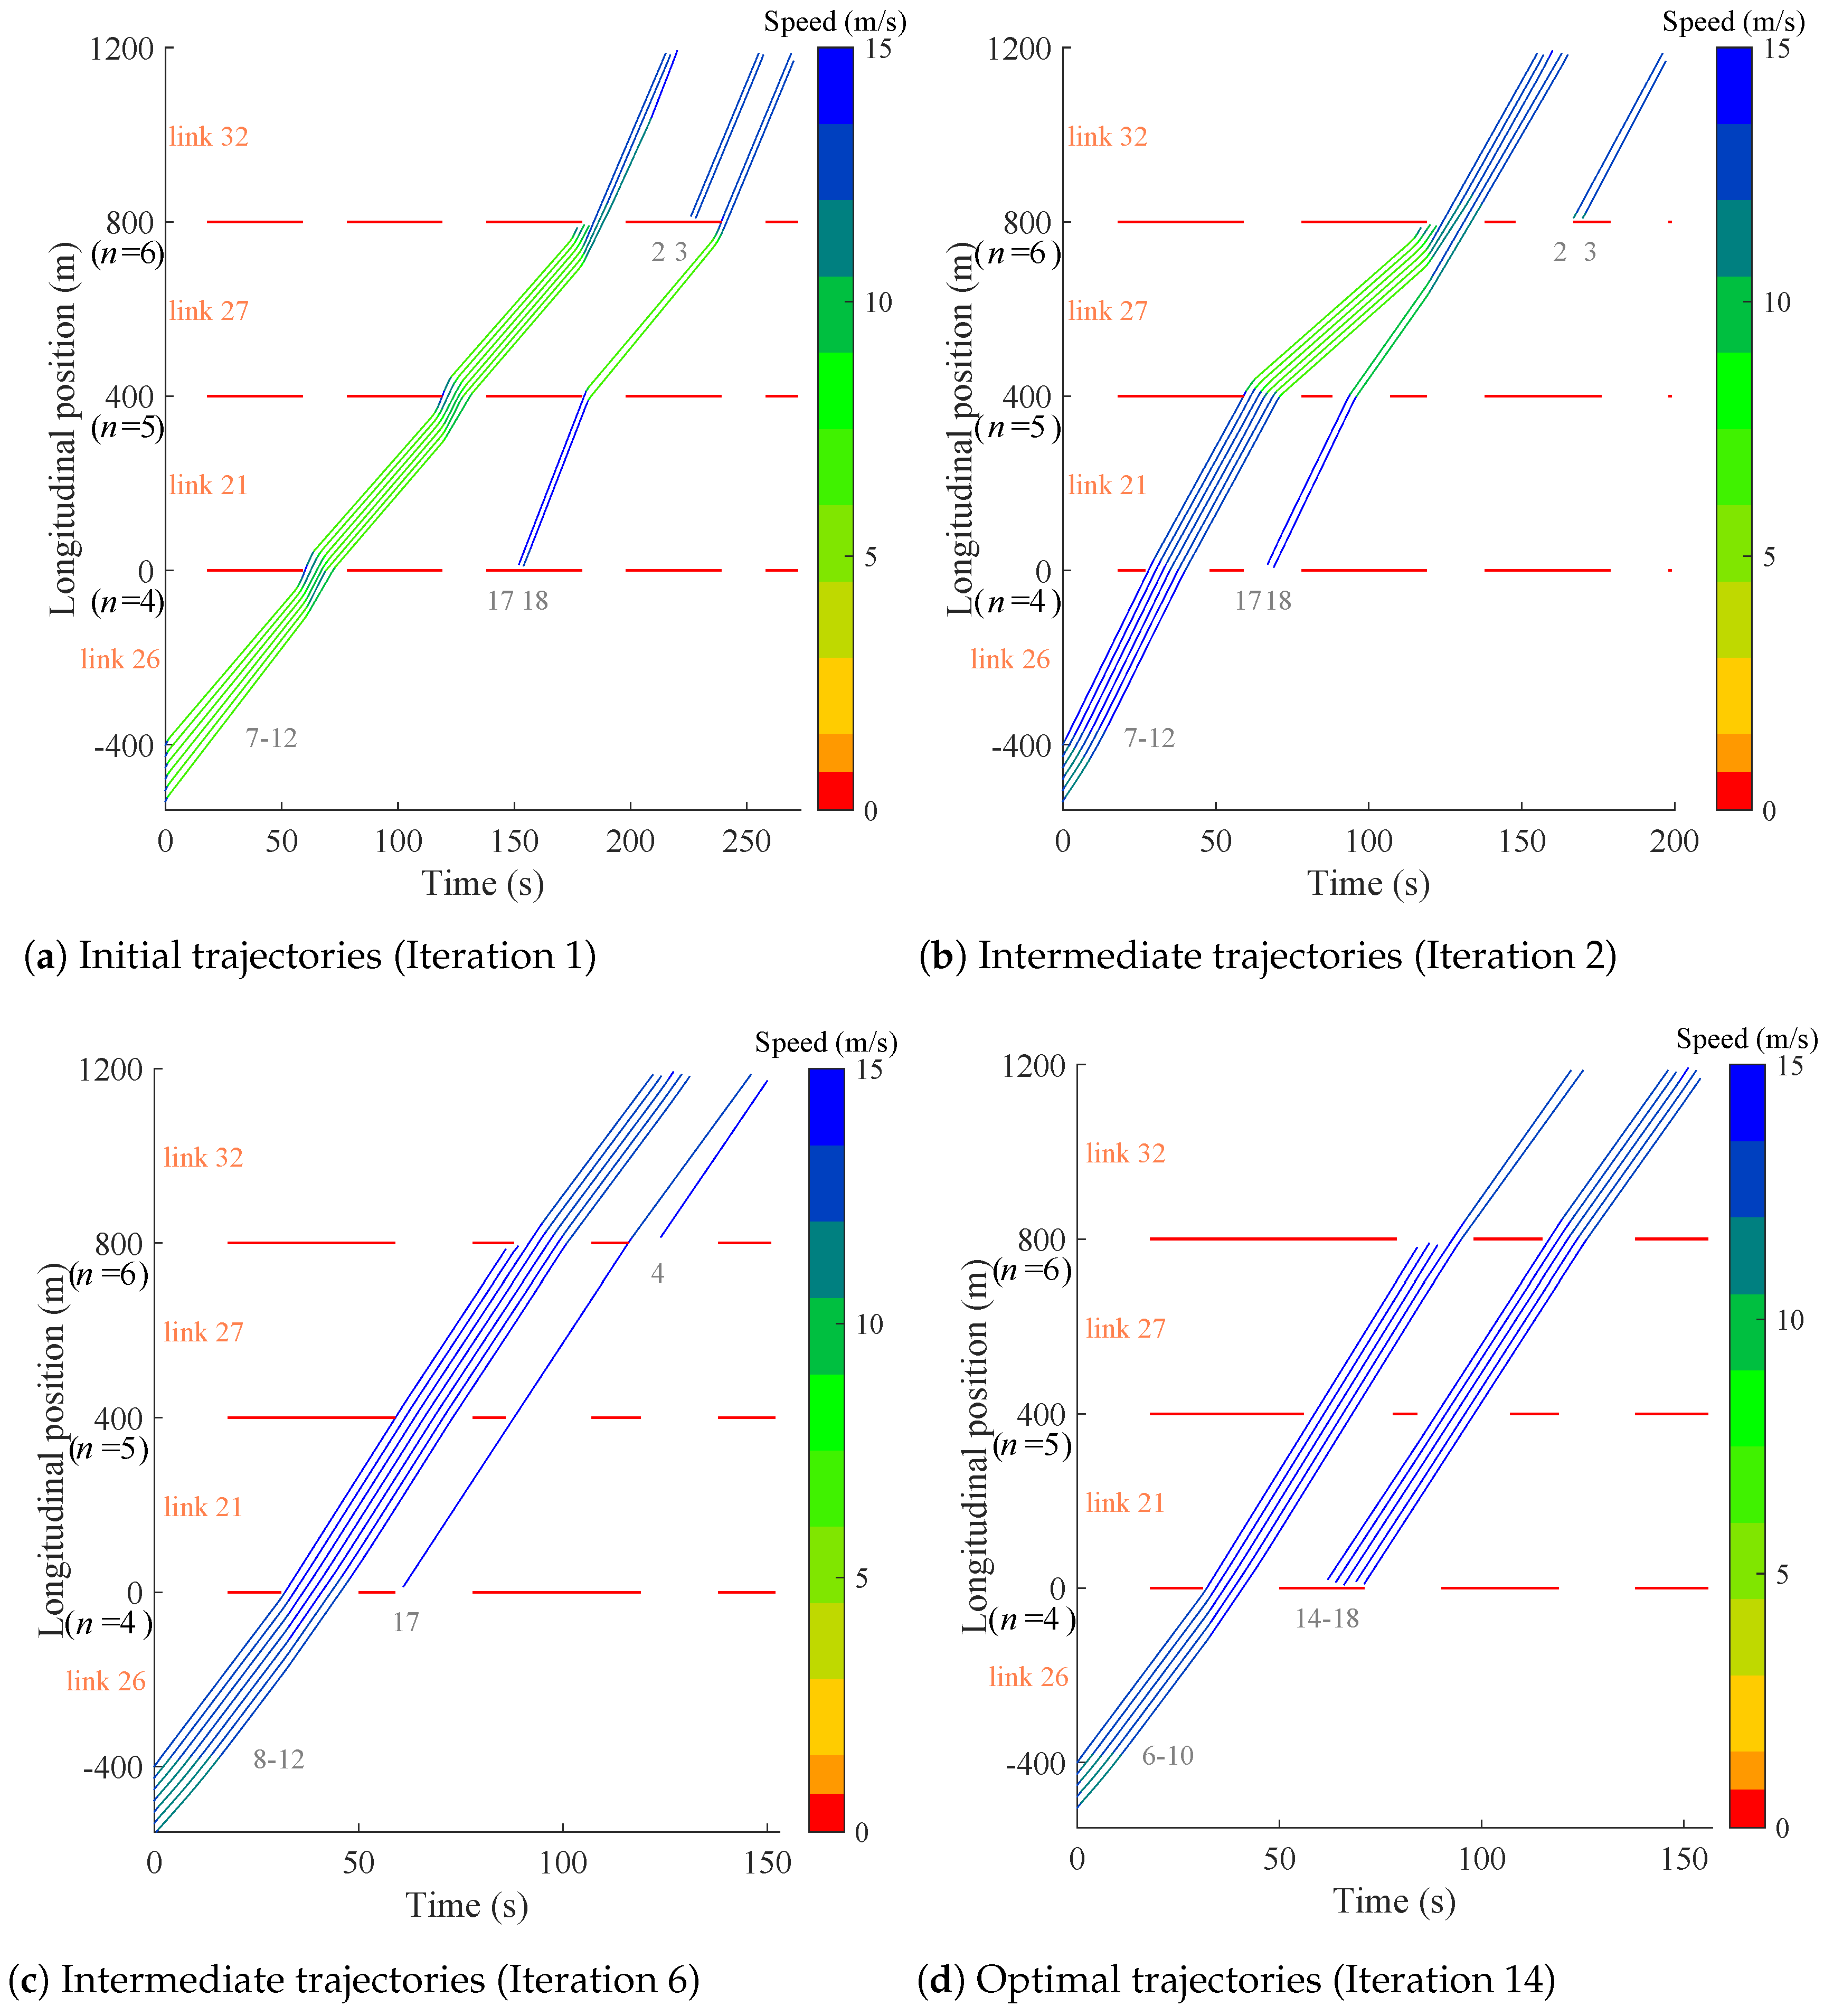
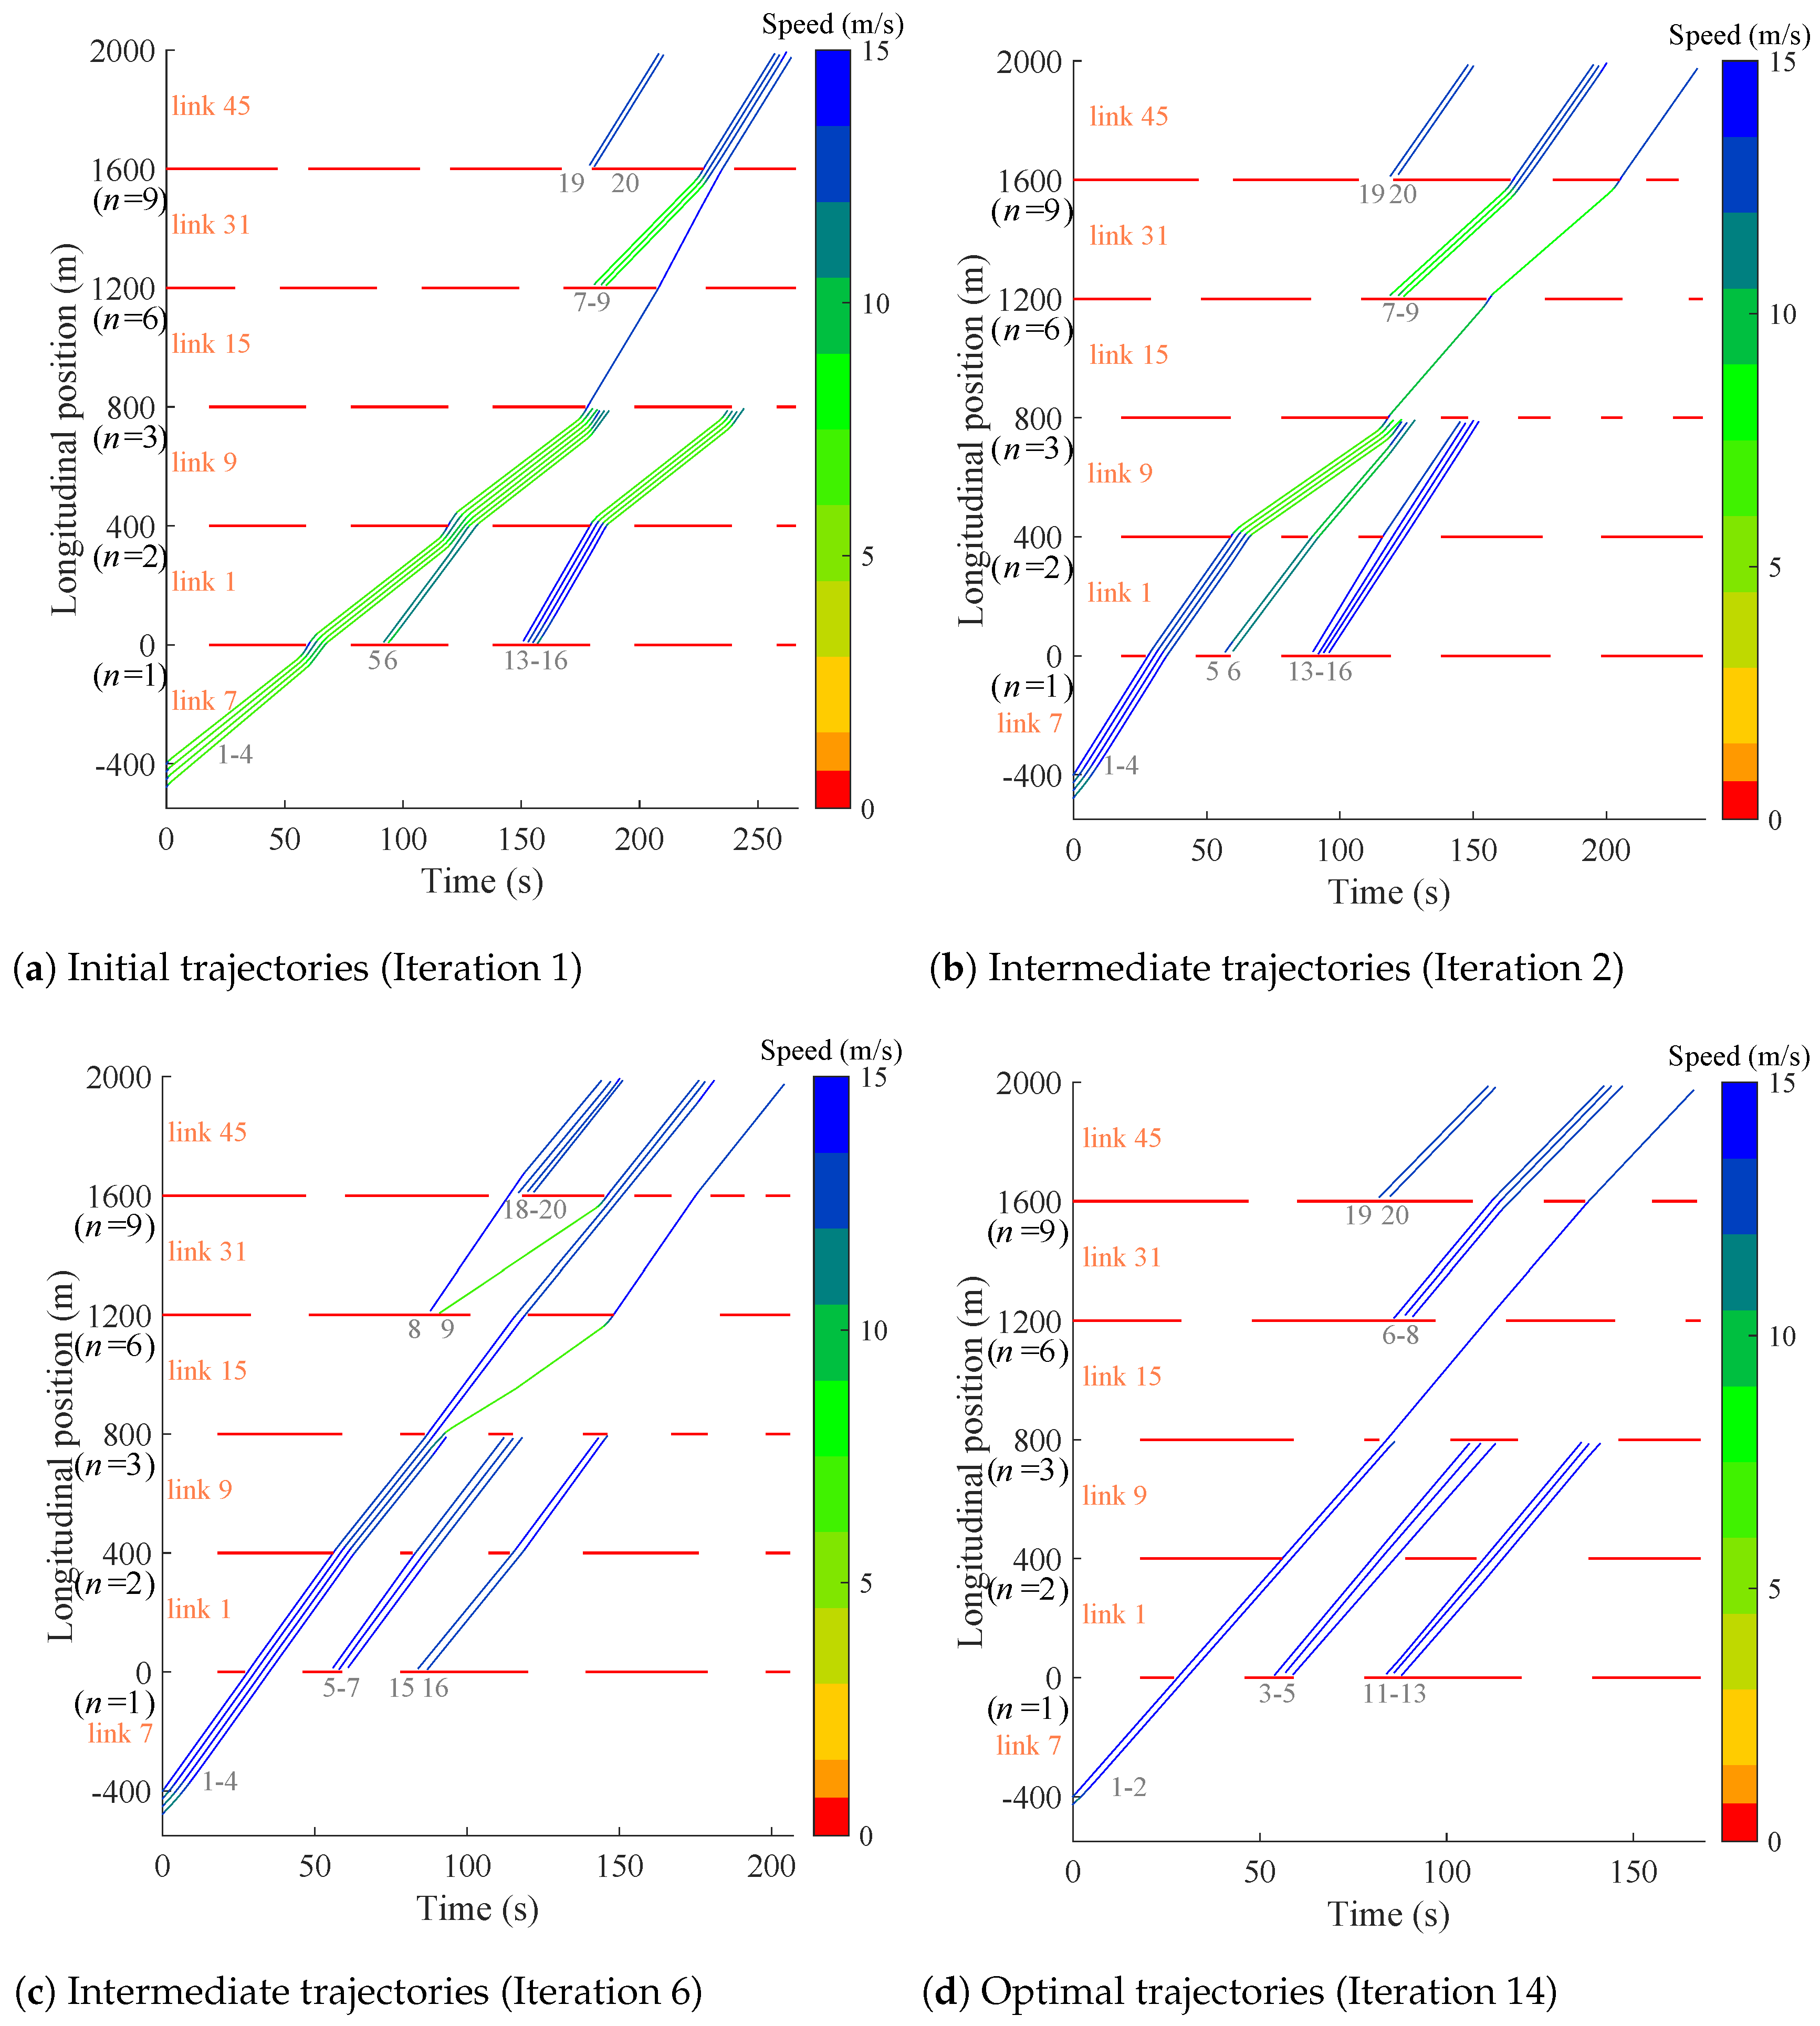
Two representative routes, Route 1 and Route 2, with high traffic demand, are selected to illustrate the performance of the trajectory planning module. Route 1 follows the path from Link 26, Link 21, Link 27, to Link 32, passing through three intersections—Intersections 4, 5, and 6. Route 2 travels from Link 7, Link 1, Link 9, Link 15, Link 31, to Link 45, passing through five intersections—Intersections 1, 2, 3, 6, and 9. The vehicle trajectories for Routes 1 and 2 at different interactions are shown in Figure 7 and Figure 8. Figure 7a and Figure 8a display the initial vehicle trajectories based on the initial results from the route guidance and signal optimization modules. Figure 7b and Figure 8b show the results after the first iteration, while Figure 7c and Figure 8c present the intermediate results after the sixth iteration. Finally, Figure 7d and Figure 8d illustrate the optimal trajectories. In these figures, the horizontal axis represents time, and the vertical axis shows the longitudinal positions of the vehicles. The gray numbers represent the vehicle indices used for analysis. The simulation time on the horizontal axis ends when all vehicles have exited the road network. The right-hand color bars indicate vehicle speeds, and the red horizontal lines represent the duration of the red light at each intersection. It is important to note that the red horizontal lines indicate the red phase in the corresponding signal cycle when vehicles are traveling from the predecessor links to the successor links. Some vehicles may encounter red lights at intersections, as shown in Figure 7 and Figure 8, but these red phases do not correspond to the selected route, and the vehicles are not violating the red lights.
The iterative results for Route 1 are analyzed as follows. The simulation times required for all vehicles to exit the road network at iterations 1 and 14 are 272 s and 156 s, respectively. As the iterations progress, the reduction in simulation time highlights the effectiveness of the proposed optimization framework in significantly reducing travel time by increasing vehicle speeds. At Iterations 6 and 14 (Figure 7c,d), all vehicles pass the intersections without encountering red lights, further contributing to the reduction in total travel time. Vehicle speeds improve significantly when comparing Iteration 1 (Figure 7a) with Iteration 2 (Figure 7b). In Iteration 2, Vehicles 7 to 12, starting from −400 m, reach their maximum speed on Links 26 and 21, resulting in a 60-s reduction in arrival time at Intersection 5, namely dropping from 120 s in Iteration 1 to 60 s in Iteration 2. Similarly, Vehicles 17 and 18 reach Intersection 5 at their maximum speed, arriving at 94 s in Iteration 2, compared to 180 s in Iteration 1. As a result, Vehicles 7 to 12, 17, and 18 arrive earlier at Intersection 6 in Iteration 2 than in Iteration 1. Overall, the travel time is reduced by approximately 60 s for Vehicles 7 to 12, and by 107 s for Vehicles 17 and 18 in Iteration 2.
As the vehicle routes are optimized iteratively, the indices of the vehicles traveling on Route 1 also change. In Figure 7c, Vehicles 8 and 9 turn right onto Link 31 at Intersection 6, causing their trajectories to disappear on Link 32. Vehicle 17 enters Link 21 from Link 25, while Vehicle 4 enters Link 32 from Link 15. Similarly, in Figure 7d, Vehicles 6 to 8 turn right onto Link 31 at Intersection 6, with their trajectories vanishing on Link 32. Vehicles 14 to 18 enter Link 21 from Links 39 and 25.
The same observations can be found in Route 2, as shown in Figure 8. The simulation times for all vehicles to exit the road network at iterations 1, 2, 6, and 14 are 266 s, 236 s, 206 s, and 168 s, respectively. The reduction in simulation time as the iterations progress confirms that the proposed optimization framework effectively reduces travel time by increasing vehicle accelerations. For example, Vehicle 1 arrives at Intersection 2 at 119 s in Iteration 1, but this is shortened to 60 s in Iteration 2. Similarly, Vehicle 1 reaches Intersection 9 at 235 s in Iteration 1, which is reduced to 205 s in Iteration 2. Additionally, Vehicles 13 to 16 reach their maximum speed on Link 9 in Iteration 2, allowing them to arrive at Intersection 3 approximately 93 s earlier than in Iteration 1. As the iterations progress, more vehicles can reach their maximum speed and pass intersections without encountering red lights. This confirms that the traffic signals are optimized to adapt to dynamic vehicle conditions, preventing queues at the stop line. In Iteration 6 (Figure 8c), only two vehicles fail to reach the maximum speed. In contrast, the optimal trajectories in Iteration 14 (Figure 8d) ensure that all vehicles reach their maximum speed and exit the road network more quickly. As a result, total travel delays are significantly reduced through the optimized signals and trajectories.

5.2.2. Comparative Performance

To evaluate the effectiveness of each module, three comparison scenarios are designed. The average speed, travel time, and delay are analyzed and compared against the proposed optimization framework. In Comparison Scenario 1, both the route guidance and signal optimization modules are enabled, with vehicle trajectories estimated using the initial speeds. Comparison Scenario 2 activates the route guidance and trajectory planning modules, but traffic signals are not updated. Comparison Scenario 3 employs the signal optimization and trajectory planning modules, but vehicle routes are fixed and not updated. The other settings remain unchanged, with the performance of the proposed optimization framework serving as the baseline for comparison.
The comparative results of Case 1, as shown in Figure 9, demonstrate that the proposed integrated optimization framework outperforms the three comparison scenarios in terms of average speed, travel time, and delay. This improvement is attributed to the integrated optimization of vehicle routes, traffic signals, and vehicle trajectories. First, the effectiveness of the trajectory planning module is evident when compared to Comparison Scenario 1. In Comparison Scenario 1, vehicles often experience sudden decelerations when encountering red lights, which reduces ride comfort and increases travel delays. The absence of a trajectory planning module leads to a 14.91% decrease in average speed, a 16.7% increase in average travel time, and a 393.59% increase in average delay. Next, the benefits of the signal optimization module are revealed in comparison with Comparison Scenario 2. In this scenario, traffic signal controllers follow the initial signal plan without adjusting signal timings based on vehicle movements. This results in a 39.70% reduction in average speed, a 61.45% increase in average travel time, and a 1547.44% increase in average delay, highlighting the importance of signal optimization. Finally, the advantages of the route guidance module are explored in comparison with Comparison Scenario 3. In this scenario, vehicle routes are not updated, leading to a 4.47% decrease in average speed, a 2.53% increase in average travel time, and a 196.15% increase in average delay. This underscores the benefit of dynamic route guidance in improving traffic efficiency in the urban road network.
The comparisons for Case 2, shown in Figure 10, further demonstrate the superiority of the proposed integrated optimization framework. Similar to Case 1, the integrated optimization of vehicle routes, traffic signals, and vehicle trajectories in Case 2 outperforms the three comparison scenarios in terms of average speed, travel time, and delay. First, compared to Comparison Scenario 1, the absence of trajectory planning results in inefficient speed adjustments, leading to an 18.64% reduction in average speed, along with a 22.53% increase in average travel time and a 3929.76% increase in average delay. Next, in Comparison Scenario 2, fixed signal plans fail to adapt to vehicle movements, causing excessive stops and idle time. This inflexibility leads to an 18.91% reduction in average speed, a 26.59% increase in average travel time, and a 4400% increase in average delay. Finally, the role of the route guidance module is evident in Comparison Scenario 3. Without dynamic route updates, vehicles are inefficiently distributed, leading to localized congestion. As a result, average speed decreases by 18.23%, while average travel time and delay increase by 6.09% and 1935.71%, respectively.
Furthermore, the comparative results of Cases 1 and 2 highlight the significant impact of the signal optimization module in the integrated optimization framework. Scenarios 1 and 3, which activate the signal optimization module, outperform Scenario 2 in terms of average speed, travel time, and delay. In contrast, the route guidance module has a smaller effect on overall performance. The performance losses observed in Scenario 3, which lacks the route guidance module, are minimal compared to the baseline, indicating that its contribution to the optimization framework is relatively marginal.

6. Conclusions

An integrated optimization framework is proposed to maximize throughput, enhance ride comfort, and minimize travel time in urban networks by optimizing traffic signals and CAV movements through three modules, i.e., vehicle route, signal optimization, and trajectory planning. The optimal results from each module are immediately fed back into the other two modules at each iteration, ensuring continuous improvement. To reduce computational complexity, the network-level signal optimization problem is decomposed into individual intersection-level problems, which are then solved using dynamic programming techniques. The trajectory planning module is addressed in a distributed manner after linearization, further reducing complexity by breaking the problem down into lane-level subproblems. The performance of the proposed optimization framework is validated through simulation experiments that consider a range of traffic densities and road network sizes.
Simulation results demonstrate the scalability of the proposed optimization framework and its ability to improve traffic efficiency (e.g., ride comfort and travel delay) at urban road networks. A comparative analysis of three comparison scenarios is conducted to evaluate the effectiveness of each module. The results highlight the significant impact of the signal optimization module, while indicating that the route guidance module has a minimal effect on performance in urban road networks.
Further research is directed to incorporate mixed CAV traffic, human-driven vehicles, and lane-changing behaviors.

Author Contributions

M.L.: Conceptualization, Methodology, Investigation, Writing—Original Draft, Writing—Review and Editing, Supervision, and Funding Acquisition. Y.L.: Methodology, Validation, Formal analysis, Investigation, Writing—Original Draft, and Visualization. X.L.: Validation, Writing—Original Draft, and Visualization. Y.C.: Writing—Review and Editing, and Visualization. R.H.: Writing—Review and Editing, and Funding Acquisition. All authors have read and agreed to the published version of the manuscript.

Funding

This work was funded by the National Natural Science Foundation of China, 52202397 and 52402408; the China Postdoctoral Science Foundation, 2023TQ0040; the Natural Science Foundation of Liaoning Province, 2024-BS-018; and the Dalian Science and Technology Innovation Support Project, 2023RQ005.

Data Availability Statement

Data are contained within the article.

Conflicts of Interest

The authors declare no conflicts of interest.

References

  1. Xu, L.; Zhang, Z.; Jiang, H.; Zhou, B.; Yu, H.; Ren, Y. Deep Reinforcement Learning with Fuzzy Feature Fusion for Cooperative Control in Traffic Light and Connected Autonomous Vehicles. IEEE Trans. Fuzzy Syst. 2024, 33, 377–391. [Google Scholar] [CrossRef]
  2. Wolniak, R.; Gajdzik, B.; Grebski, M.; Danel, R.; Grebski, W.W. Business models used in smart cities—Theoretical approach with examples of smart cities. Smart Cities 2024, 7, 1626–1669. [Google Scholar] [CrossRef]
  3. Feng, Y.; Head, K.L.; Khoshmagham, S.; Zamanipour, M. A real-time adaptive signal control in a connected vehicle environment. Transp. Res. Part C Emerg. Technol. 2015, 55, 460–473. [Google Scholar] [CrossRef]
  4. Mohebifard, R.; Hajbabaie, A. Optimal network-level traffic signal control: A benders decomposition-based solution algorithm. Transp. Res. Part B Methodol. 2019, 121, 252–274. [Google Scholar] [CrossRef]
  5. Miller-Hooks, E.D.; Mahmassani, H.S. Least expected time paths in stochastic, time-varying transportation networks. Transp. Sci 2000, 34, 198–215. [Google Scholar] [CrossRef]
  6. Wu, X. Study on mean-standard deviation shortest path problem in stochastic and time-dependent networks: A stochastic dominance based approach. Transp. Res. Part B Methodol. 2015, 80, 275–290. [Google Scholar] [CrossRef]
  7. Stebbins, S.; Hickman, M.; Kim, J.; Vu, H.L. Characterising green light optimal speed advisory trajectories for platoon-based optimisation. Transp. Res. Part C Emerg. Technol. 2017, 82, 43–62. [Google Scholar] [CrossRef]
  8. Nguyen, C.H.; Hoang, N.H.; Lee, S.; Vu, H.L. A system optimal speed advisory framework for a network of connected and autonomous vehicles. IEEE Trans. Intell. Transp. Syst. 2021, 23, 5727–5739. [Google Scholar] [CrossRef]
  9. Liu, M.; Hoogendoorn, S.; Wang, M. Receding Horizon Cooperative Platoon Trajectory Planning on Corridors with Dynamic Traffic Signal. Transp. Res. Rec. 2020, 2674, 324–338. [Google Scholar] [CrossRef]
  10. Li, J.; Zhao, W. Trajectory Generation of Ultra-Low-Frequency Travel Routes in Large-Scale Complex Road Networks. Systems 2023, 11, 61. [Google Scholar] [CrossRef]
  11. Pitre, R.R.; Li, X.R.; Delbalzo, R. UAV route planning for joint search and track missions—An information-value approach. IEEE Trans. Aerosp. Electron. Syst. 2012, 48, 2551–2565. [Google Scholar] [CrossRef]
  12. Coutinho, W.P.; Fliege, J.; Battarra, M. Glider routing and trajectory optimisation in disaster assessment. Eur. J. Oper. Res. 2019, 274, 1138–1154. [Google Scholar] [CrossRef]
  13. Li, P.; Mirchandani, P.; Zhou, X. Solving simultaneous route guidance and traffic signal optimization problem using space-phase-time hypernetwork. Transp. Res. Part B Methodol. 2015, 81, 103–130. [Google Scholar] [CrossRef]
  14. Li, P.T.; Zhou, X. Recasting and optimizing intersection automation as a connected-and-automated-vehicle (CAV) scheduling problem: A sequential branch-and-bound search approach in phase-time-traffic hypernetwork. Transp. Res. Part B Methodol. 2017, 105, 479–506. [Google Scholar] [CrossRef]
  15. Chen, L.W.; Hu, T.Y. Flow equilibrium under dynamic traffic assignment and signal control—An illustration of pretimed and actuated signal control policies. IEEE Trans. Intell. Transp. Syst. 2012, 13, 1266–1276. [Google Scholar] [CrossRef]
  16. Liu, R.; Smith, M. Route choice and traffic signal control: A study of the stability and instability of a new dynamical model of route choice and traffic signal control. Transp. Res. Part B Methodol. 2015, 77, 123–145. [Google Scholar] [CrossRef]
  17. Chai, H.; Zhang, H.M.; Ghosal, D.; Chuah, C.N. Dynamic traffic routing in a network with adaptive signal control. Transp. Res. Part C Emerg. Technol. 2017, 85, 64–85. [Google Scholar] [CrossRef]
  18. Chen, H.; Qiu, T.Z. Distributed dynamic route guidance and signal control for mobile edge computing-enhanced connected vehicle environment. IEEE Trans. Intell. Transp. Syst. 2021, 23, 12251–12262. [Google Scholar] [CrossRef]
  19. Niroumand, R.; Tajalli, M.; Hajibabai, L.; Hajbabaie, A. Joint optimization of vehicle-group trajectory and signal timing: Introducing the white phase for mixed-autonomy traffic stream. Transp. Res. Part C Emerg. Technol. 2020, 116, 102659. [Google Scholar] [CrossRef]
  20. Yang, Z.; Feng, Y.; Liu, H.X. A cooperative driving framework for urban arterials in mixed traffic conditions. Transp. Res. Part C Emerg. Technol. 2021, 124, 102918. [Google Scholar] [CrossRef]
  21. Liu, M.; Zhao, J.; Hoogendoorn, S.; Wang, M. An optimal control approach of integrating traffic signals and cooperative vehicle trajectories at intersections. Transp. B 2022, 10, 971–987. [Google Scholar] [CrossRef]
  22. Liu, H.; Flores, C.E.; Spring, J.; Shladover, S.E.; Lu, X.Y. Field assessment of intersection performance enhanced by traffic signal optimization and vehicle trajectory planning. IEEE Trans. Intell. Transp. Syst. 2021, 23, 11549–11561. [Google Scholar] [CrossRef]
  23. Ma, W.; Li, J.; Yu, C. Shared-phase-dedicated-lane based intersection control with mixed traffic of human-driven vehicles and connected and automated vehicles. Transp. Res. Part C Emerg. Technol. 2022, 135, 103509. [Google Scholar] [CrossRef]
  24. Niroumand, R.; Hajibabai, L.; Hajbabaie, A. White phase intersection control through distributed coordination: A mobile controller paradigm in a mixed traffic stream. IEEE Trans. Intell. Transp. Syst. 2023, 24, 2993–3007. [Google Scholar] [CrossRef]
  25. Li, M.; Wu, X.; He, X.; Yu, G.; Wang, Y. An eco-driving system for electric vehicles with signal control under V2X environment. Transp. Res. Part C Emerg. Technol. 2018, 93, 335–350. [Google Scholar] [CrossRef]
  26. Dong, H.; Zhuang, W.; Chen, B.; Lu, Y.; Liu, S.; Xu, L.; Pi, D.; Yin, G. Predictive energy-efficient driving strategy design of connected electric vehicle among multiple signalized intersections. Transp. Res. Part C Emerg. Technol. 2022, 137, 103595. [Google Scholar] [CrossRef]
  27. Tajalli, M.; Hajbabaie, A. Distributed optimization and coordination algorithms for dynamic speed optimization of connected and autonomous vehicles in urban street networks. Transp. Res. Part C Emerg. Technol. 2018, 95, 497–515. [Google Scholar] [CrossRef]
  28. Tajalli, M.; Mehrabipour, M.; Hajbabaie, A. Network-level coordinated speed optimization and traffic light control for connected and automated vehicles. IEEE Trans. Intell. Transp. Syst. 2020, 22, 6748–6759. [Google Scholar] [CrossRef]
  29. Nguyen, C.H.; Hoang, N.H.; Vu, H.L. A joint trajectory planning and signal control framework for a network of connected and autonomous vehicles. IEEE Trans. Intell. Transp. Syst. 2023, 24, 5052–5068. [Google Scholar] [CrossRef]
  30. Sundarraj, S.; Reddy, R.V.K.; Basam, M.B.; Lokesh, G.H.; Flammini, F.; Natarajan, R. Route planning for an autonomous robotic vehicle employing a weight-controlled particle swarm-optimized Dijkstra algorithm. IEEE Access 2023, 11, 92433–92442. [Google Scholar] [CrossRef]
  31. Liu, M.; Zhao, J.; Hoogendoorn, S.; Wang, M. A single-layer approach for joint optimization of traffic signals and cooperative vehicle trajectories at isolated intersections. Transp. Res. Part C Emerg. Technol. 2022, 134, 103459. [Google Scholar] [CrossRef]
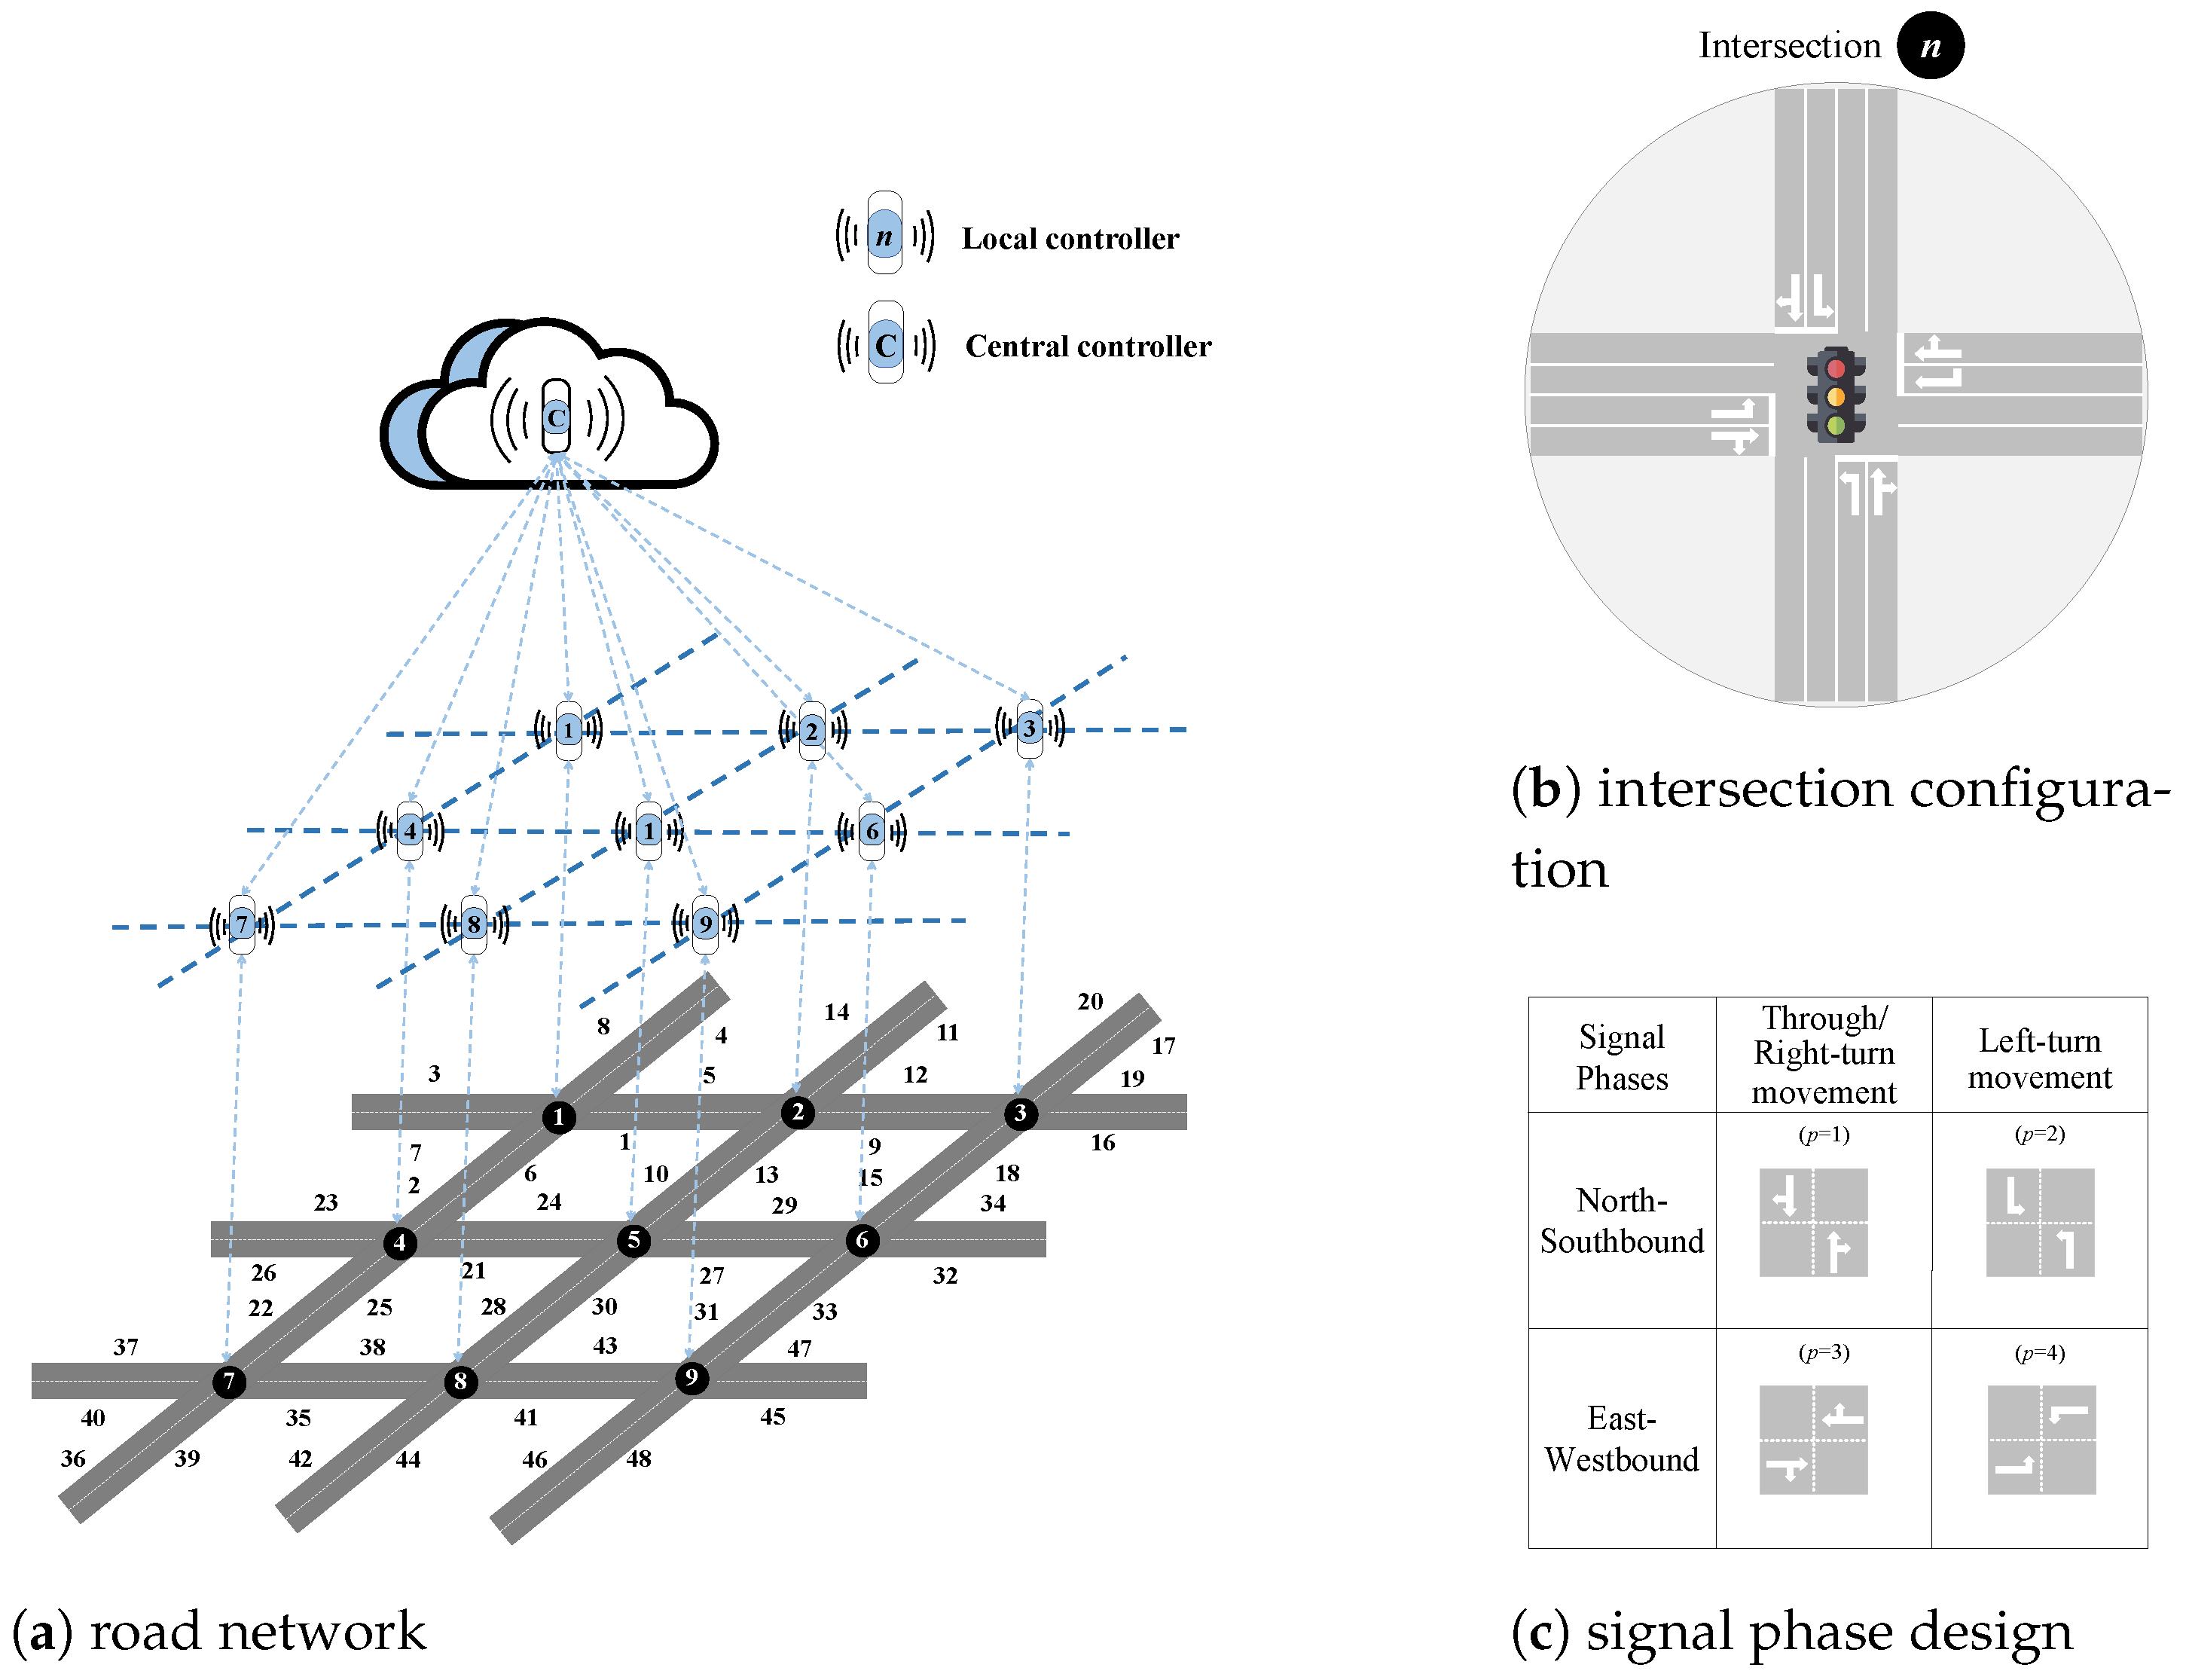
Figure 1. Problem description.
Systems 13 00224 g001
Figure 2. Three-level structure of the proposed framework.
Systems 13 00224 g002
Figure 3. Solution framework.
Systems 13 00224 g003
Figure 4. Performance metrics during iterations.
Systems 13 00224 g004
Figure 5. Optimal signal plans in Case 1.
Systems 13 00224 g005
Figure 6. Optimal signal plans in Case 2.
Systems 13 00224 g006
Figure 7. Optimal trajectory performance of Route 1.
Systems 13 00224 g007
Figure 8. Optimal trajectory performance of Route 2.
Systems 13 00224 g008
Figure 9. Comparisons with Case 1.
Systems 13 00224 g009
Figure 10. Comparisons with Case 2.
Systems 13 00224 g010
Table 1. Parameter settings.
ParameterDescriptionValue (Unit)
l a Length of each link in Case 1 and 2, respectively,400 m, 800 m
w a Link saturation flow rate1800 veh/h/ln
-Jam density0.3 veh/m
-Lane number2
G n 1 max , G n 3 max Maximum green time for through or right-turn movements (p = 1, 3) at intersection n60 s
G n 1 min , G n 3 min Minimum green time for through or right-turn movements (p = 1, 3) at intersection n18 s
G n 2 max , G n 4 max Maximum green time for left-turn movement (p = 2, 4) at intersection n24 s
G n 2 min , G n 4 min Minimum green time for left-turn movement (p = 2, 4) at intersection n6 s
-Initial vehicle speed13 m/s
-Initial space gap31 m
l n i j Vehicle length3 m
s 0 Minimum space gap at standstill conditions2 m
μ min Allowable maximum acceleration2 m/s2
μ max Allowable minimum acceleration−5 m/s2
v max Maximum speed15 m/s
t min Minimum safe car-following time gap2 s
β 1 Cost weight10 s
β 2 Cost weight1
IController vehicle numbers in Cases 1 and 220, 40
Table 2. Initial and optimal vehicle routes in Case 1.
Vehicle Index       Initial Routes       Optimal Routes
1 7 1 9 15 31 45 7 1 9 15 31 45
2 7 1 9 15 32 7 1 9 17
3 7 1 9 15 32 26 6 1 9 17
4 7 1 9 17 26 6 1 9 17
5 26 6 1 9 17 26 6 1 9 17
6 26 6 1 9 17 26 21 27 31 45
7 26 21 27 31 45 26 21 27 31 45
8 26 21 27 31 45 26 21 27 31 45
9 26 21 27 31 45 26 21 27 32
10 26 21 27 32 26 21 27 32
11 26 21 27 32 39 25 6 1 9 17
12 26 21 27 32 39 25 6 1 9 17
13 39 25 6 1 9 17 39 25 6 1 9 17
14 39 25 6 1 9 17 39 25 21 27 32
15 39 25 6 1 9 17 39 25 21 27 32
16 39 25 6 1 9 17 39 25 21 27 32
17 39 25 21 27 32 39 25 21 27 32
18 39 25 21 27 32 39 25 21 27 32
19 39 35 41 45 39 35 41 45
20 39 35 41 45 39 35 41 45
Table 3. Intermediate and optimal vehicle routes in Case 2.
Vehicle Index       Iteration 29       Iteration 31       Optimal Routes
1 7 1 9 15 32 7 1 9 15 31 45 7 1 9 15 31 45
2 7 1 9 15 32 7 1 9 15 31 45 7 1 9 15 31 45
3 7 1 9 15 32 7 1 9 15 31 45 7 1 9 15 32
4 7 1 9 15 32 7 1 9 15 31 45 7 1 9 15 32
5 7 1 9 15 32 7 1 9 15 31 45 7 1 9 17
6 7 1 9 15 32 7 1 9 15 32 7 1 9 17
7 7 1 9 15 32 7 1 9 15 32 26 6 1 9 17
8 7 1 9 15 32 7 1 9 15 32 26 6 1 9 17
9 7 1 9 15 32 7 1 9 15 32 26 6 1 9 17
10 7 1 9 17 7 1 9 15 32 26 6 1 9 17
11 7 1 9 17 7 1 9 15 32 26 6 1 9 17
12 7 1 9 17 7 1 9 15 32 26 21 27 31 45
13 7 2 21 27 31 45 7 1 9 17 26 21 27 31 45
14 7 2 21 27 31 45 7 1 9 17 26 21 27 32
15 7 2 21 27 31 45 7 1 9 17 26 21 27 32
16 7 2 21 27 31 45 26 6 1 9 17 26 21 27 32
17 7 2 21 27 31 45 26 6 1 9 17 26 21 27 32
18 26 6 1 9 17 26 6 1 9 17 26 21 27 32
19 26 6 1 9 17 26 21 27 31 45 26 21 27 32
20 26 6 1 9 17 26 21 27 31 45 26 21 27 32
21 26 21 27 31 45 26 21 27 31 45 26 21 27 32
22 26 21 27 31 45 26 21 27 31 45 39 25 6 1 9 17
23 26 21 27 31 45 26 21 27 31 45 39 25 6 1 9 17
24 26 21 27 31 45 26 21 27 31 45 39 25 6 1 9 17
25 26 21 27 31 45 26 21 27 32 39 25 6 1 9 17
26 26 21 27 31 45 26 21 27 32 39 25 6 1 9 17
27 26 21 27 32 26 21 27 32 39 25 6 1 9 17
28 26 21 27 32 26 21 27 32 39 25 6 1 9 17
29 26 21 27 32 26 21 27 32 39 25 21 27 32
30 26 21 27 32 39 25 6 1 9 17 39 25 21 27 32
31 26 21 27 32 39 25 6 1 9 17 39 25 21 27 32
32 39 25 6 1 9 17 39 25 6 1 9 17 39 25 21 27 32
33 39 25 6 1 9 17 39 25 6 1 9 17 39 25 21 27 32
34 39 25 6 1 9 17 39 25 21 27 32 39 25 21 27 32
35 39 25 6 1 9 17 39 25 21 27 32 39 25 21 27 32
36 39 25 21 27 32 39 35 41 45 39 25 21 27 32
37 39 25 21 27 32 39 35 41 45 39 35 41 45
38 39 35 41 45 39 35 41 45 39 35 41 45
39 39 35 41 45 39 35 41 45 39 35 41 45
40 39 35 41 45 39 35 41 45 39 35 41 45
Disclaimer/Publisher’s Note: The statements, opinions and data contained in all publications are solely those of the individual author(s) and contributor(s) and not of MDPI and/or the editor(s). MDPI and/or the editor(s) disclaim responsibility for any injury to people or property resulting from any ideas, methods, instructions or products referred to in the content.