
Analyzing the Impact of Government Subsidies on Carbon Emission Mitigation Considering Carriers’ Price-and-Service Competition and Green Shippers


Abstract
:1. Introduction
- (1)
- Should governments provide subsidies to competitive carriers in terms of price and service to support their green technology investment?
- (2)
- Is the government subsidy beneficial to decarbonization in the price-and-service competitive environment?
- (3)
- How do competition intensities and environmental awareness impact prices, profits, carbon emission reductions and the total social welfare?
2. Literature Review
2.1. Government Subsidies on Ports and Carriers
2.2. Carbon Emission Control in Shipping Supply Chains
2.3. Competition in Price and Service Between Ocean Carriers
3. The Model
3.1. Problem Description
3.2. Analysis Scenario
- (1)
- Scenario FP
- (2)
- Scenario GP
- (3)
- Scenario HP
3.3. Equilibrium Analysis
- (1)
- increases in and satisfies , ;
- (2)
- decreases in , and ;
- (3)
- varies in , and , ;
- (4)
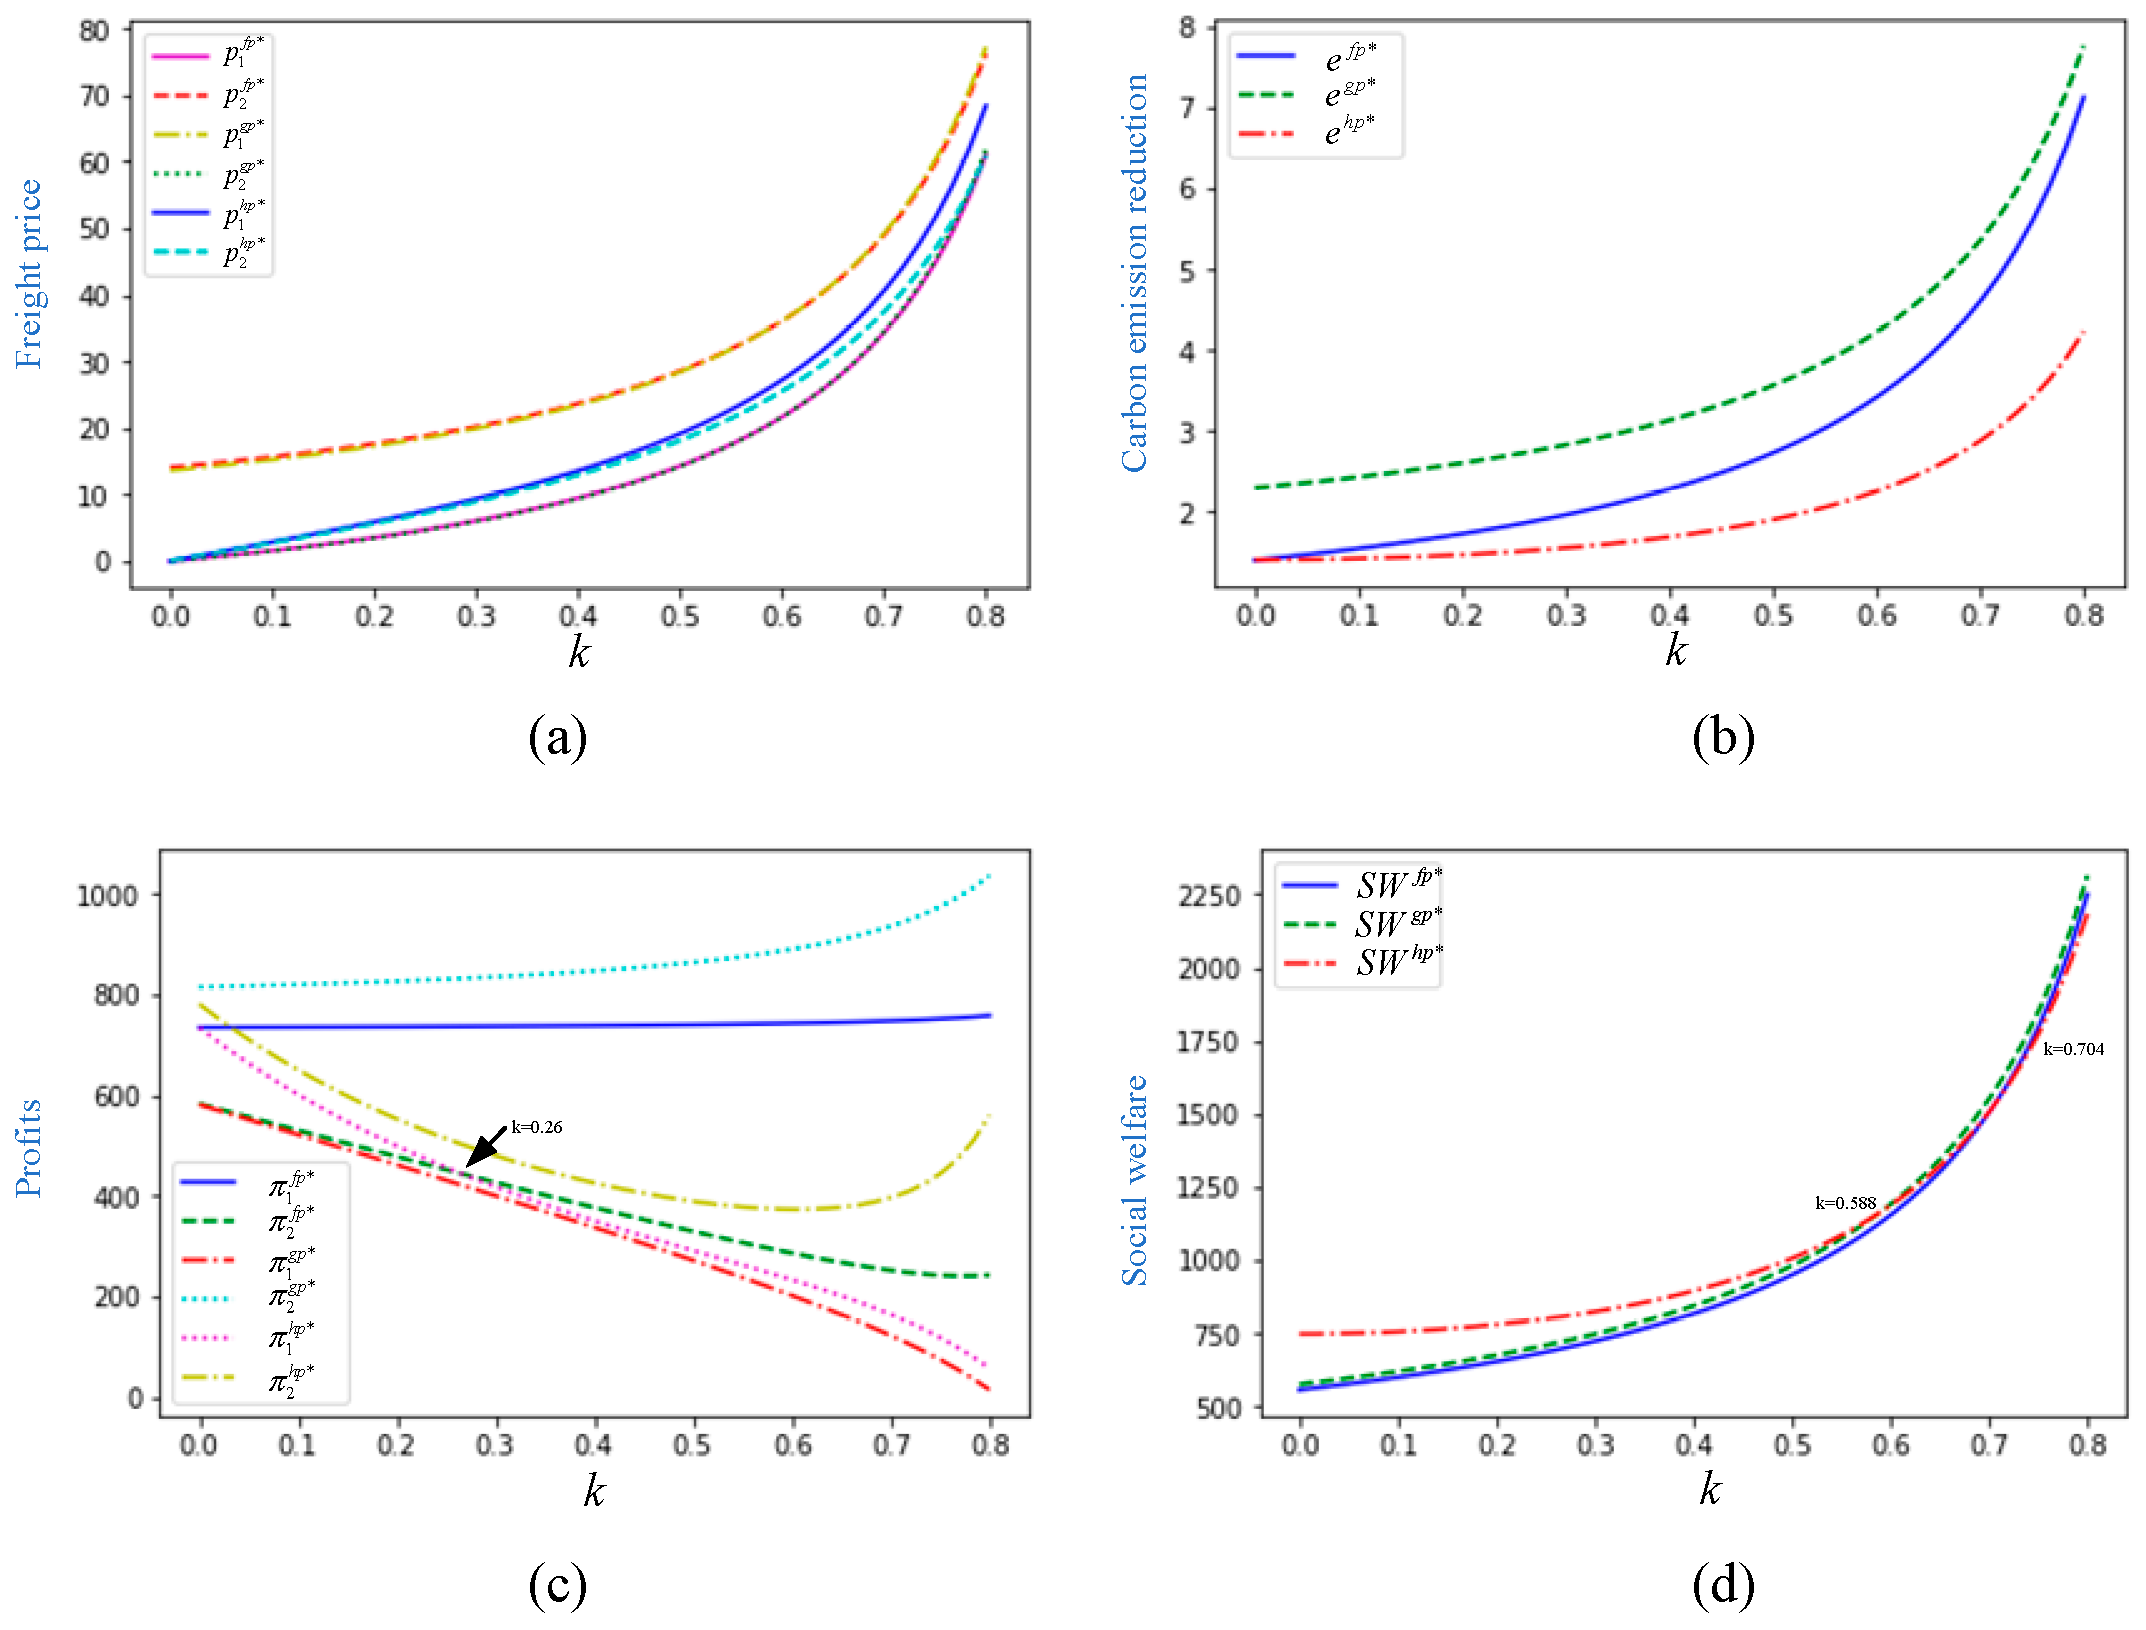
- increases in , and when is lower than 0.588, ; when belongs to [0.588, 0.704], ; when is higher than 0.704, .
- (1)
- decreases in , and , ;
- (2)
- decreases in , and ;
- (3)
- decreases in , and , ;
- (4)
- decreases in , when is lower than 2.14, ; when , .
- (1)
- increases in , and , ;
- (2)
- decreases in , and ;
- (3)
- increases in , and , ;
- (4)
- increases in , and .
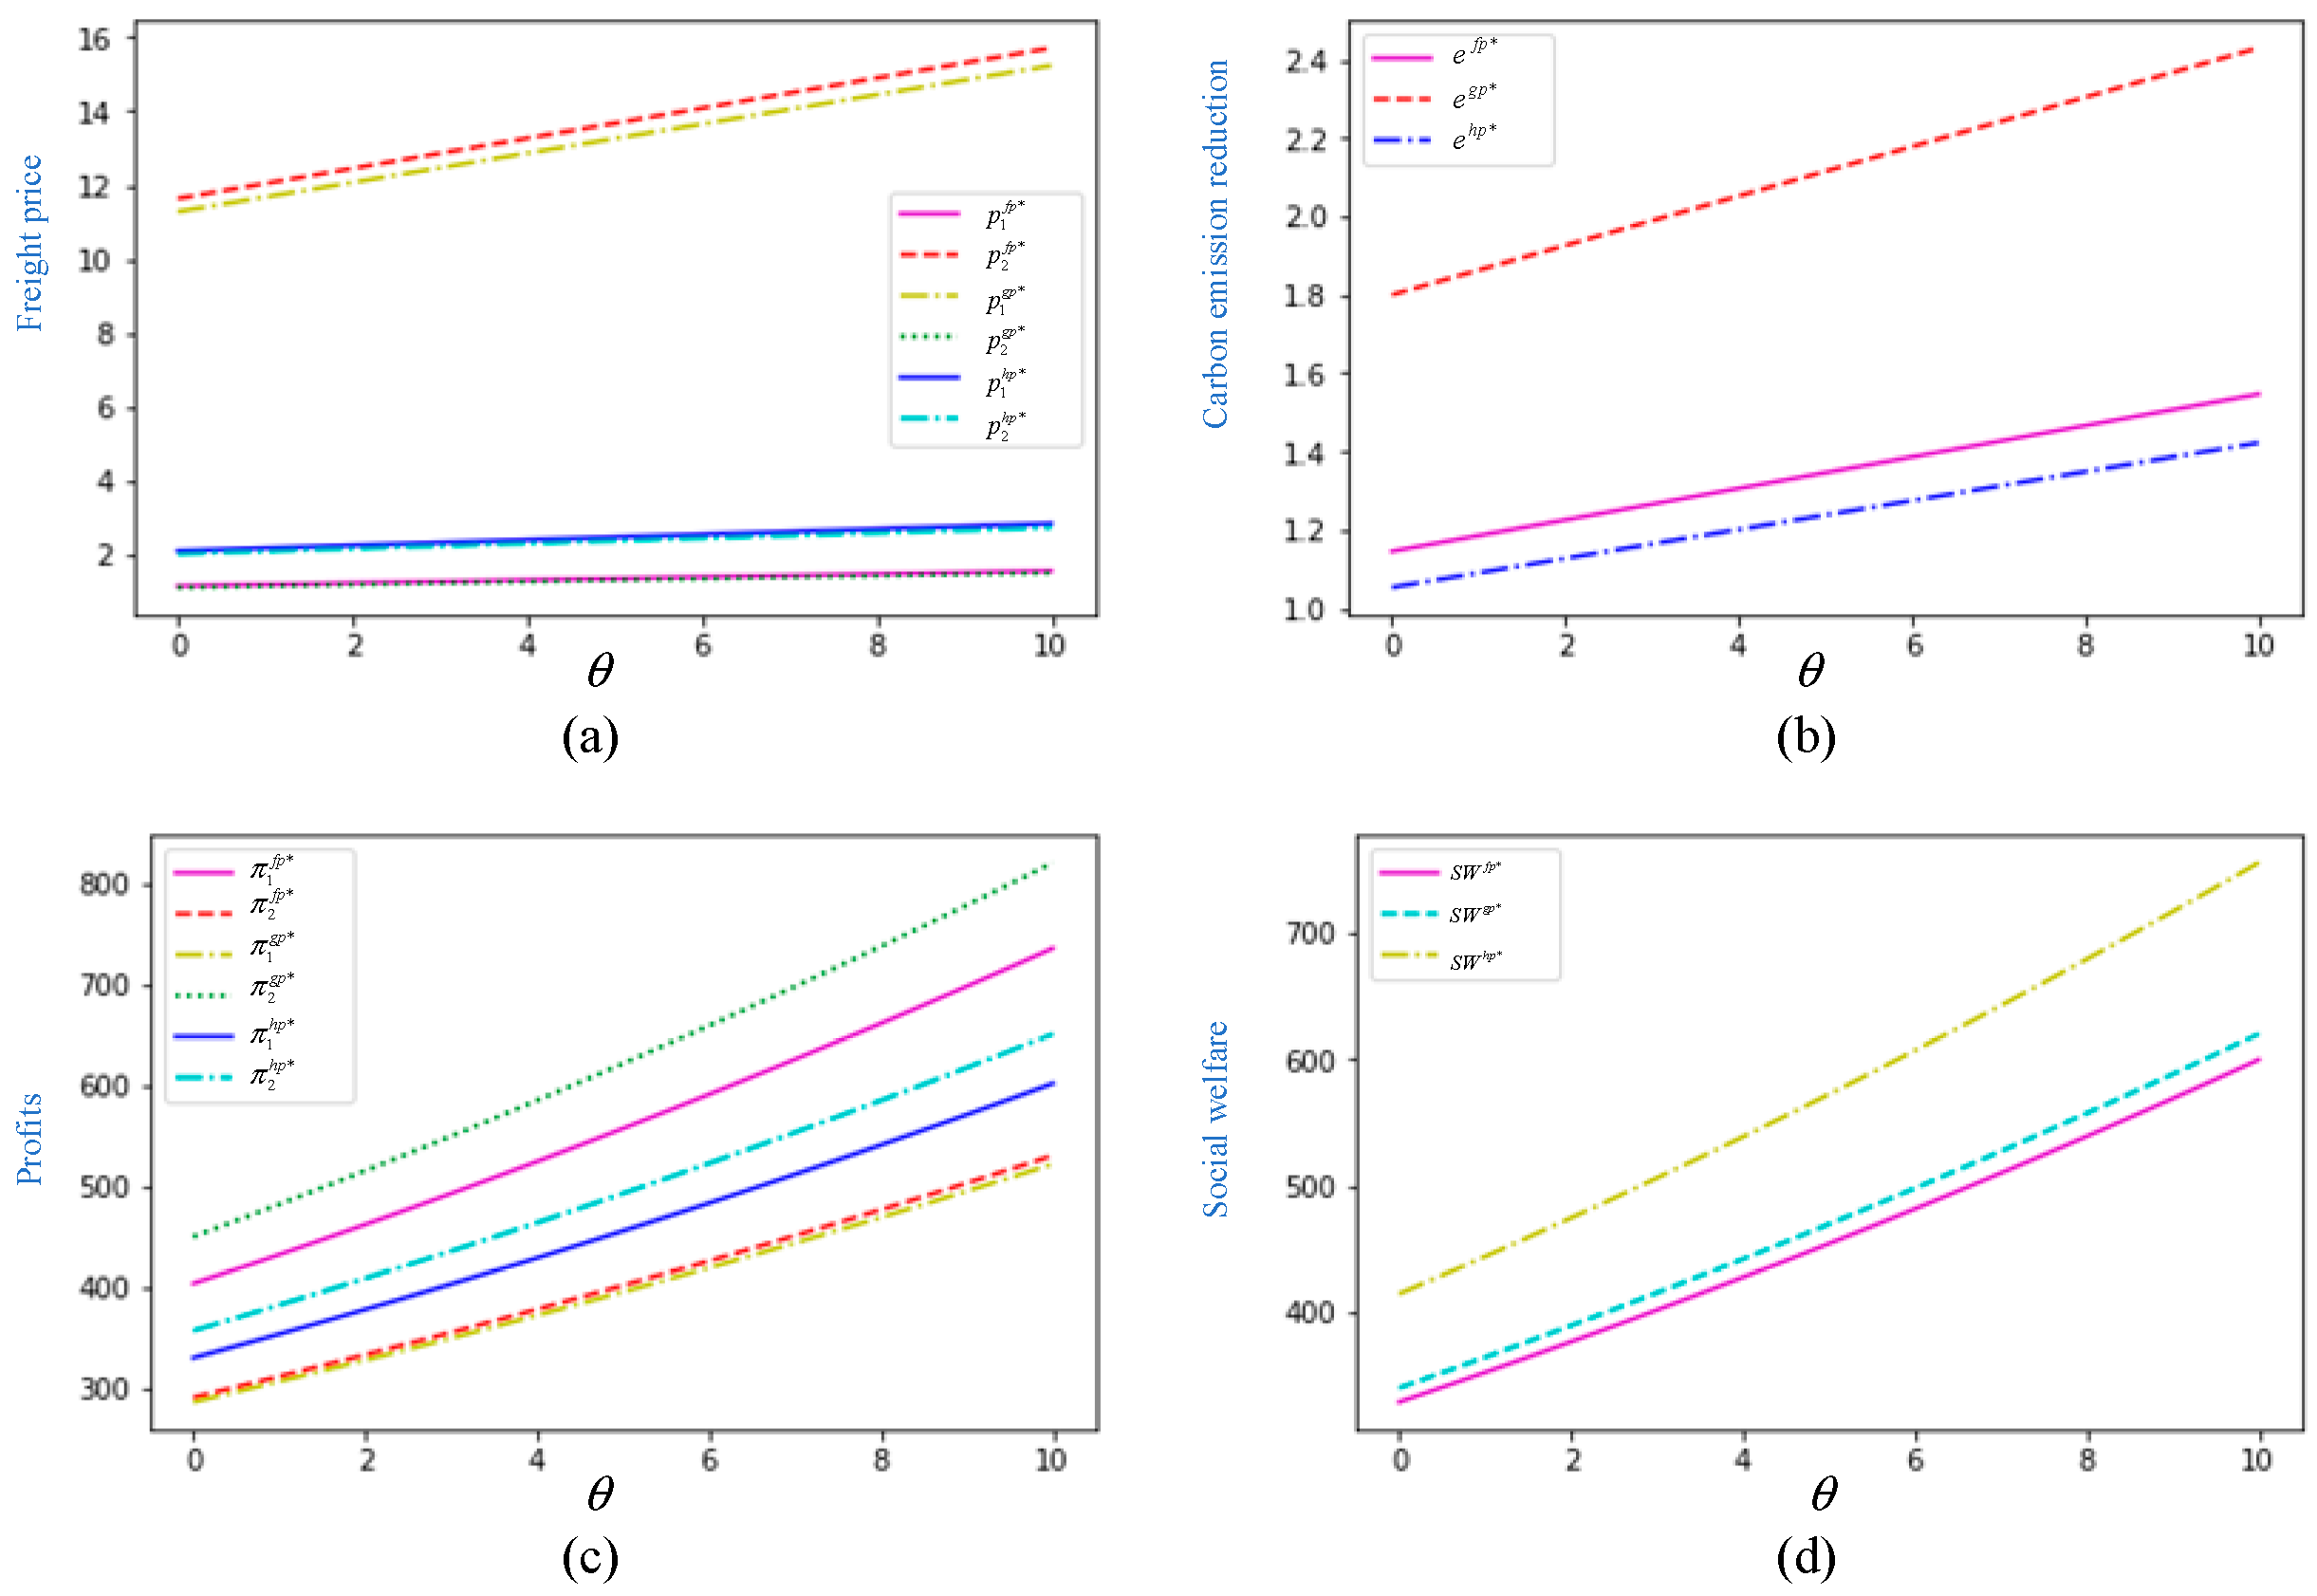
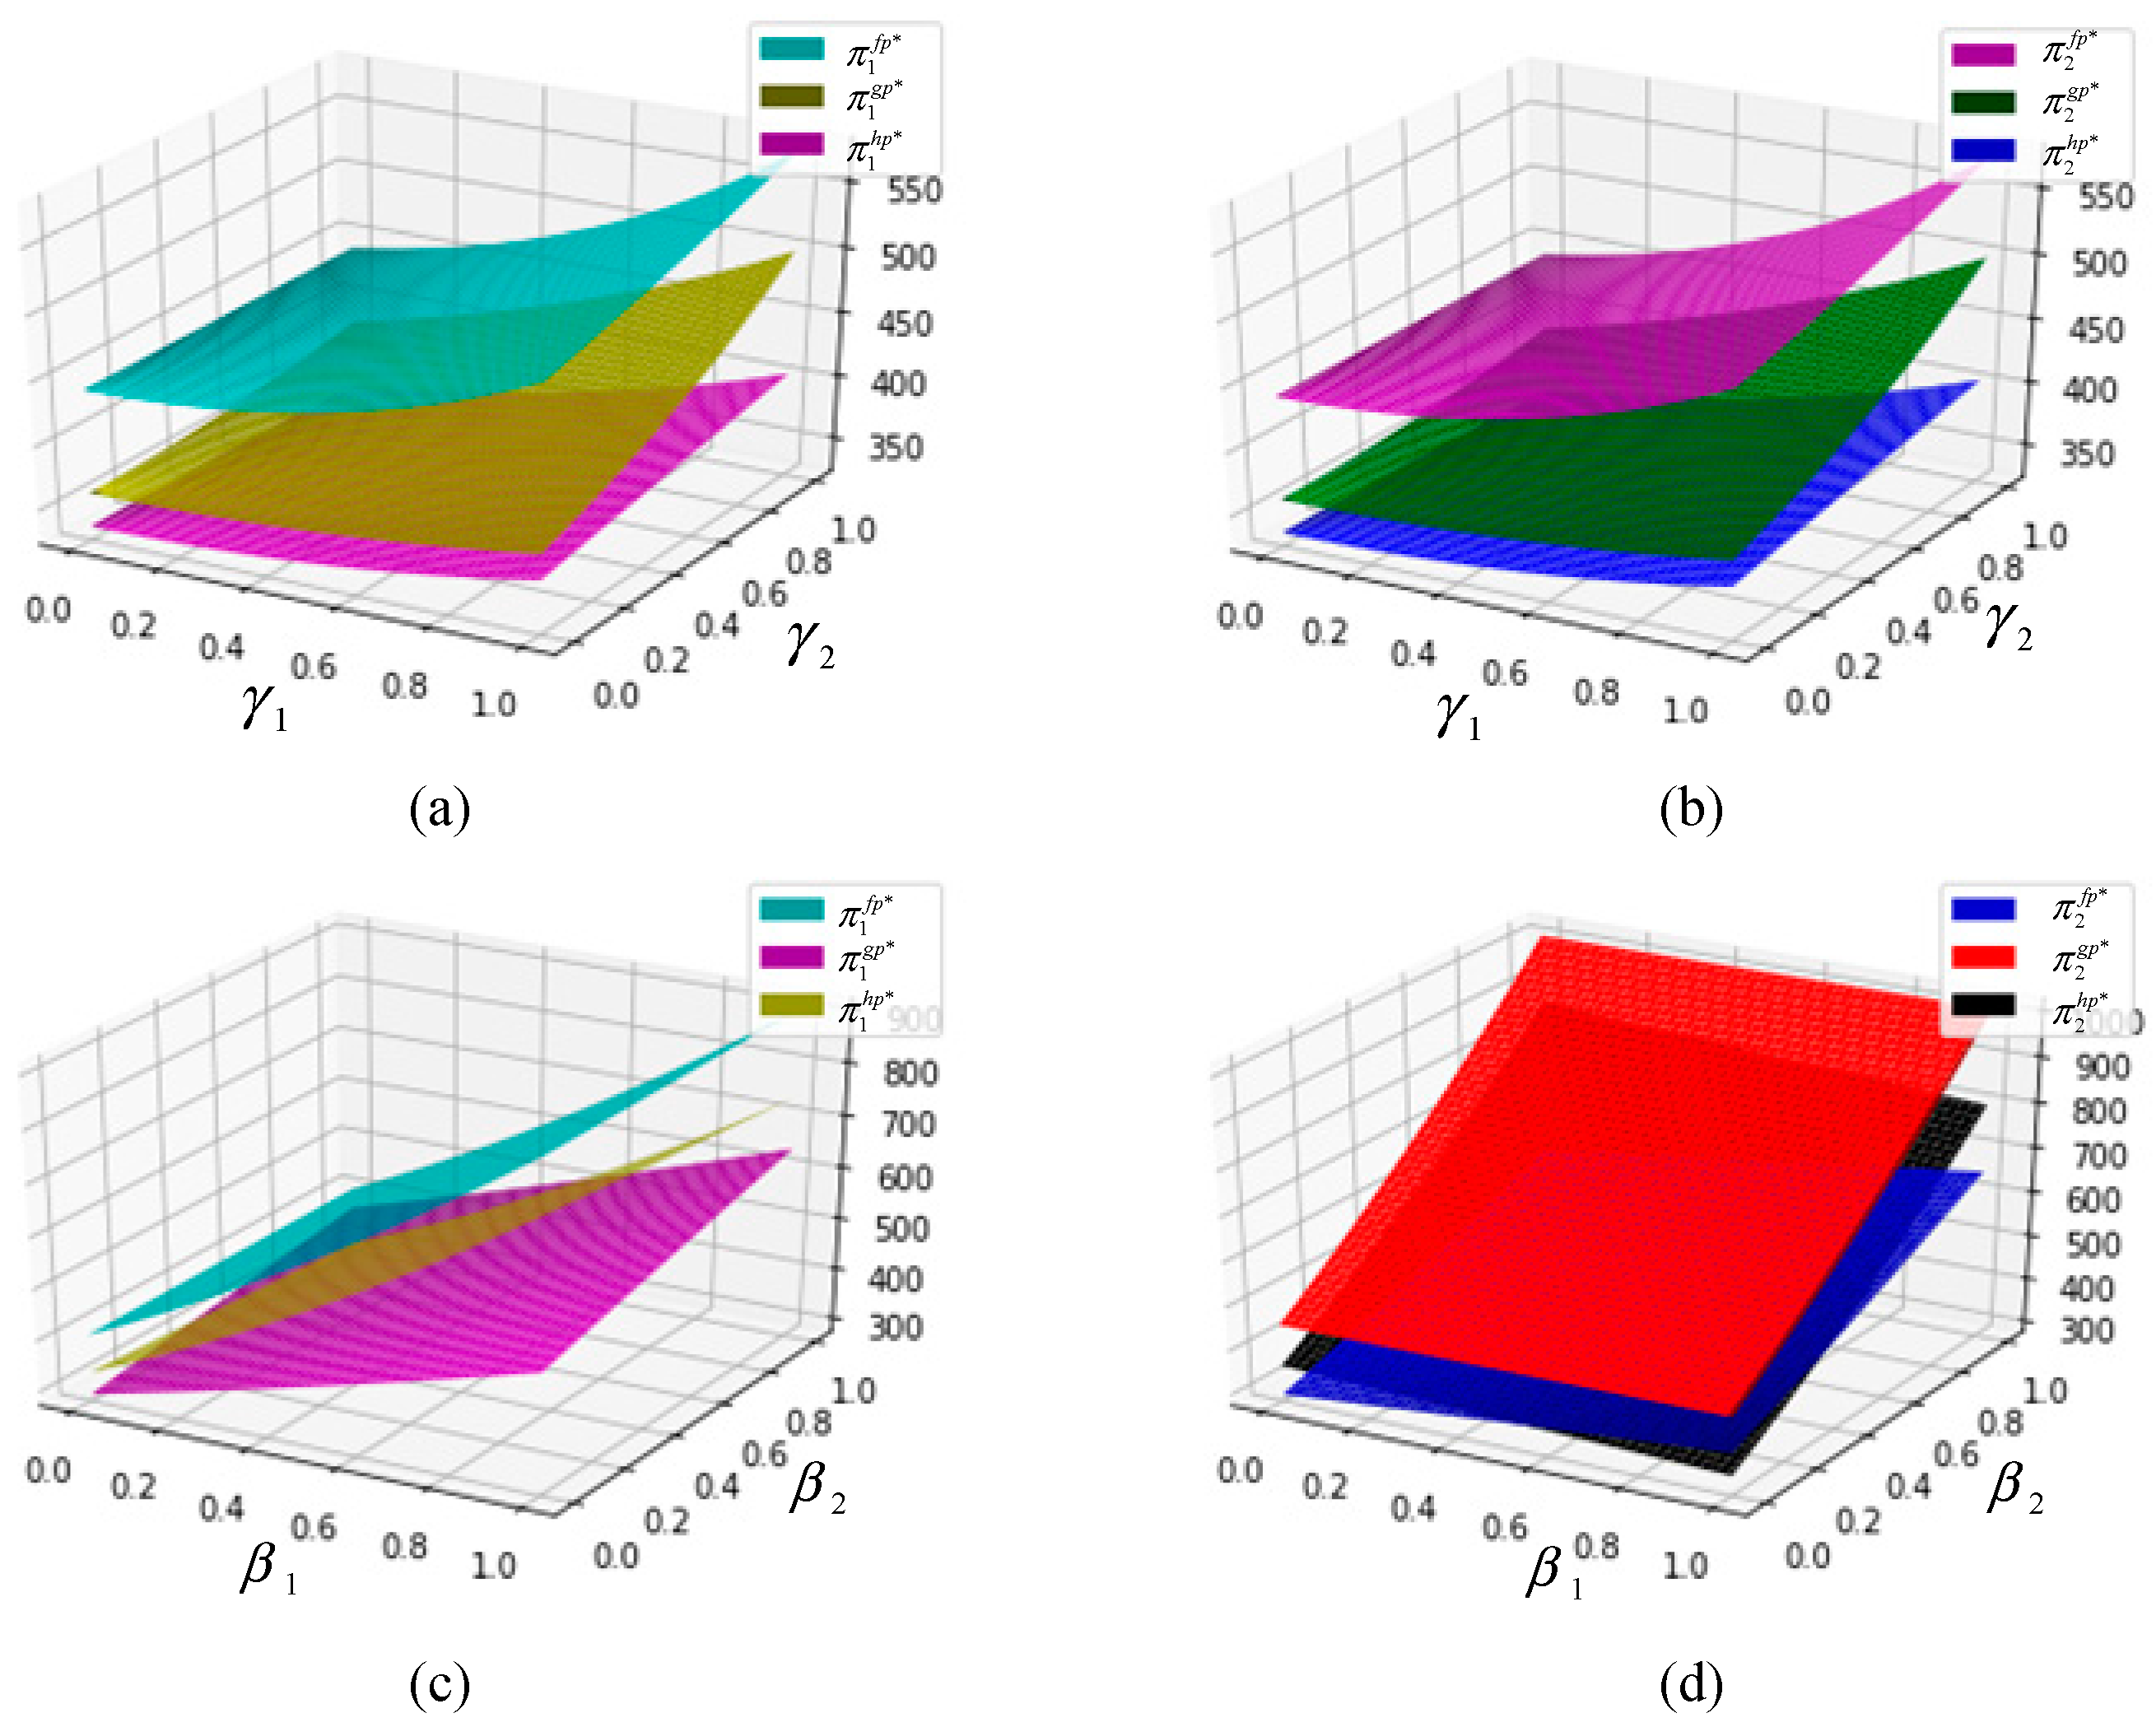
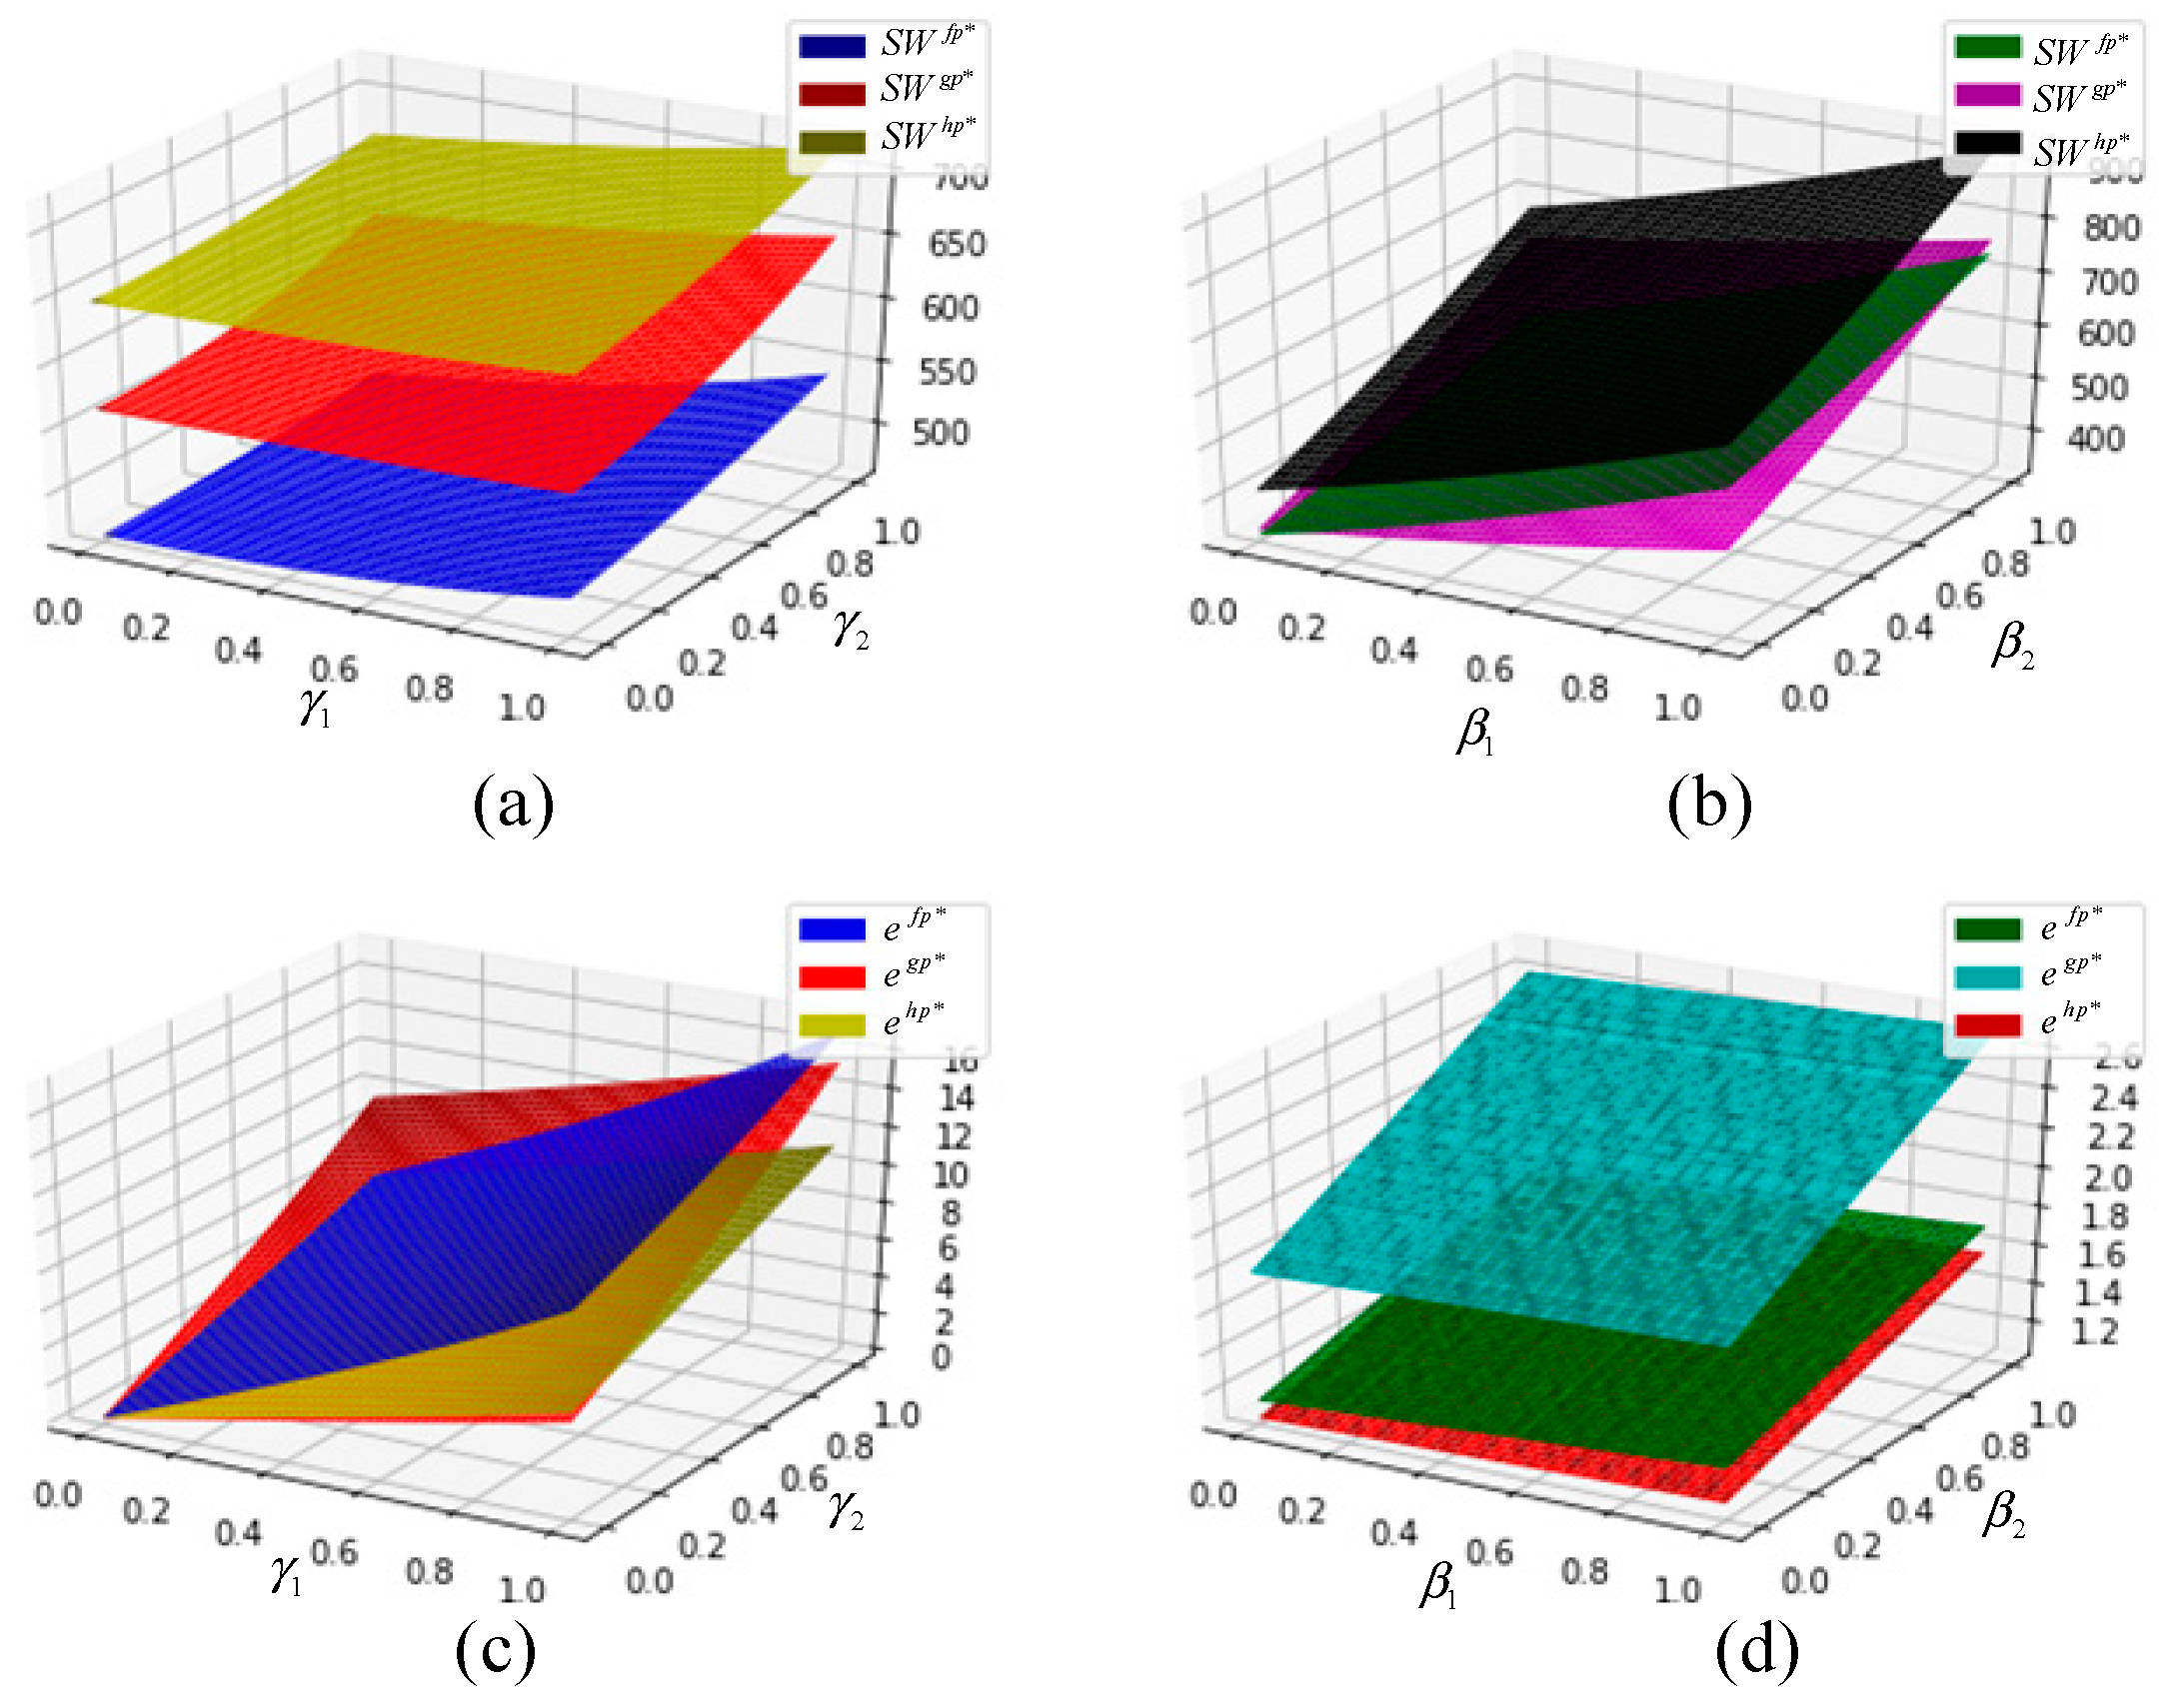
4. Numerical Analysis
5. Conclusions and Discussion
5.1. Main Findings
5.2. Managerial Implications
5.3. Limitations and Future Research
Author Contributions
Funding
Data Availability Statement
Conflicts of Interest
Appendix A
References
- Clarksons. Available online: https://www.clarksons.com/home/news-and-insights/2024/green-technology-alternative-fuel-uptake/ (accessed on 17 July 2024).
- Liu, P.; Xu, Y.; Xie, X.; Turkmen, S.; Fan, S.; Ghassemi, H.; He, G. Achieving the global net-zero maritime shipping goal: The urgencies, challenges, regulatory measures and strategic solutions. Ocean Coast. Manag. 2024, 256, 107301. [Google Scholar] [CrossRef]
- Faber, J.; Hanayama, S.; Zhang, S.; Pereda, P.; Comer, B.; Hauerhof, E.; van der Loeff, W.S.; Smith, T.; Zhang, Y.; Kosaka, H.; et al. Fourth IMO Greenhouse Gas Study 2020; International Maritime Organization: London, UK, 2021. [Google Scholar]
- Review for Maritime Report. Available online: https://unctad.org/publication/review-maritime-transport-2024 (accessed on 22 October 2024).
- Zhang, G.; Xu, J.; Zhang, Z.; Chen, W. Optimal decision-making and coordination of the shipping logistics service supply chain cooperation mode under the carbon quota and trading mechanism. Ocean Coast. Manag. 2024, 255, 107240. [Google Scholar]
- Luo, C.; Zhou, Y.; Mu, M.; Zhang, Q.; Cao, Z. Subsidy, tax or green awareness: Government policy selection for promoting initial shore power usage and sustaining long-run use. J. Clean. Prod. 2024, 442, 140946. [Google Scholar]
- Black, S.; Parry, I.; Singh, S.; Vernon-Lin, N. Destination Net Zero: The Urgent Need for a Global Carbon Tax on Aviation and Shipping; International Monetary Fund: Washington, DC, USA, 2024. [Google Scholar]
- Gualandi, R. IMO Adopts More Ambitious Ghg Targets for Global Shipping Sector; Carbon Pulse: London, UK, 2023; Available online: https://carbon-pulse.com/211324/ (accessed on 7 July 2023).
- Smith, T.; Baresic, D.; Fahnestock, J.; Galbraith, C.; Velandia Perico, C.; Rojon, I.; Shaw, A. A Strategy for the Transition to Zero-Emission Shipping. In An Analysis of Transition Pathways, Scenarios, and Levers for Change; Global Maritime Forum: Copenhagen, Denmark, 2021; Available online: https://globalmaritimeforum.org/report/a-strategy-for-the-transition-to-zero-emission-shipping/ (accessed on 27 October 2021).
- Patricksson, Ø.S.; Fagerholt, K.; Rakke, J.G. The fleet renewal problem with regional emission limitations: Case study from Roll-on/Roll-off shipping. Transp. Res. Part C Emerg. Technol. 2015, 56, 346–358. [Google Scholar]
- Yu, J.; Voß, S.; Tang, G. Strategy development for retrofitting ships for implementing shore side electricity. Transp. Res. D Transp. Environ. 2019, 74, 201–213. [Google Scholar] [CrossRef]
- ICS Maritime Barometer Report 2023–2024. Available online: https://www.ics-shipping.org/resource/ics-maritime-barometer-report-2023-2024-2/ (accessed on 1 September 2024).
- Liu, J.; Wang, J. Carrier alliance incentive analysis and coordination in a maritime transport chain based on service competition. Transp. Res. E Logist. Transp. Rev. 2019, 128, 333–355. [Google Scholar]
- Lu, T.; Chen, Y.J.; Fransoo, J.C.; Lee, C.Y. Shipping to heterogeneous customers with competing carriers. Manuf. Serv. Oper. Manag. 2020, 22, 850–867. [Google Scholar]
- Hall, P.; Wager, W. Service quality in bulk chemical transportation: An Empirical investigation of Shipper perceptions. Logist. Transp. Rev. 1996, 32, 231–246. [Google Scholar]
- Wang, Y.; Hou, G. A duopoly game with heterogeneous green supply chains in optimal price and market stability with consumer green preference. J. Clean. Prod. 2020, 255, 120161. [Google Scholar]
- Tao, F.; Zhou, Y.; Bian, J.; Lai, K.K. Optimal channel structure for a green supply chain with consumer green-awareness demand. Ann. Oper. Res. 2023, 324, 601–628. [Google Scholar]
- Wang, S.; Qi, J.; Laporte, G. Governmental subsidy plan modeling and optimization for liquefied natural gas as fuel for maritime transportation. Transp. Res. B-Meth 2022, 155, 304–321. [Google Scholar] [CrossRef]
- Wang, M.; Tan, Z.; Du, Y. Coordinating inland river ports through optimal subsidies from the container shipping carrier. Transp. Res. E Logist. Transp. Rev. 2024, 189, 103671. [Google Scholar]
- He, L.; Wang, H.; Liu, F. Emission abatement in low-carbon supply chains with government subsidy and information asymmetry. Int. J. Prod. Res. 2024, 62, 6598–6626. [Google Scholar]
- Huang, X.; Liu, G.; Zheng, P. Dynamic analysis of a low-carbon maritime supply chain considering government policies and social preferences. Ocean Coast. Manag. 2023, 239, 106564. [Google Scholar]
- Wang, H.; Wang, C.; Li, M.; Xie, Y. Blockchain technology investment strategy for shipping companies under competition. Ocean Coast. Manag. 2023, 243, 106696. [Google Scholar] [CrossRef]
- Wang, J.; Zhu, W. Analyzing the development of competition and cooperation among ocean carriers considering the impact of carbon tax policy. Transp. Res. E Logist. Transp. Rev. 2023, 175, 103157. [Google Scholar]
- Yi, T.; Meiping, W.; Shaorui, Z. Pricing and contract preference in maritime supply chains with downstream competition impact of risk-aversion and contract unobservability. Ocean Coast. Manag. 2023, 242, 106691. [Google Scholar] [CrossRef]
- Lai, X.; Tao, Y.; Wang, F.; Zou, Z. Sustainability investment in maritime supply chain with risk behavior and information sharing. Int. J. Prod. Econ. 2019, 218, 16–29. [Google Scholar]
- Li, D.; Qu, Y.; Ma, Y. Study on the impact of subsidies for overlapping hinterland shippers on port competition. Transp. Res. Part. A Policy Pract. 2020, 135, 24–37. [Google Scholar]
- Gong, X.; Li, Z.C. Determination of subsidy and emission control coverage under competition and cooperation of China-Europe Railway Express and liner shipping. Transp. Policy 2022, 125, 323–335. [Google Scholar]
- Huang, X.; Zheng, P.; Liu, G. Non-cooperative and Nash-bargaining game of a two-parallel maritime supply chain considering government subsidy and forwarder’s CSR strategy: A dynamic perspective. Chaos. Soliton. Fract. 2024, 178, 114300. [Google Scholar] [CrossRef]
- Jasmi, M.F.; Fernando, Y. Drivers of maritime green supply chain management. Sustain. Cities Soc. 2018, 43, 366–383. [Google Scholar] [CrossRef]
- Zhuge, D.; Wang, S.; Zhen, L.; Laporte, G. Subsidy design in a vessel speed reduction incentive program under government policies. Nav. Res. Log. 2021, 68, 344–358. [Google Scholar] [CrossRef]
- Song, Z.; Tang, W.; Zhao, R.; Zhang, G. Implications of government subsidies on shipping companies’ shore power usage strategies in port. Transp. Res. E Logist. Transp. Rev. 2022, 165, 102840. [Google Scholar] [CrossRef]
- Chen, Z.; Zhang, Z.; Bian, Z.; Dai, L.; Hu, H. Subsidy policy optimization of multimodal transport on emission reduction considering carrier pricing game and shipping resilience: A case study of Shanghai port. Ocean Coast. Manag. 2023, 243, 106760. [Google Scholar] [CrossRef]
- Peng, Y.T.; Wang, Y.; Li, Z.C.; Sheng, D. Subsidy policy selection for shore power promotion: Subsidizing facility investment or price of shore power? Transp. Policy 2023, 140, 128–147. [Google Scholar] [CrossRef]
- Zhen, L.; Yuan, Y.; Zhuge, D.; Psaraftis, H.N.; Wang, S. Subsidy strategy design for shore power utilization and promotion. Marit. Policy Manag. 2024, 51, 1606–1638. [Google Scholar] [CrossRef]
- Li, Z.; Wang, L.; Wang, G.; Xin, X.; Chen, K.; Zhang, T. Investment and subsidy strategy for low-carbon port operation with blockchain adoption. Ocean Coast. Manag. 2024, 248, 106966. [Google Scholar] [CrossRef]
- Hu, Q.; Gu, W.; Wang, S. Optimal subsidy scheme design for promoting intermodal freight transport. Transp. Res. E Logist. Transp. Rev. 2022, 157, 102561. [Google Scholar] [CrossRef]
- Wang, J.; Li, H.; Yang, Z.; Ge, Y.E. Shore power for reduction of shipping emission in port: A bibliometric analysis. Transp. Res. E Logist. Transp. Rev. 2024, 188, 103639. [Google Scholar] [CrossRef]
- Zhong, Z.; Jin, H.; Sun, Y.; Zhou, Y. Two incentive policies for green shore power system considering multiple objectives. Comput. Ind. Eng. 2024, 194, 110338. [Google Scholar]
- Tseng, P.H.; Pilcher, N. A study of the potential of shore power for the port of Kaohsiung, Taiwan: To introduce or not to introduce? Res. Transp. Bus. Manag. 2015, 17, 83–91. [Google Scholar]
- Jiao, Y.; Wang, C. Shore power vs low sulfur fuel oil: Pricing strategies of carriers and port in a transport chain. Int. J. Low-Carbon. Tec. 2021, 16, 715–724. [Google Scholar] [CrossRef]
- Hoang, A.T.; Tran, V.D.; Dong, V.H.; Le, A.T. An experimental analysis on physical properties and spray characteristics of an ultrasound-assisted emulsion of ultra-low-sulphur diesel and Jatropha-based biodiesel. J. Mar. Eng. Technol. 2022, 21, 73–81. [Google Scholar]
- Hoang, A.T.; Foley, A.M.; Nižetić, S.; Huang, Z.; Ong, H.C.; Ölçer, A.I.; Nguyen, X.P. Energy-related approach for reduction of CO2 emissions: A critical strategy on the port-to-ship pathway. J. Clean. Prod. 2022, 355, 131772. [Google Scholar]
- Bui, T.M.; Dinh, T.Q.; Marco, J.; Watts, C. An energy management strategy for DC hybrid electric propulsion system of marine vessels. In Proceedings of the 2018 5th International Conference on Control, Decision and Information Technologies (CoDIT), Thessaloniki, Greece, 10–13 April 2018. [Google Scholar]
- Gašparović, G.; Klarin, B. Techno-economical analysis of replacing Diesel propulsion with hybrid electric-wind propulsion on ferries in the Adriatic. In Proceedings of the 2016 International Multidisciplinary Conference on Computer and Energy Science (SpliTech), Split, Croatia, 13–15 July 2016. [Google Scholar]
- Li, J.; Wang, H.; Shi, V.; Sun, Q. Manufacturer’s choice of online selling format in a dual-channel supply chain with green products. Eur. J. Oper. Res. 2024, 318, 131–142. [Google Scholar]
- Surucu-Balci, E.; Iris, Ç.; Balci, G. Digital information in maritime supply chains with blockchain and cloud platforms: Supply chain capabilities, barriers, and research opportunities. Technol. Forecast. Soc. 2024, 198, 122978. [Google Scholar]
- Cui, H.; Notteboom, T. Modelling emission control taxes in port areas and port privatization levels in port competition and co-operation sub-games. Transp. Res. D Transp. Environ. 2017, 56, 110–128. [Google Scholar]
- Wang, X.; Zhang, S. The interplay between subsidy and regulation under competition. IEEE Trans. Syst. Man. Cybern. Syst. 2022, 53, 1038–1050. [Google Scholar]
- Yang, L.; Cai, Y.; Wei, Y.; Huang, S. Choice of technology for emission control in port areas: A supply chain perspective. J. Clean. Prod. 2019, 240, 118105. [Google Scholar] [CrossRef]
- Wan, Z.; Zhang, T.; Sha, M.; Guo, W.; Jin, Y.; Guo, J.; Liu, Y. Evaluation of emission reduction strategies for berthing containerships: A case study of the Shekou Container Terminal. J. Clean. Prod. 2021, 299, 126820. [Google Scholar] [CrossRef]
- Livaniou, S.; Papadopoulos, G.A. Liquefied Natural Gas (LNG) as a Transitional Choice Replacing Marine Conventional Fuels (Heavy Fuel Oil/Marine Diesel Oil), towards the Era of Decarbonisation. Sustainability 2022, 14, 16364. [Google Scholar] [CrossRef]
- Tsolakis, N.; Zissis, D.; Papaefthimiou, S.; Korfiatis, N. Towards AI driven environmental sustainability: An application of automated logistics in container port terminals. Int. J. Prod. Res. 2022, 60, 4508–4528. [Google Scholar]
- Fan, L.; Yu, Y.; Yin, J. Impact of Sulphur Emission Control Areas on port state control’s inspection outcome. Marit. Policy Manag. 2023, 50, 908–923. [Google Scholar]
- Liu, J.; Xu, H.; Lyu, Y. Emission reduction technologies for shipping supply chains under carbon tax with knowledge sharing. Ocean Coast. Manag. 2023, 246, 106869. [Google Scholar] [CrossRef]
- Kong, Y.; Liu, J.; Chen, J. Exploring the carbon abatement measures in maritime supply chain: A scenario-based system dynamics approach. Int. J. Prod. Res. 2023, 61, 6131–6152. [Google Scholar]
- Wang, Q. Charting a greener course: China’s recent legal strategies in shore power promotion for achieving maritime emission targets. Mar. Policy 2024, 170, 106386. [Google Scholar]
- Gelareh, S.; Nickel, S.; Pisinger, D. Liner shipping hub network design in a competitive environment. Transp. Res. E Logist. Transp. Rev. 2010, 46, 991–1004. [Google Scholar]
- Wang, H.; Meng, Q.; Zhang, X. Game-theoretical models for competition analysis in a new emerging liner container shipping market. Transport. Res. B-Meth. 2014, 70, 201–227. [Google Scholar] [CrossRef]
- Lee, E.S.; Song, D.W. Competition and Co-Operation in Maritime Logistics Operations. In Handbook of Ocean Container Transport Logistics: Making Global Supply Chains Effective; Springer: Berlin/Heidelberg, Germany, 2014. [Google Scholar]
- Song, Z.; Tang, W.; Zhao, R. Liner alliances with heterogeneous price level and service competition: Partial vs. full. Omega 2021, 103, 102414. [Google Scholar]
- Wang, J.; Xu, S.; Wu, L.; Wu, S.; Liu, Y. Multidimensional container shipping alliance decisions among competitors: Impact of capacity constraints and market competition. Transp. Res. E Logist. Transp. Rev. 2024, 190, 103694. [Google Scholar] [CrossRef]
- Tsay, A.A.; Agrawal, N. Channel dynamics under price and service competition. Manuf. Serv. Oper. Manag. 2000, 2, 372–391. [Google Scholar] [CrossRef]
- Gao, J.; Xiao, Z.; Wei, H.; Zhou, G. Dual-channel green supply chain management with eco-label policy: A perspective of two types of green products. Comput. Ind. Eng. 2020, 146, 106613. [Google Scholar] [CrossRef]
- Zhang, C.; Liu, Y.; Han, G. Two-stage pricing strategies of a dual-channel supply chain considering public green preference. Comput. Ind. Eng. 2021, 151, 106988. [Google Scholar]
- Zhou, X.; Gao, C.; Zhang, D. Product service supply chain network competition: An equilibrium with multiple tiers and members. Int. J. Prod. Res. 2024, 62, 7324–7341. [Google Scholar]
- Che, C.; Chen, Y.; Zhang, X.; Zhang, Z. The Impact of Different Government Subsidy Methods on Low-Carbon Emission Reduction Strategies in Dual-Channel Supply Chain. Complexity 2021, 2021, 6668243. [Google Scholar] [CrossRef]


| Symbols | Description |
|---|---|
| Potential market share | |
| Service level | |
| Competition intensity between carriers | |
| Service level intensity from carriers | |
| Degree of green preference from shippers | |
| Carbon emission reduction | |
| Port service price | |
| Profit of ports | |
| Social welfare |
| Variable | Optimal Results |
|---|---|
| Variable | Optimal Results |
|---|---|
| Variable | Optimal Results |
|---|---|
Disclaimer/Publisher’s Note: The statements, opinions and data contained in all publications are solely those of the individual author(s) and contributor(s) and not of MDPI and/or the editor(s). MDPI and/or the editor(s) disclaim responsibility for any injury to people or property resulting from any ideas, methods, instructions or products referred to in the content. |
© 2025 by the authors. Licensee MDPI, Basel, Switzerland. This article is an open access article distributed under the terms and conditions of the Creative Commons Attribution (CC BY) license (https://creativecommons.org/licenses/by/4.0/).
Share and Cite
Yang, L.; Chen, D.; Chen, Y.; Zhang, Z. Analyzing the Impact of Government Subsidies on Carbon Emission Mitigation Considering Carriers’ Price-and-Service Competition and Green Shippers. Systems 2025, 13, 249. https://doi.org/10.3390/systems13040249
Yang L, Chen D, Chen Y, Zhang Z. Analyzing the Impact of Government Subsidies on Carbon Emission Mitigation Considering Carriers’ Price-and-Service Competition and Green Shippers. Systems. 2025; 13(4):249. https://doi.org/10.3390/systems13040249
Chicago/Turabian StyleYang, Lijuan, Duanyu Chen, Youyuan Chen, and Zhifeng Zhang. 2025. "Analyzing the Impact of Government Subsidies on Carbon Emission Mitigation Considering Carriers’ Price-and-Service Competition and Green Shippers" Systems 13, no. 4: 249. https://doi.org/10.3390/systems13040249
APA StyleYang, L., Chen, D., Chen, Y., & Zhang, Z. (2025). Analyzing the Impact of Government Subsidies on Carbon Emission Mitigation Considering Carriers’ Price-and-Service Competition and Green Shippers. Systems, 13(4), 249. https://doi.org/10.3390/systems13040249