
Resilience Analysis of Seaport–Dry-Port Network in Container Transport: Multi-Stage Load Redistribution Dynamics Following Cascade Failure


Abstract
:1. Introduction
2. Literature Review
2.1. Resilience of Seaport–Dry-Port Network
2.2. Cascading Failure of Container Shipping Network
3. Methodology
3.1. Complex Network Description and Cascading Failure Process of SDNCT
3.2. Cascade Model for SDNCT with Multi-Stage Load Redistribution Strategy (CM-SDNCT-MLRS)
3.2.1. Motter–Lai Cascade Model
3.2.2. SDNCT Cascade Model
- (1)
- It remains in the state of operation if .
- (2)
- It transitions to the state if , with a probability of further degradation.
- (3)
- It shifts to the state if .
- (4)
- It enters the state if and .
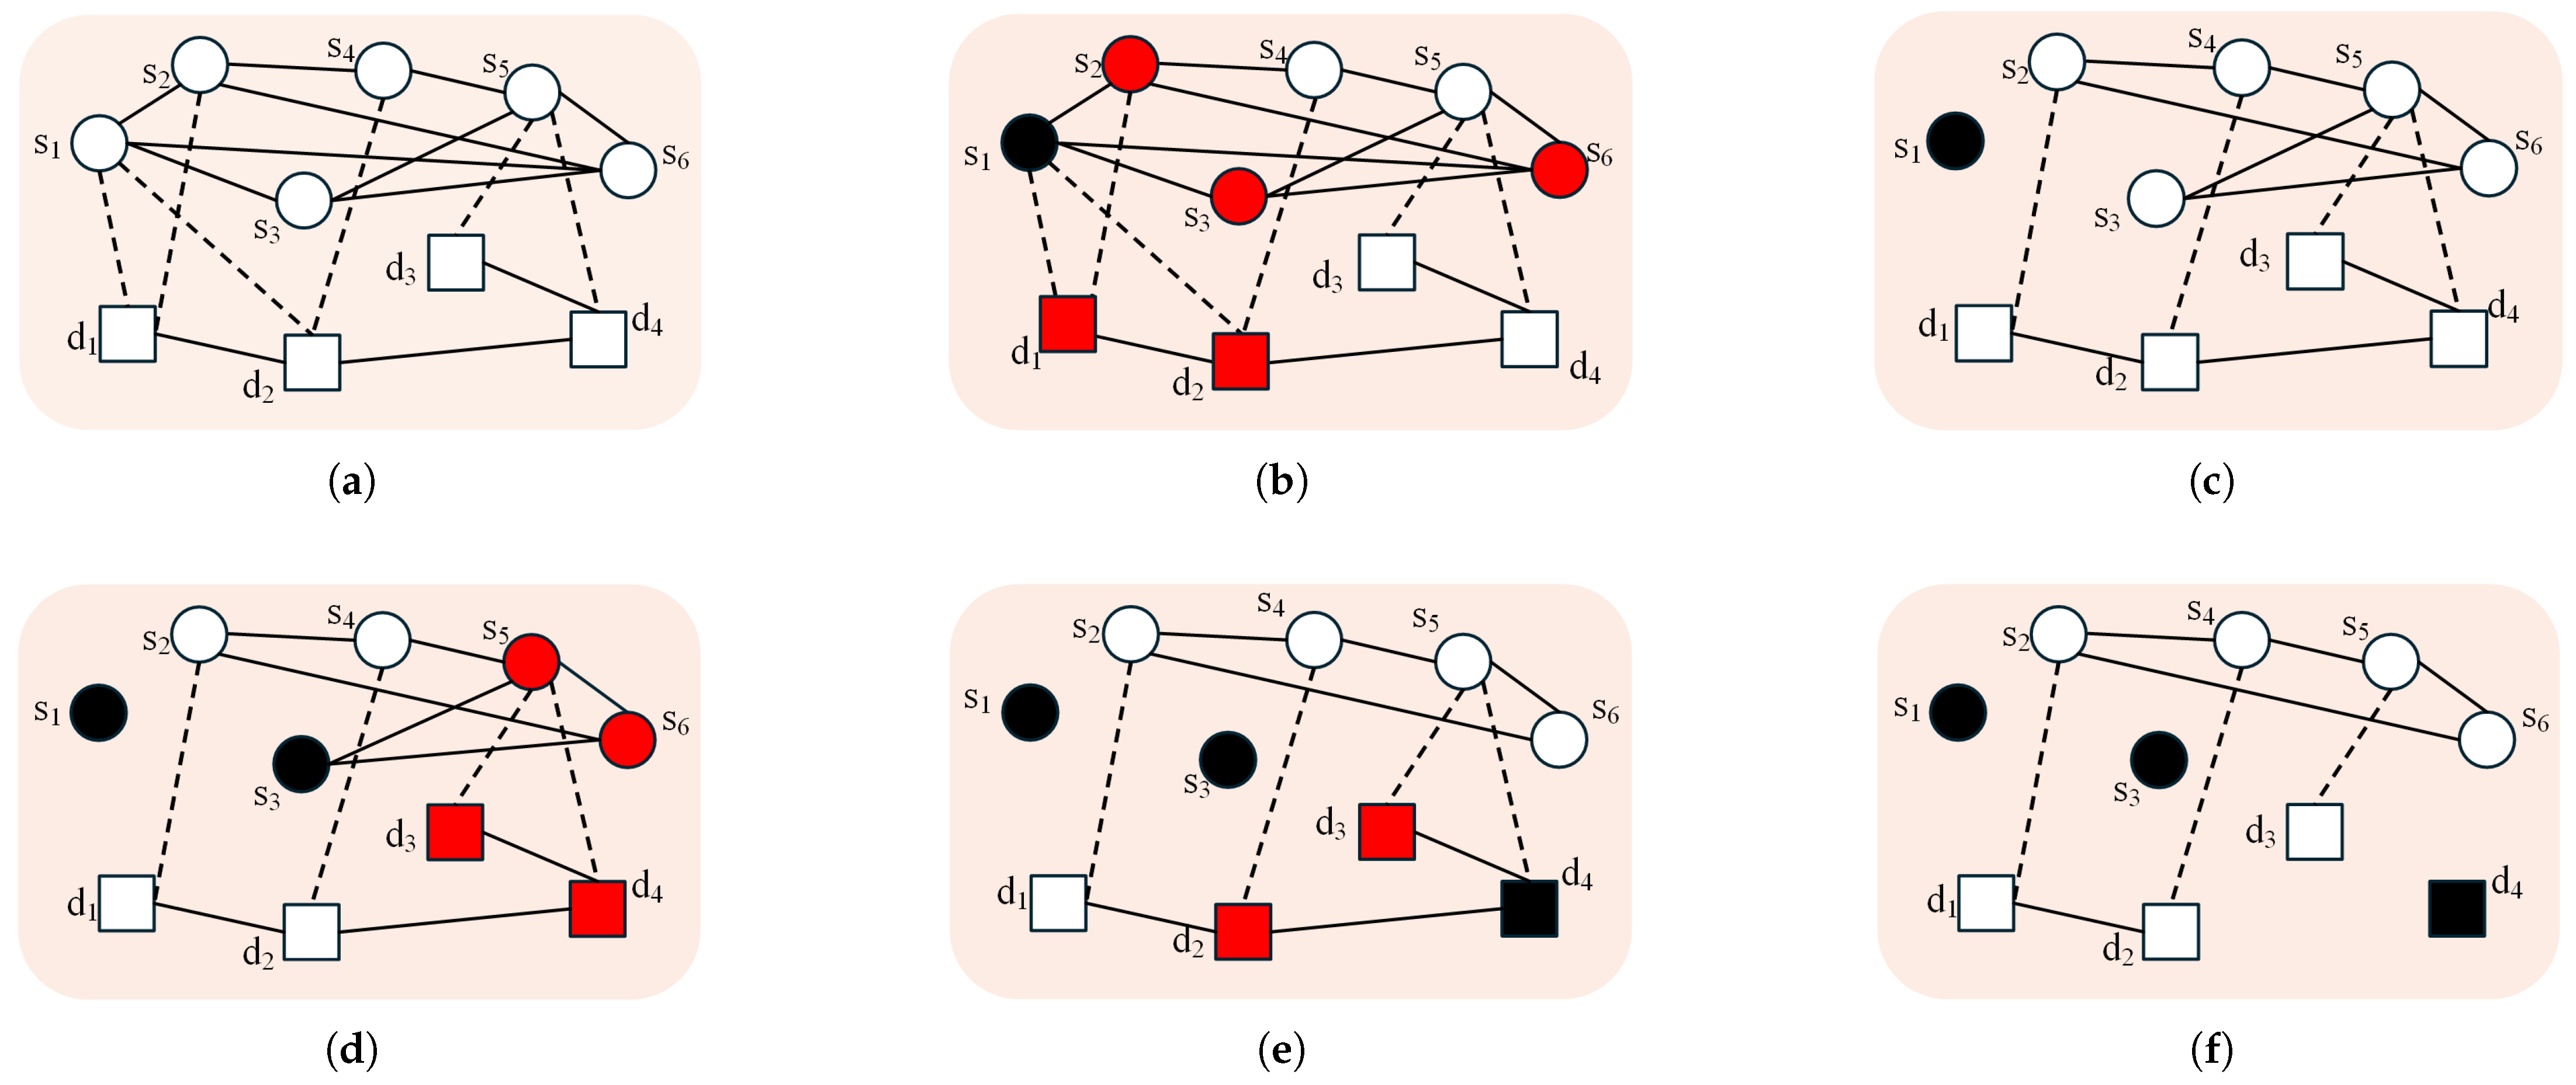
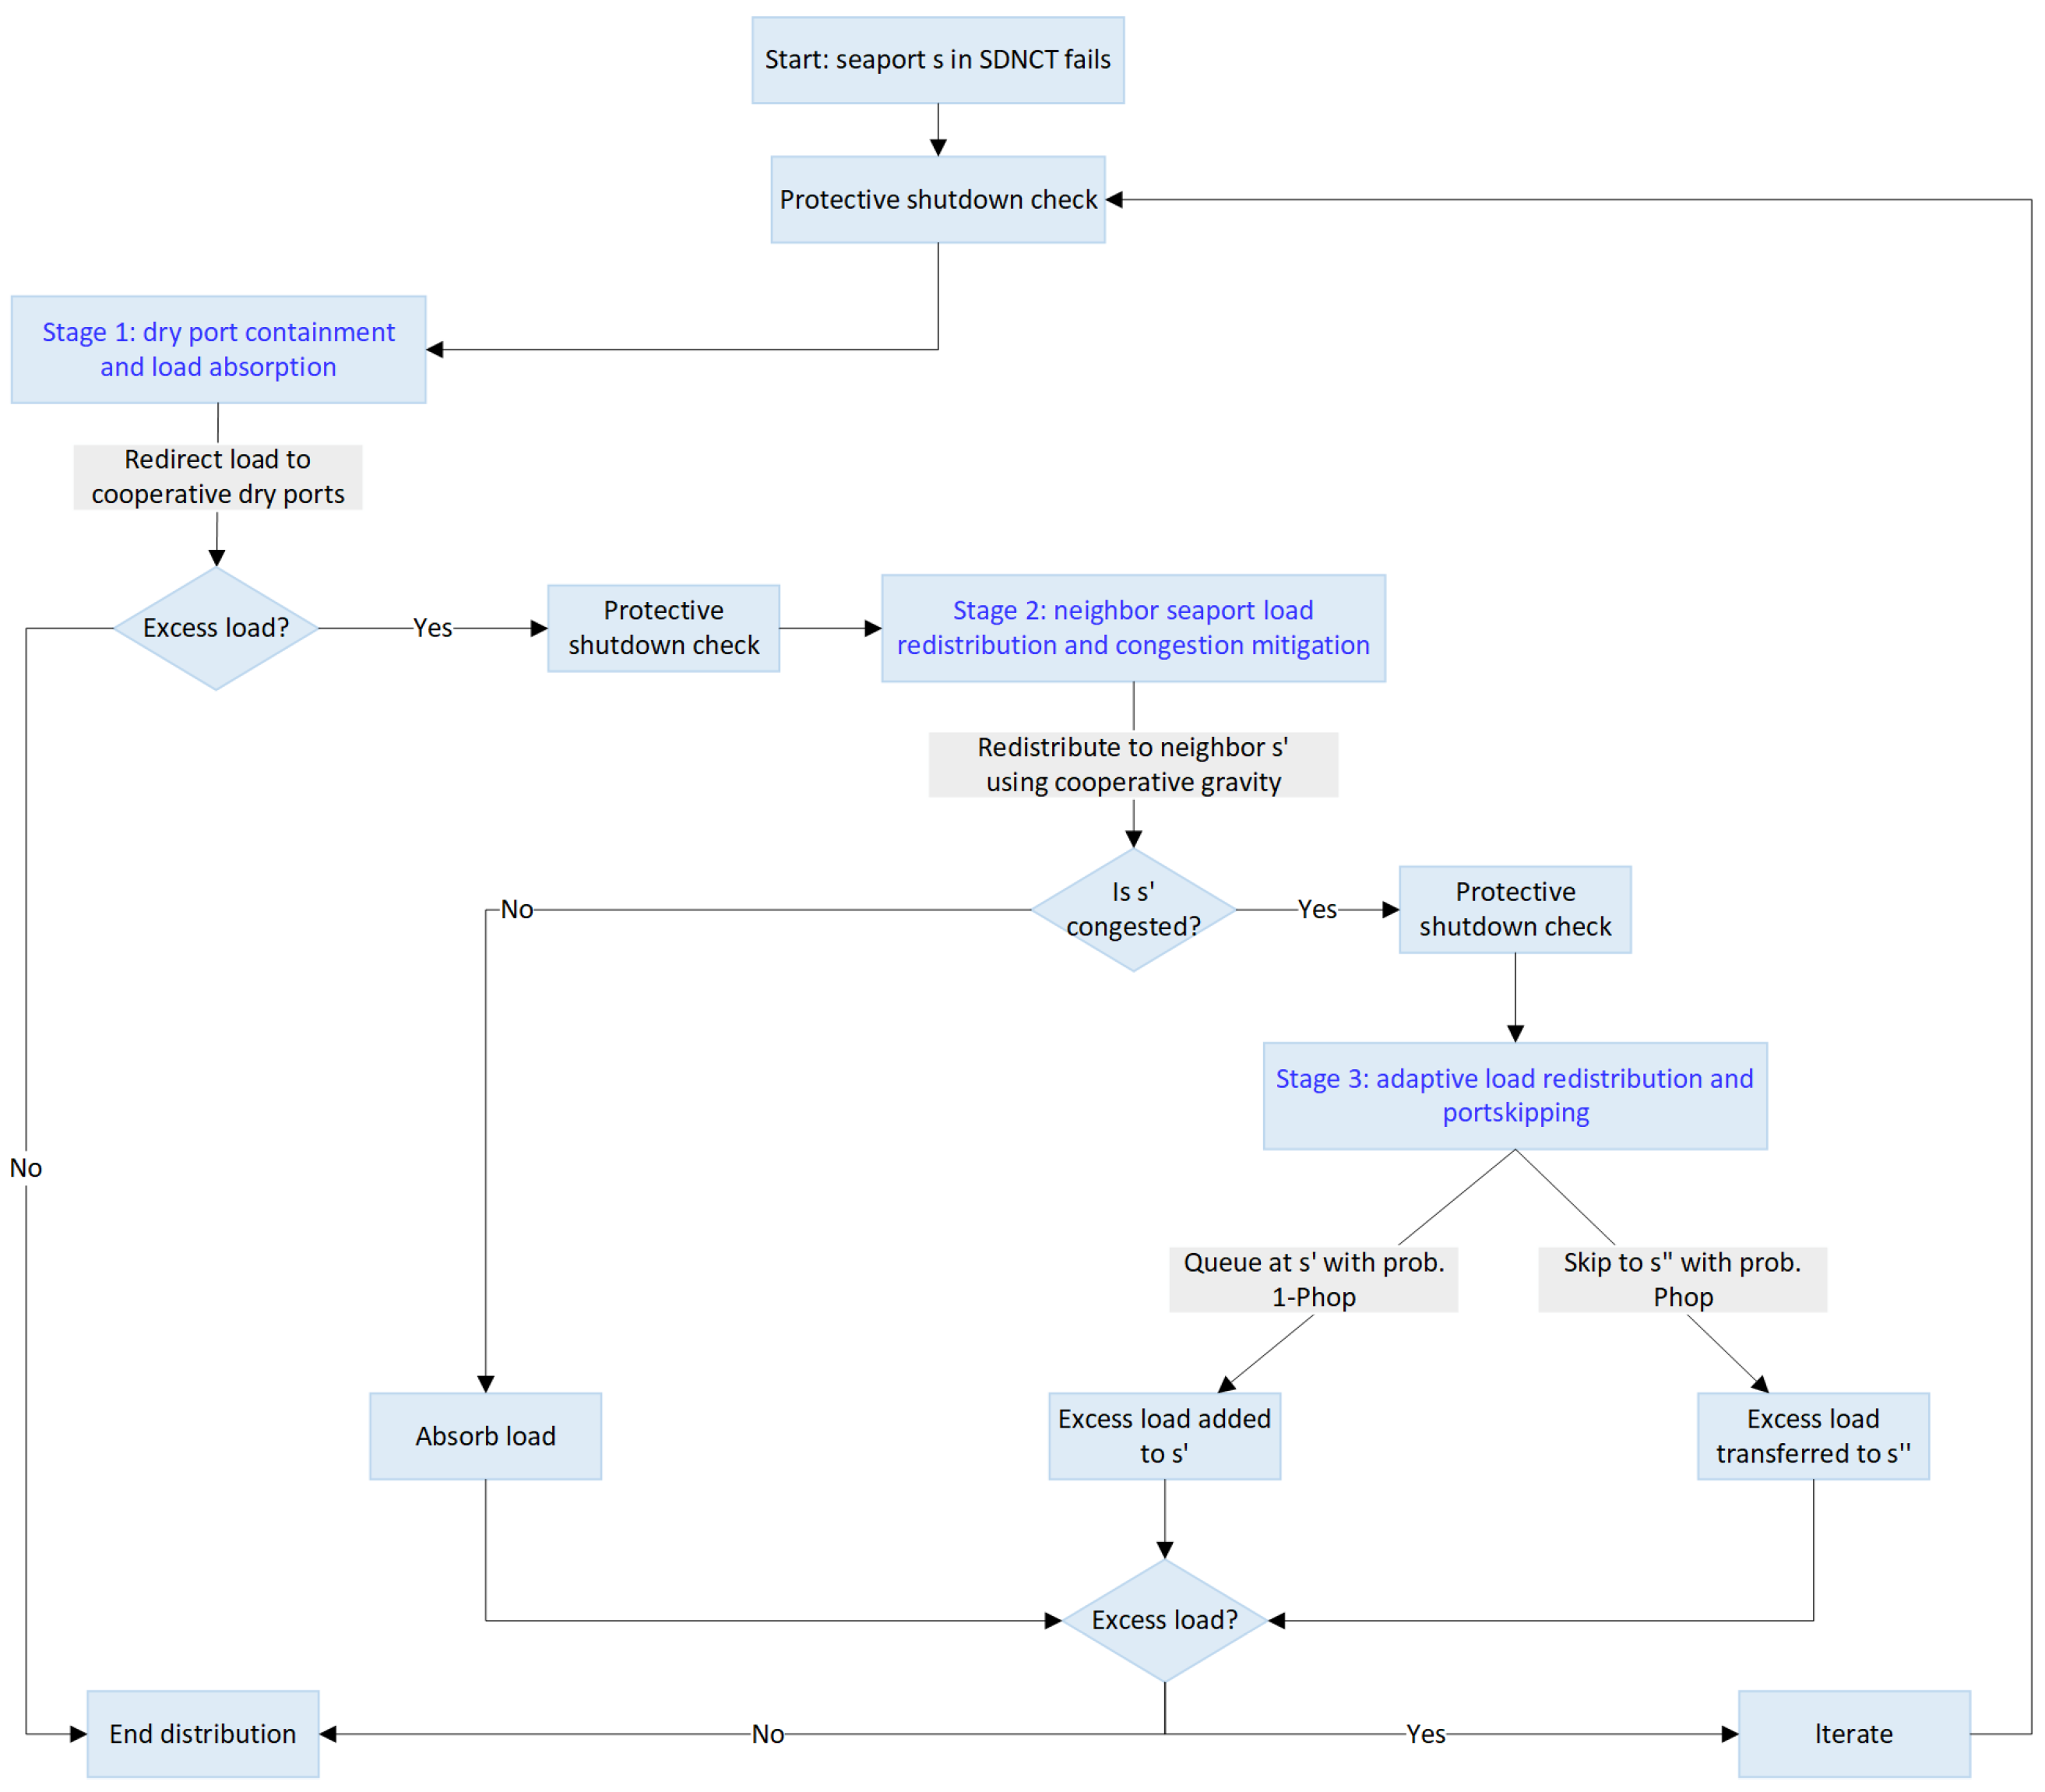
3.2.3. Multi-Stage Load Redistribution Strategy of SDNCT
- (1)
- Factors influencing load redistribution
- (2)
- Multi-stage load redistribution strategy
3.3. Resilience Assessment Metrics for SDNCT
- (1)
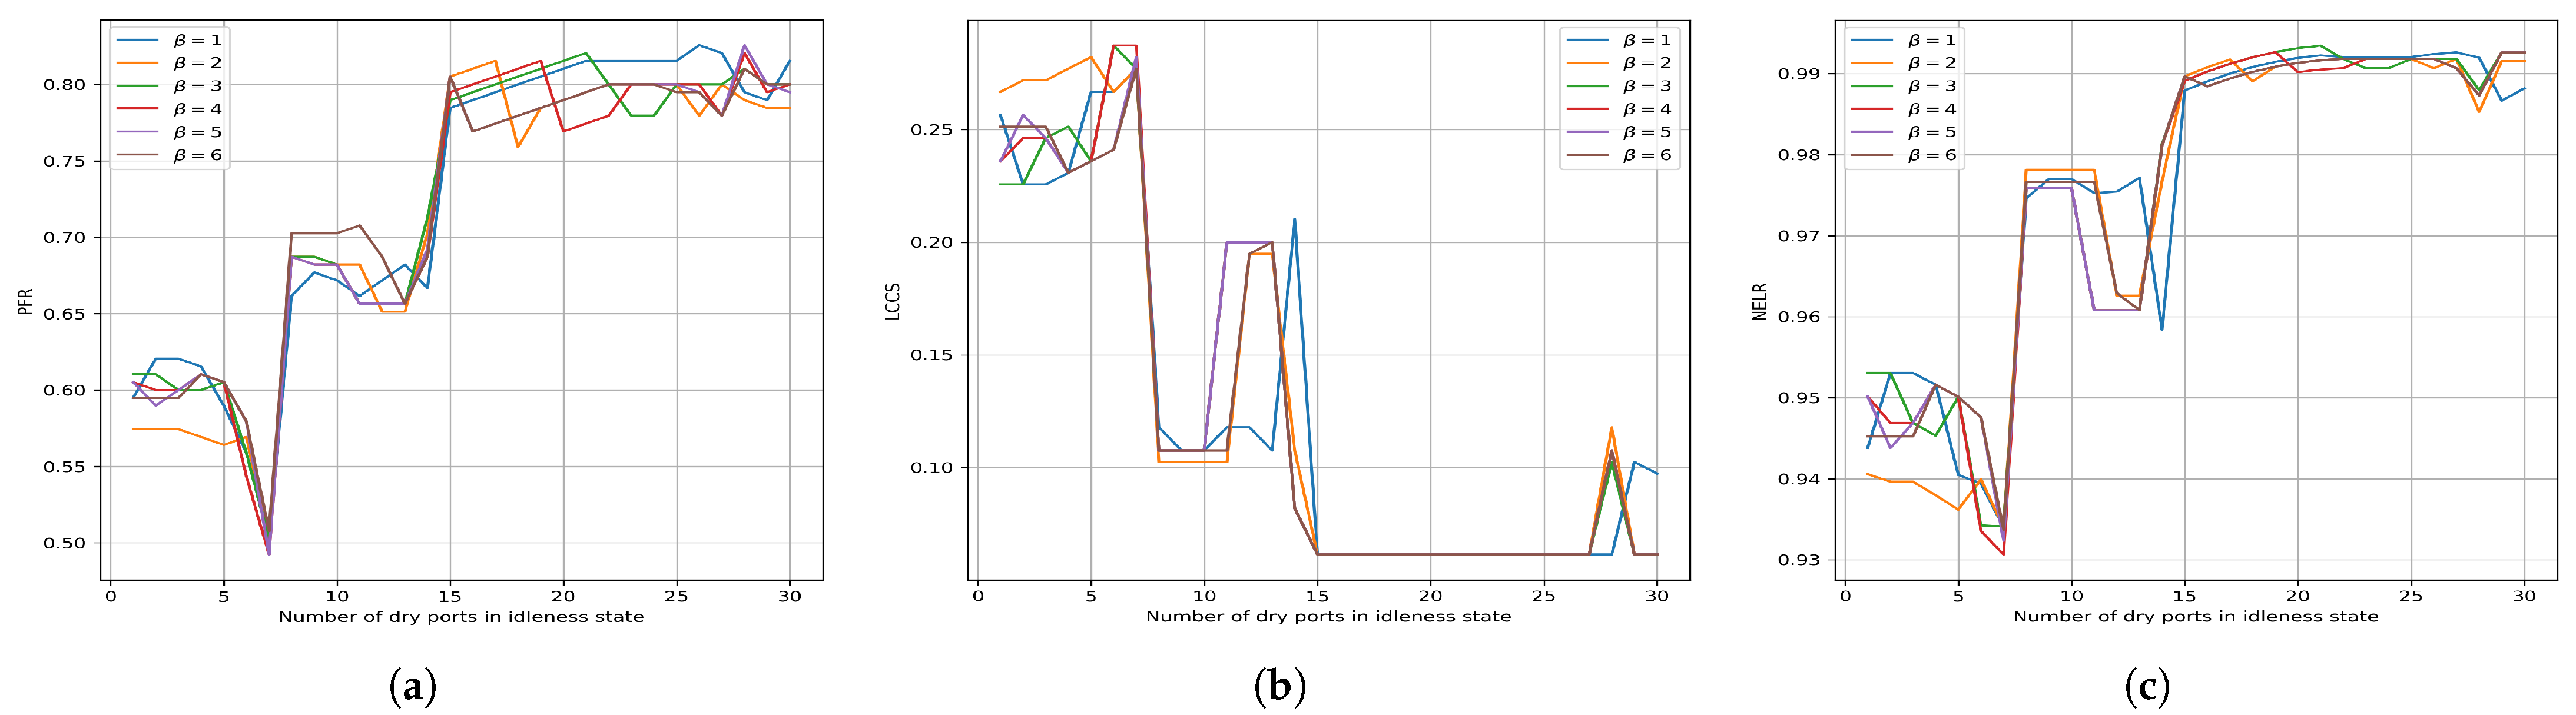
- Port failure ratio (PFR)
- (2)
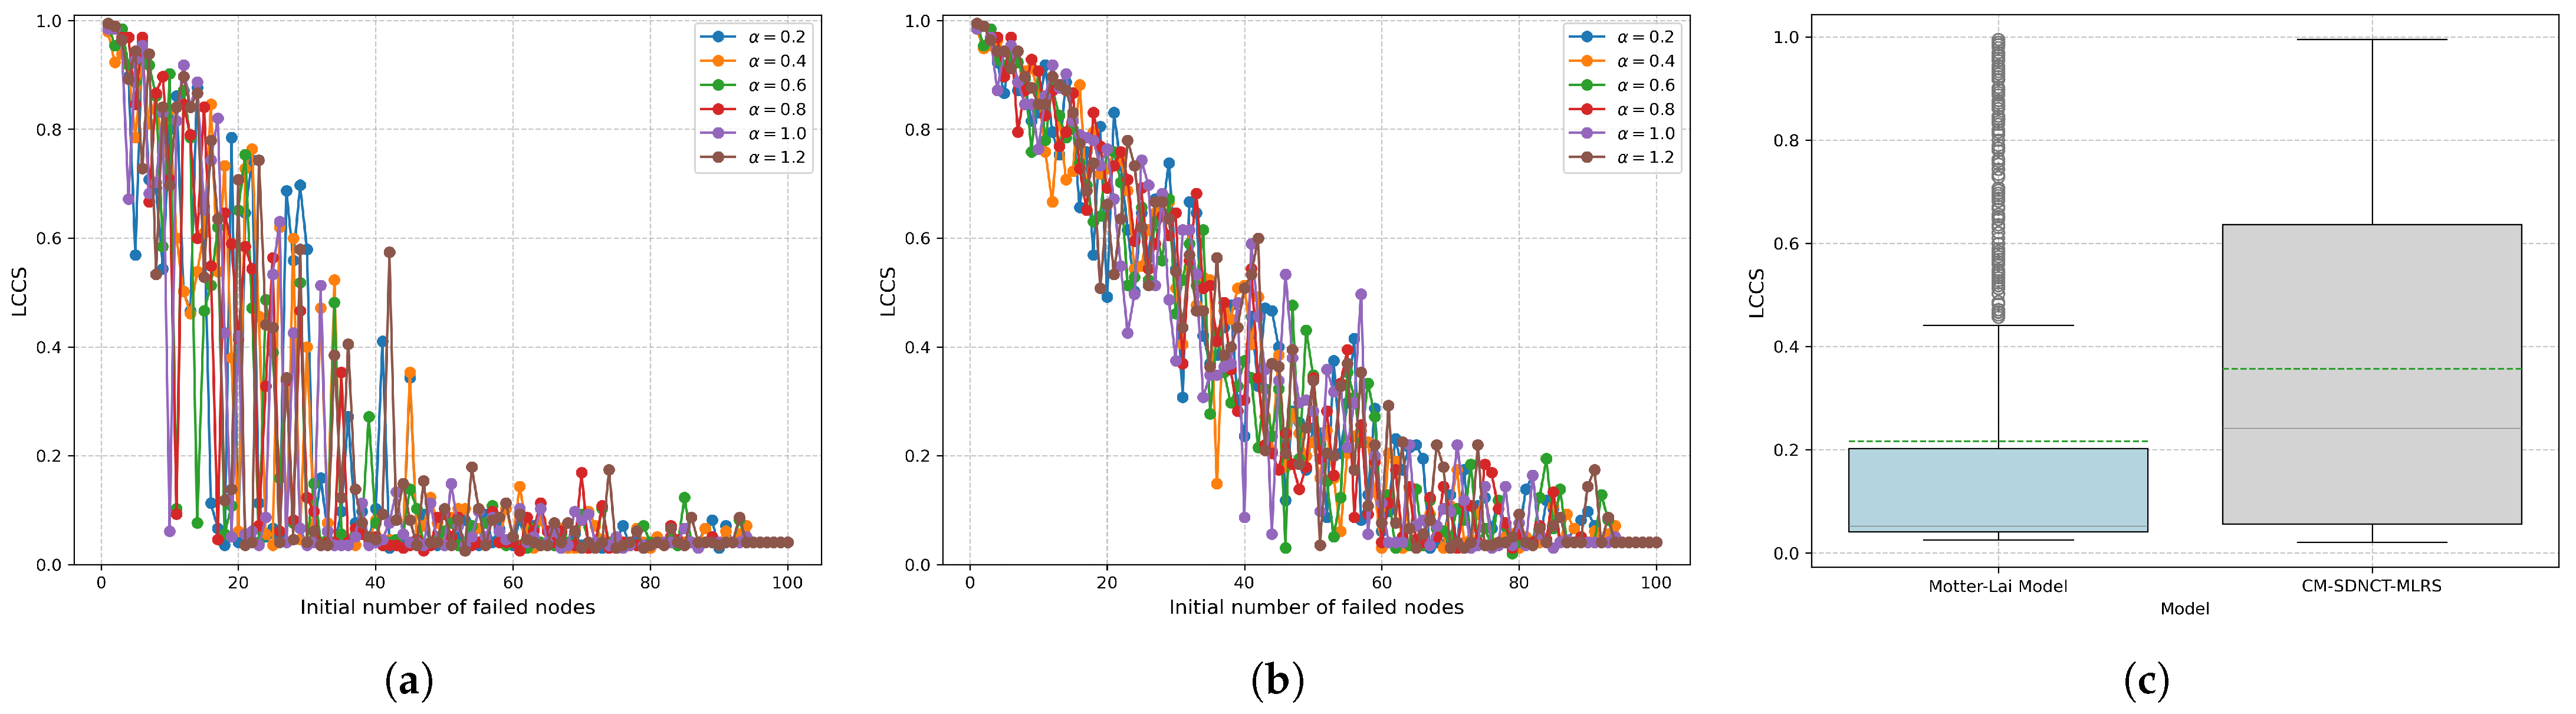
- Largest connected component scale (LCCS)
- (3)
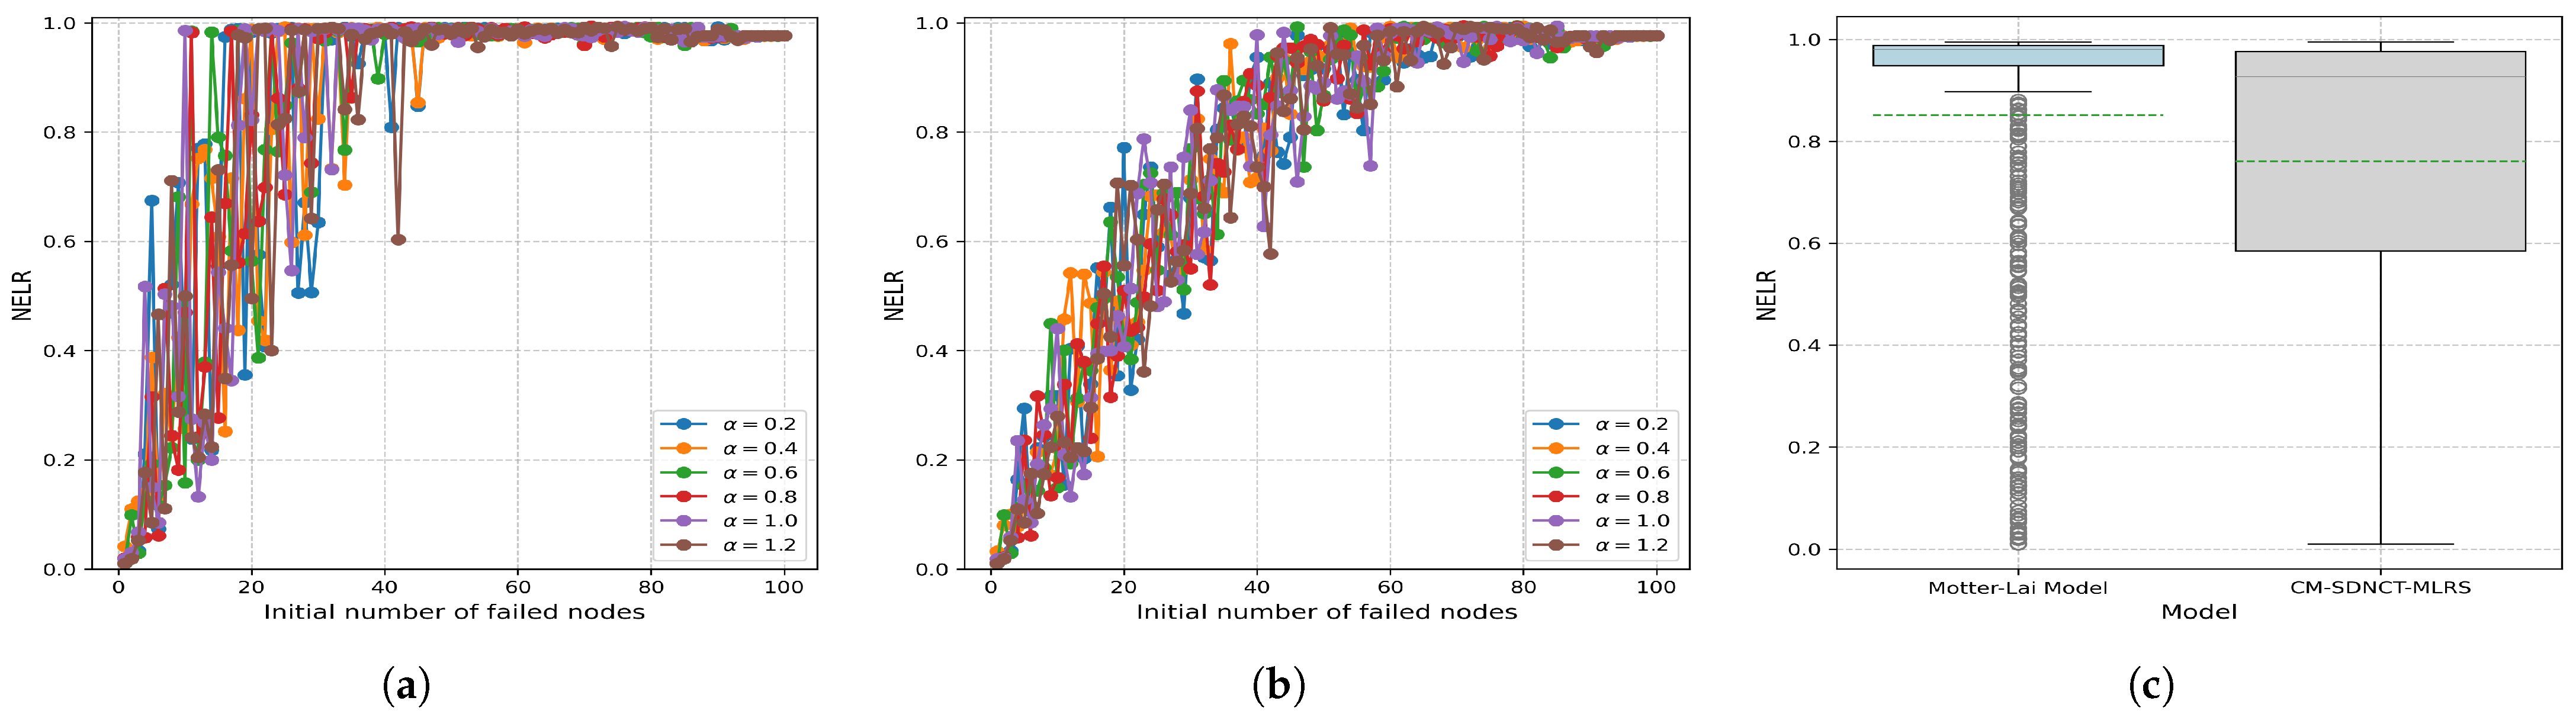
- Network efficiency loss ratio (NELR)
- (4)
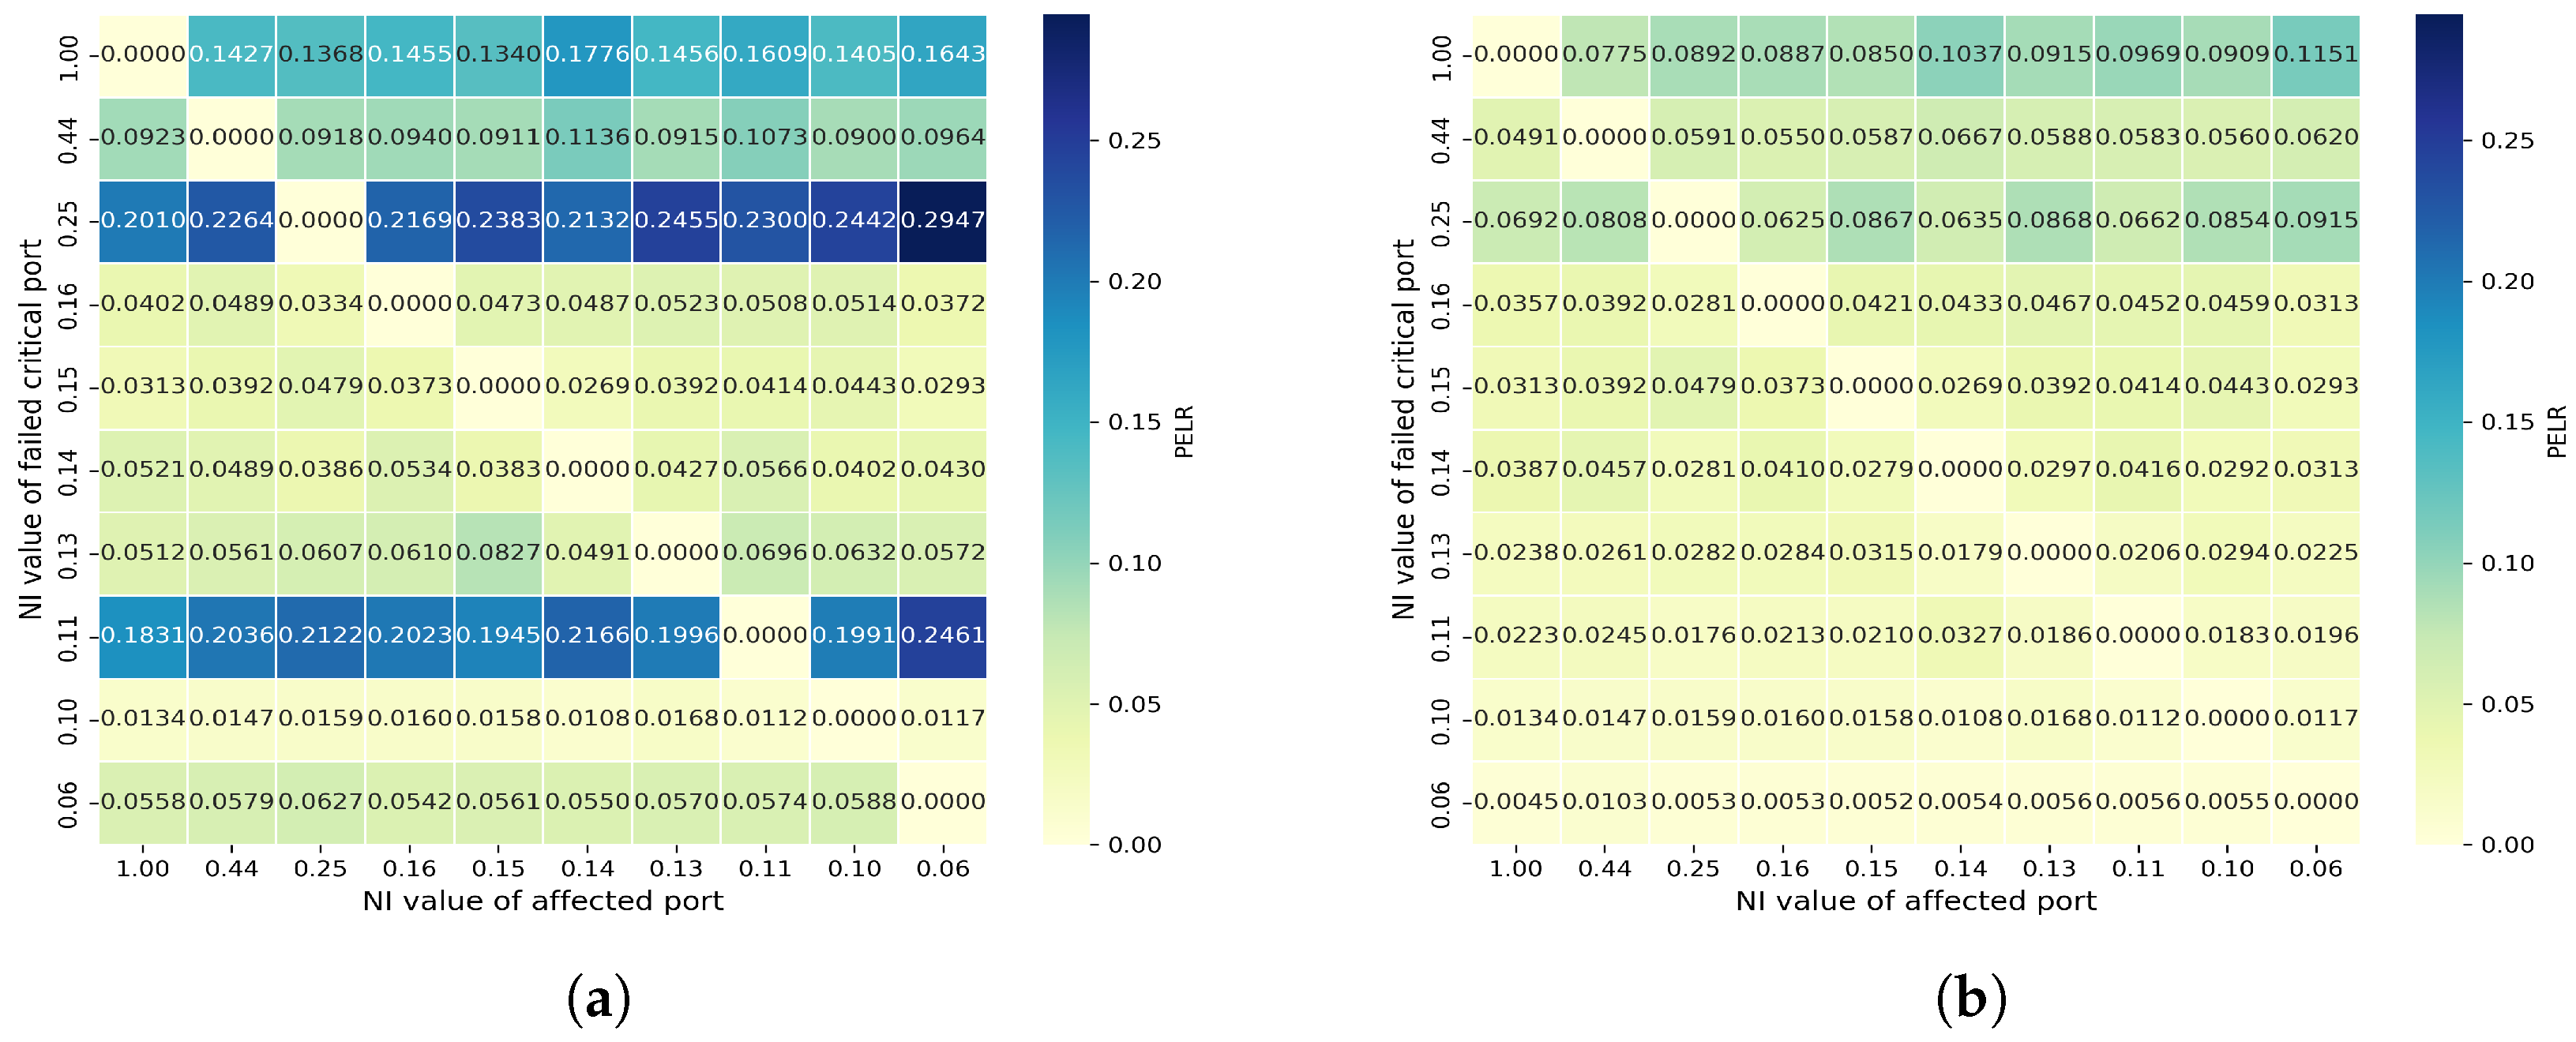
- Port efficiency loss rate (PELR)
4. Results of Resilience Analysis
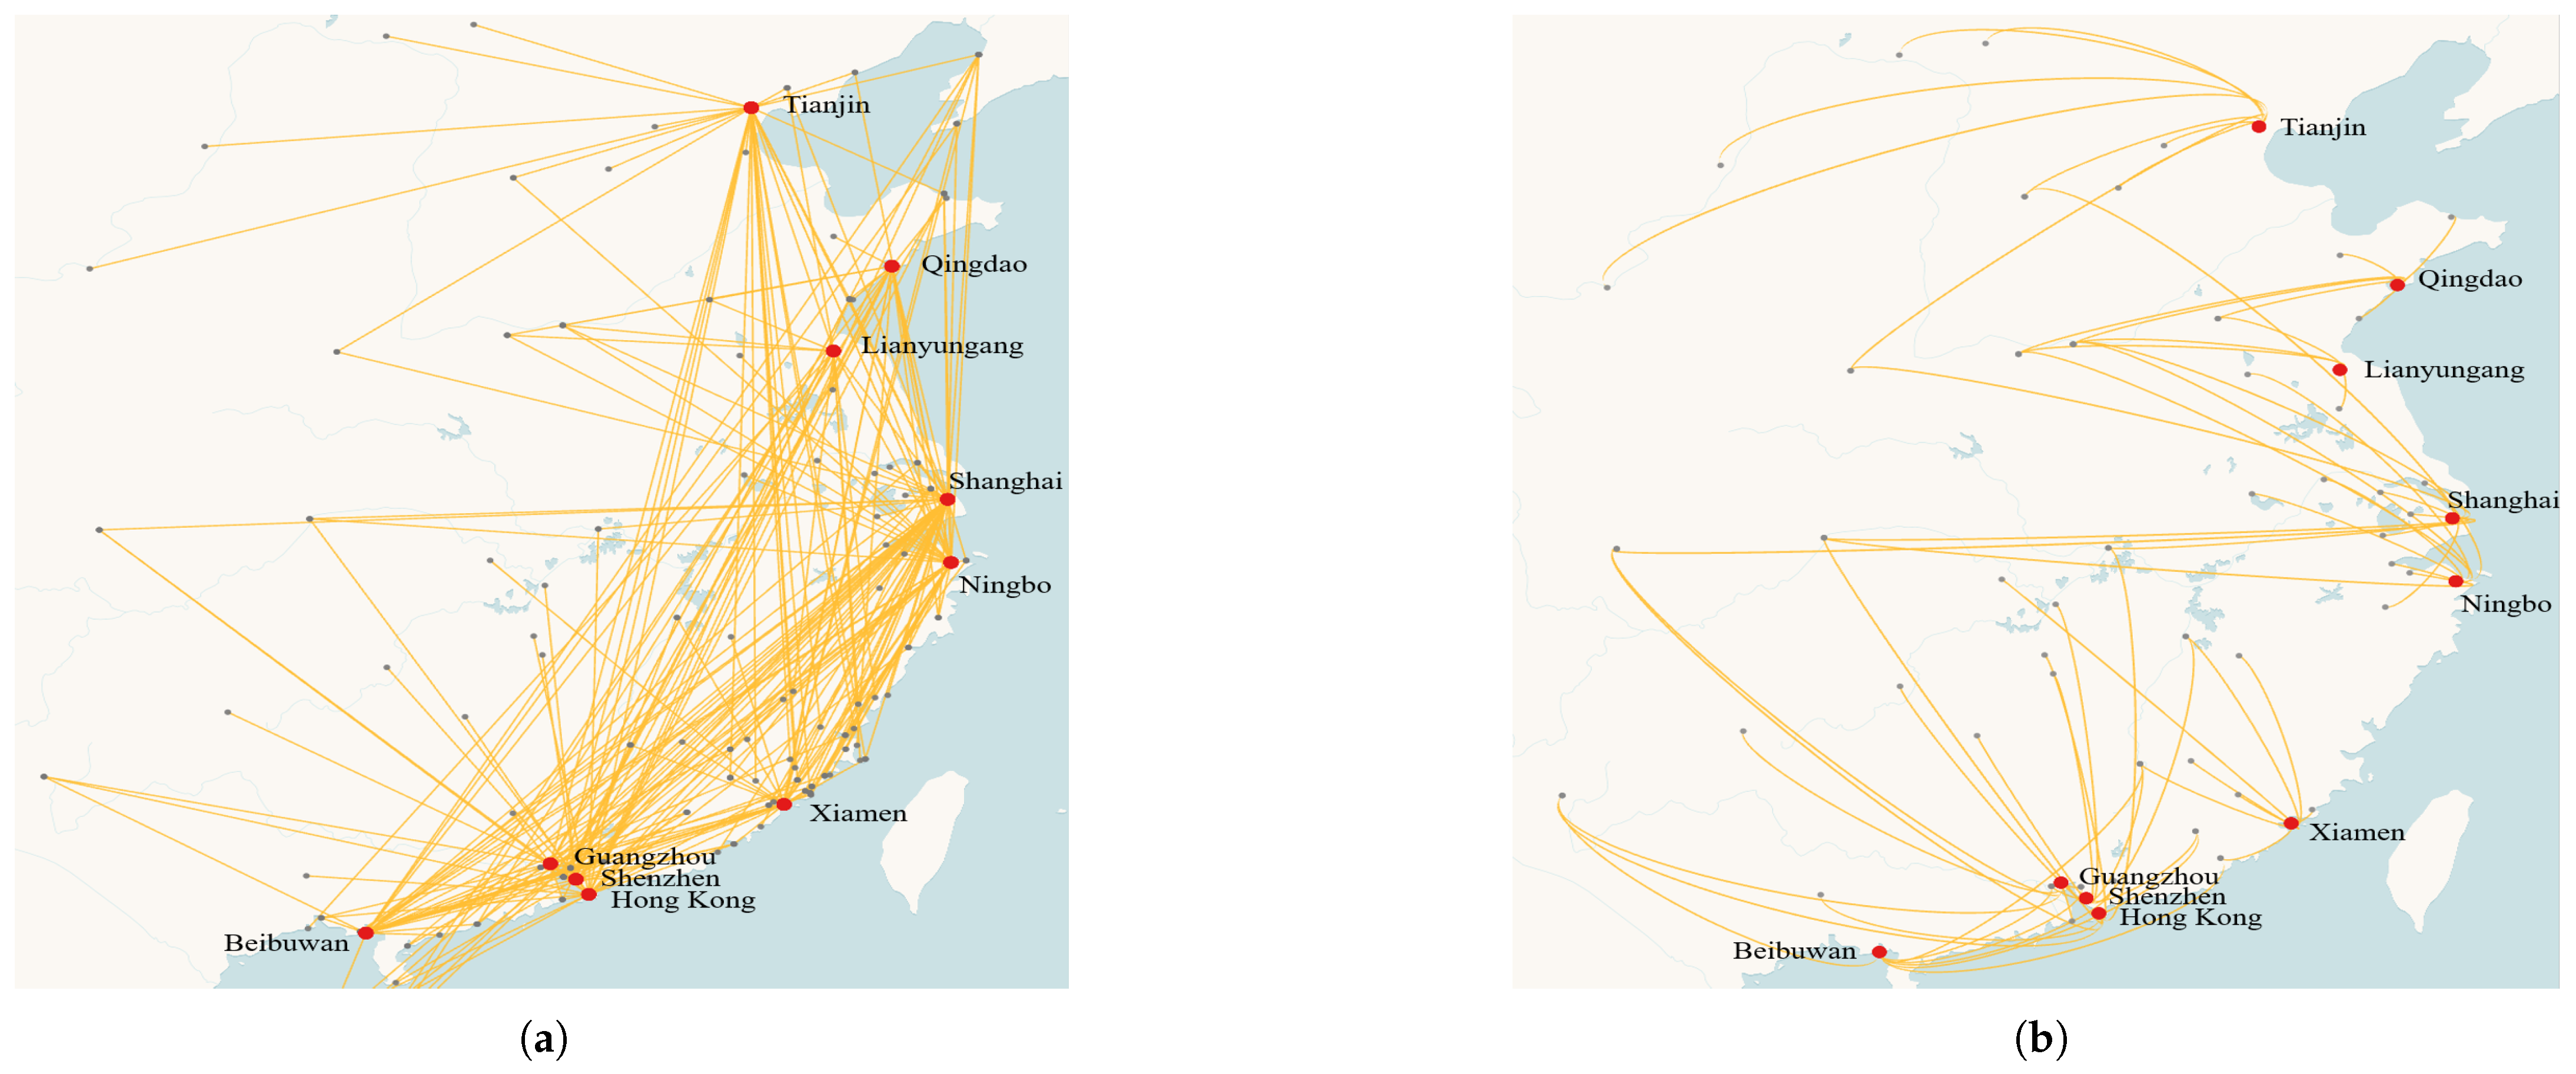
4.1. Data Acquisition and Topological Properties of the SDNCT
4.2. Resilience Analysis
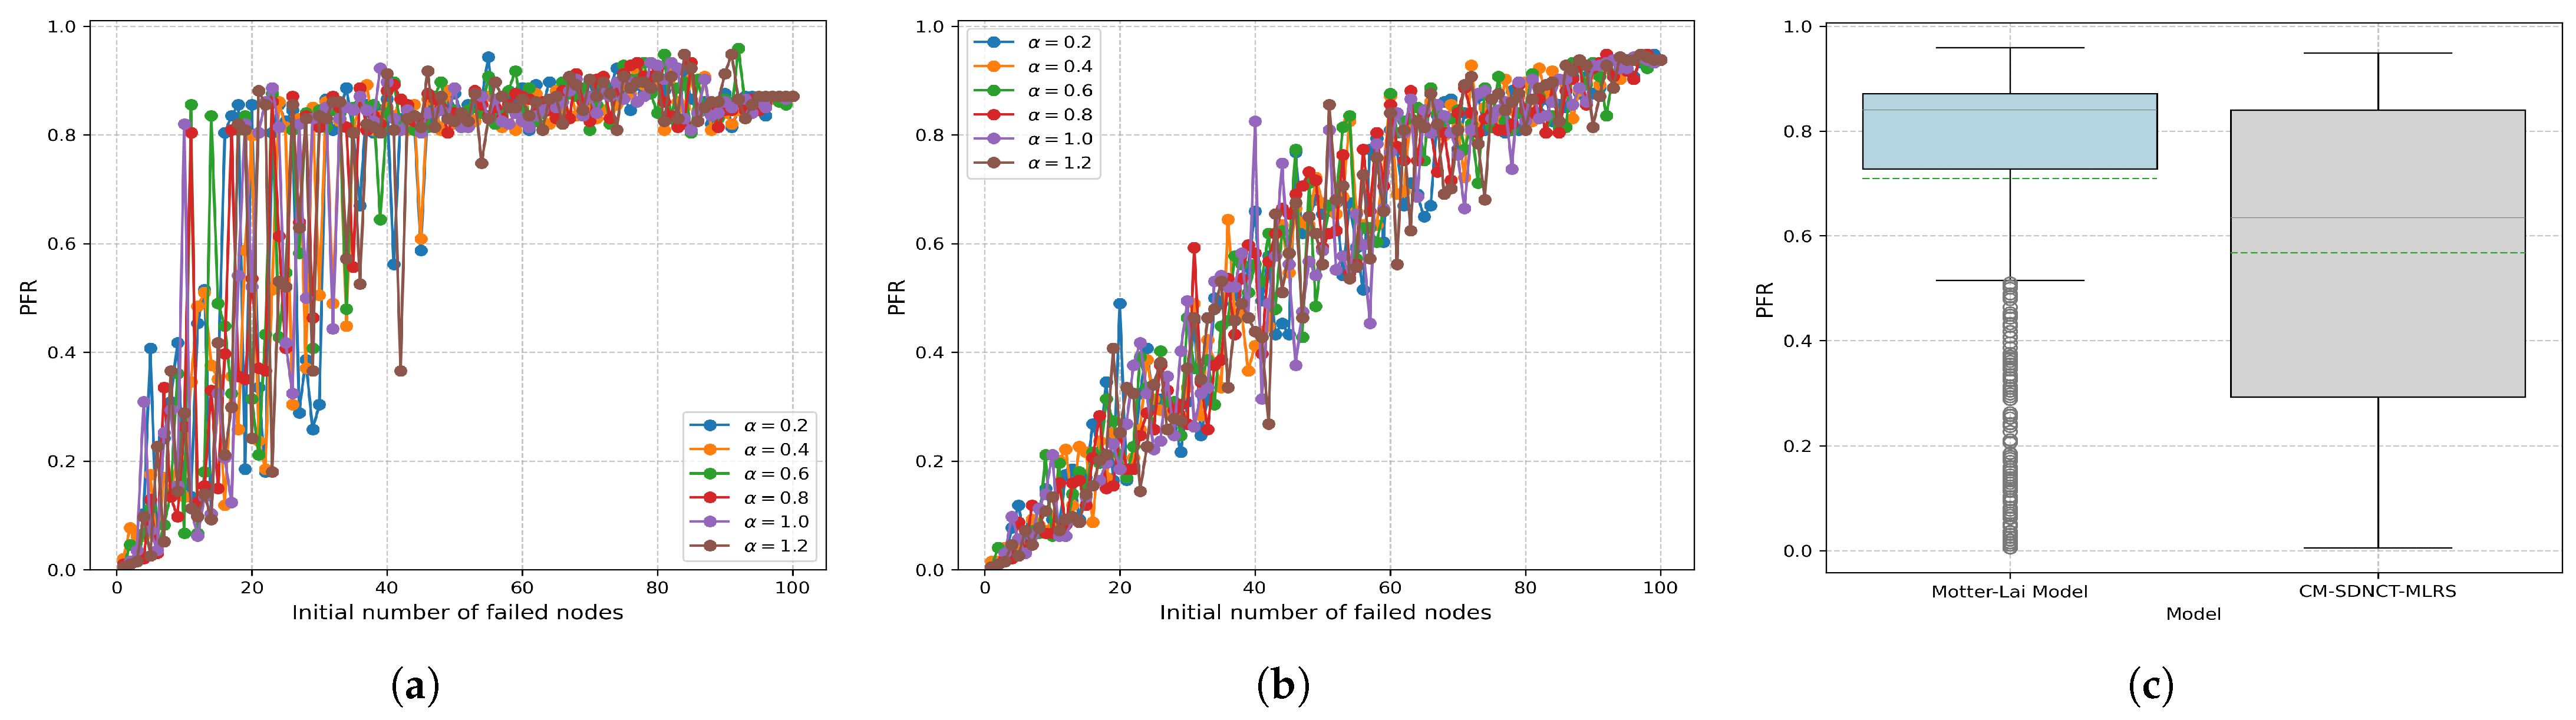
4.2.1. Effects of Random Port Failures
4.2.2. Effects of Critical Seaport Failure
4.2.3. Service Role of Dry Ports on Network Resilience
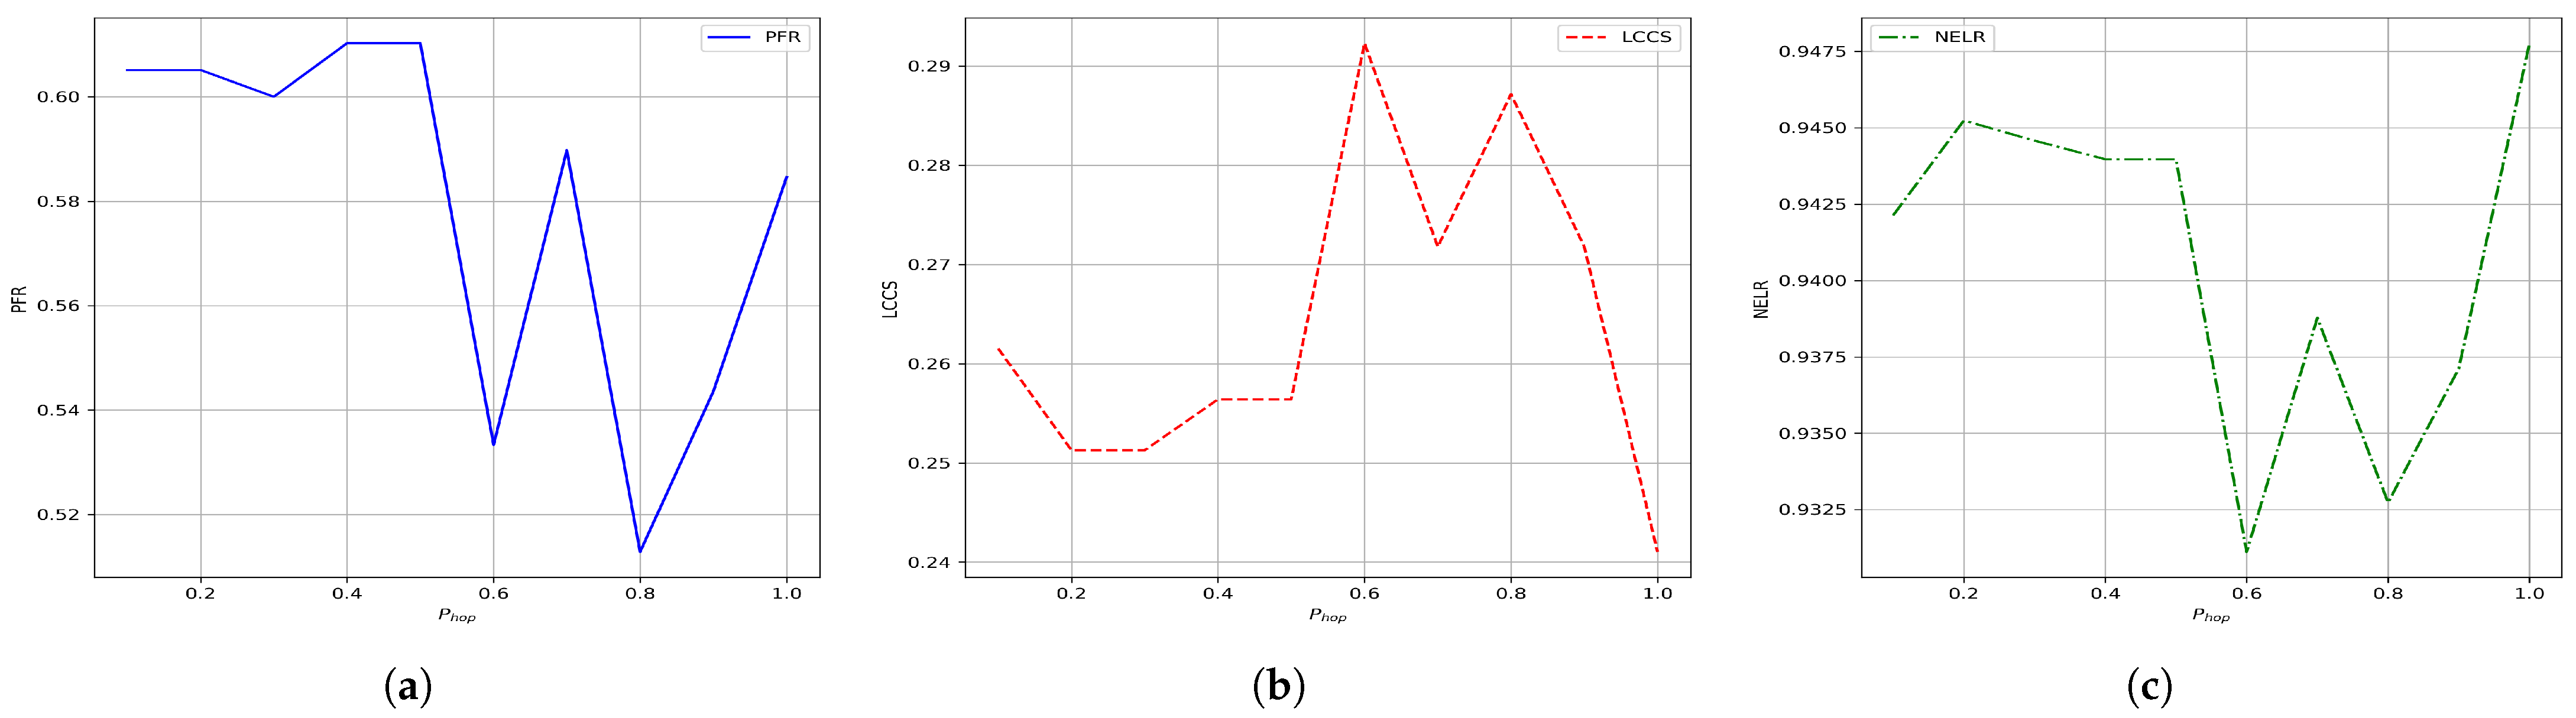
4.2.4. Effects of Port-Hopping Probability
5. Management Insights
6. Conclusions
Author Contributions
Funding
Data Availability Statement
Conflicts of Interest
References
- MOFCOM. Report: The Share of RCEP’s Maritime Trade Volume in the Global Total Is on the Rise. Available online: http://chinawto.mofcom.gov.cn/article/e/s/202309/20230903437437.shtml (accessed on 20 June 2024).
- Notteboom, T.; Pallis, A.; Rodrigue, J.-P. Port Economics Management and Policy; Routledge: London, UK, 2023. [Google Scholar] [CrossRef]
- Tsao, Y.C.; Linh, V.T. Seaport- dry port network design considering multimodal transport and carbon emissions. J. Clean. Prod. 2018, 199, 481–492. [Google Scholar] [CrossRef]
- Tsao, Y.C.; Thanh, V.V. A multi-objective mixed robust possibilistic flexible programming approach for sustainable seaport-dry port network design under an uncertain environment. Transp. Res. Part Logist. Transp. Rev. 2019, 124, 13–39. [Google Scholar] [CrossRef]
- Roso, V.; Woxenius, J.; Lumsden, K. The dry port concept: Connecting container seaports with the hinterland. J. Transp. Geogr. 2009, 17, 338–345. [Google Scholar] [CrossRef]
- Raad, N.G.; Rajendran, S. A hybrid scenario-based fuzzy stochastic model for closed-loop dry port network design with multiple robustness measures. Transp. Res. Part-Logist. Transp. Rev. 2024, 183, 103417. [Google Scholar] [CrossRef]
- Worldwide Logistics Group Port Closure in Ningbo: Impact on Global Supply Chains. Available online: https://worldwidelogisticsltd.com/2024/08/09/port-closure-in-ningbo-impact-on-global-supply-chains/ (accessed on 10 August 2024).
- Li, Z.; Li, H.; Zhang, Q.; Qi, X. Data-driven research on the impact of COVID-19 on the global container shipping network. Ocean. Coast. Manag. 2024, 248, 106969. [Google Scholar] [CrossRef]
- Wu, D.; Yu, C.; Zhao, Y.; Guo, J. Changes in vulnerability of global container shipping networks before and after the COVID-19 pandemic. J. Transp. Geogr. 2024, 114, 103783. [Google Scholar] [CrossRef]
- Liu, J.; Wang, X.; Chen, J. Port congestion under the COVID-19 pandemic: The simulation-based countermeasures. Comput. Ind. Eng. 2023, 183, 109474. [Google Scholar] [CrossRef]
- Erol, S. The early impact of the Russia-Ukraine war on seaborne trade and transportation in the Black Sea. Int. J. Shipp. Transp. Logist. 2024, 18, 305–323. [Google Scholar] [CrossRef]
- Karakas, S.; Kirmizi, M.; Gencer, H.; Cullinane, K. A resilience assessment model for dry bulk shipping supply chains: The case of the Ukraine grain corridor. Marit. Econ. Logist. 2023, 26, 391–413. [Google Scholar] [CrossRef]
- Yu, B.; Hao, M.; Jiang, Y.; Jin, L. A hierarchic framework for the propagating impacts of the China-US trade war on volume of chinese containerized exports. J. Ind. Manag. Optim. 2022, 18, 219–238. [Google Scholar] [CrossRef]
- UNCTAD. Review of Maritime Transport 2023. Available online: https://unctad.org/publication/review-maritime-transport-2023 (accessed on 20 June 2024).
- Liu, H.; Han, Y.; Zhu, A. Modeling supply chain viability and adaptation against underload cascading failure during the COVID-19 pandemic. Nonlinear Dyn. 2022, 110, 2931–2947. [Google Scholar] [CrossRef]
- Sun, J.; Tang, J.; Fu, W.; Chen, Z.; Niu, Y. Construction of a multi-echelon supply chain complex network evolution model and robustness analysis of cascading failure. Comput. Ind. Eng. 2020, 144, 106457. [Google Scholar] [CrossRef]
- Xu, X.; Zhu, Y.; Xu, M.; Deng, W.; Zuo, Y. Vulnerability analysis of the global liner shipping network: From static structure to cascading failure dynamics. Ocean. Coast. Manag. 2022, 229, 106325. [Google Scholar] [CrossRef]
- Xu, Y.; Peng, P.; Claramunt, C.; Lu, F.; Yan, R. Cascading failure modelling in global container shipping network using mass vessel trajectory data. Reliab. Eng. Syst. Saf. 2024, 249, 110231. [Google Scholar] [CrossRef]
- The Maritime Executive Port Congestion Cost Shippers Millions in Added Interest Expenses. Available online: https://maritime-executive.com/article/port-congestion-cost-shippers-millions-in-added-interest-expenses (accessed on 1 July 2023).
- Motter, A.; Lai, Y. Cascade-based attacks on complex networks. Phys. Rev. E 2002, 66, 065102. [Google Scholar] [CrossRef] [PubMed]
- Liupeng, J.; Guangsheng, W.; Xuejun, F.; Tong, Y.; Zhiyi, L. Study on cascading failure vulnerability of the 21st-century Maritime Silk Road container shipping network. J. Transp. Geogr. 2024, 117, 103891. [Google Scholar] [CrossRef]
- Cao, Y.; Xin, X.; Jarumaneeroj, P.; Li, H.; Feng, Y.; Wang, J.; Wang, X.; Pyne, R.; Yang, Z. Data-driven resilience analysis of the global container shipping network against two cascading failures. Transp. Res. Part Logist. Transp. Rev. 2025, 193, 103857. [Google Scholar] [CrossRef]
- Gong, Z.; Liu, N. Mitigative and adaptive investments for natural disasters and labor strikes in a seaport-dry port inland logistics network. Marit. Policy Manag. 2020, 47, 92–108. [Google Scholar] [CrossRef]
- Chen, H.; Cullinane, K.; Liu, N. Developing a model for measuring the resilience of a port-hinterland container transportation network. Transp. Res. Part-Logist. Transp. Rev. 2017, 97, 282–301. [Google Scholar] [CrossRef]
- Wu, X.; Wang, K.; Fu, X.; Jiang, C.; Zheng, S. How would co-opetition with dry ports affect seaports’ adaptation to disasters? Transp. Res. Part-Transp. Environ. 2024, 130, 104194. [Google Scholar] [CrossRef]
- Becker, A.H.; Acciaro, M.; Asariotis, R.; Cabrera, E.; Cretegny, L.; Crist, P.; Esteban, M.; Mather, A.; Messner, S.; Naruse, S.; et al. A note on climate change adaptation for seaports: A challenge for global ports, a challenge for global society. Clim. Change 2013, 120, 683–695. [Google Scholar] [CrossRef]
- Jarzemskis, A.; Vasiliauskas, A.V. Research on dry port concept as intermodal node. Transport 2007, 22, 207–213. [Google Scholar] [CrossRef]
- Talley, W.K.; Ng, M. Hinterland transport chains: Determinant effects on chain choice. Int. J. Prod. Econ. 2017, 185, 175–179. [Google Scholar] [CrossRef]
- Wang, B.; Chin, K.S.; Su, Q. Risk management and market structures in seaport-dry port systems. Marit. Econ. Logist. 2022, 24, 114–137. [Google Scholar] [CrossRef]
- Khaslavskaya, A.; Roso, V. Dry ports: Research outcomes, trends, and future implications. Marit. Econ. Logist. 2020, 22, 265–292. [Google Scholar] [CrossRef]
- Dalivand, A.A.; Torabi, S.A. Sustainable-resilient seaport-dry port network design considering inter-modal transportation. J. Clean. Prod. 2024, 452, 141944. [Google Scholar] [CrossRef]
- Nguyen, C.; Notteboom, T. Dry ports as extensions of maritime deep-sea ports: A case study of Vietnam. J. Int. Logist. Trade 2016, 14, 65–88. [Google Scholar] [CrossRef]
- Panahi, R.; Gargari, N.S.; Lau, Y.y.; Ng, A.K.Y. Developing a resilience assessment model for critical infrastructures: The case of port in tackling the impacts posed by the COVID-19 pandemic. Ocean. Coast. Manag. 2022, 226, 106240. [Google Scholar] [CrossRef]
- Xie, J.; Sun, Y.; Huo, X. Dry Port-Seaport Logistics Network Construction under the Belt and Road Initiative: A Case of Shandong Province in China. J. Syst. Sci. Syst. Eng. 2021, 30, 178–197. [Google Scholar] [CrossRef]
- Lin, W.; Liu, W. Resilience evaluation of ports along the Maritime Silk Road from the perspective of investment and construction. J. Adv. Transp. 2023, 2023, 8818667. [Google Scholar] [CrossRef]
- Wenli, F.; Zhigang, L.; Ping, H.; Shengwei, M. Cascading failure model in power grids using the complex network theory. IET Gener. Transm. Distrib. 2016, 10, 3940–3949. [Google Scholar] [CrossRef]
- Ghasemi, A.; de Meer, H. Robustness of Interdependent Power Grid and Communication Networks to Cascading Failures. IEEE Trans. Netw. Sci. Eng. 2023, 10, 1919–1930. [Google Scholar] [CrossRef]
- Guo, X.; Du, Q.; Li, Y.; Zhou, Y.; Wang, Y.; Huang, Y.; Martinez-Pastor, B. Cascading failure and recovery of metro-bus double-layer network considering recovery propagation. Transp. Res. Part-Transp. Environ. 2023, 122, 103861. [Google Scholar] [CrossRef]
- Jin, K.; Wang, W.; Li, X.; Hua, X.; Qin, S. Exploring the robustness of public transportation system on augmented network: A case from Nanjing China. Phys.-Stat. Mech. Its Appl. 2022, 608, 128252. [Google Scholar] [CrossRef]
- Chen, W.; Chen, J.; Geng, J.; Ye, J.; Yan, T.; Shi, J.; Xu, J. Monitoring and evaluation of ship operation congestion status at container ports based on AIS data. Ocean. Coast. Manag. 2023, 245, 106836. [Google Scholar] [CrossRef]
- Komazec, N.; Soskic, S.; Milic, A.; Strbac, K.; Valjarevic, A. Water transportation planning in connection with extreme weather conditions; case study—Port of Novi Sad, Serbia. Open Geosci. 2024, 16, 20220559. [Google Scholar] [CrossRef]
- Li, S.; Tang, L.; Liu, J.; Zhao, T.; Xiong, X. Vessel schedule recovery strategy in liner shipping considering expected disruption. Ocean. Coast. Manag. 2023, 237, 106514. [Google Scholar] [CrossRef]
- Lhomme, S. Vulnerability and resilience of ports and maritime networks to cascading failures and targeted attacks. In Maritime Networks. Spatial Structures and Time Dynamic; Routledge: London, UK, 2015; pp. 253–265. [Google Scholar]
- Dirzka, C.; Acciaro, M. Global shipping network dynamics during the COVID-19 pandemic’s initial phases. J. Transp. Geogr. 2022, 99, 103265. [Google Scholar] [CrossRef]
- Qu, C.; Zhou, J.; Sun, H.; Li, Y.; Xie, W. Vulnerability Evolution of a Container Shipping Network in an Uncertain Environment: The Case of China–United States Connections. J. Mar. Sci. Eng. 2024, 12, 1780. [Google Scholar] [CrossRef]
- Lu, B.; Sun, Y.; Wang, H.; Wang, J.J.; Liu, S.S.; Cheng, T. Dynamic resilience analysis of the liner shipping network: From structure to cooperative mechanism. Transp. Res. Part Logist. Transp. Rev. 2024, 191, 103755. [Google Scholar] [CrossRef]
- Lu, Z.G.; Chen, Q. Discovering potential partners via projection-based link prediction in the supply chain network. Int. J. Comput. Intell. Syst. 2020, 13, 1253–1264. [Google Scholar] [CrossRef]
- Rousset, L.; Ducruet, C. Disruptions in spatial networks: A comparative study of major shocks affecting ports and shipping patterns. Netw. Spat. Econ. 2020, 20, 423–447. [Google Scholar] [CrossRef]
- Lai, Y.C.; Motter, A.E.; Nishikawa, T. Attacks and cascades in complex networks. Lect. Notes Phys. 2004, 650, 299–310. [Google Scholar] [CrossRef]
- Ma, Z.; Liu, J.; Chien, S.I.J.; Hu, X.; Shao, Y. Identifying Critical Stations Affecting Vulnerability of a Metro Network Considering Passenger Flow and Cascading Failure: Case of Xi’an Metro in China. Asce-Asme J. Risk Uncertain. Eng. Syst. Part Civ. Eng. 2023, 9, 04023014. [Google Scholar] [CrossRef]
- Guo, J.; Yang, Z.; Zhong, Q.; Sun, X.; Wang, Y. A novel resilience analysis methodology for airport networks system from the perspective of different epidemic prevention and control policy responses. PLoS ONE 2023, 18, e0281950. [Google Scholar] [CrossRef]
- Yang, Q.; Scoglio, C.M.; Gruenbacher, D.M. Robustness of supply chain networks against underload cascading failures. Phys. Stat. Mech. Its Appl. 2021, 563, 125466. [Google Scholar] [CrossRef]
- Wang, Y.; Zhang, F. Modeling and analysis of under-load-based cascading failures in supply chain networks. Nonlinear Dyn. 2018, 92, 1403–1417. [Google Scholar] [CrossRef]
- Boccaletti, S.; Latora, V.; Moreno, Y.; Chavez, M.; Hwang, D.U. Complex networks: Structure and dynamics. Phys. Rep. 2006, 424, 175–308. [Google Scholar] [CrossRef]
- Xiao, G.; Pan, L.; Lai, F. Application, opportunities, and challenges of digital technologies in the decarbonizing shipping industry: A bibliometric analysis. Front. Mar. Sci. 2025, 12, 1523267. [Google Scholar] [CrossRef]


| Network | Number of Nodes | Avg. Degree | Avg. Path Length | Avg. DC | Avg. EC | Avg. CC | Avg. BC |
|---|---|---|---|---|---|---|---|
| SDNCT | 195 | 5.5692 | 3.5482 | 0.0231 | 7.4514 | 0.2949 | 247.1795 |
| Seaport subnetwork | 145 | 4.7862 | 3.6077 | 0.0247 | 7.5625 | 0.2927 | 187.7517 |
| Dry-port subnetwork | 50 | 7.4667 | 2.7989 | 0.1190 | 3.8298 | 0.3661 | 53.0667 |
| Seaport | DC | EC | CC | BC | Normalized NI |
|---|---|---|---|---|---|
| Shanghai | 0.2526 | 6.0000 | 0.4814 | 6245.6712 | 1.0000 |
| Ningbo | 0.1804 | 6.0000 | 0.4450 | 2688.4533 | 0.4366 |
| Tianjin | 0.1392 | 6.0000 | 0.4101 | 2859.1421 | 0.2479 |
| Xiamen | 0.1237 | 6.0000 | 0.4119 | 1859.3003 | 0.1624 |
| Hongkong | 0.1289 | 6.0000 | 0.4190 | 2270.3859 | 0.1528 |
| Beibuwan | 0.1134 | 6.0000 | 0.4136 | 2271.9911 | 0.1439 |
| Shenzhen | 0.0825 | 6.0000 | 0.3992 | 1121.5492 | 0.1252 |
| Qingdao | 0.0825 | 6.0000 | 0.4008 | 1205.8068 | 0.1060 |
| Guangzhou | 0.0876 | 6.0000 | 0.4050 | 1061.3772 | 0.1042 |
| Lianyungang | 0.0670 | 7.0000 | 0.3811 | 901.1255 | 0.0576 |
| Avg. PFR | Avg. LCCS | Avg. NELR | |||||||
|---|---|---|---|---|---|---|---|---|---|
| Motter–Lai | CM-SDNCT | Motter–Lai | CM-SDNCT | Motter–Lai | CM-SDNCT | ||||
| Model | -MLRS | Improvement | Model | -MLRS | Improvement | Model | -MLRS | Improvement | |
| 0.2 | 0.7111 | 0.5630 | 20.83% | 0.2115 | 0.3618 | 71.06% | 0.8569 | 0.7624 | 11.03% |
| 0.4 | 0.6908 | 0.5674 | 17.86% | 0.2289 | 0.3510 | 53.34% | 0.8471 | 0.7648 | 9.72% |
| 0.6 | 0.7143 | 0.5714 | 20.01% | 0.2086 | 0.3484 | 67.02% | 0.8574 | 0.7677 | 10.46% |
| 0.8 | 0.7075 | 0.5690 | 19.58% | 0.2122 | 0.3554 | 67.48% | 0.8530 | 0.7585 | 11.08% |
| 1.0 | 0.7129 | 0.5616 | 21.22% | 0.2055 | 0.3571 | 73.77% | 0.8550 | 0.7576 | 11.39% |
| Average | 0.7060 | 0.5680 | 19.55% | 0.2154 | 0.3536 | 64.16% | 0.8531 | 0.7647 | 10.36% |
| Mean | SD | CV | Pearson’s r | |
|---|---|---|---|---|
| Motter–Lai model | 0.0948 | 0.0732 | 0.7715 | 0.3231 |
| CM-SDNCT-MLRS | 0.0407 | 0.0271 | 0.6659 | 0.8080 |
| Pearson’s r | Pearson’s r | |
|---|---|---|
| (Resilience vs. Number of Idle Ports) | (Resilience vs. Port Capacity) | |
| PFR | 0.8700 | −0.0040 |
| LCCS | −0.8027 | 0.0075 |
| NELR | 0.8429 | 0.0069 |
| PFR | LCCS | NELR | |||||||
|---|---|---|---|---|---|---|---|---|---|
| Idle | Operational | Improvement | Idle | Operational | Improvement | Idle | Operational | Improvement | |
| 1 | 0.7234 | 0.4974 | 31.24% | 0.1232 | 0.2564 | 108.04% | 0.9761 | 0.9363 | 4.09% |
| 2 | 0.7123 | 0.4615 | 35.21% | 0.1287 | 0.2564 | 99.20% | 0.9745 | 0.9329 | 4.27% |
| 3 | 0.7210 | 0.4359 | 39.54% | 0.1260 | 0.2564 | 103.53% | 0.9757 | 0.9309 | 4.59% |
| 4 | 0.7169 | 0.4205 | 41.34% | 0.1268 | 0.2564 | 102.16% | 0.9753 | 0.9289 | 4.76% |
| 5 | 0.7162 | 0.4308 | 39.86% | 0.1255 | 0.2564 | 104.36% | 0.9756 | 0.9305 | 4.63% |
| 6 | 0.7203 | 0.4205 | 41.62% | 0.1226 | 0.2564 | 109.21% | 0.9761 | 0.9289 | 4.84% |
| Mean of above | 0.7184 | 0.4444 | 38.14% | 0.1255 | 0.2564 | 104.42% | 0.9756 | 0.9314 | 4.53% |
| Shanghai ( = 0.3) | 0.1602 | 0.0256 | 83.99% | 0.8217 | 0.9231 | 12.34% | 0.3533 | 0.1871 | 47.04% |
| Pearson’s r | Spearman Rank | Mutual Information | |
|---|---|---|---|
| PFR | −0.6075 | −0.6646 | 2.0253 |
| LCCS | 0.2461 | 0.2263 | 1.8867 |
| NELR | −0.3079 | −0.2431 | 2.1639 |
Disclaimer/Publisher’s Note: The statements, opinions and data contained in all publications are solely those of the individual author(s) and contributor(s) and not of MDPI and/or the editor(s). MDPI and/or the editor(s) disclaim responsibility for any injury to people or property resulting from any ideas, methods, instructions or products referred to in the content. |
© 2025 by the authors. Licensee MDPI, Basel, Switzerland. This article is an open access article distributed under the terms and conditions of the Creative Commons Attribution (CC BY) license (https://creativecommons.org/licenses/by/4.0/).
Share and Cite
Lu, Z.; Qiu, W. Resilience Analysis of Seaport–Dry-Port Network in Container Transport: Multi-Stage Load Redistribution Dynamics Following Cascade Failure. Systems 2025, 13, 299. https://doi.org/10.3390/systems13040299
Lu Z, Qiu W. Resilience Analysis of Seaport–Dry-Port Network in Container Transport: Multi-Stage Load Redistribution Dynamics Following Cascade Failure. Systems. 2025; 13(4):299. https://doi.org/10.3390/systems13040299
Chicago/Turabian StyleLu, Zhigang, and Wenhao Qiu. 2025. "Resilience Analysis of Seaport–Dry-Port Network in Container Transport: Multi-Stage Load Redistribution Dynamics Following Cascade Failure" Systems 13, no. 4: 299. https://doi.org/10.3390/systems13040299
APA StyleLu, Z., & Qiu, W. (2025). Resilience Analysis of Seaport–Dry-Port Network in Container Transport: Multi-Stage Load Redistribution Dynamics Following Cascade Failure. Systems, 13(4), 299. https://doi.org/10.3390/systems13040299