Article

Crowd Evacuation Dynamics Under Shooting Attacks in Multi-Story Buildings

1
School of Public Administration, Central South University, Changsha 410083, China
2
PKU-Wuhan Institute for Artificial Intelligence, Wuhan 430070, China
3
School of Economics and Management, Shaanxi University of Science & Technology, Xi’an 710021, China
4
School of Cyber Science and Engineering, Wuhan University, Wuhan 430072, China
*
Author to whom correspondence should be addressed.
Systems 2025, 13(5), 310; https://doi.org/10.3390/systems13050310
Submission received: 19 January 2025 / Revised: 9 April 2025 / Accepted: 10 April 2025 / Published: 23 April 2025
(This article belongs to the Section Complex Systems and Cybernetics)

Abstract

:
Mass shootings result in significant casualties. Due to the complexity of buildings, capturing crowd dynamics during mass shooting incidents is particularly challenging. Therefore, it is necessary to study crowd dynamics and the key mechanisms of mass shooting incidents and explore optimal building design solutions to mitigate the damage caused by terrorist attacks and enhance urban safety. In this study, we focused on the Bataclan Shooting (13 November 2015) as the target case. We used an agent-based model (ABM) to model both the attacking force (shooting) and counterforce (anti-terrorism response). According to the real situation, the dynamic behavior of three types of agents (civilians, police, and shooters) during the shooting accident was modeled to explore the key mechanism of individual behavior. Taking civilian casualties, police deaths, and shooter deaths as the real target values, we obtained combinations for optimal solutions fitting the target values. Under the optimal solutions, we verified the effectiveness and robustness of the model. We also used artificial neural networks (ANNs) to detect the predictive stability of the ABM model’s parameters. In addition, we studied the counterfactual situation to explore the impact of police anti-terrorism strategies and building exits on public safety evacuation. The results show that for the real cases, the optimal anti-terrorism size was four police and the optimal response time was 40 ticks. For double-layer buildings, it was necessary to set exits on each floor, and the uniform distribution of exits was conducive to evacuation under emergencies. These findings can improve police patrol routes and the location of police stations and promote the creation of public safety structures, enhancing the urban emergency response capacity and the level of public safety governance.

1. Introduction

Terrorist shooting incidents pose severe threats to human lives, cause significant social and economic losses [1], and have become a global concern. For example, between 2015 and 2024, the United States experienced 4917 mass shootings, resulting in 173,404 deaths and 334,187 injuries [2]. In Mexico, from 2015 to 2022, there were 188,397 firearm-related deaths, with 67.3% occurring in public places [3]. Similarly, other countries like Brazil [4], Canada [5], Australia [6], and South Africa [7] have experienced varying degrees of gun-related deaths and injuries. According to the statistics of the World Population Review, in 2019, there were 250,227 shooting incidents worldwide, causing about 250,000 deaths (71% homicides) [8]. Therefore, the risk of shooting has become a global topic. Moreover, most shooting incidents took place inside buildings, while only a few occurred in open spaces [9]. Among these, schools [10], churches [11], and government offices [12] were common targets due to their high population density. Studying crowd dynamics in shooting incidents within multi-story buildings is particularly important, as environmental complexity makes evacuation more challenging. Both human behavior and architectural characteristics [13] significantly influence evacuation outcomes [14]. In this study, we focus on the crowd dynamics during a shooting incident, considering civilian evacuation behavior as well as the attack strategies of shooters and police. Regarding building characteristics, we mainly examine the impact of exit locations and numbers on casualty outcomes.
Frequent mass shooting cases and their severe outcomes have attracted increasing research attention on crowd disasters. However, crowd dynamics are complex due to constant interactions between individuals or agents. Agent-based modeling (ABM) plays a significant role in the study of crowd dynamics [15] by combining both microscopic and macroscopic rules to simulate swarm behavior [16]. The social force model is commonly used in crowd dynamics research [17,18]. Additionally, the panic [19] caused by mass shooting incidents often leads to stampedes [20] and collisions [21], which should also be considered. Through a comparison of previous simulation studies (see Table 1), we found that while earlier models considered real crowd dynamics or real-world cases, they rarely matched these models with actual cases. Furthermore, these models did not adequately test the predictive stability of their input parameters. Our model not only simulates real scenarios but also identifies the optimal parameter combination to match the simulation results with real case results. In this study, based on the optimal solution, we further examined counterfactual scenarios. Additionally, we incorporated ANNs to test the predictive stability of the model.
Additionally, environmental factors play a critical role in evacuation effectiveness. Architectural elements such as exits [31], walls [32], and staircases [33,34] can either facilitate or hinder movement. Optimizing spatial layouts can significantly improve evacuation efficiency and reduce congestion risks. For example, strategically placing pillars near exits [35], enhancing guidance systems [36,37], and incorporating clear signaling [38] can help direct movement and alleviate crowding. However, many crowd evacuation studies have overlooked the design of evacuation routes in emergency situations, especially during security crises such as shootings. The number and layout of exits in buildings often fail to adequately account for the need for emergency evacuations. Therefore, this study aims to fill this gap by proposing improvements based on civilian safety design. We used ABM to explore the internal structure (such as the number and location of exits) of buildings, provide recommendations for building safety design, and reduce casualties during crowd evacuations.
In addition to the civilian safety considerations of buildings, police counter-terrorism actions during shooting incidents are also worth discussing. In an indoor shooting incident, there are two opposing forces with offensive capabilities: the attackers (shooters) and the counterforce (police), who jointly influence the outcome of the incident. For example, an individual’s access to a shooter’s location information can improve survival rates [39]. A shooter’s attack strategy and scale will reduce civilians’ survival rate [40]. The difference between the shooting scene [41] and building design [22] will also lead to a difference in results. Although the shooting process seems irrational, it is more reasonable to consider the motivation for shooting behavior in the scope of rational choice. According to the theory of rational choice [42], the shooter measures the benefits and costs of the action before attacking [43]. The shooter chooses to strike when the benefits outweigh the costs [44]. For counterterrorism forces, trained police officers typically have physical fitness above the average level [45]. During counter-terrorism operations, they wear equipment such as bulletproof vests to reduce the risk of injury [46]. In the face of terrorist attacks, they often possess a calmer mindset and more experience in handling such situations [47], making them a greater threat to the shooters and, consequently, the primary target for the terrorists [48]. Police response plays a crucial role in mitigating the impact of terrorist attacks. We use counterfactual simulations to explore terrorist attacks and counter-terrorism measures, identify the optimal police response time, and optimize emergency response plans. This can further enhance the safety level of crowds during shooting incidents.
Our study aims to capture crowd behavior mechanisms in shooting incidents that occur within complex indoor buildings and provide more effective counterterrorism strategies and safer architectural designs through counterfactual inference. We use ABM to achieve this goal. By defining the behavior rules of micro agents, ABM achieves the emergence of macro phenomena [49]. It is the most appropriate tool for studying complex systems [50]. In the case of an emergency, human beings in multi-story buildings are more vulnerable [23]. NetLogo, a commonly used ABM software [51], can be used to explore crowd emergency evacuation mechanisms [15], such as in fires [52], large-scale events [53], and shooting incidents [22,54]. NetLogo can explore the impact of micro agent behavior on macro events and reveal system-level phenomena based on individual behavior. Therefore, we used NetLogo 6.1.0 for modeling to explore crowd dynamics patterns in shooting incidents and effective evacuation strategies for building safety exits. Finally, we used artificial neural networks (ANNs) to handle the nonlinear relationships of complex ABM model parameters [55] and detect the predictive stability of the key input parameters of the ABM model on the output results.
This paper consists of five sections: Besides the Introduction, Section 2 presents the ABM modeling approach, including the setup of the environment, agents, and crowd dynamics mechanisms. Section 3 identifies the optimal simulation results and validates their effectiveness. Section 4 explores, through counterfactual inference, the impact of police presence, police response time, and the number and location of building exits on casualties in shooting incidents. Additionally, an ANN is used to examine the predictive stability of the model parameters. Lastly, we discuss the related findings and conclusions.

2. Materials and Methods

2.1. The Real Target Case

We took the Bataclan attack case (13 November 2015) as the target case. The occurrence and development of events at key time points can be seen in Panel C of Figure 1. At the time of the crime, a concert was being held at Bataclan Theater, with about 1500 in the audience. At about 21:50, three shooters killed three people outside the theater and then rushed into the theater with an explosive vest and opened fire on the crowd inside the theater, causing panic among the civilians. A few minutes later, the hall fell into darkness with only the flashes of the shooter’s gun, creating difficulties for civilians attempting to flee. Two shooters went to the stairs to shoot and the other shooter went to the emergency exit near the stage. At 22:15, two policemen entered the theatre with pistols and shot and killed the shooter standing on the stage. Subsequently, two other shooters took about 20 hostages for negotiations. Finally, one shooter detonated his explosive vest, and the other tried to do the same but got shot. During the final stage, no hostages were either injured or killed. The attack killed 90 civilians (87 of whom died in the theater) and three shooters. Also, more than 200 civilians were wounded [56]. Since the negotiation took a long time, in which no civilians or police were injured or killed, our simulation process was from the shooters rushing into the theater to the police killing a shooter. In this process, a total of about 1500 audience members were present. Three shooters and two policemen responded later. Finally, 87 civilians, 1 shooter, and no police officers were killed. Also, more than 200 civilians were injured [57]. These resulting data were used as simulation targets.

2.2. Environment Setting

We used NetLogo software (6.0.4) to simulate the real target case. The target case scene was a two-story building consisting of a hall on the first floor and a balcony on the second floor. The first floor comprised a gray stage at the bottom, a standing area in the middle, and seating areas on both sides. The building had three exits: the main exit facing the street and two at the side, which were represented by white patches in the model. The shooter entered through the door facing the street. In Panel A of Figure 1, we set the model’s environment regarding Panel B. The balcony was represented by a light orange part surrounding the middle area. The blue floor was the first-floor area. The dark blue part was the seating area, while the light blue part was the standing area. The access points (stairs) on the first and second floors were represented by yellow patches. We set up four stairs in similar locations according to the real environment. Black patches represented walls or railings that agents could not pass through. Different shapes and colors represented different types of agents. For civilians, dark green circles denoted civilians in the initial state. We also considered that people run and fall in dark environments in panic, so the pink circles represented civilians who fell. The red “x” indicated dead civilians. Orange triangles were the shooters, with an exclamation point representing dangerous elements. A gray arrow denoted the shooter’s bullet trajectory. Blue uniforms indicated police, whose bullet tracks were represented by red arrows from the executor of the shooting to the target.

2.3. The Mechanism of Pedestrian Dynamics

In the real target case, people exhibited a series of panic behaviors after being shot at. They either started running around looking for an exit or fell to the ground. Therefore, we did not consider the possibility of communication behaviors, which may occur in rare cases during a shooting incident. For modeling pedestrian dynamics in a panic state, we referred to the work [38] of Helbing (2000) and made the following settings: (a) Movements. We set civilians to move at different speeds in different areas. Considering that in the real environment, chairs would hinder the movement of civilians, civilians were slower in the area with chairs than in the standing area. We traversed the parameters within the range of 0~1 patches and finally determined that the movement speed of civilians was 0.05~0.15 patches in areas with chairs and 0.1~0.3 in standing areas. The speed of police officers was consistent with civilians’ speed in the standing area, ranging from 0.1 to 0.3 patches. In addition, civilians followed the basic principle of social force [49] during movement. As shown in Figure 2, civilians were primarily influenced by two forces while moving. One was the repulsive force, as depicted in subfigure (a), including the repulsive force between the wall (environment) and pedestrians. Specifically, pedestrian A would stay away from the wall at an angle of 180°-α at the next tick (t + 1) after touching the wall at angle α at the current tick (t) (a tick is the unit of time in NetLogo’s timer). When two mobile agents, B and C, collided in the same patch, they would leave this patch at a random angle at the next tick. (b) Escape. As shown in Figure 2b, agents’ escape guidance mainly came from the attraction of environmental facilities. For this model, two types of facilities attracted civilians. When civilians perceived these facilities, those on the second floor would rush to the stairs, while civilians on the first floor would run to the exit. (c) Fall. A few minutes after the attack, all the lights in the theater were turned off, resulting in a dark environment. Under such circumstances, civilians could not see their surroundings clearly, and panic caused people to run aimlessly, increasing the risk of falling. Therefore, we used the falling probability to set a certain proportion of people to fall randomly. The falling agent lost the ability to move and required ten ticks to get up and continue to move. (d) Collision and trampling. Compared with rational and orderly evacuation, civilians who have suffered sudden attacks move in an unorganized and irrational [58] manner, which easily leads to collisions and trampling [59,60]. When two mobile agents collided on the same patch, they injured each other. When a mobile agent passed a fallen agent, the fallen agent was trampled. As shown in Table 2, we traversed collision and trampling injury parameters within the ranges of 0~0.1 blood and 0~20 blood, respectively. (e) Avoidance. In some narrow areas, such as near stairs and exits, congestion and arching are likely to occur [61]. Civilians try to avoid these places when moving. We set a maximum population limit on each patch. When the number of people on the current patch exceeded the maximum population, the agent moved to the patch with the fewest people within 1.2 patches and 270° ahead. We traversed the maximum population on each patch within the range of 1~10 and, finally, this value was set as 3. (f) Death. When the life level of an agent was 0, the agent died. Civilians could die in two ways: shot to death or trampled to death, represented by red “X” and gray circles, respectively. Police and shooters could only be shot to death, and turned gray after death. Dead agents could not move or attack.

2.4. Civilian Settings

In our ABM, we had three classes of agents: civilians, police officers, and killers (shooters). In real cases, the audience, performers, and staff are considered civilians since they are unarmed. The relevant settings for civilians were as follows:
(a) Perception radius R. Perception range referred to the ability of pedestrians to perceive the external environment and other agents [62]. Due to the individual heterogeneity and environmental complexity [52,63,64], the perception range pattern of civilians is heterogeneous. Civilians will run towards these targets when the exits or stairs are within perception range. Conversely, civilians may become confused during the panic caused by the shooting, when these evacuation routes are blocked by buildings or too far from civilians to see. However, more civilians over time begin to realize the current situation, explore their surrounding environment to some extent, and share evacuation routes and exit information [65]. Therefore, the overall perception range R of civilians will increase over time. We set R to increase by 1/25 patch for 1 tick increment.
(b) “Life level” blood. “Life level” referred to the health level of agents, which was measured by the parameter “blood”. As a unified concept, blood represented the physical healthy state (strong or weak) and life state (health, injury, or death) of agents. The higher the blood, the higher the life level of the agent. Agents with higher life levels were healthier than agents with lower life levels. Due to population differences, agents’ life levels and blood were also heterogeneous [66,67]. Generally speaking, there are three types of people: strong, normal, and weak. The weaker individuals belong to vulnerable groups such as children and the elderly [68]. Stronger individuals include youth and post-adolescents. Therefore, we set the blood values of agents to follow the normal distribution. According to the 6th national census of China, 25.52% of the total population is under 14 and over 65 years old [69]. There were about 1500 people in this case. We set the blood of all civilians to follow the normal distribution with a mean value of 100 and a standard deviation (SD) of 20. Therefore, agents with a blood volume < 86 accounted for 25% ≈ 25.52%. We defined agents with a blood volume of less than 86 as vulnerable groups among civilians, which is consistent with the distribution of population health status in the real world. In the model, vulnerable groups and civilians with low life levels were represented by green circles that were deeper than healthy agents. Equation (1) shows the relationship between blood and an agent’s life level. If an agent was not injured, meaning the blood volume was not reduced, the agent was considered healthy; if a civilian’s blood volume was lower than the initial value, they were injured. During a shooting incident, civilians may sustain minor injuries (e.g., from a collision), but such cases are typically not included in statistical reports. Therefore, in our model, a decrease in blood level alone did not automatically classify an agent as seriously injured. Instead, serious injury was determined when blood loss exceeded a certain threshold. Then, they were counted as an injured civilian; an agent was considered dead if the blood volume was ≤0.
  B l o o d i t A g e n t = H e a l t h y   i f   B l o o d i t A g e n t = B l o o d i 0 A g e n t   I n j u r y   i f   B l o o d i t A g e n t < B l o o d i 0 A g e n t D e a t h   i f   B l o o d i t A g e n t 0    

2.5. Shooter Setting

Although the shooting was antisocial and irrational, the attack strategy and scheme of the shooter resulted from rational selection [43,70]. In this case, the place where the shooters attacked was a double-story building. Shortly after the attack, two shooters chose to shoot on the second floor, while one went to the exit beside the stage. We set the shooting mechanism of the shooters as follows:
(a) Hitting range. The hitting range referred to the range where the shooters could hit a target and cause damage to a target. After the shooting started, all the lights in the field were extinguished, which led to a dark environment, reducing the vision of the shooters [71]. We set the slider shoot distance as the hitting range of shooters. Since the police were professionally trained, they avoided bullets as much as possible compared with panicked civilians [47]. Therefore, the hits of shooters on police were reduced. We set the shooting range of shooters against the police to be half that of civilians.
(b) Shooting damage and frequency. The shooter could cause damage to a target when the target of the shooter was within the hit range [72]. At each tick, between 1 and 3 terrorists randomly fired shots. The slider shooting damage expressed the damage value. If the target of the shooter exceeded their hit range, they were not hit.
(c) Shooting target selection. Police and civilians were the two types of targets for the shooter. For shooters, armed police posed a more significant threat than unarmed civilians, so they chose to attack the police first [48]. We set the shooters to prefer the police as their target. They attacked civilians if police did not appear. In this case, two police officers entered the Bataclan Theater some time after the shooting began. They first shot a shooter standing on the stage and killed him, while the other two shooters fired at the police.
(d) Live level blood setting. In this case, the police and shooters were the people with the highest life levels. During the shooting, they had better equipment and bodies, reducing their probability of death and injury [46]. Police officers and shooters performed shooting actions. We set the life level of the shooters and the police to be the same: five times the shooting damage.

2.6. Counter-Terrorism Force Setting

Police are a vital anti-terrorism force in shooting terrorist attacks. In this case, three shooters entered the theater together. Subsequently, two shooters ran to the second floor, while another shooter opened fire on the fleeing people on the first floor. After that, two police officers entered the building and shot the shooters. The police were set up as follows:
(a) Hitting range. The hitting range of the police depended on the vision of the police and the location of the shooters. The only target of the police was the shooters. When the police entered the scene from the first floor, two shooters were upstairs and one was downstairs. Moreover, the dark environment made it difficult for the police to observe the surrounding situation and enemies. The shooters had a thorough understanding of the environment of the attack site in advance [45]. Therefore, the hitting range of the police was smaller than that of the shooter. Additionally, the shooters upstairs were covered by railings and occupied geographical advantages, which made it difficult for the police to hit, but also reduced the attack injury of police. Hence, we set the shooting range of the police against the shooter on the first floor to be one-third of the shooting range of the shooter and the shooting range of the shooters on the second floor to be one-fourth of the shooting range of the first-floor shooter. The shooters on the second floor were hurt half as much as the shooting damage.
(b) Blood volume setting. The physical quality of the police is higher than that of ordinary people [45]. As mentioned before, we set the life level of the police to be the same as the life level of the shooters, which was reflected by the parameter blood. The blood of the police was five times the shooting damage.
(c) Equipment defense. Equipment defense referred to the weakening effect on the equipment worn by the police due to shooting damage. Our target case was a mass shooting incident. The police entering the scene wore complete protection devices, including bulletproof vests and shields [57]. The equipment could defend considerably well against shooting damage. We set a slider police defense to find this damage defense ratio.

3. Optimal Solution Outcomes

3.1. Solving Optimal Solutions

In the real case, there were about 1500 people at the Bataclan Theater when the shooting occurred. At around 21:50, three shooters broke into the concert and shot at the crowd. The terrorist attack lasted about 20 min until police arrived and killed one shooter standing on the stage. At the end of the terrorist attack, 87 civilians were killed and about 200 civilians were injured. Police killed one shooter while the other two died by suicide. No police death happened. In this study, our target values of Y variables were 87 civilian deaths (Y1), 200 civilian injuries (Y2), 1 shooter death (Y3), and 0 police deaths (Y4). We assumed the civilian injuries (Y2) were 200 as there were more than 200 civilian injuries but no specific figures in public data for this case. f r e a l = f ( 87 ¯ , 200 ¯ , 1 ¯ , 0 ¯ ) was used as a real objective function that had four values, which needed to be matched well in the model simulation. If the simulation was effective, we could obtain at least one combination of optimal parameters close to the real situation. We present the model and traversal parameters in Table 2. The parameters listed in Table 2 served as the input data for the NetLogo simulation and the corresponding output parameters were the values we aimed to predict, including civilian deaths (Y1), civilian injuries (Y2), shooter deaths (Y3), and police deaths (Y4). We added the units of each input parameter used in NetLogo in the first column of Table 2 under “Terminology (Unit)”. For example, Perception radius (patches) and Distance of shooting (patches) were described using the spatial scale with the unit “patch”. In NetLogo, the space was divided into equally sized square grids, with each grid representing a “patch.” The Police response time (ticks) was described using the temporal scale with the unit “ticks”. In NetLogo, ticks were used to represent time steps or units of progress in the simulation. Each time a tick occurred, the model state in NetLogo was updated. In the third column, “Range of parameter traversal (step size)”, the values in parentheses represented the step size of the corresponding parameters during the traversal. We obtained many simulation results, and each result had an error with the real values. We defined the error as ( = f s i m · f r e a l · ), representing the degree of error between the simulation results and the real case in Equation (2). The mean square error (MSE) could indicate the degree of difference between the simulation value and real target value.
M S E = E f s i m · f r e a l · 2
Each combination of parameters was simulated 100 times in the experiment, and the average value of 100 simulation results was calculated. Since the optimal solution was determined by sequentially setting the values of each parameter, we simulated approximately 35,000 different parameter combinations in total. The average value was substituted into the MSE as f s i m · . We compared the MSE of each combination of parameters and found the smallest error of one as the optimal solution parameter p a r a m e t e r s   . Finally, we found a combination of optimal solutions and p a r a m e t e r s : the perception radius was 5, the shooting damage of shooters was 56.8; the probability of tumble was 0.04%, the shooting distance was 40 patches, the shooting damage of police was 41, each trampling reduced 10 blood, civilians were regarded as injured when the blood was lower than 40% of the total blood, the collision damage of the civilians was 0.05, the time of police arrival was 180 ticks, and the police equipment could reduce damage from shooters by 95%.
P a r a m e t e r s = A r g m i n = A r g m i n M S E  

3.2. Validity of the Optimal Solution

The optimal solution corresponding to the final result of the actual target case needed to be back-calculated for the entire shooting process. Figure 3 presents the results of 1000 simulations based on the optimal solution, which were in good agreement with our actual target case. (a) The number of civilian deaths. In the real case, shooters killed 87 civilians. Under the optimal solution, the average number of civilian deaths was 86.63. The SDs of civilian death tolls under two combinations of optimal solutions were 8.84, which were less than the mean values. (b) The number of civilian injuries. In reality, there were 200 injured civilians. Under the optimal solution, the mean value was 200.27. The SDs of injured civilians under the optimal solution were 12.18. (c) The number of shooter deaths. In the real case, one killer was killed, and the value was 1 under the optimal solution, showing 100% matching. (d) The number of police deaths. In the actual target situation, there were no police deaths. In the simulation, the result was 0.02, which was approximately 0. Furthermore, Q-Q plots were used to examine the normality of parameters for the 1000 observations in each panel. Both the number of civilian deaths and injuries followed a normal distribution (see Figure 4A,B). However, the Q-Q plots of the number of police deaths and shooter deaths were horizontal as they did not conform to the normal distribution since their values were only 0 or 1.

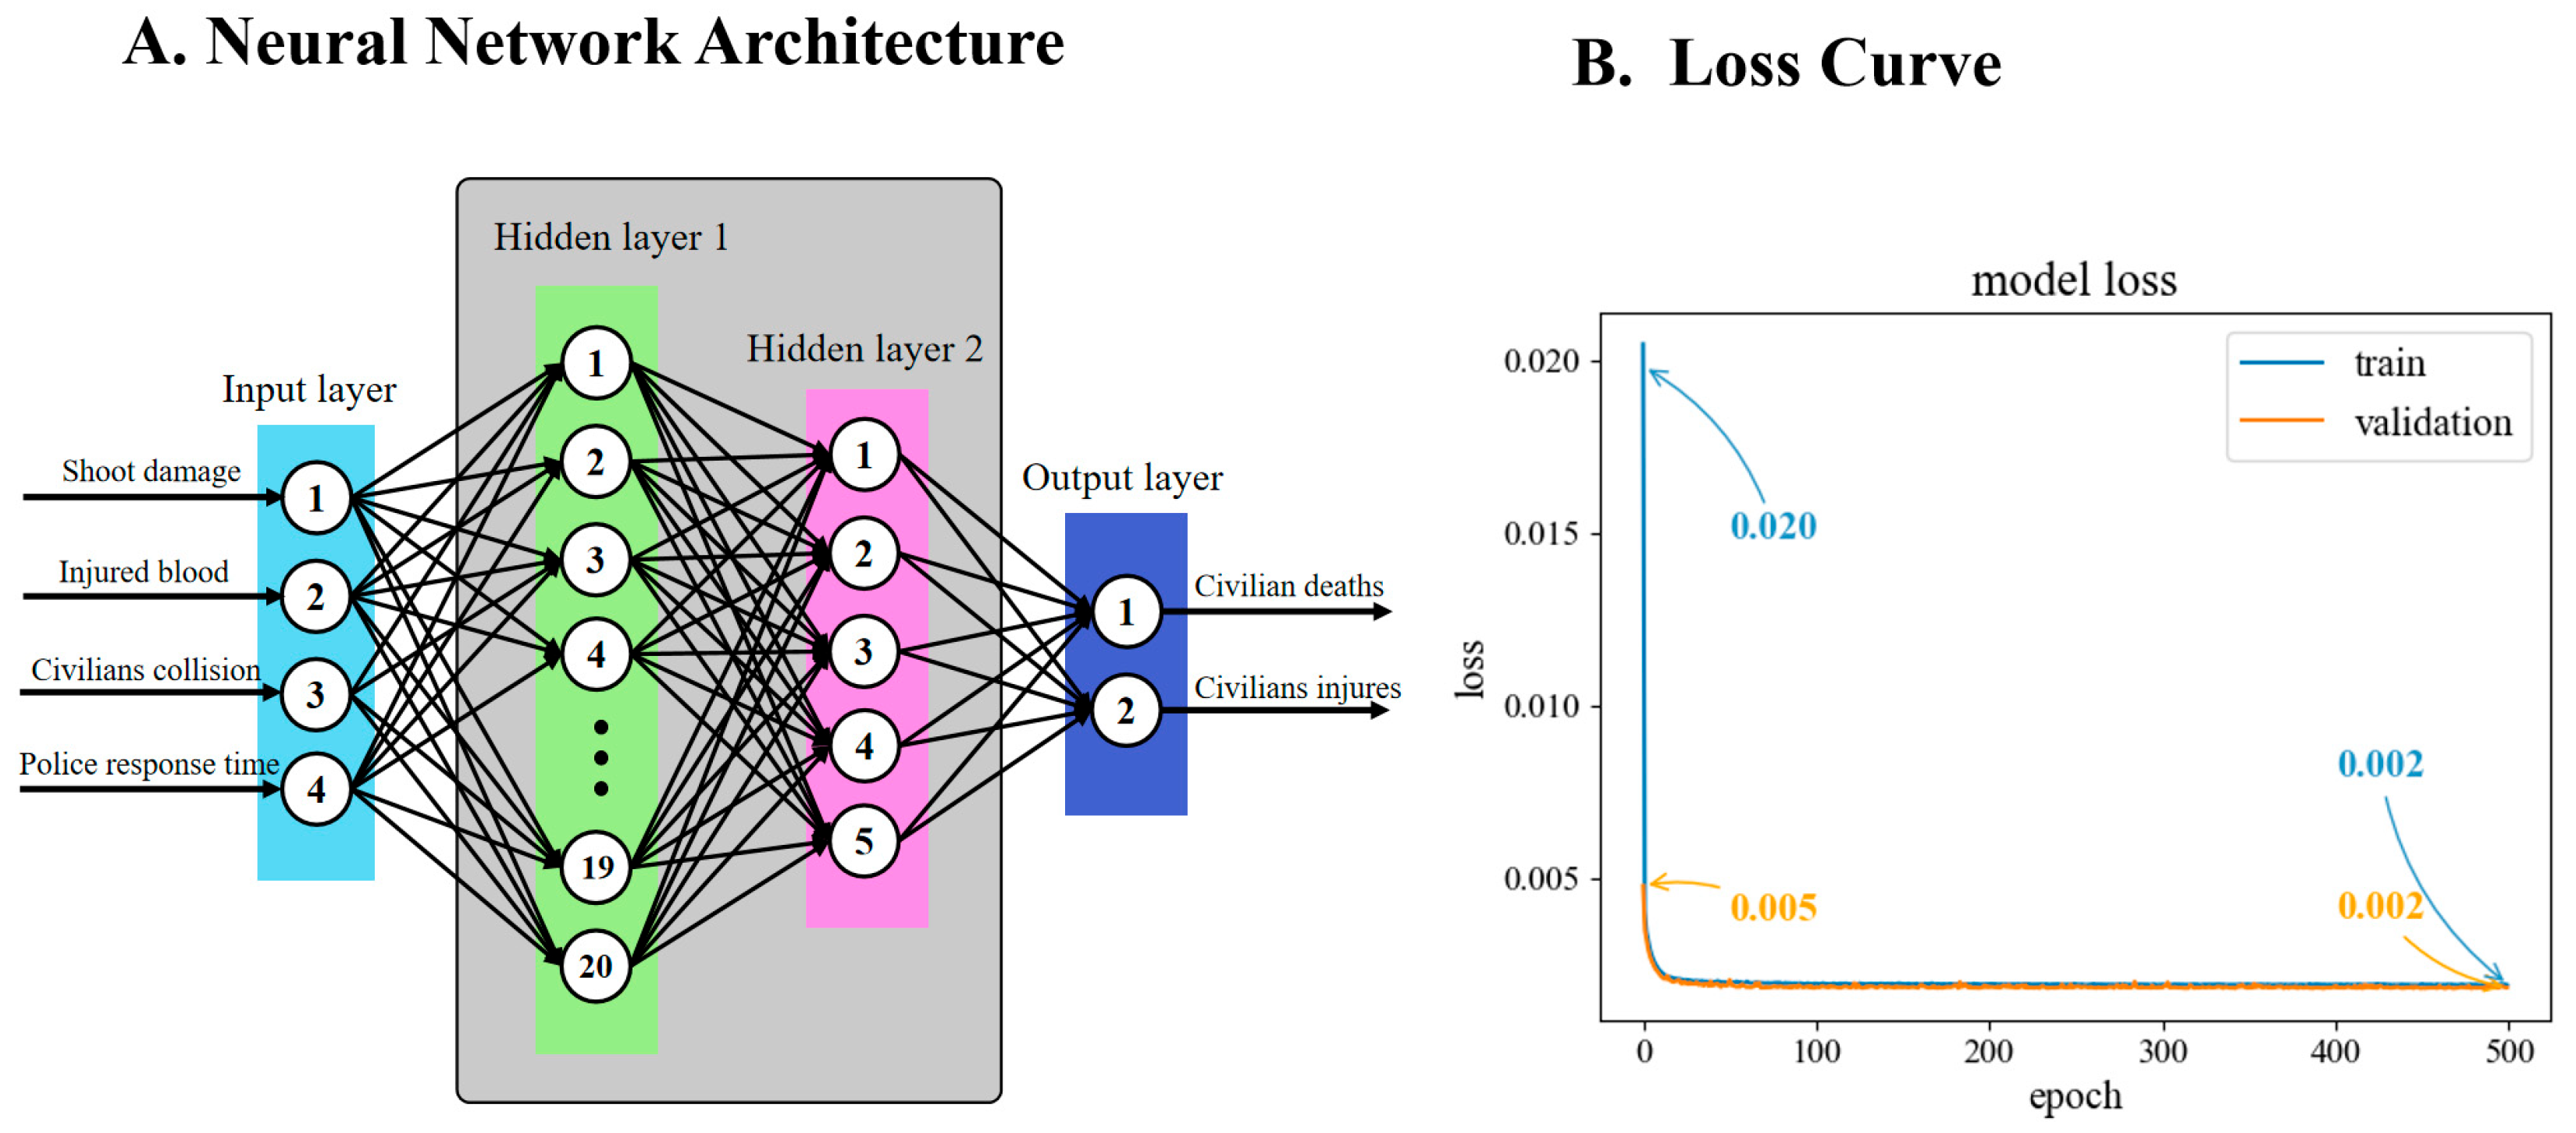
3.3. Artificial Neural Network

Artificial neural networks (ANNs) were initially used to simulate the performance of the biological nervous system [73]. We used an ANN to detect the predictive stability of the input parameters of the ABM model on the output results [55]. The simulation outputs from NetLogo served as the input data for the artificial neural network (ANN) model. The ANN was then employed to analyze how changes in these input parameters affected the stability of the model’s output. By using the ANN, we assessed whether variations in the input parameters led to inconsistencies in the model’s predictions, thus enabling us to evaluate the predictive stability of the ABM results. In this way, the ANN provided a tool for validating the consistency of the NetLogo simulation results. Figure 4 shows the architecture of the ANN model and the loss curve of training and testing. The best optimization method, activation function, and network architecture were determined by trial and error. The optimization method was Adam (Adaptive Moment Estimation) and the activation function was Relu. Our ANN model had an input layer, two hidden layers, and an output layer. The input layer contained four neurons, into which we input four parameters, including shooter damage, injured blood, civilian collision, and police response time. After debugging, the first hidden layer had 20 neurons and the second hidden layer had five neurons. The output layer output two variables: civilian deaths and civilian injuries. The training set and verification set data accounted for 80% and 20% of the data set, respectively. The number of training iterations of the model was 500. In Figure 4B, the blue line was the loss curve of the training, from 0.206 to 0.007, while the orange line was the loss curve of the verification, from 0.029 to 0.005. Finally, the loss values were less than 0.01 and tended to be stable, which shows that the model had good convergence and prediction performance.

4. Counterfactual Inference

Counterfactual inference enables the inference of potential situations that did not materialize in the real world. By employing the parallel simulation method, it becomes possible to derive counterfactual outcomes that hold significance for the real world. Leveraging the optimal parameter combination, counterfactual inference was utilized to explore the influence of escape exits and anti-terrorism forces (police officers) on the shooting incident.

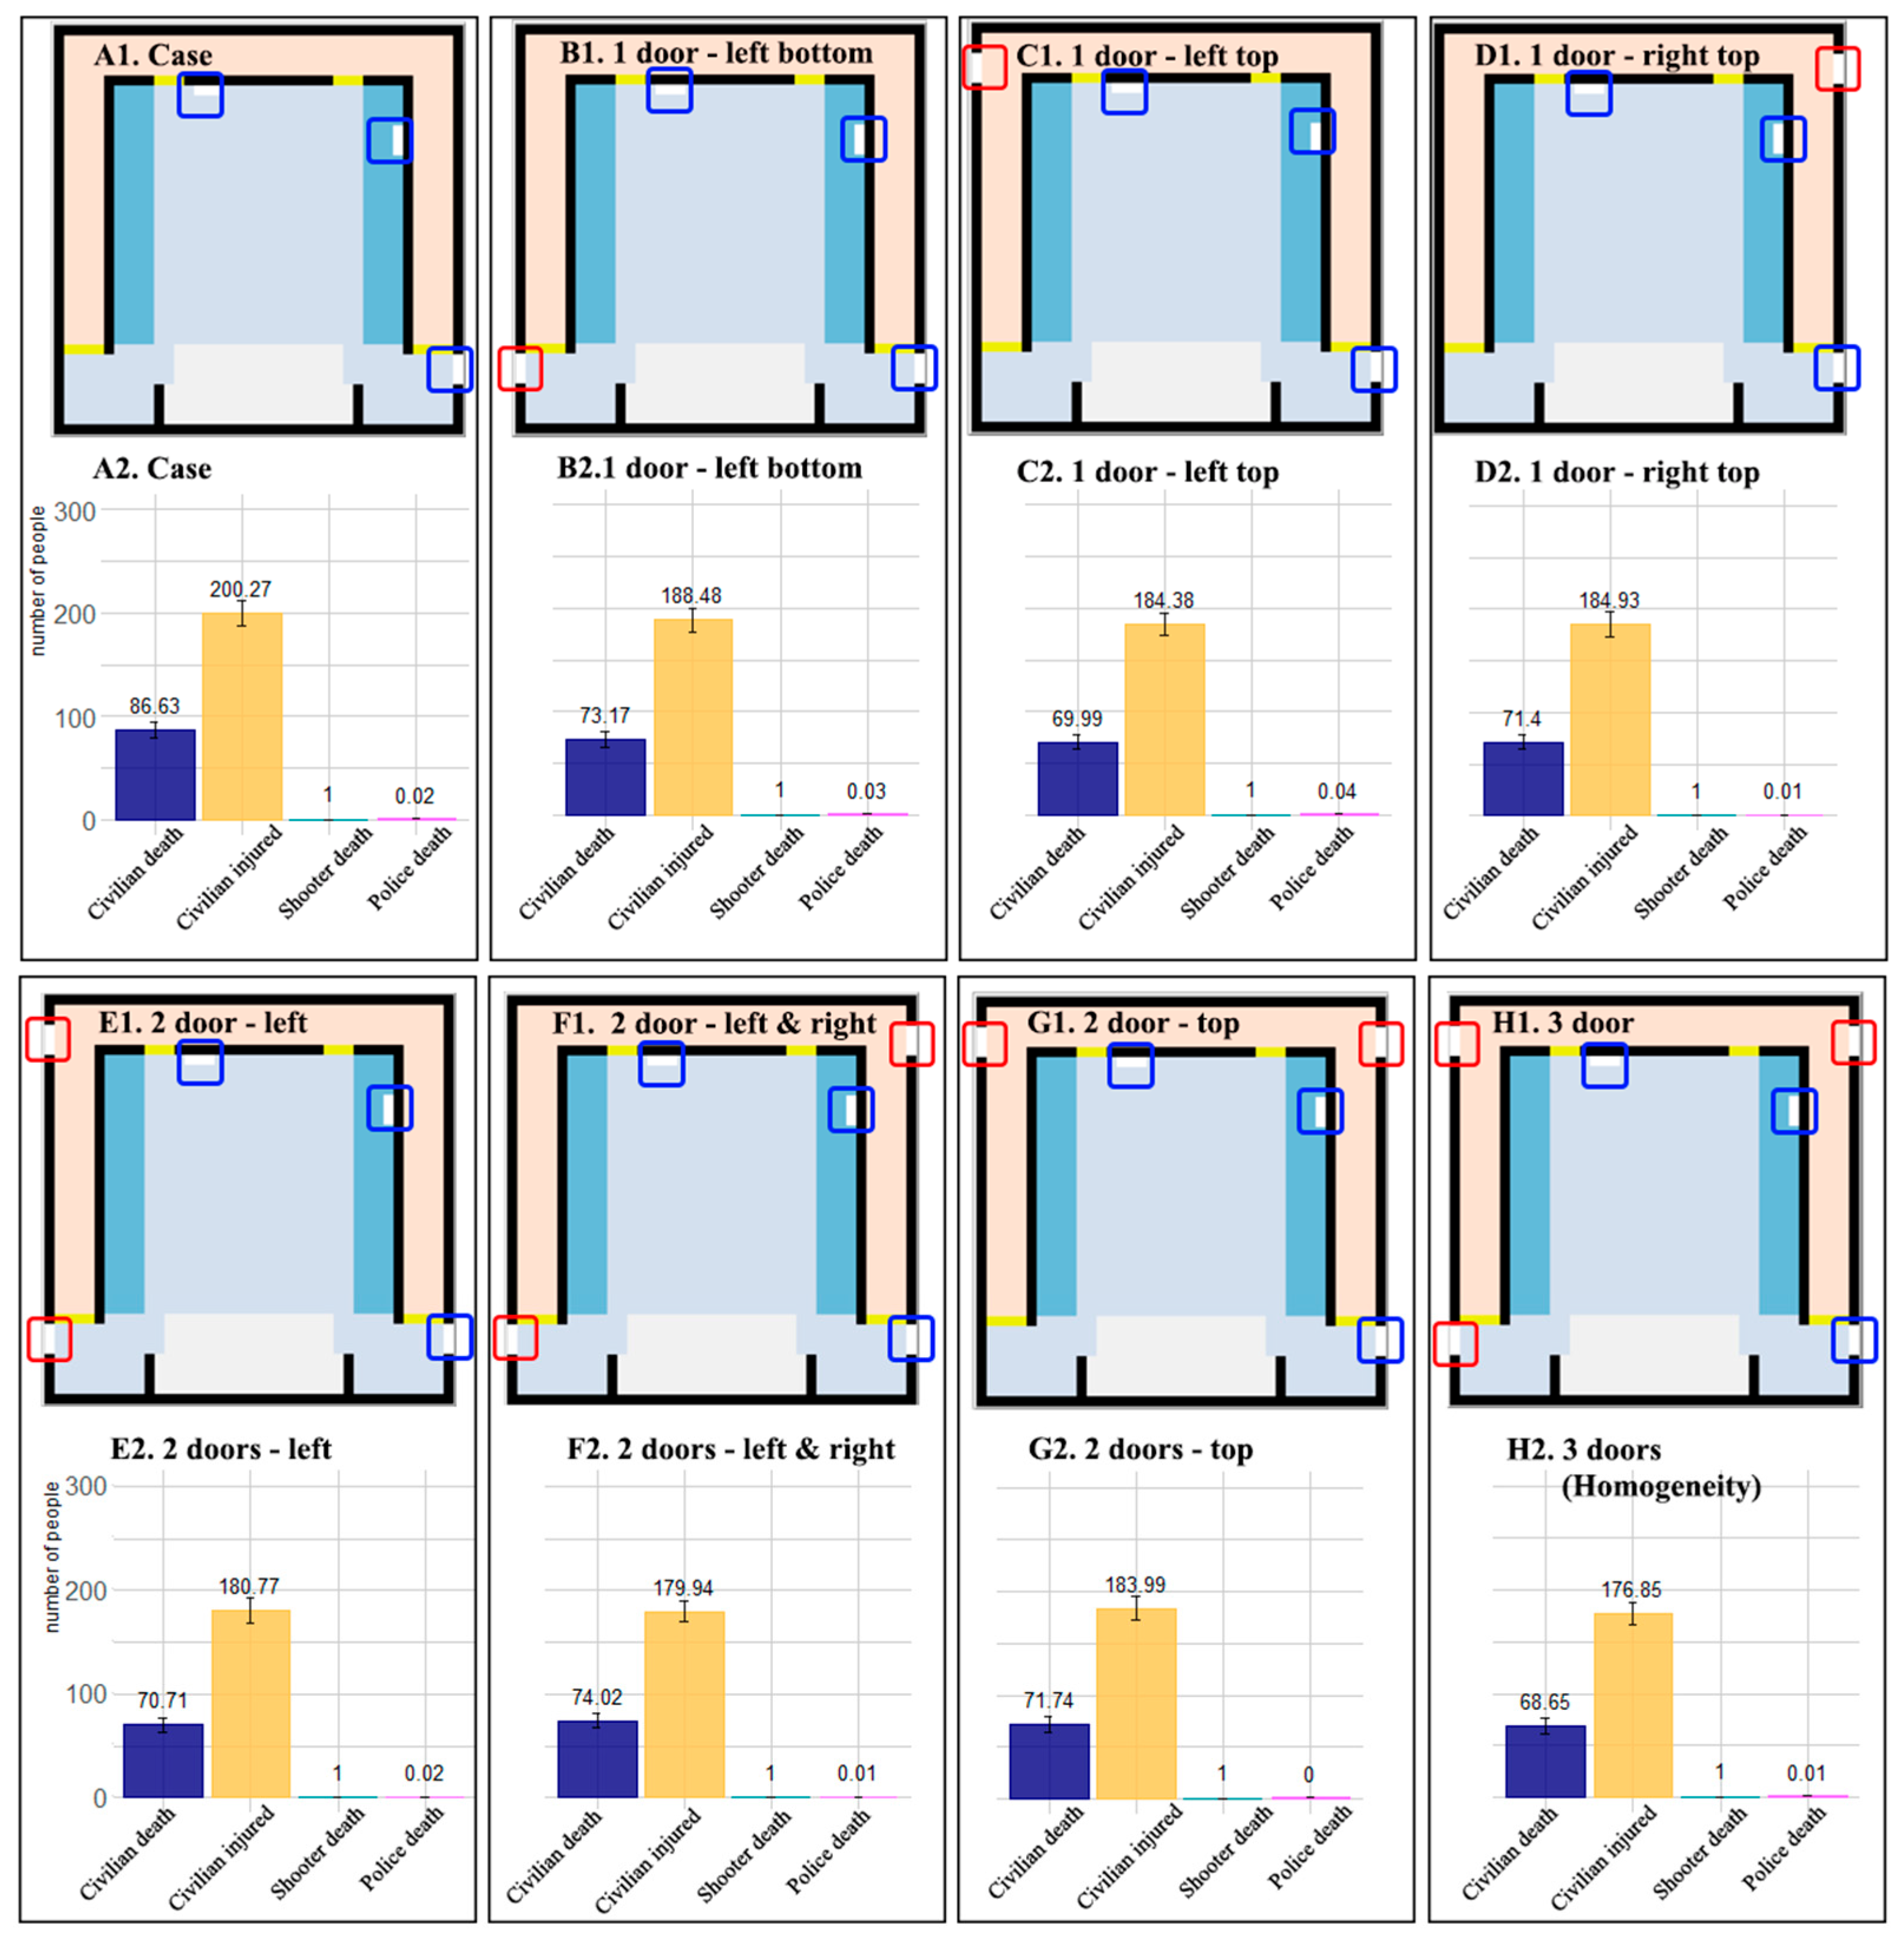
4.1. The Effective Reconstruction Scheme for Building Safety Exits

The design and analysis of building exits are crucial for ensuring safe evacuation and the efficient operation of a building. Their rationality directly impacts evacuation efficiency in emergencies and the outcome of shooting incidents. We first discuss the rationality of building exit placement. We added one to three exits in different corners (blind spots) based on the real case. In Figure 5, the exits from the original case are indicated by blue boxes, while the newly added exits are marked with red boxes. Figure 5 compares the outcomes of the real case with that of a case with other possible exits. The results presented are under the optimal solution. From Figure 5(A2–H2), the number of shooter and police deaths was similar across each scenario, with 1 shooter death and 0 police deaths. There were relatively significant differences in the number of civilian deaths and injuries.
(1) Real target case. In the real case, there were three doors, located at the top and right of the first floor. As shown in Figure 5(A2), 6.63 (SD = 8.29) civilian deaths and 200.27 (SD = 12.32) civilian injuries were caused under the optimal solution. (2) Adding one door. As a door existed on the right of the first floor in the real case, we added a door on the left of the first floor (Figure 5(B1)), on the left of the second floor (Figure 5(B2)), and on the right of the second floor (Figure 5(B3)), respectively. When the new exit was on the left of the first floor, civilian injuries reached their maximum, with 188.48 (SD = 11.24), shown in Figure 5(B2). When the new exit was on the left of the second floor, the civilian death toll was the lowest, at 69.99 (SD = 6.95), shown in Figure 5(C2). The second lowest was with the top right exit at 71.4 (SD = 7.35). Also, the death and injury results were relatively low when the new door was on a balcony. If the exit was on the first floor, civilians needed to use the stairs to reach the exit, where stampedes and collisions were more likely to occur compared to escaping directly from the exit on the second floor.
(3) Adding two doors. Based on the real target case, we added two doors on the left side (Figure 5(E1)), one door on the left of the first floor and another door on the right of the second floor (Figure 5(F1)), and one door on the left of the second floor and another door on the right of the second floor (Figure 5(G1)), respectively. Under the optimal solution in Figure 5 with two new doors added, the differences in the numbers of civilian deaths and injuries in the three scenarios were small: 70.71 (SD = 6.84), 74.02 (SD = 6.91), and 71.74 (SD = 7.99) civilian deaths and 180.77 (SD = 12.3), 179.94 (SD = 10.14), and 183.99 (SD = 11.31) civilian injuries, respectively. These numbers were all lower than for the real case, possibly due to the heterogeneous perception range of civilians. Civilians with a larger perception range fled the scene first, while civilians with a smaller perception range fled the scene later, forming an orderly escape, reducing the collisions and trampling near the exit.
(4) Adding three doors. We added two exits on the left and one on the right of the second floor, as shown in Figure 5(H1). New exits reduced civilian deaths and injuries, which were 68.65 (SD = 7.35) deaths and 176.85 (SD = 10.99) injuries. With heterogeneous perception ranges, the more exits there were, the safer civilians were, proving the importance of orderly evacuation.
In conclusion, increasing exits on the second floor was necessary, significantly reducing civilian deaths. While increasing the number of exits is beneficial for crowd evacuation, buildings cannot have an unlimited number of exits. Therefore, within the constraints of building design, our goal was to explore the optimal distribution of exits that maximized safety. For large-scale crowd gatherings in multi-story buildings, we could assume that all four corners of the first and second floors were blind spots. The strategic placement of exits that maximize safety (especially when considering the cost of retrofitting old buildings) required further exploration. For example, we examined scenarios where one blind corner (by adding one exit) or two blind corners (by adding two exits) were eliminated. Our findings show that adding an exit on the second floor was more beneficial for mitigating the risk of attacks than simply eliminating a blind corner on the first floor. As shown in Figure 5, eliminating a first-floor blind corner (Figure 5(B1,B2)) proved less effective than removing a second-floor blind corner (Figure 5(C1–D2)). To further explore this finding, we also studied the effect of eliminating two blind corners (Figure 5(E1–G2)), and the conclusion remained valid. Notably, eliminating two corners on the second floor (Figure 5(G1)) yielded less benefit than eliminating blind corners on different floors (Figure 5(E1,F1)). Further, when the new exit was located further away from the existing exit, the security benefits of increasing the exit were greater (Figure 5(F1)). This improvement better reduced crowd congestion within the building.
Therefore, for the building in the case study, when considering the cost of renovation, if only one exit was added, the options in Figure 5(C1) or Figure 5(D1) were more suitable. If two exits were added, the option in Figure 5(F1) was best. Overall, we identified a more effective reconstruction scheme for building safety exits, namely, with new exits as far as possible from the existing exits. These findings suggest that for building design or renovation, considering an even distribution of exits can significantly improve a building’s ability to resist attacks. Combined with realistic cost considerations, these findings have important practical implications for building safety improvements.

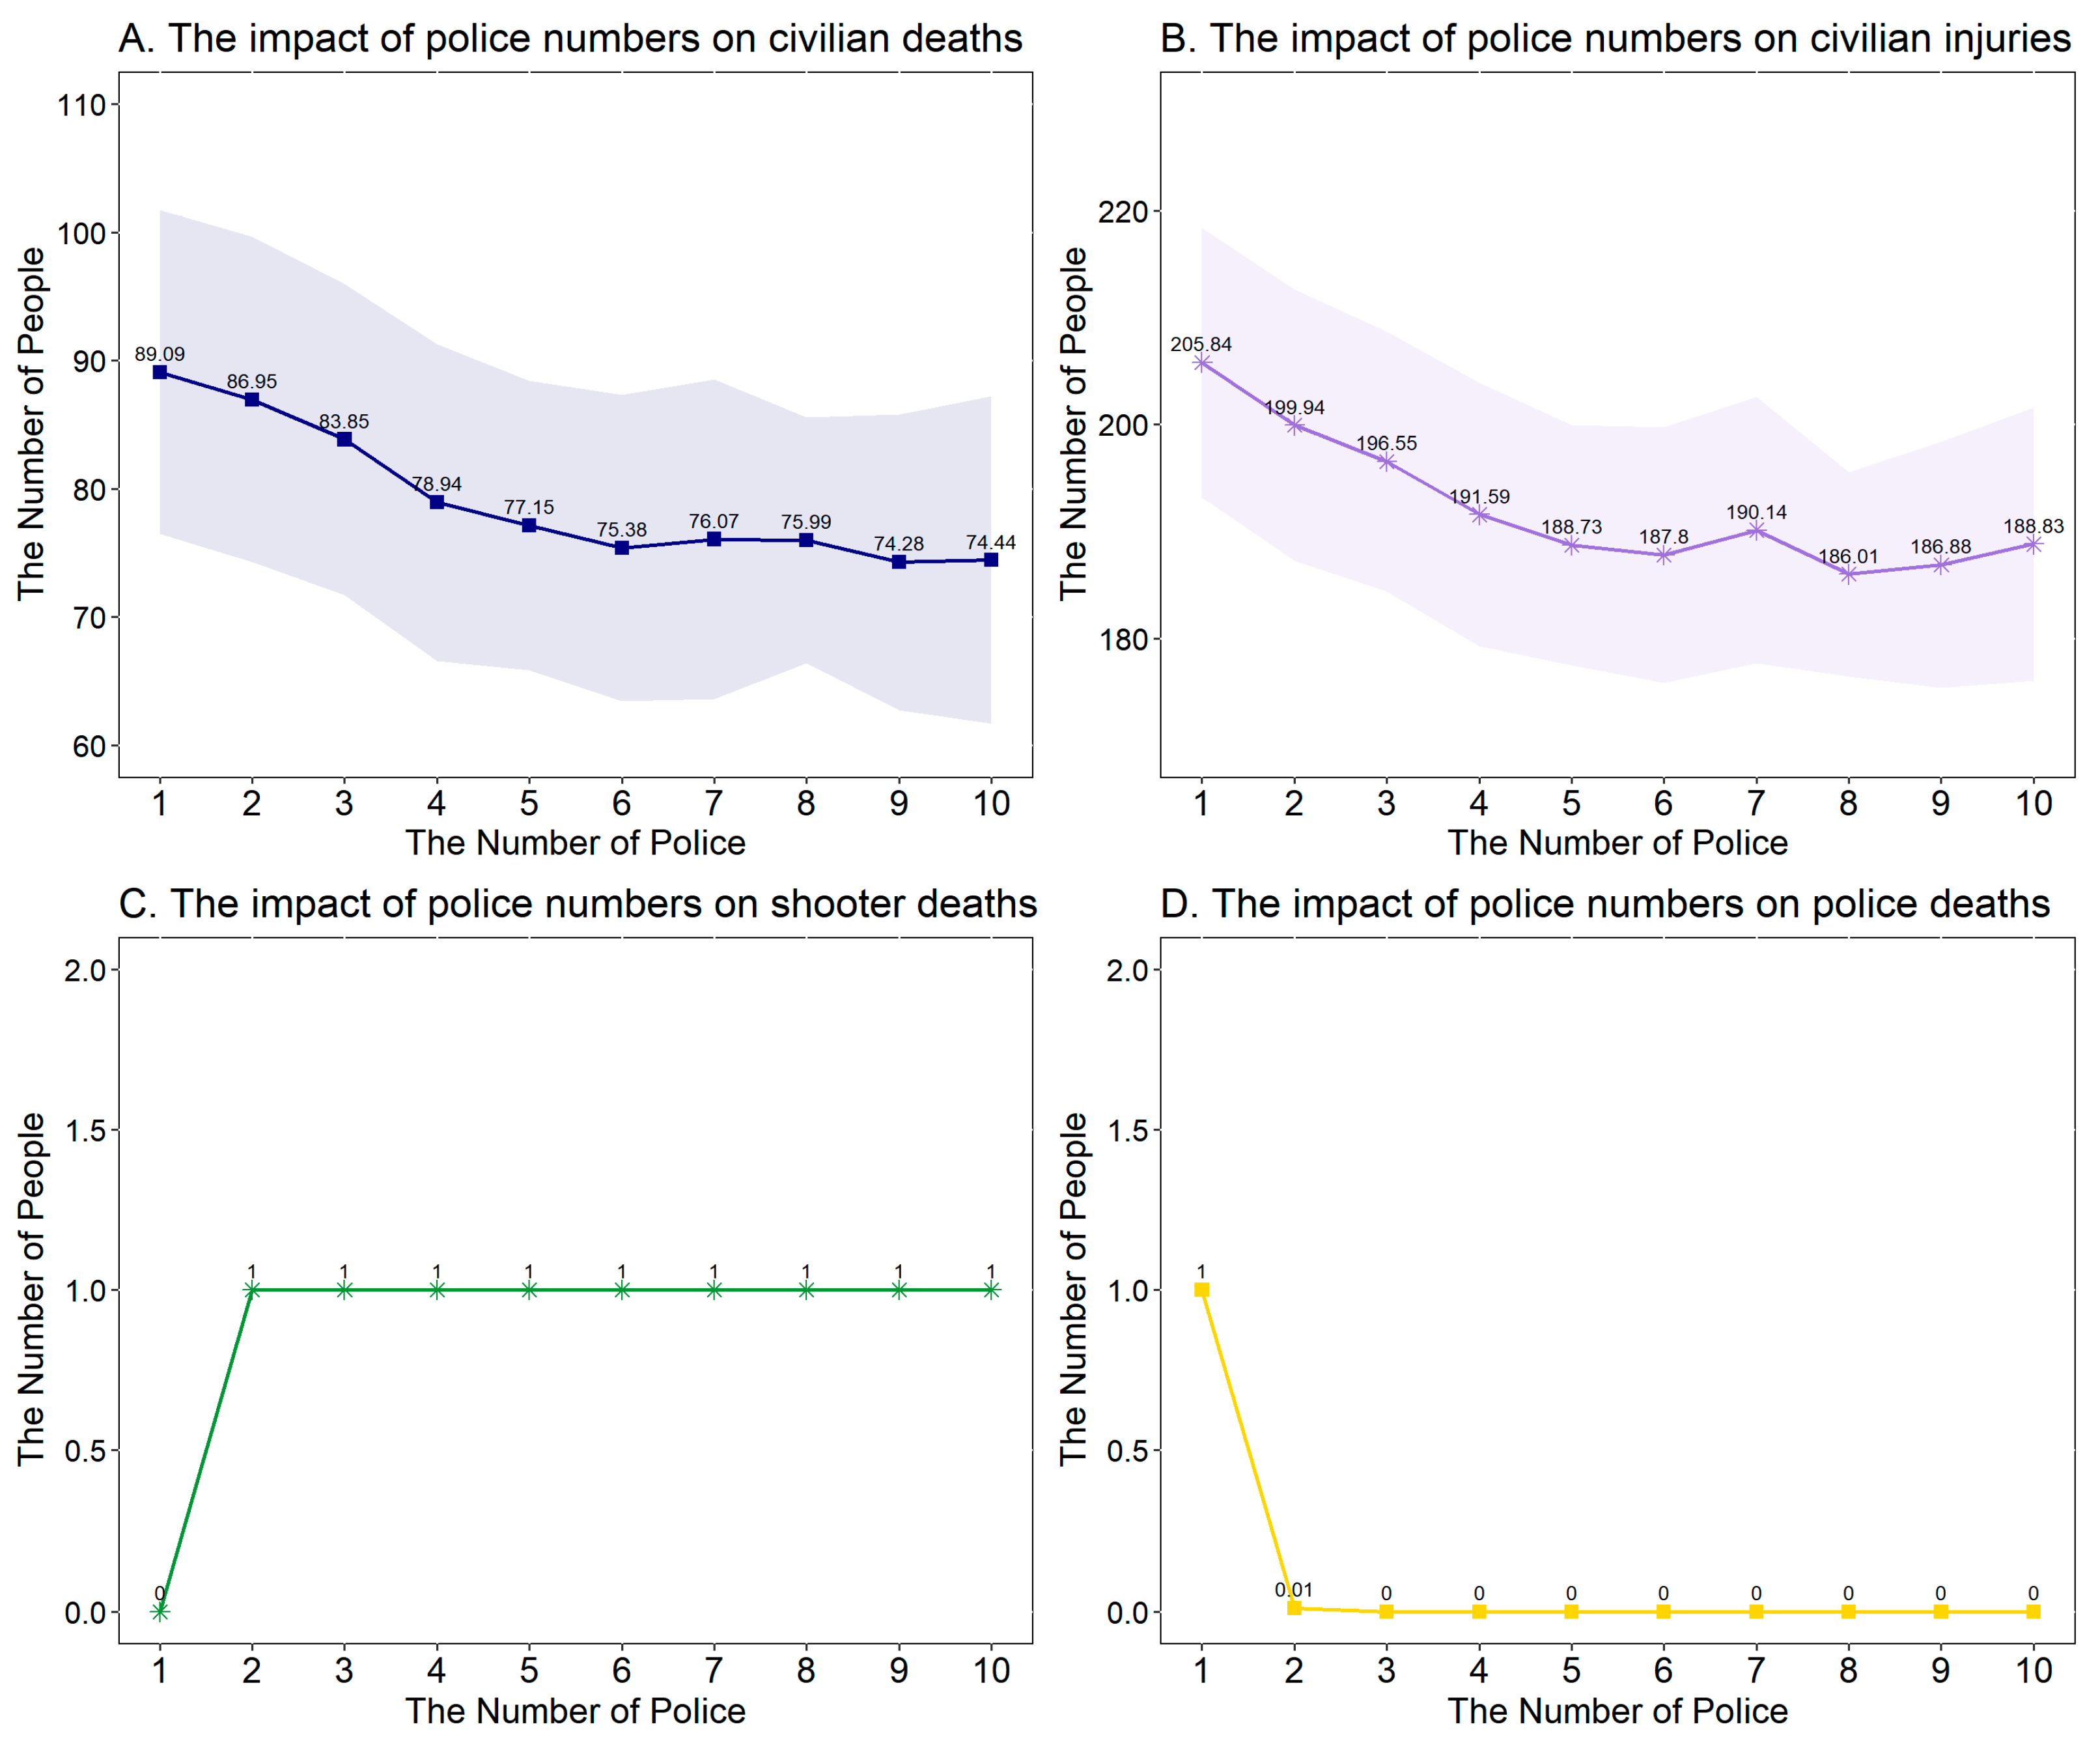
4.2. The Optimal Number of Police

We examined the impact of varying police numbers on the shooting incident based on the two combinations of optimal solution parameters. Figure 6A,B show the changes in civilian deaths and injuries, respectively, as the number of police increased. In general, the number of civilian deaths and injuries decreased with an increase in the number of police. The key point was four police. When the number of police increased from 1 to 4, civilian fatalities and injuries declined significantly. Subsequently, the number of civilian injuries and deaths leveled off. As the number of police officers rose from 1 to 4, civilian casualties decreased from 89.09 (SD = 8.14) to 78.94 (SD = 9.45). Concurrently, the number of civilian injuries decreased from 205.84 (SD = 12.62) to 191.59 (SD = 12.34). Moreover, when the number of police exceeded four, the number of civilian deaths and injuries did not decrease substantially. When the number of police was 10, the number of civilian deaths was 74.44 (SD = 6.93) and the number of civilian injuries was 188.83 (SD = 12.75). Therefore, considering police savings and the reduction of civilian casualties, the optimal police number was four when dealing with three shooters. Figure 6C,D depict the changes in shooter and police deaths as the number of police increased, respectively. In the real case, the police began negotiations with the remaining two shooters after shooting one down, with no more civilians being killed or wounded. In the model, the simulation stopped once a shooter was killed; thus, the maximum number of shooter deaths was 1. Figure 6C,D demonstrate that two police officers could kill a shooter, but if there was only one officer, that officer was killed, which was dangerous for the police officers, even with a 95% defense probability. Hence, the police needed to fight against terrorism jointly. Overall, the best number for police intervention was four police officers, which effectively reduced civilian deaths and injuries while preventing the police from being in extreme danger. Additionally, this achieved high social security returns with relatively limited social resources. In reality, the more policemen there were, the higher the human resource costs for the police force. Therefore, what we aimed to determine was the minimum number of officers required to optimally reduce the risk of incidents, which we referred to as the optimal number of policemen. We clearly calculated the impact of police presence on the outcome of the event. We identified that the optimal number of policemen was four as this could greatly reduce both the number of deaths and injuries. This finding is significant for resource allocation and police anti-terrorism strategies as it helps avoid the wasteful deployment of forces while effectively reducing the risk of incidents.

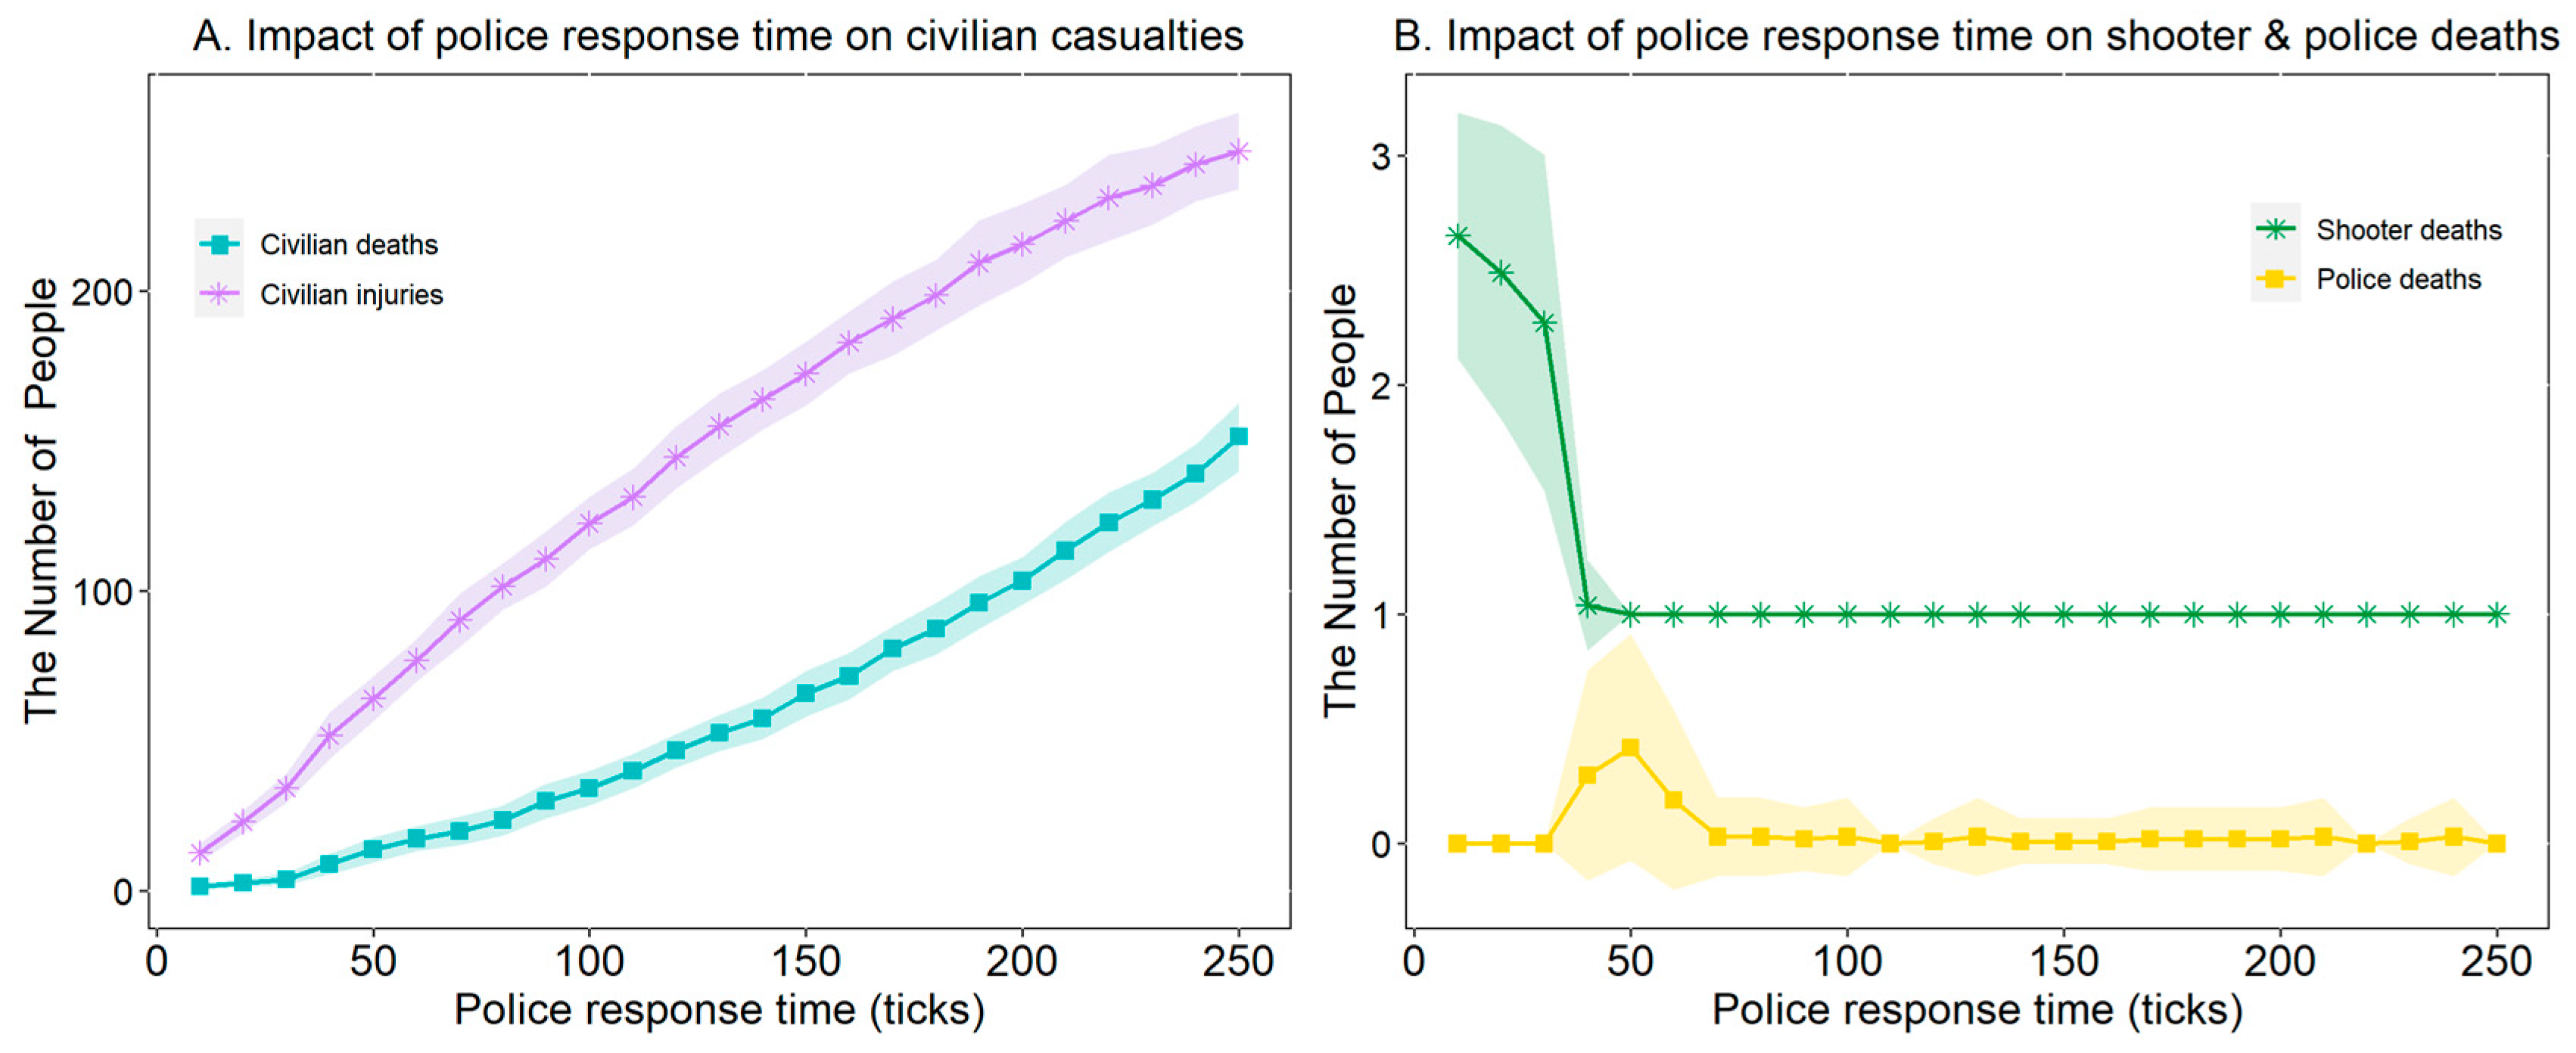
4.3. Police Response Time

Having assessed the impact of police numbers on terrorist attacks, we tried to determine the effect of police response time on the entire incident. We set the police response time to range from 10 to 250 in increments of 10. The simulation results are presented in Figure 7.
Figure 7A shows the impact of police response time on the number of civilian deaths under the optimal solution. The arrival of the police confronted the shooters and attracted their firepower. The longer the police response time, the more civilians suffered from shots, trampling, and collisions, which consequently led to civilian deaths. Therefore, under the optimal solution, the number of civilian injuries and deaths increased as the police response time lengthened. As the police response time increased, the number of civilian casualties showed a concave growth. Moreover, the later the police arrived, the more civilians fled, which reduced the population density and lowered the probability of stampedes and collisions, thereby declining the number of newly occurring civilian injuries. Hence, the number of civilian injuries showed a convex curve growth, indicating that the increase in civilian injuries gradually slowed down as the police response time rose.
Figure 7B depicts the impact of police response time on shooter and police deaths under the optimal solution. The later the police arrived, the fewer shooters died. The key time point was 40 ticks. The shooter death toll declined from 3 to 1 when the police response time increased to 40 ticks and then remained 1 after 40 ticks. Before 40 ticks, the shooters had just attacked civilians and had not made a good formation. After 40 ticks, for the police, shooting the two shooters on the second floor was more difficult than hitting the shooter on the stage. In addition, when the police response time was between 30 and 70 ticks, there was a certain probability of death, and the peak was at 50 ticks. During this period, the shooters deployed themselves. The police could not effectively target the shooters because two shooters had reached the second floor with a good cover and shooting angle. In contrast, the shooters on the second floor could hit the police, eventually resulting in police fatalities. When the police arrived after 70 ticks, the two shooters upstairs were at a certain distance from the entrance. This distance might have led to their low hit rate on the police. Then, the police successfully killed the shooter on the stage and eliminated the threat.
Undoubtedly, the earlier the police arrived, the safer the civilians were, and the fewer civilian injuries and deaths. However, due to the necessary reaction time, it was almost impossible for police to reach the scene at the beginning of the shooting incident. In light of the casualties of civilians, shooters, and police, the best time for the police to intervene was 30 ticks. At this time, the number of shooter deaths exceeded 2, the number of police deaths was close to 0, and civilian casualties were relatively low.

5. Conclusions and Discussions

The mass shooting resulted in significant casualties. Due to the complexity of buildings, capturing crowd dynamics during mass shooting incidents is particularly challenging. Therefore, it is necessary to study crowd dynamics and the key mechanisms of mass shooting incidents and identify more effective police counter-terrorism strategies and optimized building design solutions to help mitigate the harm caused by terrorist attacks. These measures ultimately enhance urban safety. We used an ABM with three classes of agents (civilians, shooters, and police) to model the crowd dynamics during the shooting incident. We drew several conclusions:
(a) Basic laws and regulations inside buildings can be revealed. According to the real target case, we modeled the design of a double-layer building. We considered the impact of indoor double-layer buildings. In the building, the internal three-dimensional structure affected the crowd dynamics and interactions between policemen, civilians, and shooters. It seems that the stairs increased the probability of trampling and collision for civilians, and the railings on the second floor hindered policemen from fighting against terrorism. We simulated the dynamic process to match the real results. On this basis, two combinations of optimal solutions were obtained. We also simulated counterfactual situations, which favored social governance and public management.
(b) The optimal solution supports our model. The existence of an optimal solution verified the ability of the model to match the real case. In this study, we obtained combinations of optimal solutions. The numbers of civilian deaths and injuries, police deaths, and shooter deaths were well matched. Under each unique combination of parameter values, we ran 1000 repeated simulations. Based on the optimal solution, we obtained the distribution (N = 1000), which supported both the validity (effectiveness) and the robustness of our model. Additionally, we further used an ANN to detect the predictive stability of the ABM model’s input parameters. Therefore, we found key indicators or factors to understand the behavior rules and crowd dynamics of civilians in a mass shooting situation. Thus, our model revealed key behavior patterns of individuals.
(c) An effective reconstruction plan for building exits can be identified through counterfactual inference. The exit is the life passage for civilians to escape. In complex buildings, the location and number of exits greatly affect the results. We added 1 to 3 exits based on real-world cases. Our counterfactual simulations showed that the strategic placement of exits significantly improved evacuation outcomes. Distributing exits evenly on both the first and second floors maximized safety, with second-floor exits proving more effective than eliminating blind corners on the first floor. Additionally, placing new exits farther apart from existing ones further reduced crowd congestion. These findings provide valuable guidance for building design and renovation, suggesting that even with cost constraints, optimizing exit distribution can significantly enhance public safety during emergencies.
(d) The best anti-terrorism scale can be found in counterfactual simulations. Mass shootings often cause vast casualties, so the anti-terrorism force (police) is particularly critical to protect civilians and reduce deaths. Our simulation suggests that having more police increases the risk of death for shooters. Given the limited administrative resources within the police system, it is important to calculate the optimal scale of anti-terrorism forces. Our optimal solution indicates that the optimal anti-terrorism scale is four policemen. From the perspective of social governance, our model can assist in formulating reasonable police counter-terrorism strategies within the constraints of limited resources. This approach not only prevents the waste of police forces but also effectively reduces the risks associated with crisis situations.
(e) Optimal response times can be obtained by counterfactual simulations. Response time refers to the duration from the start of an event to the time the police arrive and reflects the response speed of the police. The shorter the response time, the better the results of the shooting (civilian deaths and injuries are lower and more shooter deaths are seen). Nevertheless, it is inevitable that the response time of police takes a certain amount of time. In our simulation, the optimal response time was 30 ticks to arrive. This finding has real-world significance for establishing urban police patrols and police post locations in cities.
The simulations and analyses presented in this study are intended solely for improving civil emergency preparedness and public safety. This research does not advocate or support any military or offensive applications and adheres to the ethical principles of responsible scientific conduct and the peaceful use of knowledge. It should be noted that our discussion and research on terrorist attack patterns and police response strategies are aimed at better assisting the formulation of policies to resist terrorist attacks, preventing terrorist attacks and reducing harm to maintain urban public safety. Similar research has already contributed to the development of anti-terrorism and emergency response policies worldwide. Importantly, our findings demonstrate that police forces can adopt optimal and resource-efficient strategies to effectively mitigate the impact of attacks, which may serve as a deterrent and strengthen public safety. These insights are aimed at strengthening civil defense systems, not promoting violence or offensive technologies.
Future work could explore several directions. First, the impact of different shooter motivations, such as lone wolf attacks, suicides, or political motives, on the dynamics of both the attack and the response could be investigated. Understanding how these varying motivations influence behavior would provide valuable insights into the complexity of such events. Second, the proposed model could be applied to multiple case studies to further validate its robustness and generalizability. By extending the model to different scenarios, we can better assess its predictive accuracy and applicability in real-world settings.

Author Contributions

Conceptualization, Formal analysis, Writing—original draft, D.C.; Methodology, Investigation, P.L. (Peng Lu); Data curation, Validation, Y.N.; Visualization, Software, Supervision, P.L. (Pengfei Lv). All authors have read and agreed to the published version of the manuscript.

Funding

This work was supported by the National Social Science Foundation of China (grant no. 23&ZDA80), Wuhan East Lake High-Tech Development Zone (also known as the Optics Valley of China or OVC) National Comprehensive Experimental Base for Governance of Intelligent Society Project, and the Fundamental Research Funds for the Central Universities of Central South University (grant no. 1053320230988).

Data Availability Statement

Data will be made available upon request.

Conflicts of Interest

The authors declare no conflicts of interest.

References

  1. Abba-Aji, M.; Koya, S.F.; Abdalla, S.M.; Ettman, C.K.; Cohen, G.H.; Galea, S. The mental health consequences of interpersonal gun violence: A systematic review. SSM-Ment. Health 2024, 5, 100302. [Google Scholar] [CrossRef]
  2. The Gun Violence Archive. GVA-10 Year Review. January 2025. Available online: https://www.gunviolencearchive.org/query/14c00d51-0b8d-4dd6-a71e-0caa61f54155 (accessed on 22 March 2025).
  3. Weigend Vargas, E.; Degli Esposti, M.; Hargarten, S.; Vargas, L.; Goldstick, J.E. Examining firearm-related deaths in Mexico, 2015–2022. Inj. Epidemiol. 2024, 11, 33. [Google Scholar] [CrossRef] [PubMed]
  4. Schneider, R. Fewer guns, less crime: Evidence from Brazil. Econ. Policy 2021, 36, 287–323. [Google Scholar] [CrossRef]
  5. Toigo, S.; Pollock, N.J.; Liu, L.; Contreras, G.; McFaull, S.R.; Thompson, W. Fatal and non-fatal firearm-related injuries in Canada, 2016–2020: A population-based study using three administrative databases. Inj. Epidemiol. 2023, 10, 10. [Google Scholar] [CrossRef]
  6. McPhedran, S. Australian mass shootings: An analysis of incidents and offenders. J. Interpers. Violence 2020, 35, 3939–3962. [Google Scholar] [CrossRef]
  7. Navsaria, P.H.; Nicol, A.J.; Parry, C.D.H.; Matzopoulos, R.; Maqungo, S.; Gaudin, R. The effect of lockdown on intentional and non-intentional injury during the COVID-19 pandemic in Cape Town, South Africa: A preliminary report. S. Afr. Med. J. 2021, 111, 110–113. [Google Scholar] [CrossRef]
  8. World Population Review. Available online: https://worldpopulationreview.com/country-rankings/gun-deaths-by-country (accessed on 22 March 2025).
  9. Federal Bureau of Investigation. 2000 to 2018 Active Shooter Incidents. June 2019. Available online: https://www.fbi.gov/file-repository/active-shooter-incidents-2000-2018.pdf/view (accessed on 12 November 2024).
  10. Gammell, S.P.; Connell, N.M.; Huskey, M.G. A descriptive analysis of the characteristics of school shootings across five decades. Am. J. Crim. Justice 2022, 47, 818–835. [Google Scholar] [CrossRef]
  11. Keenan, K.; Greene, A. Whiteness or resilience? Placing terror by studying the Charleston, South Carolina mother Emanuel church shooting. Urban Geogr. 2019, 40, 104–127. [Google Scholar] [CrossRef]
  12. Capellan, J.A.; Silva, J.R. An investigation of mass public shooting attacks against government targets in the United States. Stud. Confl. Terror. 2021, 44, 387–409. [Google Scholar] [CrossRef]
  13. Wang, D.; Yang, Y.; Zhou, T.; Yang, F. An investigation of fire evacuation performance in irregular underground commercial building affected by multiple parameters. J. Build. Eng. 2021, 37, 102146. [Google Scholar] [CrossRef]
  14. Xie, W.; Lee, E.W.M.; Li, T.; Shi, M.; Cao, R.; Zhang, Y. A study of group effects in pedestrian crowd evacuation: Experiments, modelling and simulation. Saf. Sci. 2021, 133, 105029. [Google Scholar] [CrossRef]
  15. Zhang, R.; Liu, D.; Du, E.; Xiong, L.; Chen, J.; Chen, H. An agent-based model to simulate human responses to flash flood warnings for improving evacuation performance. J. Hydrol. 2024, 628, 130452. [Google Scholar] [CrossRef]
  16. Siam, M.R.K.; Wang, H.; Lindell, M.K.; Chen, C.; Vlahogianni, E.I.; Axhausen, K. An interdisciplinary agent-based multimodal wildfire evacuation model: Critical decisions and life safety. Transp. Res. Part D Transp. Environ. 2022, 103, 103147. [Google Scholar] [CrossRef]
  17. Bain, N.; Bartolo, D. Dynamic response and hydrodynamics of polarized crowds. Science 2019, 363, 46–49. [Google Scholar] [CrossRef]
  18. Senanayake, G.P.; Kieu, M.; Zou, Y.; Dirks, K. Agent-based simulation for pedestrian evacuation: A systematic literature review. Int. J. Disaster Risk Reduct. 2024, 111, 104705. [Google Scholar] [CrossRef]
  19. Khamis, N.; Selamat, H.; Ismail, F.S.; Lutfy, O.F.; Haniff, M.F.; Nordin, I.N.A.M. Optimized exit door locations for a safer emergency evacuation using crowd evacuation model and artificial bee colony optimization. Chaos Solitons Fractals 2020, 131, 109505. [Google Scholar] [CrossRef]
  20. Ren, J.; Mao, Z.; Gong, M.; Zuo, S. Modified social force model considering emotional contagion for crowd evacuation simulation. Int. J. Disaster Risk Reduct. 2023, 96, 103902. [Google Scholar] [CrossRef]
  21. Liang, H.; Lee, S.; Sun, J.; Wong, S.C. Unraveling the causes of the Seoul Halloween crowd-crush disaster. PLoS ONE 2024, 19, e0306764. [Google Scholar] [CrossRef]
  22. Arteaga, C.; Park, J. Building design and its effect on evacuation efficiency and casualty levels during an indoor active shooter incident. Saf. Sci. 2020, 127, 104692. [Google Scholar] [CrossRef]
  23. Young, E.; Aguirre, B. PrioritEvac: An agent-based model (ABM) for examining social factors of building fire evacuation. Inf. Syst. Front. 2021, 23, 1083–1096. [Google Scholar] [CrossRef]
  24. Hassanpour, S.; Gonzalez, V.; Liu, J.; Zou, Y.; Cabrera-Guerrero, G. A hybrid hierarchical agent-based simulation approach for buildings indoor layout evaluation based on the post-earthquake evacuation. Adv. Eng. Inform. 2022, 51, 101531. [Google Scholar] [CrossRef]
  25. Cotfas, L.A.; Delcea, C.; Iancu, L.D.; Ioanăş, C.; Ponsiglione, C. Large event halls evacuation using an agent-based modeling approach. IEEE Access 2022, 10, 49359–49384. [Google Scholar] [CrossRef]
  26. Grajdura, S.; Borjigin, S.; Niemeier, D. Fast-moving dire wildfire evacuation simulation. Transp. Res. Part D Transp. Environ. 2022, 104, 103190. [Google Scholar] [CrossRef]
  27. Saeed, R.A.; Recupero, D.R.; Remagnino, P. Simulating crowd behaviour combining both microscopic and macroscopic rules. Inf. Sci. 2022, 583, 137–158. [Google Scholar] [CrossRef]
  28. Lancel, S.; Chapurlat, V.; Dray, G.; Martin, S. Emergency evacuation in a supermarket during a terrorist attack: Towards a possible modelling of the influence of affordances on the evacuation behavior of agents in a complex virtual environment. J. Saf. Sci. Resil. 2023, 4, 139–150. [Google Scholar] [CrossRef]
  29. Keykhaei, M.; Samany, N.N.; Jelokhani-Niaraki, M.; Zlatanova, S. Multi-agent-based human cognition simulation of Situation-aware earthquake emergency evacuation. Int. J. Disaster Risk Reduct. 2024, 100, 104183. [Google Scholar] [CrossRef]
  30. Kapadia, K.; Yongsatianchot, N.; Marsella, S.; John, R. Integrating Actual Human Behavior into an Agent-Based School Shooting Simulation. In Proceedings of the 2024 Winter Simulation Conference (WSC), Orlando, FL, USA, 15–18 December 2024; IEEE: Piscataway, NJ, USA, 2024; pp. 2094–2105. [Google Scholar]
  31. Liu, R.; Fu, Z.; Schadschneider, A.; Wen, Q.; Chen, J.; Liu, S. Modeling the effect of visibility on upstairs crowd evacuation by a stochastic FFCA model with finer discretization. Phys. A Stat. Mech. Its Appl. 2019, 531, 121723. [Google Scholar] [CrossRef]
  32. Li, Z. Pedestrian evacuation within limited-space buildings based on different exit design schemes. Saf. Sci. 2020, 124, 104575. [Google Scholar] [CrossRef]
  33. Berseth, G.; Usman, M.; Haworth, B.; Kapadia, M.; Faloutsos, P. Environment optimization for crowd evacuation. Comput. Animat. Virtual Worlds 2015, 26, 377–386. [Google Scholar] [CrossRef]
  34. Zhu, Y.; Chen, T.; Ding, N.; Chraibi, M.; Fan, W.C. Follow the evacuation signs or surrounding people during building evacuation, an experimental study. Phys. A Stat. Mech. Its Appl. 2020, 560, 125156. [Google Scholar] [CrossRef]
  35. Ding, N. The effectiveness of evacuation signs in buildings based on eye tracking experiment. Nat. Hazards 2020, 103, 1201–1218. [Google Scholar] [CrossRef]
  36. Zhou, M.; Dong, H.; Wang, X.; Hu, X.; Ge, S. Modeling and simulation of crowd evacuation with signs at subway platform: A case study of Beijing subway stations. IEEE Trans. Intell. Transp. Syst. 2020, 23, 1492–1504. [Google Scholar] [CrossRef]
  37. Helbing, D.; Molnar, P. Social force model for pedestrian dynamics. Phys. Rev. E 1995, 51, 4282. [Google Scholar] [CrossRef] [PubMed]
  38. Helbing, D.; Farkas, I.; Vicsek, T. Simulating dynamical features of escape panic. Nature 2000, 407, 487–490. [Google Scholar] [CrossRef]
  39. Lu, X.; Astur, R.; Gifford, T. Effects of gunfire location information and guidance on improving survival in virtual mass shooting events. Int. J. Disaster Risk Reduct. 2021, 64, 102505. [Google Scholar] [CrossRef]
  40. Mittal, V.; Evangelista, P.F. Accounting for Individual Shooting Skills in Combat Models. In 2023 Winter Simulation Conference (WSC); IEEE: Piscataway, NJ, USA, 2023; pp. 2379–2390. [Google Scholar]
  41. Marufuzzaman, M.; Aghalari, A.; Ranta, J.H.; Jaradat, R. Optimizing civilian response strategy under an active shooting incident. IEEE Syst. J. 2021, 15, 4804–4815. [Google Scholar] [CrossRef]
  42. Carson, J.V.; Dugan, L.; Yang, S.M. A comprehensive application of rational choice theory: How costs imposed by, and benefits derived from, the US federal government affect incidents perpetrated by the radical eco-movement. J. Quant. Criminol. 2020, 36, 701–724. [Google Scholar] [CrossRef]
  43. Dugan, L.; LaFree, G.; Piquero, A.R. Testing a rational choice model of airline hijackings. Criminology 2005, 43, 1031–1065. [Google Scholar] [CrossRef]
  44. Arce, D.G.; Sandler, T. Terrorist signalling and the value of intelligence. Br. J. Political Sci. 2007, 37, 573–586. [Google Scholar] [CrossRef]
  45. Lu, P.; Li, Y.; Wen, F.; Chen, D. Agent-based modeling of mass shooting case with the counterforce of policemen. Complex Intell. Syst. 2023, 9, 5093–5113. [Google Scholar] [CrossRef]
  46. Liu, W.; Taylor, B. The effect of body armor on saving officers’ lives: An analysis using LEOKA data. J. Occup. Environ. Hyg. 2017, 14, 73–80. [Google Scholar] [CrossRef] [PubMed]
  47. Phillips, S.W. Police response to active shooter events: How officers see their role. Police Q. 2020, 23, 262–279. [Google Scholar] [CrossRef]
  48. Gibbs, J.C. Terrorist attacks targeting police, 1998–2010: Exploring heavily hit countries. Int. Crim. Justice Rev. 2020, 30, 261–278. [Google Scholar] [CrossRef]
  49. Wurzer, G.; Kowarik, K.; Reschreiter, H. (Eds.) Agent-Based Modeling and Simulation in Archaeology; Springer International Publishing: Cham, Switzerland, 2015. [Google Scholar]
  50. Owaidah, A.; Olaru, D.; Bennamoun, M.; Sohel, F.; Khan, N. Review of modelling and simulating crowds at mass gathering events: Hajj as a case study. J. Artif. Soc. Soc. Simul. 2019, 22, 1–36. [Google Scholar] [CrossRef]
  51. Bandini, S.; Manzoni, S.; Vizzari, G. Agent based modeling and simulation: An informatics perspective. J. Artif. Soc. Soc. Simul. 2009, 12, 4. [Google Scholar]
  52. Jadbabaie, A.; Molavi, P.; Tahbaz-Salehi, A. Information heterogeneity and the speed of learning in social networks. Writ. Technol. eJournal 2013, 91, 2266979. [Google Scholar] [CrossRef]
  53. Kowalska-Pyzalska, A. Willingess to pay for green energy: An agent-based model in NetLogo platform. In Proceedings of the 2017 14th International Conference on the European Energy Market (EEM), Dresden, Germany, 6–9 June 2017; IEEE: Piscataway, NJ, USA, 2017; pp. 1–6. [Google Scholar]
  54. Wang, Z.; Butner, J.D.; Kerketta, R.; Cristini, V.; Deisboeck, T.S. Simulating cancer growth with multiscale agent-based modeling. Semin. Cancer Biol. 2015, 30, 70–78. [Google Scholar] [CrossRef]
  55. Krogh, A. What are artificial neural networks? Nat. Biotechnol. 2008, 26, 195–197. [Google Scholar] [CrossRef]
  56. Wikipedia. November 2015 Paris Attacks. March 2025. Available online: https://en.wikipedia.org/wiki/November_2015_Paris_attacks (accessed on 12 March 2025).
  57. Wikipedia. Bataclan (Theatre). March 2025. Available online: https://en.wikipedia.org/wiki/Bataclan_(theatre) (accessed on 12 March 2025).
  58. Quarantelli, E.L. Panic behavior: Some empirical observations. In Proceedings of the American Institute of Architects Conference on Human Response to Tall Buildings, Chicago, IL, USA, 19 July 1975. [Google Scholar]
  59. Saloma, C.; Perez, G.J.; Tapang, G.; Lim, M.; Palmes-Saloma, C. Self-organized queuing and scale-free behavior in real escape panic. Proc. Natl. Acad. Sci. USA 2003, 100, 11947–11952. [Google Scholar] [CrossRef]
  60. Illiyas, F.T.; Mani, S.K.; Pradeepkumar, A.P.; Mohan, K. Human stampedes during religious festivals: A comparative review of mass gathering emergencies in India. Int. J. Disaster Risk Reduct. 2013, 5, 10–18. [Google Scholar] [CrossRef]
  61. Daoliang, Z.; Lizhong, Y.; Jian, L. Exit dynamics of occupant evacuation in an emergency. Phys. A Stat. Mech. Its Appl. 2006, 363, 501–511. [Google Scholar] [CrossRef]
  62. Cao, S.; Song, W.; Lv, W.; Fang, Z. A multi-grid model for pedestrian evacuation in a room without visibility. Phys. A Stat. Mech. Its Appl. 2015, 436, 45–61. [Google Scholar] [CrossRef]
  63. Rexstad, E.A.; Anderson, D.R. Heterogeneous survival rates of mallards (Anas platyrhynchos). Can. J. Zool. 1992, 70, 1878–1885. [Google Scholar] [CrossRef]
  64. Choi, S.; Fisman, R.; Gale, D.; Kariv, S. Consistency and heterogeneity of individual behavior under uncertainty. Am. Econ. Rev. 2007, 97, 1921–1938. [Google Scholar] [CrossRef]
  65. Richter, K.F.; Shi, M.; Gan, H.S.; Winter, S. Decentralized evacuation management. Transp. Res. Part C Emerg. Technol. 2013, 31, 1–17. [Google Scholar] [CrossRef]
  66. Yang, X.Y.; Hu, A.; Schieman, S. Relative deprivation in context: How contextual status homogeneity shapes the relationship between disadvantaged social status and health. Soc. Sci. Res. 2019, 81, 157–169. [Google Scholar] [CrossRef]
  67. Hu, A. Can Education Make Us Healthier? An Urban-Rural Comparative Analysis Based on the Chinese General Social Survey of 2010. Soc. Sci. China 2015, 36, 64–82. [Google Scholar]
  68. Ngo, E.B. Elderly people and disaster. In Handbook of Hazards and Disaster Risk Reduction; Routledge: London, UK, 2012; pp. 447–458. [Google Scholar]
  69. Lu, P.; Yang, H.; Li, H.; Li, M.; Zhang, Z. Swarm intelligence, social force and multi-agent modeling of heroic altruism behaviors under collective risks. Knowl.-Based Syst. 2021, 214, 106725. [Google Scholar] [CrossRef]
  70. LaFree, G.; Dugan, L.; Xie, M.; Singh, P. Spatial and temporal patterns of terrorist attacks by ETA 1970 to 2007. J. Quant. Criminol. 2012, 28, 7–29. [Google Scholar] [CrossRef]
  71. Wales, C.R.J. Zeroing in on Optics: Professional Firearm Optics Training for the Modern Shooter; FriesenPress: Altona, MB, Canada, 2023. [Google Scholar]
  72. Arteaga, C.; Park, J.; Morris, B.T.; Sharma, S. Effect of trained evacuation leaders on victims’ safety during an active shooter incident. Saf. Sci. 2023, 158, 105967. [Google Scholar] [CrossRef]
  73. Dasgupta, D. Artificial neural networks and artificial immune systems: Similarities and differences. In Proceedings of the 1997 IEEE International Conference on Systems, Man, and Cybernetics. Computational Cybernetics and Simulation, Orlando, FL, USA, 12–15 October 1997; IEEE: Piscataway, NJ, USA, 1997; Volume 1, pp. 873–878. [Google Scholar]
Figure 1. The real scene of the case and NetLogo modeling interface. Panel (A) displays the simulation interface in the NetLogo software. Panel (B) displays a schematic plan of the Bataclan Theater. Panel (C) depicts the occurrence and development of events at key time points.
Systems 13 00310 g001
Figure 2. Application of social force in pedestrian dynamics. Subfigure (a) shows the application of repulsive force in pedestrian dynamics. The action trajectory of pedestrian A reflects the repulsion of the environment (wall) to pedestrians, while the motion trajectories of pedestrians B and C reflect the repulsive force between agents. Subfigure (b) describes the application of attractive force in pedestrian dynamics. The motion trajectories of pedestrians D and E respectively reflect the attraction of stairs and exits to moving pedestrians.
Systems 13 00310 g002
Figure 3. The number of individuals in the 1000 simulation results under the optimal solution parameters. Panel (A) contrasts the number of civilian deaths between the real case and the simulation. Panel (B) contrasts the numbers of civilian injuries. Panel (C,D) contrast the numbers of shooter deaths and police deaths, respectively. In each panel, the mean, distribution, and error bars of the real case results and simulation results are shown separately. Simultaneously, Q−Q plots were utilized to test the distribution pattern of the 1000 simulations, aiming to verify whether they followed a normal distribution. The blue bar represents the real case, while the orange bar represents the simulation results.
Systems 13 00310 g003
Figure 4. Artificial neural network (ANN) construct and loss curve. Subfigure (A) is the ANN architecture used in this study and subfigure (B) is the loss curve of the training and validation results of the ANN model with 500 iterations.
Systems 13 00310 g004
Figure 5. Sizes and locations of possible exits. (A1) corresponds to the real case, the outcome of which is presented in the sketch map. Subfigures (B1) and (B2) to (H1) and (H2) explore counterfactual situations and their outcomes. The blue box marks the existing exits in the real case and the red box marks the new exits in the counterfactual situation.
Systems 13 00310 g005
Figure 6. The number of deaths or injuries fluctuated with the expansion of the police. (A,B) illustrate the civilian casualties with police numbers from 1 to 10 under the optimal solution. Subfigures (C,D) describe the change in the numbers of shooter and police deaths as police numbers increased from 1 to 10 under the optimal solution. The shaded region represents the range of the standard deviation of 100 simulation results.
Systems 13 00310 g006
Figure 7. Impact of police response time on results. Subfigure (A) illustrates the impact of police response time on civilian casualties under two combinations of the optimal solution. The blue line represents the number of civilian deaths and the purple line represents the number of civilian injuries. Subfigure (B) depicts the impact of police response time on the numbers of shooter and police deaths under two combinations of the optimal solution. The green line represents the number of shooter deaths, while the yellow line represents the number of police deaths. Data show the mean of 100 independent simulations. The upper and lower bounds of shadows are the standard deviations of the 100 simulation results.
Systems 13 00310 g007
Table 1. Comparison of recent existing evacuation models in the literature.
SourceMethodsApplication ScenariosMajor Contributions/FindingsDetection of Parameter of Predictive StabilityReal Case MatchingSoftware
Arteaga et al. (2020) [22]Social force model and ABMShooting incidentIncreasing hall and door widths can improve evacuation efficiency and safety.NoNoJava
Young et al. (2021) [23]ABMBuilding fire evacuationArchitectural design and evacuation planning should take into account human behavior.NoNoNetLogo
Hassanpour et al. (2022) [24]ABM and
reinforcement learning
EarthquakeProvided a simulation method for evaluating the performance of indoor building design based on human evacuation behavior.NoYesNetLogo 6.0.4
Cotfas et al. (2022) [25]ABMLarge-scale eventAn “adapted cone exit” can guide people towards the nearest exit.NoNoNetLogo 6.2.2
Grajdura et al. (2022) [26]ABMFireLonger evacuation times are linked to less smartphone use, more awareness delays, and fewer vehicle accesses.NoYesNetLogo
Saeed et al. (2022) [27]ABMVirtual environmentMode capable of simulating large numbers of pedestrians in complex environments.NoNoPython and
Autodesk Maya
Siam et al. (2022) [16]ABMWildfire evacuationThe separation of pedestrian and vehicle traffic can reduce mortality rates.NoYesNetLogo
Lancel et al. (2023) [28]Multi-agent systemsTerrorist attacksChanging environmental affordances alters participants’ decision-making.NoNoUnspecified
Keykhaei et al. (2024) [29]Multi-agent simulation and Bayesian inferenceEarthquakeHuman cognition of situation-aware emergency evacuation was simulated.YesNoNetLogo
Kapadia et al. (2024) [30]ABMCampus shootingMixed agent behavior and lower dispatch times had the greatest influence on casualties.NoNoNetLogo 6.4
Table 2. Terminology, initial parameter settings, parameter traversal range, and optimal solution value.
Terminology/Parameter (Unit)InterpretationsParameter Traversal Range (Step Size)Optimal Solution Value
The number of civilians (people)The size of the civilian group15001500
The number of terrorists (people)The size of the terrorist group33
Shooting damage (blood)The damage from each shooting50~70 (0.1)56.8
Perception radius (patches)How far the agents can see1~40 (1)5
Injured blood volume (%)The decrease in the proportion of civilians’ blood counts as injuries20~100 (1)%40%
Collision damage (blood)The blood loss of the
collision at one time
0~0.1 (0.01)0.05
Tumble probability (%)The probability that civilians fall0~10 (0.01)%0.04%
Police response time (ticks)The time when the police entered the scene5~400 (5)180
Number of police (people)The size of the police group22
Damage from police shootings (blood)The damage from police shooting0~100 (1)41
Distance of shooting (patches)How far the agents can shoot0~100 (1)40
Police defense (%)The defense ability of the police officers0~100 (5)%95%
Tramping damage (blood)When civilians fall and are trampled by civilians around them0~20 (1)10
Disclaimer/Publisher’s Note: The statements, opinions and data contained in all publications are solely those of the individual author(s) and contributor(s) and not of MDPI and/or the editor(s). MDPI and/or the editor(s) disclaim responsibility for any injury to people or property resulting from any ideas, methods, instructions or products referred to in the content.

