
Study on the Spatial Association Network Structure of Urban Digital Economy and Its Driving Factors in Chinese Cities

Abstract
:1. Introduction
2. Literature Review and Research Hypothesis
2.1. Research on the Development of Digital Economy
2.2. Research on the Driving Factors of Digital Economy
2.3. Research on the Digital Economy Spatial Association Network
3. Research Design
3.1. Research Methods
3.1.1. Modified Gravity Model
3.1.2. Social Network Analysis
3.1.3. QAP Analysis
3.2. Model Setting and Variable Selection
3.3. Data Sources and Explanation
4. Characteristics of the Spatial Association Network in the Chinese Urban Digital Economy
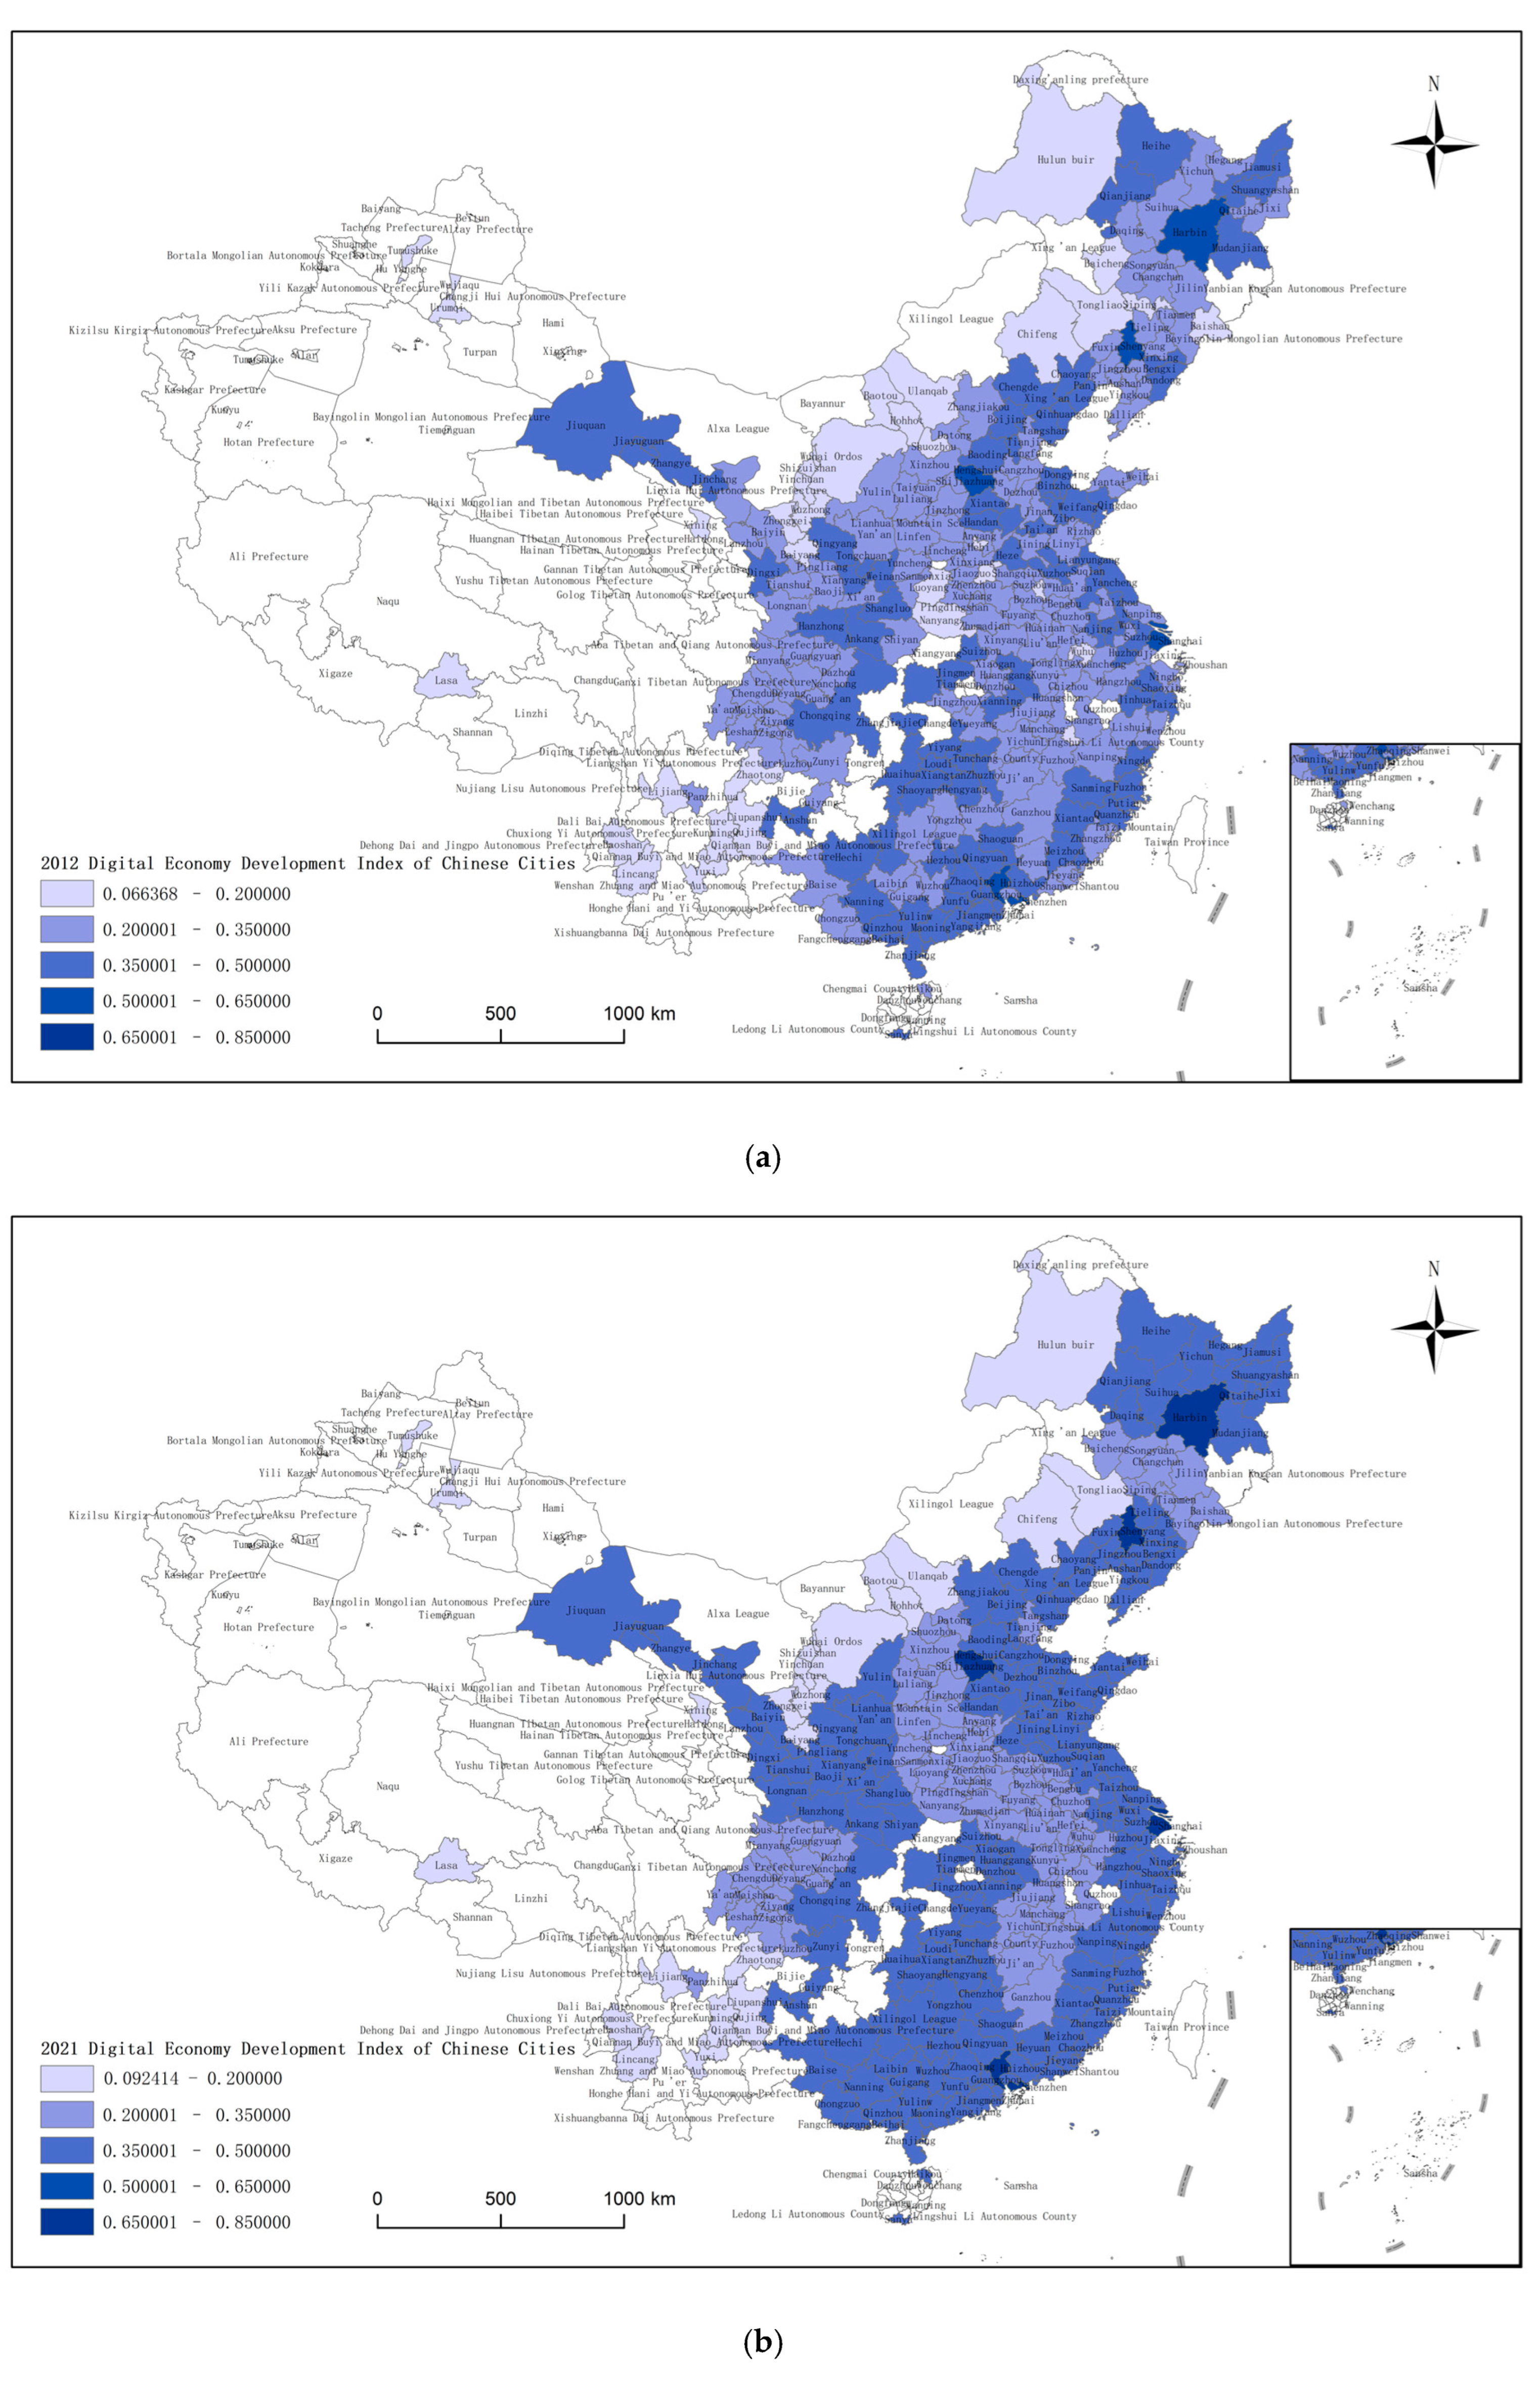
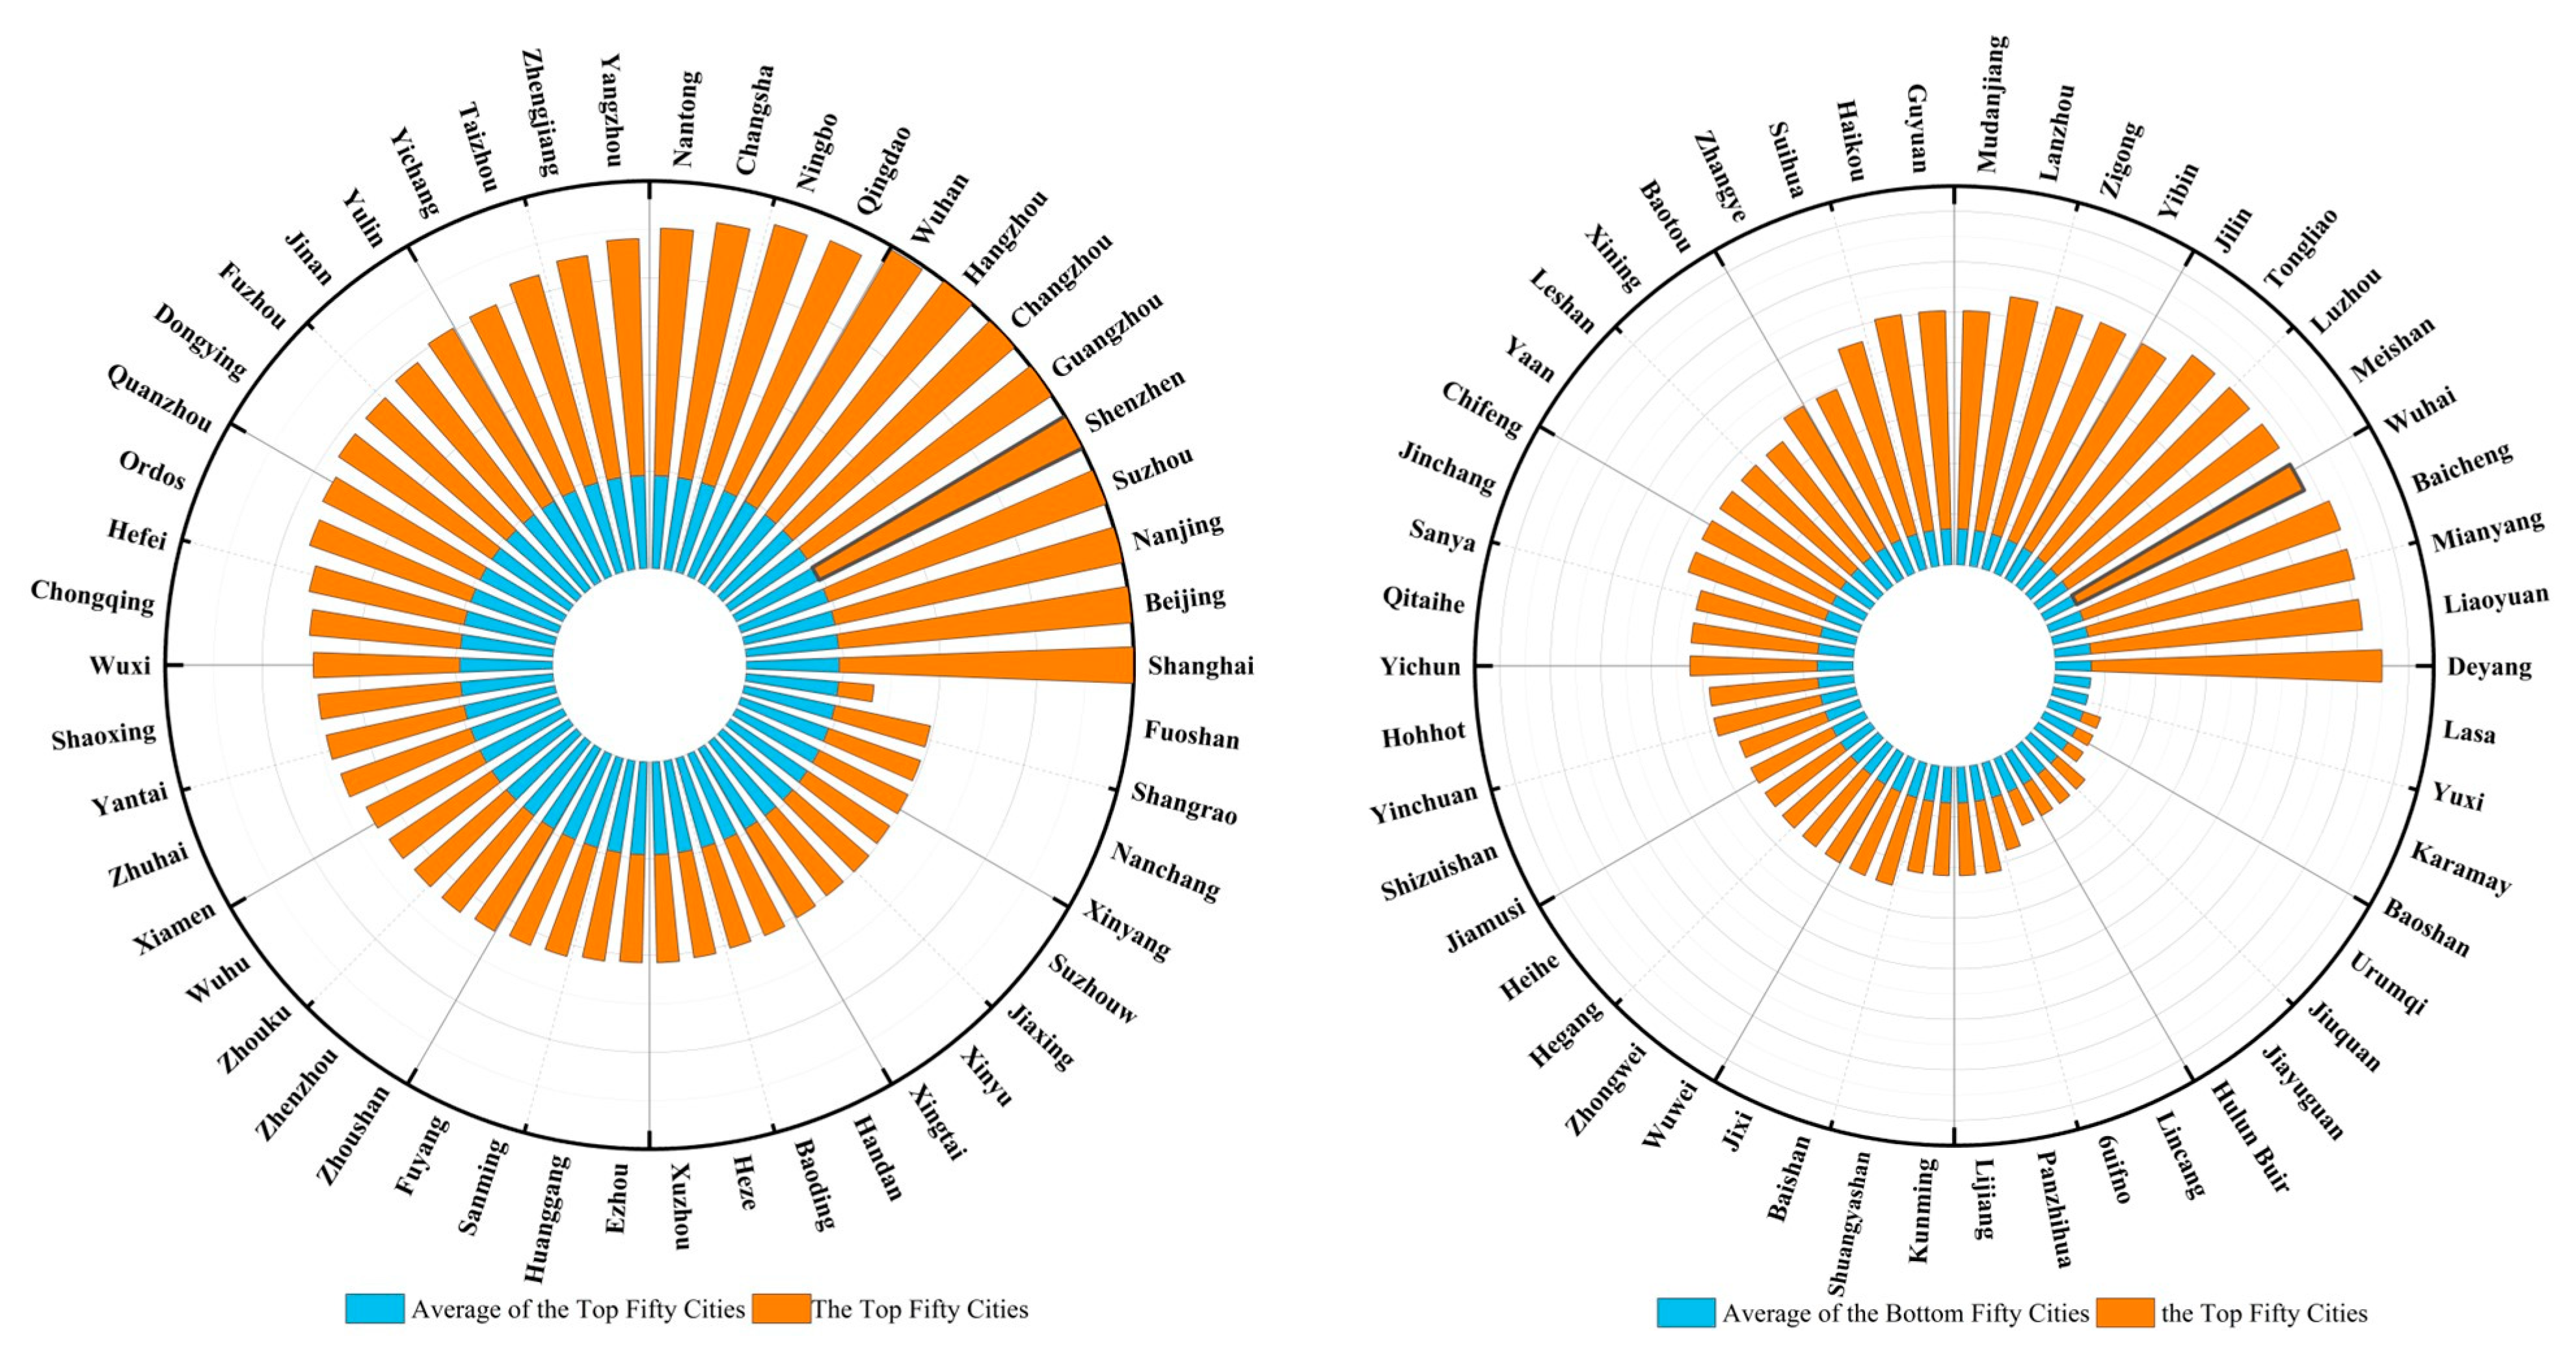
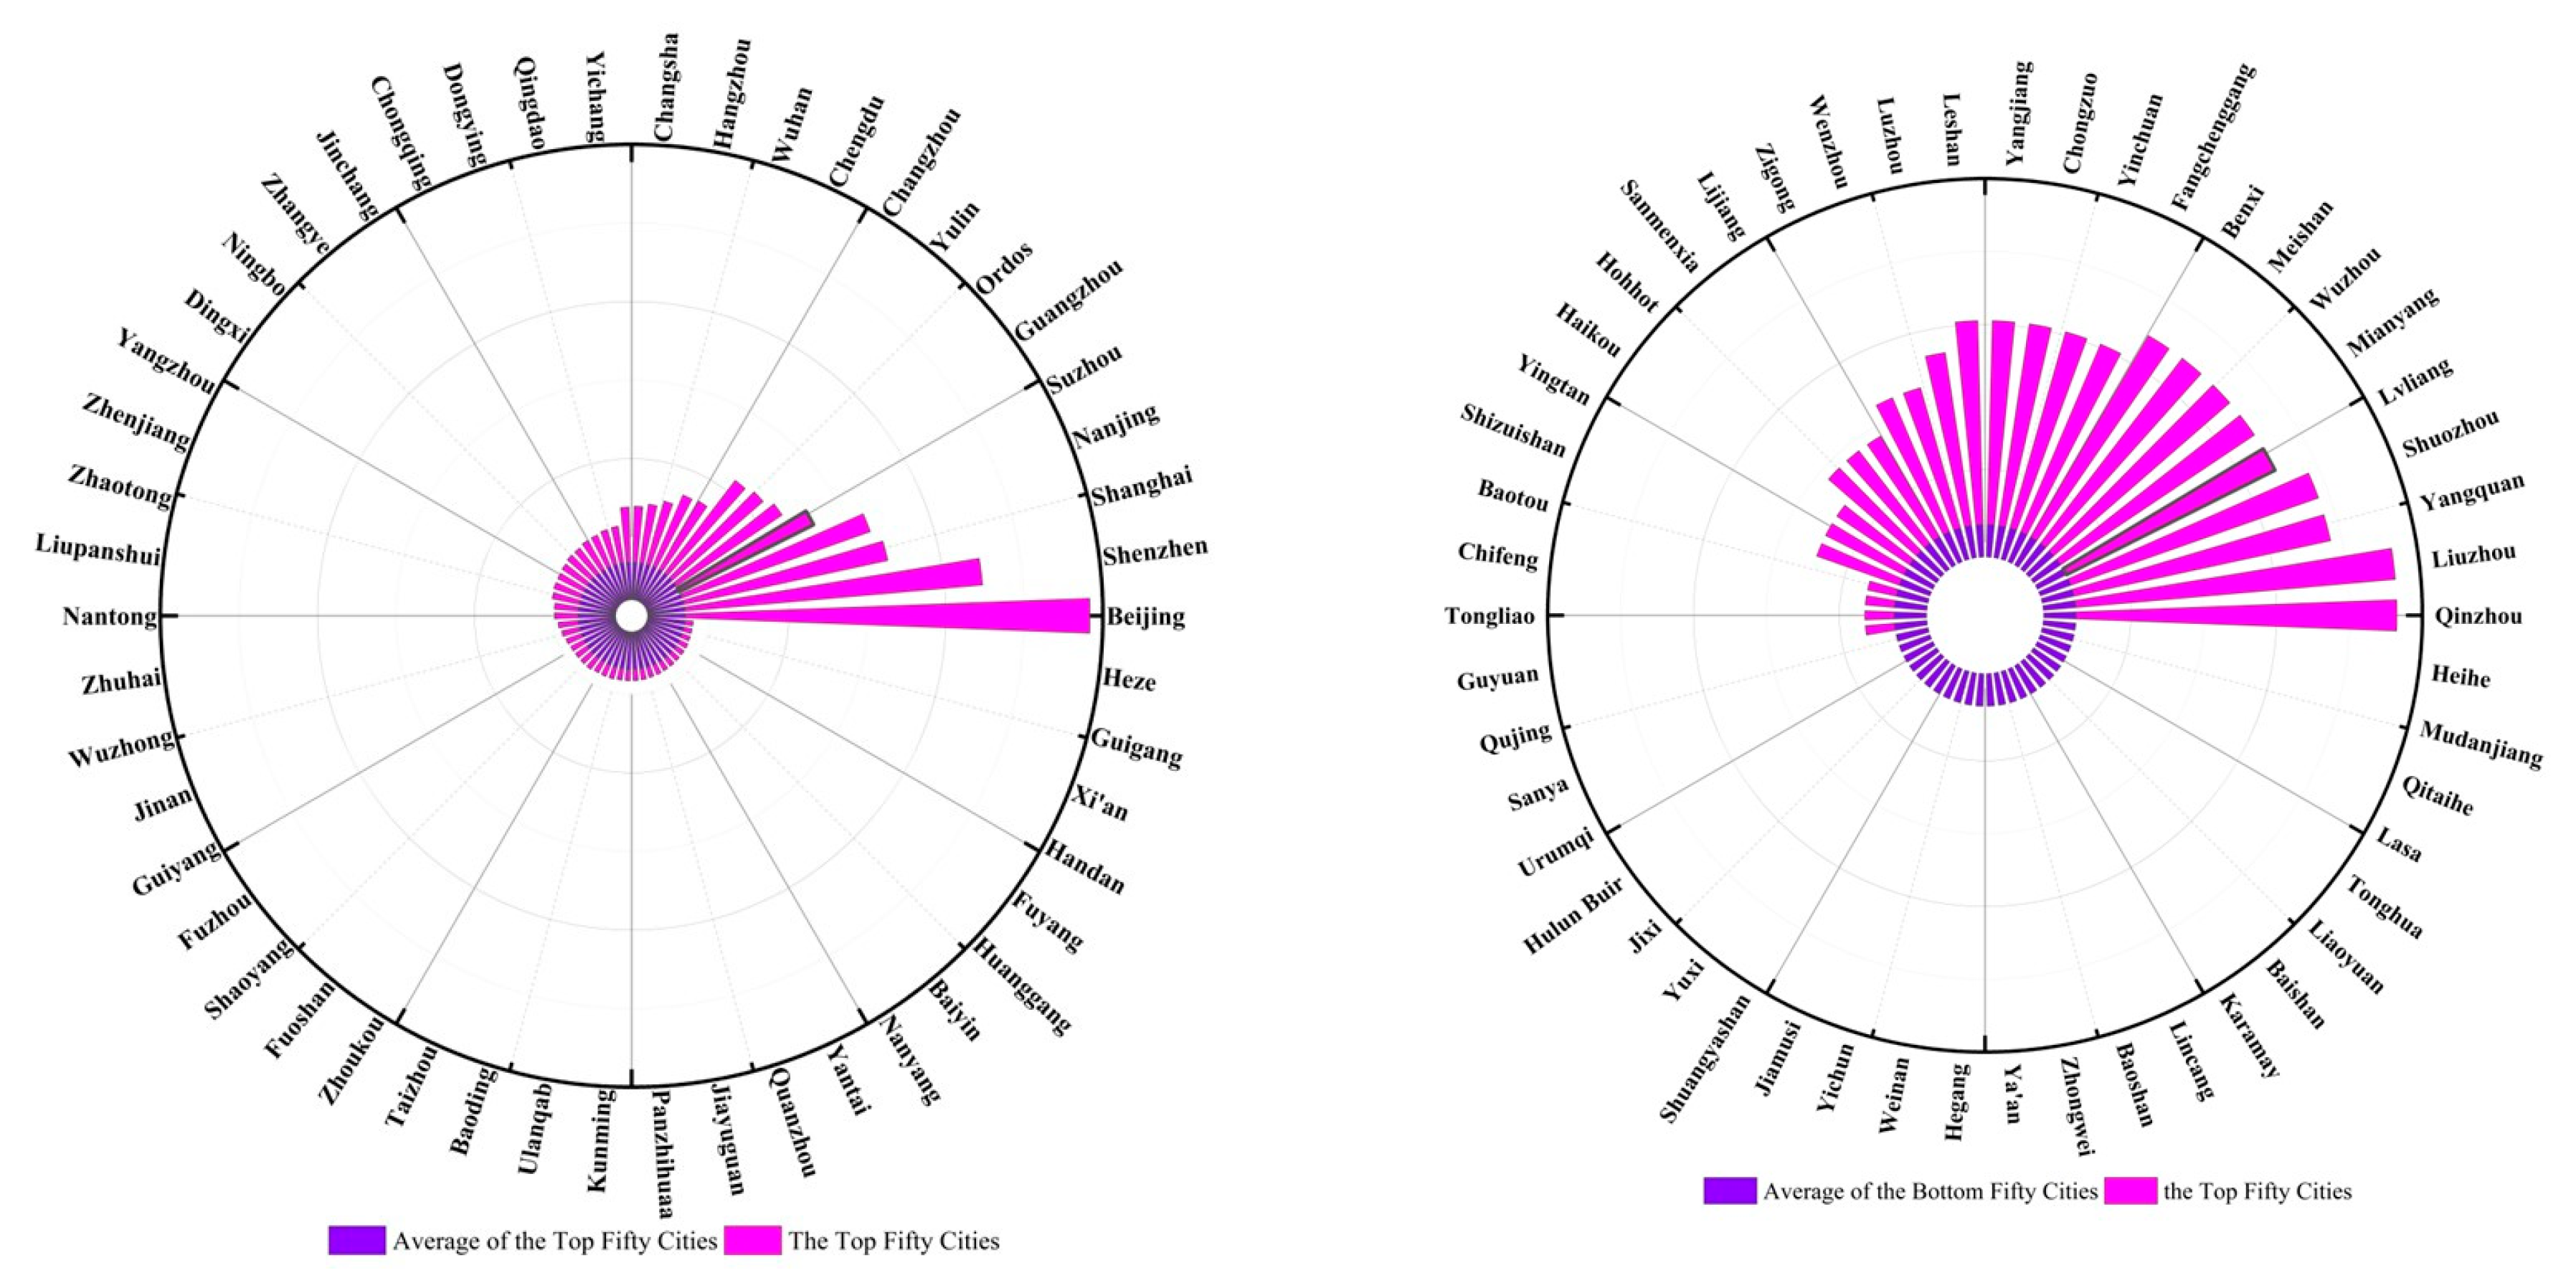
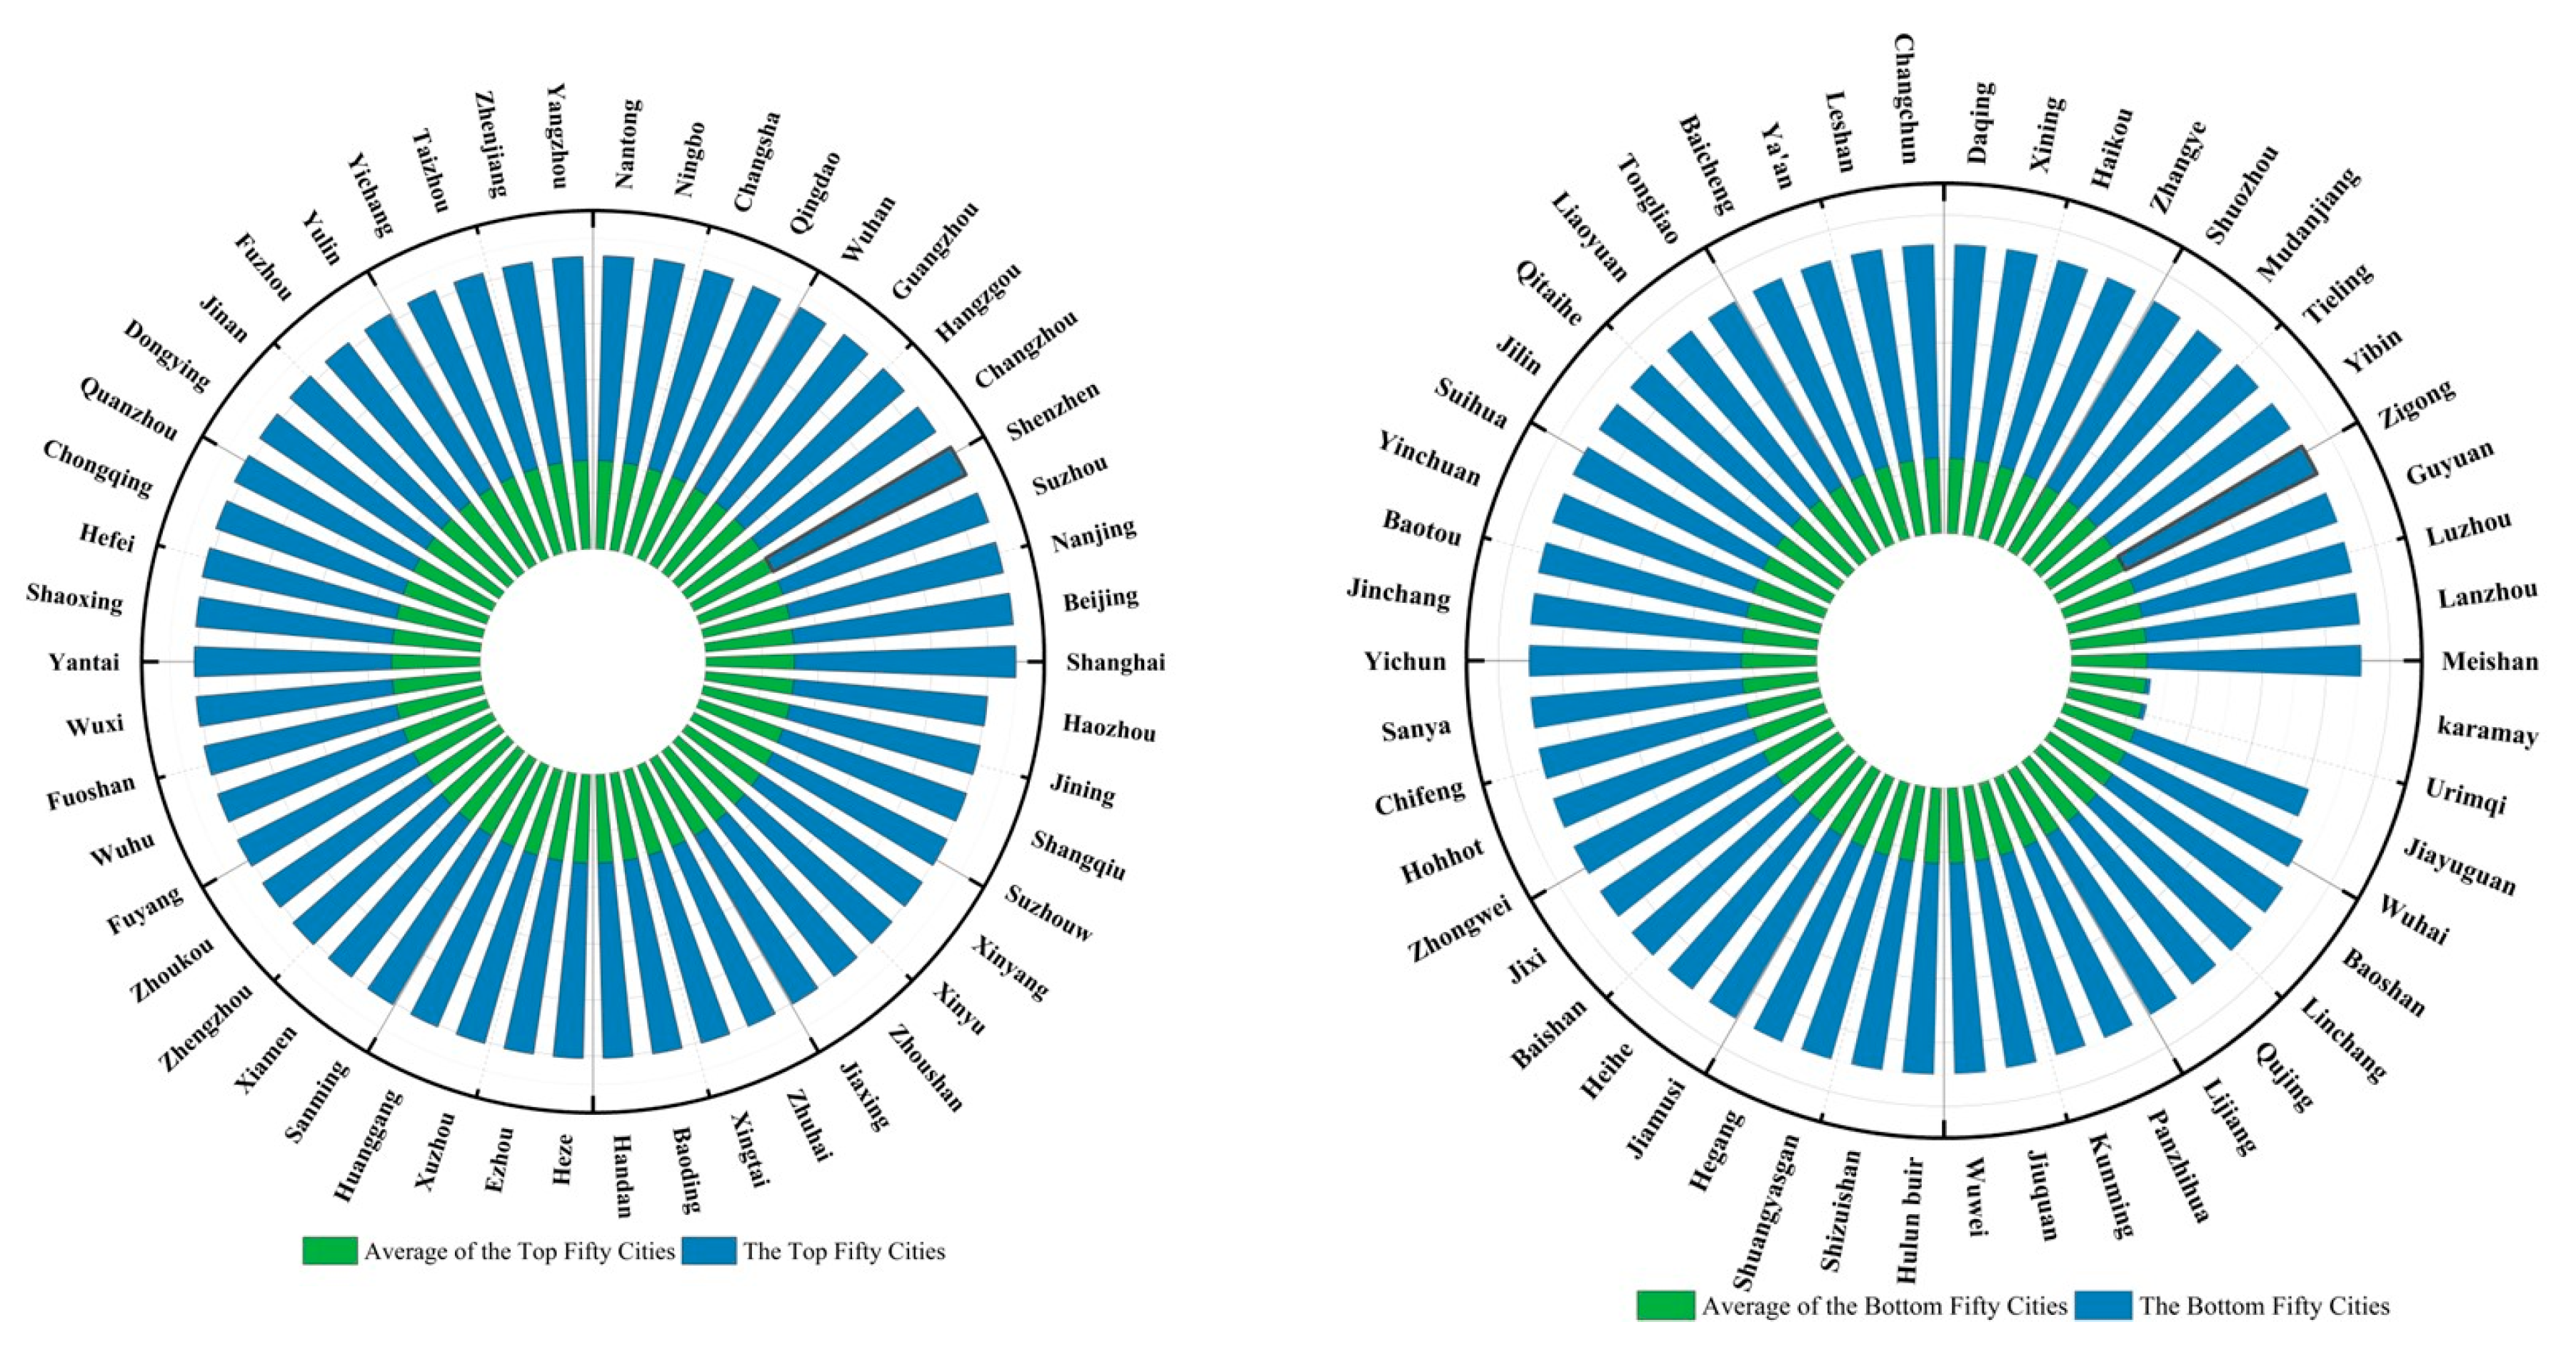
4.1. Overall Trends in Digital Economy Development
4.2. Overall Network Characteristics of China’s Urban Digital Economy
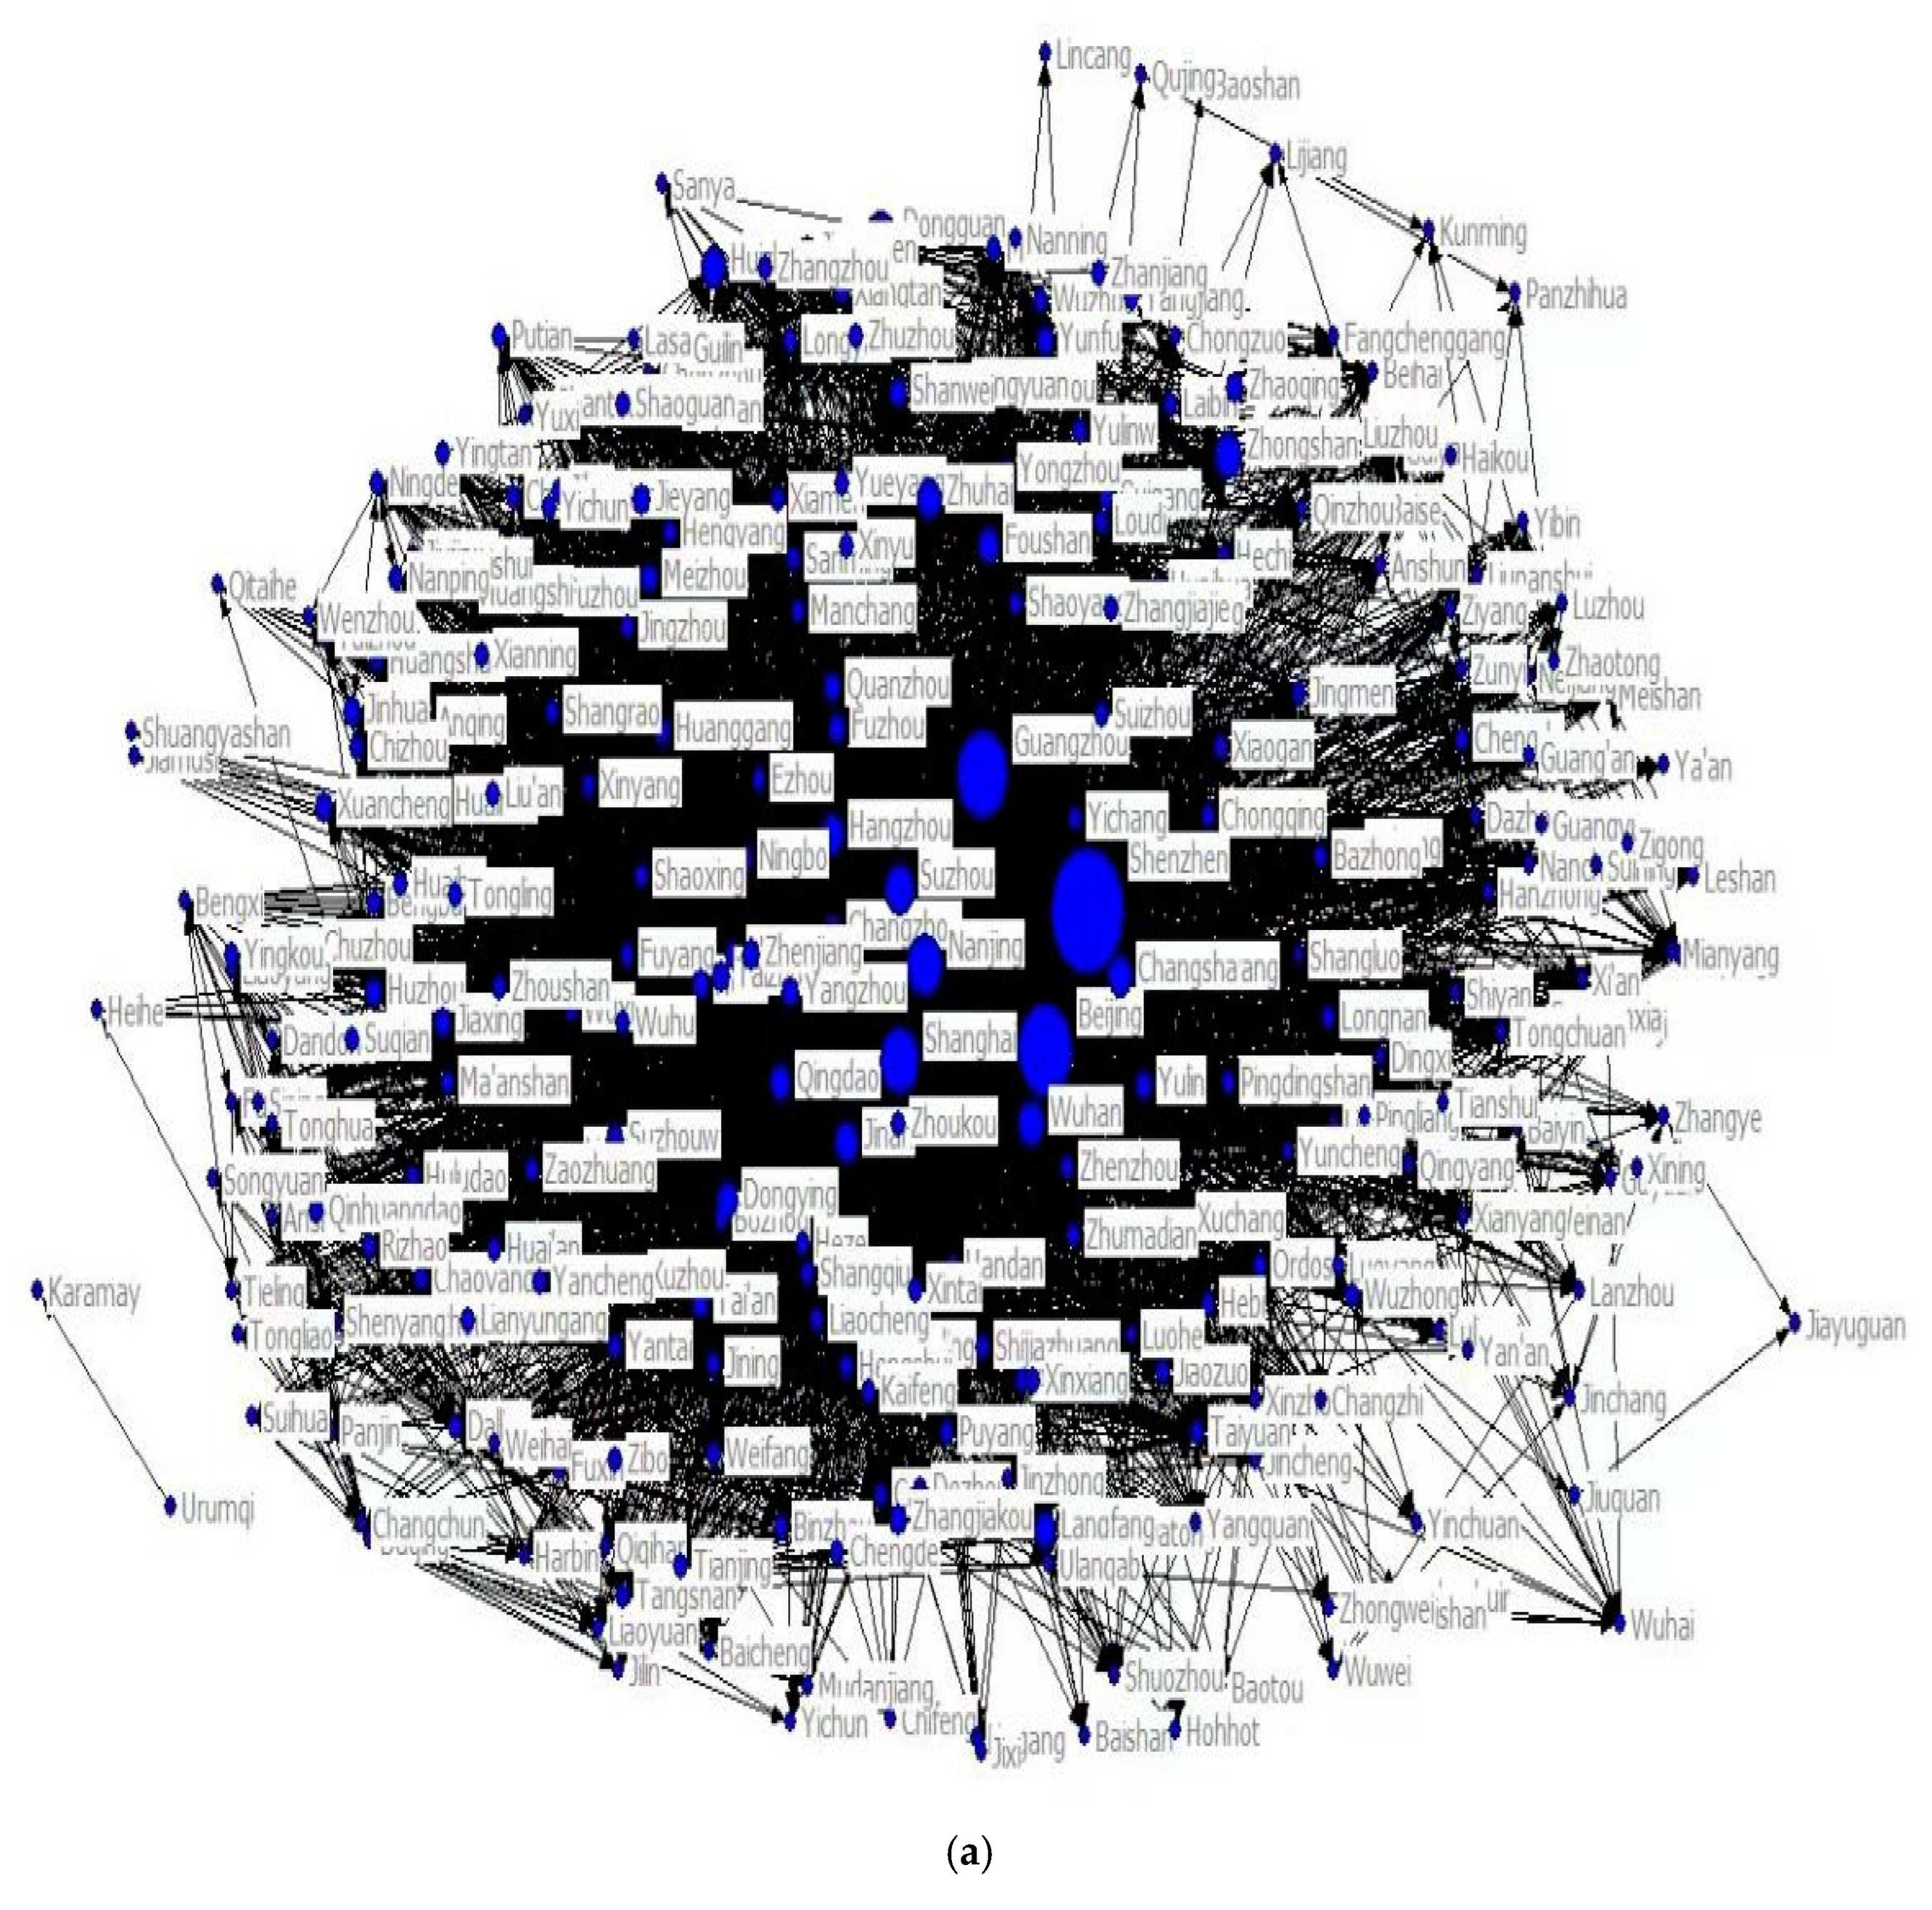
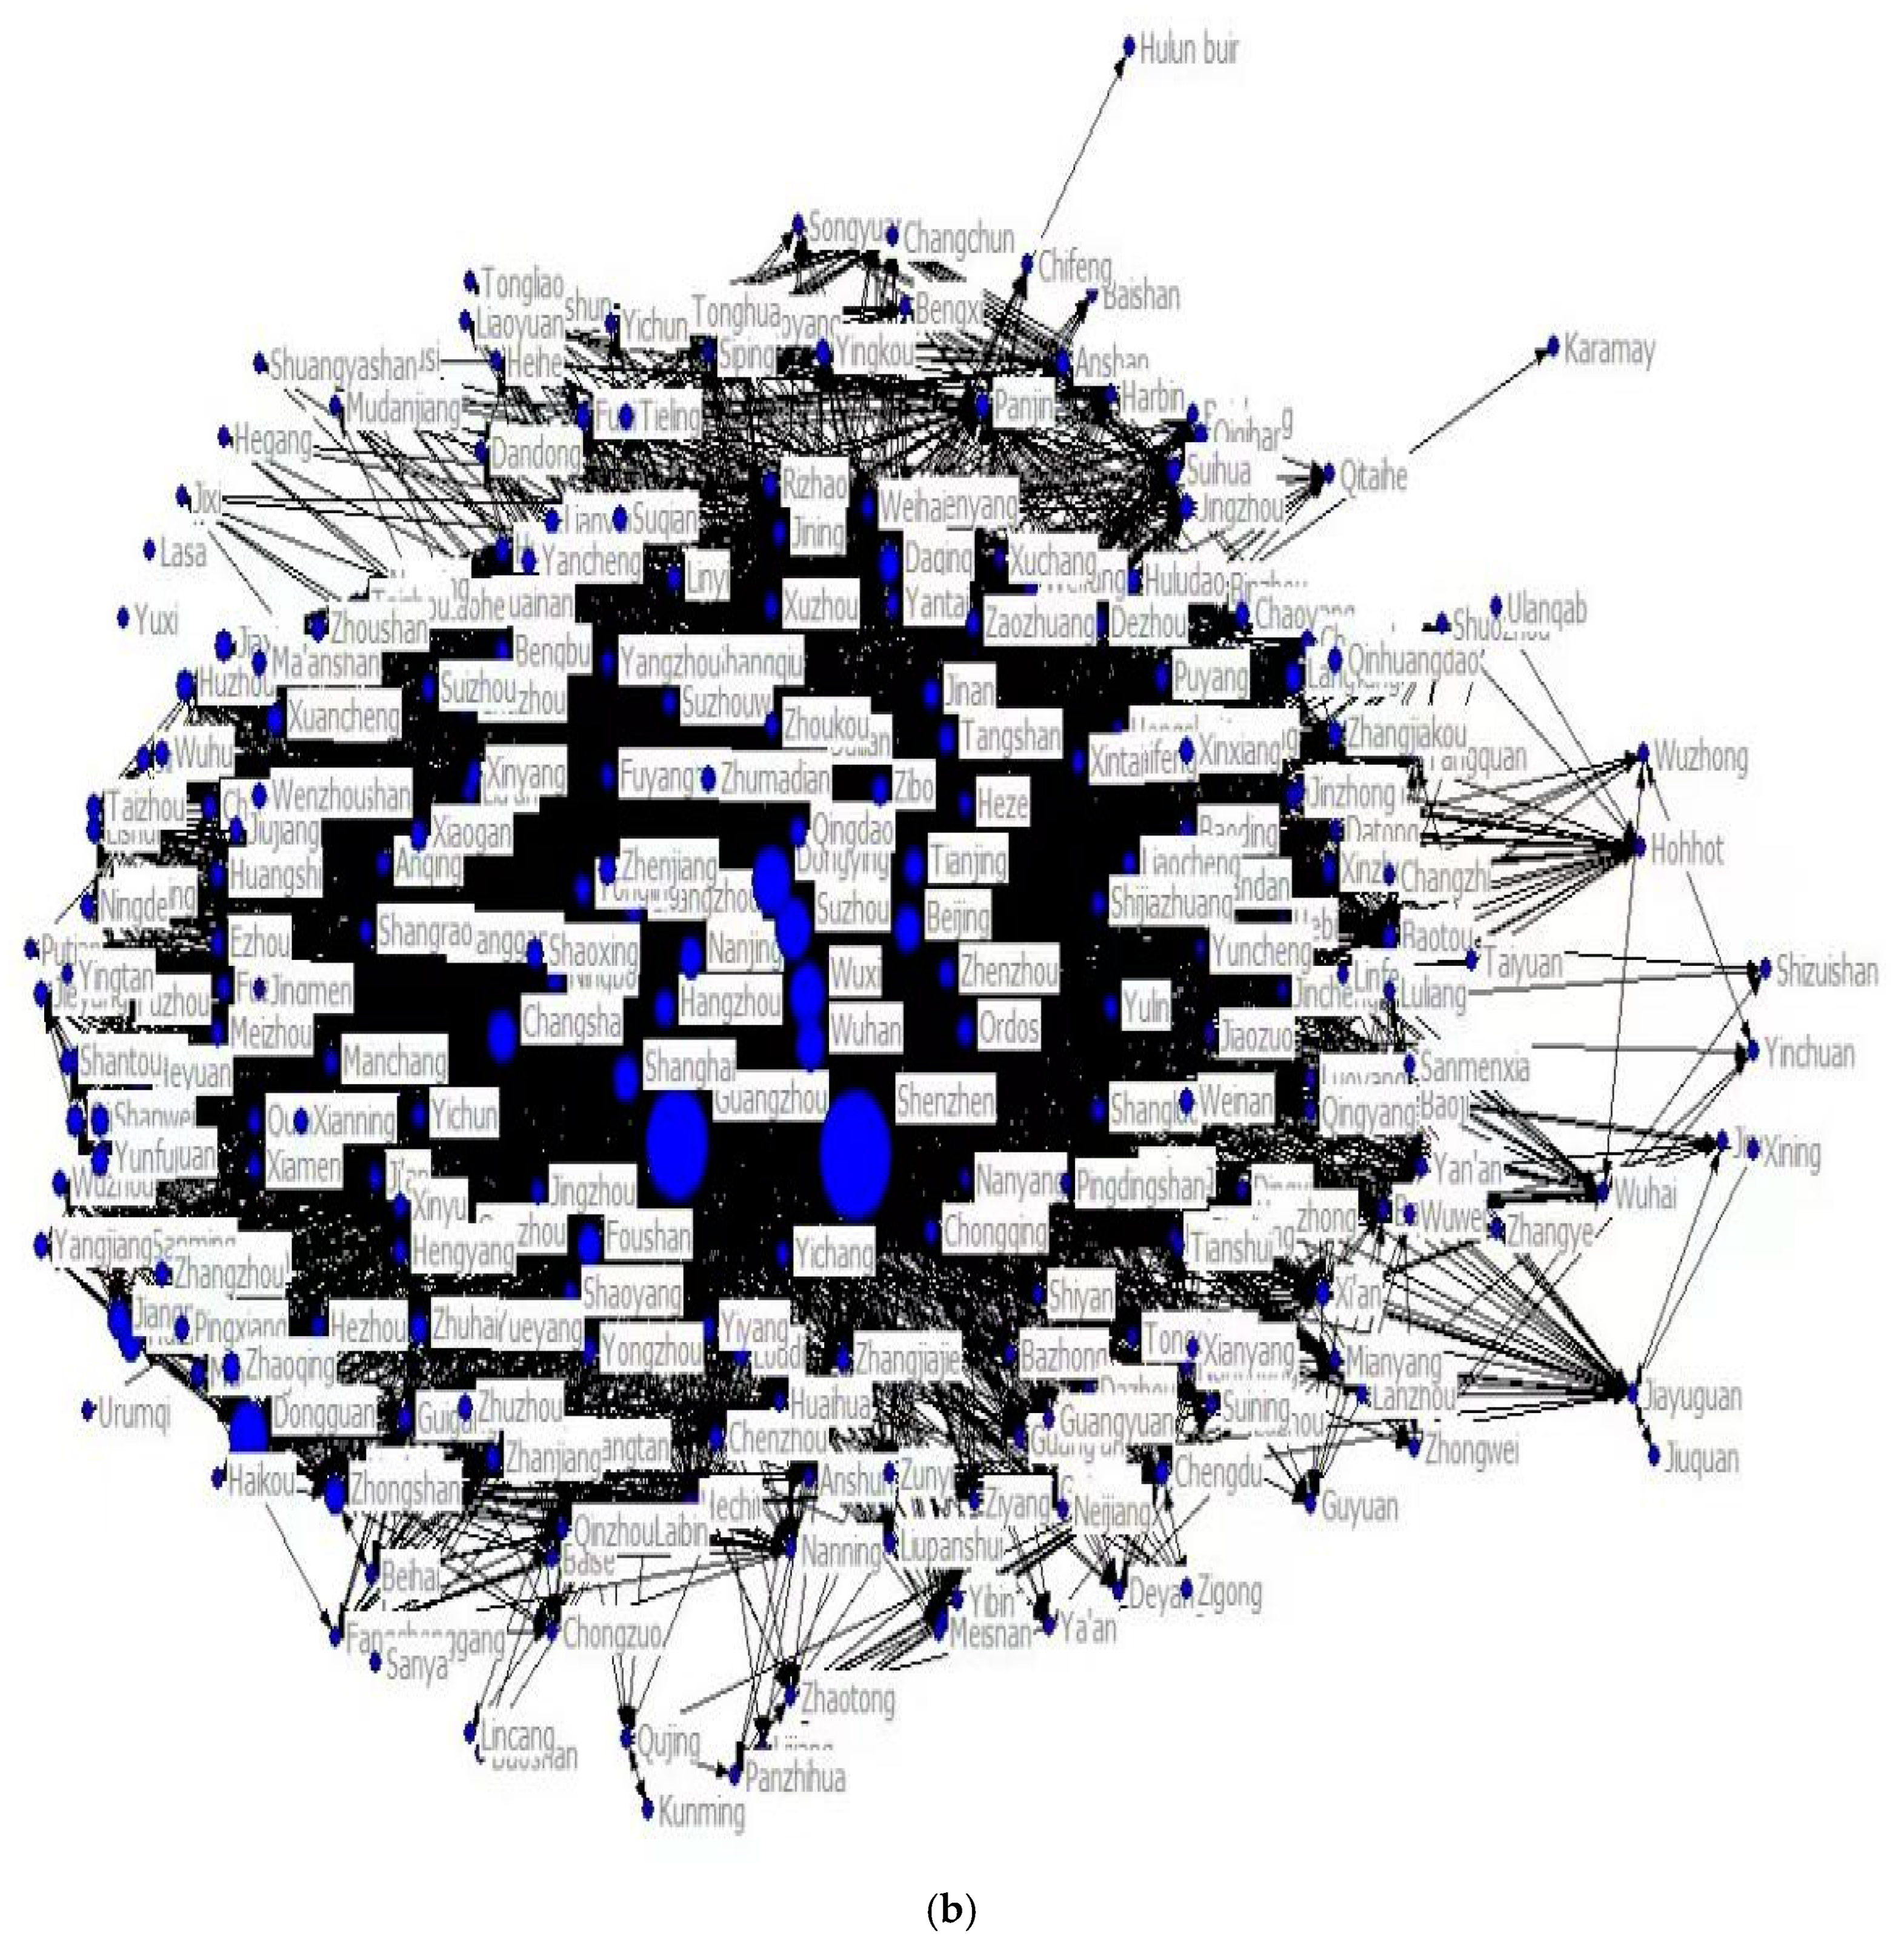
4.2.1. Spatial Association Characteristics
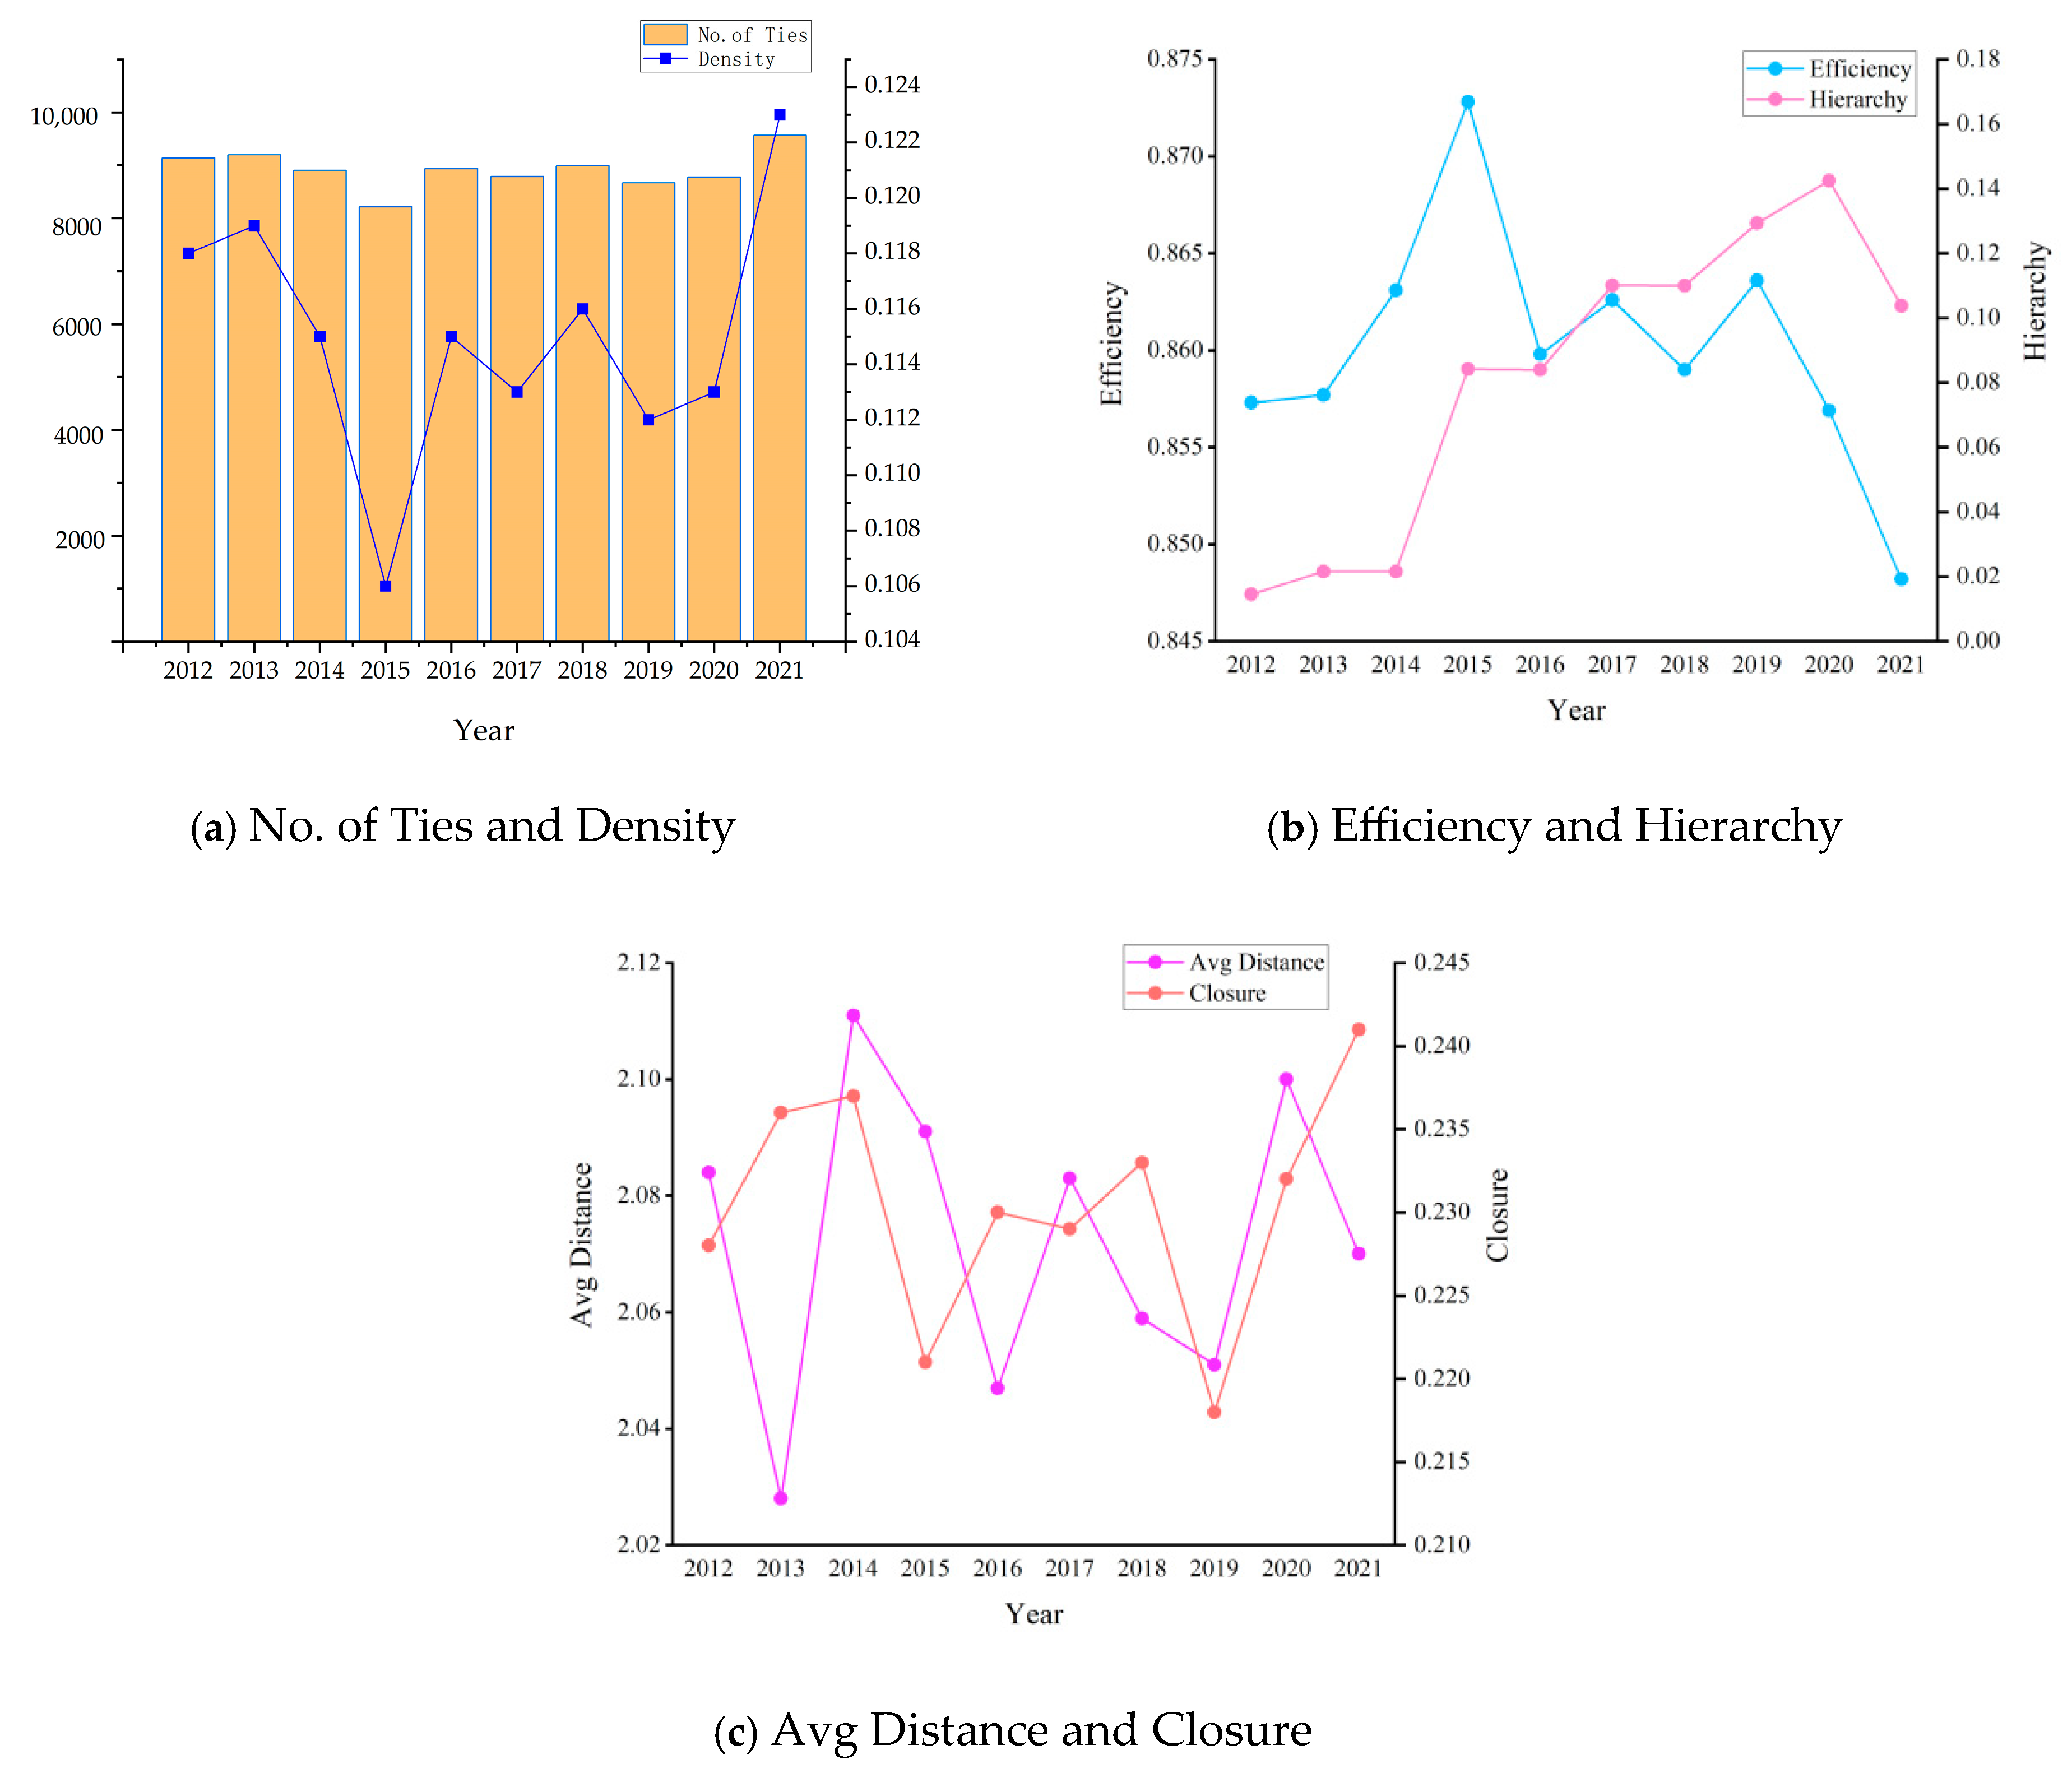
4.2.2. Overall Network Structural Characteristics
4.3. Analysis of Individual Network Characteristics
4.3.1. Degree Centrality
4.3.2. Betweenness Centrality
4.3.3. Closeness Centrality
4.4. Cohesive Subgroups Analysis of China’s Urban Digital Economy Spatial Network
4.4.1. Block Model Analysis
- Net Beneficiary Blocks: Members of these blocks both receive relationships from external members and from within the block and have a far higher number of entering relationships than exiting ones. Block II, for instance, has 664 outgoing relationships, 306 internal relationships, and receives 950 relationships from other blocks, qualifying it as a “Net Beneficiary” block.
- Net Outflow Blocks: Compared with what they received, these blocks send out significantly more connections to other blocks. Block IV, with 2832 outgoing relationships, 167 internal relationships, and receiving 1753 from other blocks, is classified as a “Net Outflow” block, where members not only satisfy their own digital economy resources but also provide resources to other regions.
- Bidirectional Outflow Blocks: Members of these blocks both send out and receive relationships, having a comparatively greater quantity of interactions originating from inside the block. According to the definition, Block I is a “Bidirectional Outflow” block, with 3889 outgoing relationships to other blocks and receiving 3777 relationships, having more contacts from within the block.
- Brokerage Blocks: These blocks have fewer internal relationships but play the role of connectors and bridges by both sending out and receiving relationships from other blocks. Block III, with 2177 outgoing relationships, only 208 internal relationships, and receiving 1587 external relationships, has extensive contacts with other blocks, qualifying it as a “Brokerage” block.
4.4.2. Structural Hole Analysis
- (1)
- Strengths: Dominance of Core Cities in Structural Holes
- (2)
- Weaknesses: Marginalization of Peripheral Cities
- (3)
- Opportunities: Dynamic Structural Hole Expansion
- (4)
- Threats: Core–Periphery Polarization
5. Analysis of Factors Driving the Structure of the Digital Economy Spatial Association Network
5.1. QAP Correlation Analysis
5.2. QAP Regression Analysis
5.3. Study Comparison
6. Conclusions and Policy Implications
6.1. Conclusions
6.2. Policy Implications
6.3. Limitations and Further Directions
Author Contributions
Funding
Data Availability Statement
Conflicts of Interest
Appendix A

| City | Out Degree | In Degree | Nrm Degree | City | Betweenness | City | Closeness |
|---|---|---|---|---|---|---|---|
| Shanghai | 252 | 145 | 90.647 | Beijing | 12.88 | Shanghai | 19.633 |
| Beijing | 244 | 128 | 87.77 | Shenzhen | 9.502 | Beijing | 19.536 |
| Nanjing | 236 | 156 | 84.892 | Shanghai | 6.632 | Nanjing | 19.373 |
| Suzhou | 235 | 142 | 84.173 | Nanjing | 6.347 | Suzhou | 19.359 |
| Shenzhen | 220 | 124 | 79.137 | Suzhou | 4.767 | Shenzhen | 19.12 |
| Guangzhou | 196 | 91 | 70.504 | Guangzhou | 4.056 | Hangzhou | 18.746 |
| Hangzhou | 190 | 103 | 67.266 | Ordos | 3.84 | Changzhou | 18.746 |
| Changzhou | 188 | 133 | 65.827 | Yulin | 3.72 | Guangzhou | 18.733 |
| Wuhan | 167 | 112 | 58.993 | Changzhou | 2.521 | Wuhan | 18.558 |
| Qingdao | 156 | 71 | 55.755 | Chengdu | 2.474 | Qingdao | 18.35 |
| Ningbo | 154 | 86 | 54.676 | Wuhan | 2.087 | Changsha | 18.302 |
| Changsha | 148 | 91 | 52.878 | Hangzhou | 1.886 | Ningbo | 18.289 |
| Nantong | 142 | 74 | 51.079 | Changsha | 1.779 | Nantong | 18.146 |
| Yangzhou | 136 | 96 | 47.842 | Yichang | 1.753 | Yangzhou | 18.087 |
| Taizhou | 129 | 61 | 44.245 | Qingdao | 1.177 | Zhenjiang | 18.005 |
| Zhenjiang | 124 | 104 | 43.525 | Dongying | 1.145 | Taizhou | 17.97 |
| Yichang | 116 | 87 | 40.288 | Chongqing | 1.091 | Yichang | 17.947 |
| Yulin | 115 | 88 | 39.209 | Jinchang | 1.071 | Yulin | 17.866 |
| Jinan | 110 | 59 | 39.209 | Zhangye | 1.013 | Fuzhou | 17.809 |
| Fuzhou | 107 | 63 | 38.489 | Ningbo | 1.009 | Jinan | 17.809 |
| Quanzhou | 106 | 53 | 35.971 | Dingxi | 0.963 | Dongying | 17.752 |
| Dongying | 101 | 94 | 33.094 | Yangzhou | 0.931 | Quanzhou | 17.73 |
| Hefei | 98 | 64 | 32.374 | Zhenjiang | 0.922 | Chongqing | 17.617 |
| Chongqing | 91 | 24 | 31.295 | Zhantong | 0.883 | Hefei | 17.595 |
| Yantai | 87 | 52 | 29.137 | Liupanshui | 0.759 | Shaoxing | 17.495 |
| Shaoxing | 84 | 58 | 28.058 | Nantong | 0.748 | Yantai | 17.484 |
| Foshan | 82 | 54 | 26.619 | Zhuhai | 0.643 | Wuxi | 17.473 |
| Ordos | 81 | 95 | 24.82 | Wuzhong | 0.575 | Wuhu | 17.44 |
| Zhenzhou | 79 | 43 | 24.82 | Jinan | 0.512 | Foshan | 17.44 |
| Zhoukou | 76 | 54 | 24.46 | Guiyang | 0.467 | Zhenzhou | 17.429 |
| Xiamen | 73 | 57 | 24.46 | Fuzhou | 0.452 | Fuyang | 17.429 |
| Fuyang | 71 | 61 | 23.741 | Foshan | 0.443 | Zhenzhou | 17.429 |
| Xuzhou | 70 | 49 | 21.942 | Shaoyang | 0.443 | Xiamen | 17.386 |
| Zhuhai | 70 | 77 | 21.942 | Taizhou | 0.396 | Sanming | 17.364 |
| Huanggang | 70 | 57 | 21.583 | Zhenzhou | 0.396 | Huanggang | 17.353 |
| Baoding | 68 | 43 | 21.583 | Baoding | 0.388 | Ezhou | 17.342 |
| Heze | 65 | 44 | 21.583 | Ulanqab | 0.367 | Xuzhou | 17.342 |
| Handan | 63 | 47 | 20.504 | Kunming | 0.362 | Heze | 17.332 |
| Xinyang | 62 | 50 | 19.784 | Panzhihua | 0.357 | Handan | 17.321 |
| Linyi | 62 | 47 | 19.424 | Jiayuguan | 0.355 | Baoding | 17.321 |
| Shijiazhuang | 61 | 34 | 19.424 | Quanzhou | 0.338 | Xinngtai | 17.31 |
| Shangrao | 60 | 53 | 19.424 | Yantai | 0.334 | Jiaxing | 17.299 |
| Xinyu | 60 | 43 | 19.065 | Nanyang | 0.322 | Zhuhai | 17.299 |
| Tongling | 59 | 40 | 19.065 | Baiyin | 0.318 | Zhoushan | 17.299 |
| Jining | 58 | 42 | 19.065 | Huanggang | 0.31 | Xinyu | 17.289 |
| Jiaxing | 58 | 47 | 18.705 | Fuyang | 0.305 | Xinyang | 17.289 |
| Yancheng | 57 | 40 | 18.705 | Handan | 0.3 | Suzhzhou | 17.278 |
| Shangqiu | 57 | 48 | 18.705 | Xi’an | 0.275 | Shangqiu | 17.278 |
| Tai’an | 56 | 41 | 18.345 | Guigang | 0.263 | Jining | 17.267 |
| Nanchang | 56 | 41 | 17.986 | Heze | 0.263 | Bozhou | 17.267 |
| Liaocheng | 56 | 47 | 17.626 | Xiamen | 0.26 | Nanchang | 17.267 |
| Sanming | 55 | 56 | 17.626 | Xining | 0.258 | Shangrao | 17.267 |
| Wuhu | 55 | 71 | 17.626 | Hefei | 0.257 | Liaocheng | 17.267 |
| Shaoyang | 55 | 42 | 17.266 | Shangrao | 0.248 | Linyi | 17.256 |
| Bozhou | 54 | 52 | 17.266 | Xinngtai | 0.239 | Yancheng | 17.256 |
| Huai’an | 54 | 45 | 17.266 | Huaihua | 0.232 | Shijiazhuang | 17.256 |
| Yueyang | 54 | 38 | 16.906 | Shijiazhuang | 0.229 | Tongling | 17.246 |
| Nanyang | 54 | 41 | 16.906 | Baoji | 0.22 | Nanyang | 17.235 |
| Xinngtai | 52 | 56 | 16.187 | Shangqiu | 0.217 | Shaoyang | 17.235 |
| Liu’an | 52 | 48 | 16.187 | Shaoxing | 0.213 | Huai’an | 17.235 |
| Suzhzhou | 52 | 57 | 16.187 | Yulin | 0.212 | Tai’an | 17.235 |
| Taiyuan | 52 | 36 | 16.187 | Linyi | 0.204 | Hengshui | 17.224 |
| Suizhou | 52 | 38 | 16.187 | Shenyang | 0.195 | Meizhou | 17.224 |
| Zhumadian | 52 | 45 | 15.827 | Longnan | 0.193 | Longyan | 17.224 |
| Zaozhuang | 51 | 46 | 15.827 | Liaocheng | 0.192 | Zhumadian | 17.214 |
| Weifang | 50 | 29 | 15.827 | Xinyang | 0.189 | Ma’anshan | 17.203 |
| Hengshui | 49 | 46 | 15.468 | Nanchong | 0.185 | Zaozhuang | 17.203 |
| Weihai | 49 | 43 | 15.468 | Ziyang | 0.183 | Ordos | 17.203 |
| Meizhou | 49 | 48 | 15.468 | Zhumadian | 0.177 | Yueyang | 17.192 |
| Dalian | 49 | 27 | 15.468 | Harbin | 0.175 | Liu’an | 17.192 |
| Ganzhou | 49 | 35 | 15.108 | Yibin | 0.174 | Taiyuan | 17.192 |
| Longyan | 48 | 48 | 15.108 | Pingliang | 0.172 | Suizhou | 17.182 |
| Dongguan | 48 | 40 | 14.748 | Hengshui | 0.167 | Huzhou | 17.182 |
| Zibo | 47 | 38 | 14.748 | Suzhzhou | 0.162 | Guigang | 17.16 |
| Fuzhou | 46 | 44 | 14.388 | Yan’an | 0.161 | Fuzhou | 17.16 |
| Jinzhou | 46 | 40 | 14.388 | Bazhong | 0.161 | Weifang | 17.16 |
| Jieyang | 46 | 39 | 14.388 | Zhengzhou | 0.158 | Zibo | 17.15 |
| Hengyang | 45 | 35 | 14.388 | Bozhou | 0.153 | Jinzhou | 17.15 |
| Chendu | 45 | 22 | 14.388 | Yongzhou | 0.149 | Huainan | 17.15 |
| Lianyungang | 45 | 37 | 13.309 | Taiyuan | 0.143 | Kaifeng | 17.139 |
| Anqing | 45 | 39 | 13.309 | Liu’an | 0.14 | Weihai | 17.139 |
| Yulin | 44 | 39 | 13.309 | Shangluo | 0.13 | Hengyang | 17.139 |
| Huzhou | 44 | 45 | 13.309 | Wuhu | 0.126 | Jieyang | 17.139 |
| Xinxiang | 43 | 31 | 12.95 | Tai’an | 0.125 | Xuchang | 17.139 |
| Zhuzhou | 43 | 39 | 12.95 | Jinzhou | 0.124 | Yulin | 17.129 |
| Yichun | 43 | 33 | 12.59 | Yuncheng | 0.122 | Chengdu | 17.129 |
| Wuzhong | 43 | 15 | 12.59 | Meizhou | 0.121 | Zhuzhou | 17.118 |
| Kaifeng | 43 | 37 | 12.59 | Zaozhuang | 0.118 | Zhangjiajie | 17.118 |
| Shengyang | 42 | 25 | 12.59 | Hechi | 0.118 | Bengbu | 17.118 |
| Yongzhou | 42 | 41 | 12.59 | Sanming | 0.117 | Lianyungang | 17.118 |
| Zhangzhou | 42 | 30 | 12.23 | Weihai | 0.115 | Yongzhou | 17.118 |
| Cangzhou | 42 | 33 | 12.23 | Xinxiang | 0.108 | Huaihua | 17.118 |
| Dezhou | 42 | 34 | 12.23 | Dalian | 0.105 | Ganzhou | 17.118 |
| Xianning | 42 | 35 | 11.871 | Cangzhou | 0.104 | Suqian | 17.108 |
| Huaihua | 42 | 39 | 11.871 | Kaifeng | 0.103 | Anqing | 17.108 |
| Huainan | 41 | 45 | 11.871 | Fuzhou | 0.1 | Dalian | 17.108 |
| Ji’an | 41 | 34 | 11.871 | Dongguan | 0.1 | Longnan | 17.108 |
| Bengbu | 41 | 41 | 11.871 | Wuxi | 0.099 | Huaibei | 17.097 |
| Guigang | 40 | 42 | 11.871 | Anyang | 0.097 | Yiyang | 17.097 |
| Suqian | 40 | 40 | 11.511 | Pingdingshan | 0.091 | Bazhong | 17.097 |
| Jinhua | 39 | 30 | 11.511 | Dezhou | 0.089 | Xianning | 17.087 |
| Yiyang | 39 | 37 | 11.511 | Fushun | 0.088 | Anyang | 17.087 |
| Wuxi | 39 | 84 | 11.151 | Yiyang | 0.087 | Dongguan | 17.087 |
| Ma’anshan | 38 | 49 | 11.151 | Jining | 0.086 | Shangluo | 17.087 |
| Chuzhou | 38 | 37 | 11.151 | Xuzhou | 0.086 | Puyang | 17.087 |
| Anyang | 38 | 36 | 11.151 | Longyan | 0.086 | Pingdingshan | 17.087 |
| Huizhou | 38 | 32 | 10.791 | Suizhou | 0.086 | Dezhou | 17.087 |
| Shantou | 38 | 32 | 10.791 | Ankang | 0.084 | Xinxiang | 17.087 |
| Pingdingshan | 38 | 33 | 10.791 | Zunyi | 0.083 | Cangzhou | 17.076 |
| Binzhou | 38 | 34 | 10.791 | Loudi | 0.082 | Chuzhou | 17.076 |
| Loudi | 38 | 38 | 10.791 | Jieyang | 0.081 | Binzhou | 17.076 |
| Xuchang | 38 | 41 | 10.791 | Hengyang | 0.081 | Huangshi | 17.076 |
| Ezhou | 38 | 62 | 10.432 | Ganzhou | 0.08 | Loudi | 17.076 |
| Puyang | 38 | 36 | 10.072 | Qingyang | 0.08 | Luohe | 17.066 |
| Qingyuan | 37 | 35 | 10.072 | Puyang | 0.08 | Tianjin | 17.066 |
| Tianjing | 37 | 42 | 10.072 | Zhoushan | 0.078 | Ji’an | 17.066 |
| Lishui | 37 | 34 | 10.072 | Zhangjiakou | 0.077 | Dingxi | 17.066 |
| Zhoushan | 37 | 67 | 9.712 | Huainan | 0.076 | Chaozhou | 17.066 |
| Jiujiang | 37 | 31 | 9.712 | Lanzhou | 0.075 | Huludao | 17.066 |
| Chaozhou | 36 | 37 | 9.353 | Xinyu | 0.075 | Chizhou | 17.055 |
| Chenzhou | 36 | 33 | 9.353 | Hanzhong | 0.074 | Zhangzhou | 17.055 |
| Nanping | 36 | 32 | 9.353 | Dazhou | 0.074 | Yichun | 17.055 |
| Ningde | 36 | 26 | 9.353 | Zhangjiajie | 0.071 | Hezhou | 17.055 |
| Xiaogan | 36 | 31 | 9.353 | Fuxin | 0.07 | Wuzhong | 17.055 |
| Luoyang | 36 | 26 | 8.993 | Jiaxing | 0.068 | Shenyang | 17.055 |
| Huaibei | 36 | 39 | 8.993 | Ezhou | 0.068 | Hebi | 17.055 |
| Heyuan | 35 | 36 | 8.633 | Nanchang | 0.066 | Qingyuan | 17.055 |
| Shaoguan | 35 | 33 | 8.633 | Xianning | 0.065 | Yuncheng | 17.045 |
| Huangshi | 35 | 37 | 8.633 | Wuwei | 0.064 | Xiaogan | 17.045 |
| Zhaoqing | 35 | 25 | 8.633 | Quang’an | 0.064 | Heyuan | 17.045 |
| Putian | 35 | 22 | 8.633 | Anqing | 0.061 | Zhangjiakou | 17.045 |
| Jingmen | 34 | 31 | 8.633 | Tongling | 0.059 | Huizhou | 17.045 |
| Maoming | 34 | 21 | 8.633 | Zhanjiang | 0.058 | Lishui | 17.034 |
| Shanwei | 34 | 35 | 8.273 | Xianyang | 0.058 | Hechi | 17.034 |
| Rizhao | 34 | 31 | 8.273 | Tianjin | 0.057 | Shanwei | 17.034 |
| Ulanqab | 34 | 21 | 8.273 | Yueyang | 0.056 | Zhongshan | 17.034 |
| Guilin | 34 | 31 | 8.273 | Yichun | 0.052 | Chenzhou | 17.034 |
| Yuncheng | 34 | 33 | 8.273 | Siping | 0.052 | Jiujiang | 17.034 |
| Zhanjiang | 34 | 20 | 7.914 | Ji’an | 0.052 | Shaoguan | 17.024 |
| Jiangmen | 34 | 27 | 7.914 | Huludao | 0.05 | Luoyang | 17.024 |
| Taizhou | 34 | 25 | 7.914 | Langfang | 0.05 | Pingliang | 17.024 |
| Langfang | 34 | 27 | 7.554 | Yancheng | 0.049 | Jincheng | 17.024 |
| Tangshan | 33 | 34 | 7.554 | Huaian | 0.049 | Shantou | 17.024 |
| Pingxiang | 33 | 33 | 7.554 | Bengbu | 0.049 | Jingmen | 17.024 |
| Luohe | 33 | 35 | 7.194 | Qingyuan | 0.047 | Xuancheng | 17.024 |
| Zhongshan | 33 | 33 | 7.194 | Xinzhou | 0.046 | Nanping | 17.024 |
| Yicheng | 33 | 33 | 7.194 | Jinhua | 0.046 | Rizhao | 17.024 |
| Nanning | 33 | 19 | 6.835 | Nanning | 0.046 | Xiangtan | 17.024 |
| Zhangjiakou | 33 | 33 | 6.835 | Chaoyang | 0.046 | Chaoyang | 17.024 |
| Zunyi | 32 | 17 | 6.835 | Qiqihar | 0.046 | Jinhua | 17.013 |
| Chaoyang | 32 | 33 | 6.835 | Jinzhou | 0.046 | Guilin | 17.013 |
| Huludao | 32 | 37 | 6.835 | Wuhai | 0.044 | Yingtan | 17.013 |
| Huangshan | 32 | 32 | 6.835 | Lishui | 0.043 | Huangshan | 17.013 |
| Guiyang | 32 | 17 | 6.475 | Luoyang | 0.041 | Pingxiang | 17.013 |
| Harbin | 32 | 11 | 6.475 | Jiaozuo | 0.04 | Linfen | 17.003 |
| Xi’an | 31 | 26 | 6.475 | Heyuan | 0.04 | Tianshui | 17.003 |
| Qinhuangdao | 30 | 26 | 6.475 | Chaozhou | 0.04 | Jiaozuo | 17.003 |
| Chengde | 30 | 23 | 6.475 | Panjin | 0.039 | Ankang | 17.003 |
| Xianyang | 30 | 21 | 6.475 | Jiuquan | 0.039 | Wuzhou | 16.993 |
| Chizhou | 30 | 36 | 6.475 | Xiaogan | 0.039 | Jiangmen | 16.993 |
| Jiaozuo | 30 | 30 | 6.115 | Daqing | 0.039 | Jinzhong | 16.993 |
| Jinzhou | 30 | 26 | 6.115 | Guilin | 0.038 | Yunfu | 16.993 |
| Baoji | 30 | 22 | 6.115 | Zhuzhou | 0.037 | Ningde | 16.993 |
| Yunfu | 30 | 30 | 5.755 | Laibin | 0.036 | Qingyang | 16.993 |
| Panjin | 29 | 24 | 5.755 | Huzhou | 0.036 | Fuxin | 16.993 |
| Yan’an | 29 | 22 | 5.755 | Shaoguan | 0.035 | Tangshan | 16.982 |
| Xiangtan | 29 | 32 | 5.755 | Ma’anshan | 0.035 | Changzhi | 16.982 |
| Anshan | 28 | 22 | 5.755 | Shiyan | 0.035 | Laibin | 16.982 |
| Changchun | 27 | 10 | 5.396 | Neijiang | 0.035 | Langfang | 16.972 |
| Hanzhong | 27 | 21 | 5.396 | Weifang | 0.035 | Xi’an | 16.972 |
| Beihai | 27 | 19 | 5.396 | Shantou | 0.034 | Xinzhou | 16.962 |
| Jincheng | 26 | 32 | 5.396 | Songyuan | 0.034 | Xianyang | 16.962 |
| Shiyan | 26 | 23 | 5.396 | Binzhou | 0.034 | Danton | 16.951 |
| Daqing | 26 | 9 | 5.396 | Shanwei | 0.033 | Chengde | 16.951 |
| Bazhong | 26 | 39 | 5.396 | Chenzhou | 0.033 | Jinzhou | 16.951 |
| Liuzhou | 26 | 21 | 5.396 | Danton | 0.033 | Qinhuangdao | 16.951 |
| Hechi | 26 | 34 | 5.396 | Guangyuan | 0.033 | Ulanqab | 16.951 |
| Yingkou | 26 | 22 | 5.396 | Chengde | 0.032 | Yan’an | 16.951 |
| Shangluo | 26 | 38 | 5.396 | Tangshan | 0.032 | Zhaoqing | 16.951 |
| Hezhou | 25 | 36 | 5.396 | Qinhuangdao | 0.032 | Baoji | 16.951 |
| Linfen | 25 | 29 | 5.036 | Linfen | 0.031 | Fushun | 16.941 |
| Longnan | 25 | 39 | 5.036 | Changchun | 0.03 | Taizhou | 16.941 |
| Ankang | 25 | 30 | 5.036 | Xuchang | 0.03 | Shiyan | 16.941 |
| Danton | 25 | 26 | 5.036 | Huaibei | 0.03 | Maoming | 16.941 |
| Dazhou | 25 | 21 | 5.036 | Suqian | 0.03 | Putian | 16.941 |
| Zhangjiajie | 25 | 42 | 4.676 | Pingxiang | 0.029 | Hanzhong | 16.941 |
| Wuhai | 24 | 10 | 4.317 | Yunfu | 0.029 | Qinzhou | 16.931 |
| Deyang | 24 | 14 | 4.317 | Jiangmen | 0.029 | Guiyang | 16.931 |
| Jinzhong | 24 | 27 | 4.317 | Hezhou | 0.029 | Ziyang | 16.931 |
| Tongchuan | 24 | 19 | 4.317 | Suining | 0.028 | Tongchuan | 16.931 |
| Changzhi | 24 | 27 | 4.317 | Zibo | 0.028 | Datong | 16.931 |
| Nanchong | 24 | 18 | 4.317 | Zhaoqing | 0.028 | Anshan | 16.931 |
| Yangjiang | 24 | 22 | 3.957 | Lianyungang | 0.028 | Yingkou | 16.931 |
| Fushun | 23 | 24 | 3.957 | Tianshui | 0.028 | Zhanjiang | 16.931 |
| Hebi | 23 | 35 | 3.597 | Jinzhong | 0.028 | Tonghua | 16.92 |
| Qinzhou | 23 | 24 | 3.597 | Tieling | 0.027 | Baiyin | 16.92 |
| Ziyang | 23 | 24 | 3.597 | Deyang | 0.027 | Siping | 16.92 |
| Laibin | 23 | 29 | 3.597 | Huizhou | 0.027 | Yangquan | 16.92 |
| Fuxin | 22 | 30 | 3.597 | Nanping | 0.027 | Liuzhou | 16.91 |
| Suining | 22 | 14 | 3.237 | Zhangzhou | 0.024 | Sanmenxia | 16.91 |
| Pingliang | 22 | 32 | 3.237 | Maoming | 0.024 | Nanning | 16.91 |
| Fangchenggang | 22 | 18 | 3.237 | Huangshi | 0.023 | Dazhou | 16.91 |
| Dingxi | 21 | 36 | 3.237 | Datong | 0.022 | Zunyi | 16.91 |
| Qingyang | 21 | 29 | 3.237 | Chuzhou | 0.022 | Liaoyang | 16.9 |
| Shuozhou | 21 | 16 | 3.237 | Jingmen | 0.021 | Yangjiang | 16.9 |
| Datong | 21 | 23 | 3.237 | Jilin | 0.021 | Guangyuan | 16.889 |
| Mianyang | 20 | 12 | 3.237 | Baicheng | 0.02 | Chongzuo | 16.889 |
| Quang’an | 20 | 17 | 2.878 | Jincheng | 0.02 | Panjin | 16.879 |
| Guangyuan | 20 | 19 | 2.878 | Suihua | 0.02 | Nanchong | 16.879 |
| Wenzhou | 20 | 20 | 2.878 | Zhongshan | 0.019 | Harbin | 16.879 |
| Lanzhou | 20 | 11 | 2.878 | Xuancheng | 0.019 | Quang Yen | 16.879 |
| Liaoyang | 19 | 21 | 2.878 | Anshan | 0.018 | Anshun | 16.879 |
| Baise | 19 | 18 | 2.518 | Taizhou | 0.017 | Wenzhou | 16.879 |
| Yangquan | 19 | 22 | 2.518 | sunshine | 0.017 | Beihai | 16.879 |
| Zhaotong | 19 | 18 | 2.518 | Jiujiang | 0.017 | Baise | 16.879 |
| Tieling | 18 | 19 | 2.158 | Luohe | 0.017 | Benxi | 16.879 |
| Luzhou | 18 | 13 | 2.158 | Xiangtan | 0.016 | Zhaotong | 16.869 |
| Benxi | 18 | 18 | 2.158 | Tongchuan | 0.016 | Suining | 16.869 |
| Yingtan | 18 | 32 | 2.158 | Hebi | 0.016 | Weinan | 16.869 |
| Sanmenxia | 18 | 20 | 2.158 | Baise | 0.015 | Qiqihar | 16.869 |
| Haikou | 17 | 12 | 2.158 | Huangshan | 0.015 | Liupanshui | 16.859 |
| Chongzuo | 17 | 20 | 2.158 | Changzhi | 0.015 | Neijiang | 16.859 |
| Xinzhou | 17 | 26 | 2.158 | Yingkou | 0.015 | Fangchenggang | 16.859 |
| Yibin | 17 | 12 | 2.158 | Ningde | 0.014 | Lvliang | 16.859 |
| Liupanshui | 17 | 16 | 2.158 | Chizhou | 0.013 | Deyang | 16.859 |
| Neijiang | 17 | 17 | 2.158 | Beihai | 0.013 | Songyuan | 16.848 |
| Wuzhou | 16 | 30 | 2.158 | Putian | 0.012 | Mianyang | 16.848 |
| Lvliang | 16 | 16 | 1.799 | Liaoyang | 0.011 | Meishan | 16.828 |
| Jinchang | 16 | 8 | 1.799 | Anshun | 0.011 | Luzhou | 16.828 |
| Hohhot | 16 | 5 | 1.799 | Qinzhou | 0.011 | Lanzhou | 16.828 |
| Siping | 15 | 23 | 1.799 | Liuzhou | 0.011 | Zigong | 16.818 |
| Baiyin | 15 | 22 | 1.799 | Yangquan | 0.009 | Guyuan | 16.818 |
| Tianshui | 15 | 30 | 1.799 | Shuozhou | 0.009 | Yibin | 16.818 |
| Qiqihar | 14 | 18 | 1.439 | Lvliang | 0.008 | Tieling | 16.808 |
| Zigong | 14 | 13 | 1.439 | Meishan | 0.008 | Zhangye | 16.798 |
| Leshan | 14 | 8 | 1.439 | Mianyang | 0.008 | Mudanjiang | 16.798 |
| Anshun | 14 | 19 | 1.439 | Benxi | 0.008 | Haikou | 16.798 |
| Yinchuan | 13 | 6 | 1.439 | Wuzhou | 0.008 | Shuozhou | 16.798 |
| Suihua | 13 | 11 | 1.439 | Chongzuo | 0.007 | Daqing | 16.777 |
| Sining | 13 | 7 | 1.439 | Fangchenggang | 0.007 | Xining | 16.777 |
| Songyuan | 13 | 16 | 1.439 | Yangjiang | 0.007 | Changchun | 16.777 |
| Ji Lin | 12 | 13 | 1.079 | Yinchuan | 0.007 | Leshan | 16.767 |
| Meishan | 12 | 14 | 1.079 | Leshan | 0.007 | Ya’an | 16.767 |
| Kunming | 12 | 4 | 1.079 | Luzhou | 0.006 | Baicheng | 16.757 |
| Baotou | 11 | 8 | 1.079 | Zigong | 0.005 | Liaoyuan | 16.747 |
| Wuwei | 9 | 5 | 0.719 | Wenzhou | 0.005 | Tongliao | 16.747 |
| Zhangye | 9 | 9 | 0.719 | Sanmenxia | 0.004 | Qitaihe | 16.747 |
| Tongliao | 8 | 14 | 0.719 | Lijiang | 0.004 | Jilin | 16.727 |
| Shizuishan | 8 | 5 | 0.719 | Hohhot | 0.004 | Suihua | 16.707 |
| Panzhihua | 8 | 4 | 0.719 | Haikou | 0.003 | Yinchuan | 16.697 |
| Chifeng | 8 | 8 | 0.719 | Shizuishan | 0.003 | Baotou | 16.687 |
| Baicheng | 8 | 15 | 0.719 | Yingtan | 0.003 | Jinchang | 16.677 |
| Ya’an | 7 | 8 | 0.36 | Tongliao | 0.001 | Sanya | 16.667 |
| Lijiang | 7 | 4 | 0.36 | Baotou | 0.001 | Yichun | 16.667 |
| Urumqi | 7 | 0 | 0.36 | Guyuan | 0.001 | Chifeng | 16.647 |
| Guyuan | 6 | 12 | 0.36 | Chifeng | 0.001 | Hohhot | 16.637 |
| Qujing | 6 | 3 | 0.36 | Ya’an | 0 | Zhongwei | 16.617 |
| Jiayuguan | 5 | 2 | 0.36 | Qujing | 0 | Jixi | 16.607 |
| Jiuquan | 5 | 1 | 0.36 | Zhongwei | 0 | Kiamusi | 16.607 |
| Sanya | 5 | 7 | 0.36 | Sanya | 0 | Baishan | 16.607 |
| Zhongwei | 5 | 5 | 0.36 | Baoshan | 0 | Hegang | 16.607 |
| Baoshan | 5 | 1 | 0 | Urumqi | 0 | Heihe | 16.607 |
| Lincang | 5 | 2 | 0 | Lincang | 0 | Shuangyashan | 16.597 |
| Hulunbuir | 5 | 2 | 0 | Hulunbuir | 0 | Shizuishan | 16.587 |
| Karamay | 5 | 1 | 0 | Karamay | 0 | Hulunbuir | 16.567 |
| Jixi | 4 | 5 | 0 | Jixi | 0 | Wuwei | 16.518 |
| Baishan | 4 | 5 | 0 | Baishan | 0 | Jiuquan | 16.411 |
| Yuxi | 4 | 0 | 0 | Yuxi | 0 | Kunming | 16.267 |
| Liaoyuan | 4 | 15 | 0 | Liaoyuan | 0 | Panzhihua | 16.267 |
| Shuangyashan | 3 | 4 | 0 | Shuangyashan | 0 | Lijiang | 16.248 |
| Tonghua | 2 | 23 | 0 | Tonghua | 0 | Qujing | 16.116 |
| Kiamusi | 2 | 5 | 0 | Kiamusi | 0 | Lincang | 16.107 |
| Lhasa | 2 | 0 | 0 | Lhasa | 0 | Baoshan | 16.097 |
| Yichun | 2 | 7 | 0 | Yichun | 0 | Wuhai | 15.566 |
| Qitaihe | 1 | 7 | 0 | Qitaihe | 0 | Jiayuguan | 14.434 |
| Weinan | 1 | 17 | 0 | Weinan | 0 | Urumqi | 0.36 |
| Mudanjiang | 1 | 12 | 0 | Mudanjiang | 0 | Karamay | 0.36 |
| Hegang | 0 | 5 | 0 | Hegang | 0 | Yuxi | 0 |
| Heihe | 0 | 5 | 0 | Heihe | 0 | Lhasa | 0 |
| 2012 | 2021 | ||||||||
|---|---|---|---|---|---|---|---|---|---|
| City | Effsize | Efficiency | Constraint | Hierarchy | City | EffSize | Efficiency | Constraint | Hierarchy |
| Dongying | 204.37 | 0.881 | 0.025 | 0.173 | Beijing | 224.44 | 0.92 | 0.023 | 0.170 |
| Suzhou | 199.36 | 0.882 | 0.029 | 0.229 | Shanghai | 221.28 | 0.878 | 0.023 | 0.162 |
| Guangzhou | 188.61 | 0.916 | 0.034 | 0.300 | Nanjing | 208.40 | 0.883 | 0.025 | 0.175 |
| Shenzhen | 188.13 | 0.904 | 0.032 | 0.263 | Suzhou | 204.86 | 0.872 | 0.026 | 0.190 |
| Wuxi | 185.88 | 0.877 | 0.029 | 0.205 | Shenzhen | 199.33 | 0.906 | 0.027 | 0.203 |
| Shanghai | 178.24 | 0.905 | 0.046 | 0.366 | Guangzhou | 181.65 | 0.927 | 0.035 | 0.316 |
| Changsha | 161.14 | 0.916 | 0.044 | 0.339 | Hangzhou | 166.04 | 0.883 | 0.041 | 0.308 |
| Beijing | 158.72 | 0.917 | 0.055 | 0.421 | Changzhou | 162.44 | 0.855 | 0.034 | 0.224 |
| Ordos | 149.75 | 0.886 | 0.032 | 0.171 | Wuhan | 149.92 | 0.898 | 0.047 | 0.323 |
| Wuhan | 145.20 | 0.891 | 0.053 | 0.356 | Qingdao | 137.48 | 0.881 | 0.06 | 0.380 |
| Nanjing | 141.10 | 0.887 | 0.051 | 0.345 | Ningbo | 136.36 | 0.885 | 0.043 | 0.275 |
| Hangzhou | 136.19 | 0.89 | 0.052 | 0.348 | Changsha | 134.71 | 0.91 | 0.053 | 0.354 |
| Dalian | 126.98 | 0.882 | 0.05 | 0.298 | Nantong | 122.63 | 0.864 | 0.061 | 0.355 |
| Tianjin | 116.97 | 0.886 | 0.061 | 0.344 | Yangzhou | 115.23 | 0.847 | 0.054 | 0.297 |
| Qingdao | 110.82 | 0.846 | 0.06 | 0.309 | Zhenjiang | 107.46 | 0.833 | 0.053 | 0.267 |
| Foshan | 102.14 | 0.904 | 0.079 | 0.445 | Yichang | 106.70 | 0.92 | 0.07 | 0.390 |
| Changzhou | 94.10 | 0.863 | 0.067 | 0.339 | Yulin | 104.86 | 0.912 | 0.059 | 0.333 |
| Ningbo | 93.77 | 0.852 | 0.063 | 0.301 | Taizhou | 99.85 | 0.805 | 0.063 | 0.288 |
| Daqing | 89.01 | 0.848 | 0.053 | 0.198 | Jinan | 92.87 | 0.844 | 0.073 | 0.324 |
| Shaoxing | 82.11 | 0.821 | 0.064 | 0.254 | Fuzhou | 91.59 | 0.856 | 0.071 | 0.334 |
| Zhenjiang | 75.42 | 0.82 | 0.071 | 0.285 | Dongying | 89.47 | 0.844 | 0.054 | 0.207 |
| Tongling | 74.57 | 0.829 | 0.067 | 0.237 | Ordos | 87.42 | 0.892 | 0.058 | 0.252 |
| Shenyang | 71.18 | 0.847 | 0.086 | 0.322 | Quanzhou | 82.19 | 0.814 | 0.068 | 0.267 |
| Tangshan | 69.86 | 0.794 | 0.08 | 0.271 | Hefei | 69.60 | 0.765 | 0.072 | 0.242 |
| Zibo | 69.34 | 0.806 | 0.078 | 0.271 | Zhuhai | 65.39 | 0.828 | 0.075 | 0.242 |
| Zhuhai | 66.58 | 0.843 | 0.077 | 0.273 | Chongqing | 64.50 | 0.741 | 0.064 | 0.168 |
| Yulin | 62.77 | 0.86 | 0.094 | 0.342 | Yantai | 63.35 | 0.782 | 0.083 | 0.262 |
| Zhengzhou | 60.32 | 0.783 | 0.084 | 0.249 | Foshan | 63.12 | 0.83 | 0.089 | 0.295 |
| Baotou | 59.87 | 0.832 | 0.082 | 0.248 | Shaoxing | 60.69 | 0.74 | 0.074 | 0.212 |
| Jinan | 58.20 | 0.727 | 0.073 | 0.193 | Xiamen | 60.27 | 0.826 | 0.083 | 0.25 |
| Weihai | 57.77 | 0.837 | 0.087 | 0.28 | Wuxi | 53.10 | 0.632 | 0.06 | 0.11 |
| Yantai | 52.63 | 0.731 | 0.083 | 0.209 | Zhengzhou | 50.66 | 0.724 | 0.079 | 0.175 |
| Yichang | 51.16 | 0.775 | 0.106 | 0.284 | Zhoushan | 50.09 | 0.737 | 0.082 | 0.189 |
| Bozhou | 46.69 | 0.64 | 0.058 | 0.043 | Zhoukou | 48.33 | 0.69 | 0.062 | 0.062 |
| Heze | 46.26 | 0.68 | 0.064 | 0.057 | Fuyang | 46.75 | 0.668 | 0.062 | 0.057 |
| Zhoushan | 45.62 | 0.76 | 0.093 | 0.207 | Wuhu | 46.60 | 0.656 | 0.074 | 0.143 |
| Xiamen | 45.34 | 0.796 | 0.104 | 0.251 | Sanming | 45.26 | 0.696 | 0.083 | 0.164 |
| Fuyang | 45.05 | 0.653 | 0.061 | 0.046 | Huanggang | 42.51 | 0.675 | 0.066 | 0.046 |
| Xinyu | 44.61 | 0.783 | 0.104 | 0.229 | Ezhou | 42.25 | 0.681 | 0.086 | 0.154 |
| Huanggang | 44.31 | 0.726 | 0.068 | 0.057 | Handan | 41.53 | 0.692 | 0.074 | 0.08 |
| Chongqing | 43.30 | 0.722 | 0.077 | 0.095 | Baoding | 41.36 | 0.689 | 0.074 | 0.077 |
| Zhongshan | 41.03 | 0.76 | 0.104 | 0.234 | Heze | 41.36 | 0.678 | 0.071 | 0.064 |
| Zhoukou | 38.60 | 0.677 | 0.075 | 0.057 | Xinyang | 38.48 | 0.675 | 0.074 | 0.062 |
| Zhumadian | 38.04 | 0.718 | 0.08 | 0.067 | Nanyang | 37.33 | 0.718 | 0.085 | 0.083 |
| Lu’an | 36.83 | 0.658 | 0.075 | 0.054 | Xingtai | 37.31 | 0.632 | 0.073 | 0.057 |
| Shangrao | 36.29 | 0.685 | 0.079 | 0.056 | Shaoyang | 36.81 | 0.708 | 0.083 | 0.074 |
| Xingtai | 35.85 | 0.629 | 0.073 | 0.041 | Suzhou | 36.71 | 0.644 | 0.076 | 0.061 |
| Xiaogan | 35.78 | 0.716 | 0.083 | 0.065 | Linyi | 36.10 | 0.669 | 0.079 | 0.062 |
| Panjin | 35.43 | 0.738 | 0.113 | 0.213 | Shangrao | 36.10 | 0.645 | 0.072 | 0.034 |
| Xinyang | 35.03 | 0.701 | 0.087 | 0.085 | Shangqiu | 36.08 | 0.644 | 0.075 | 0.051 |
| Shangqiu | 34.90 | 0.646 | 0.077 | 0.047 | Nanchang | 35.98 | 0.643 | 0.093 | 0.148 |
| Suzhou | 34.72 | 0.569 | 0.068 | 0.031 | Chengdu | 35.67 | 0.849 | 0.13 | 0.249 |
| Chengdu | 34.46 | 0.841 | 0.14 | 0.289 | Bozhou | 35.09 | 0.638 | 0.076 | 0.049 |
| Shijiazhuang | 34.09 | 0.568 | 0.07 | 0.036 | Shijiazhuang | 35.02 | 0.648 | 0.084 | 0.091 |
| Baoding | 33.94 | 0.722 | 0.094 | 0.098 | Xinyu | 34.82 | 0.6 | 0.084 | 0.114 |
| Yangzhou | 32.50 | 0.542 | 0.075 | 0.074 | Taiyuan | 34.54 | 0.72 | 0.114 | 0.197 |
| Anqing | 31.82 | 0.663 | 0.09 | 0.073 | Liaocheng | 34.48 | 0.627 | 0.077 | 0.055 |
| Shaoyang | 31.75 | 0.661 | 0.091 | 0.073 | Meizhou | 33.81 | 0.65 | 0.081 | 0.055 |
| Handan | 31.64 | 0.673 | 0.097 | 0.108 | Weihai | 33.77 | 0.689 | 0.103 | 0.16 |
| Jingzhou | 30.77 | 0.715 | 0.098 | 0.079 | Zhumadian | 33.65 | 0.673 | 0.085 | 0.061 |
| Nanchang | 30.52 | 0.598 | 0.093 | 0.111 | Longyan | 33.54 | 0.645 | 0.092 | 0.119 |
| Nanyang | 29.96 | 0.749 | 0.11 | 0.108 | Tai’an | 32.84 | 0.631 | 0.082 | 0.064 |
| Hengshui | 29.78 | 0.608 | 0.085 | 0.044 | Dalian | 32.22 | 0.7 | 0.121 | 0.204 |
| Weinan | 29.72 | 0.725 | 0.108 | 0.092 | Hengshui | 31.99 | 0.627 | 0.085 | 0.064 |
| Yichun | 29.70 | 0.691 | 0.1 | 0.074 | Jingzhou | 31.96 | 0.726 | 0.092 | 0.059 |
| Linyi | 29.62 | 0.581 | 0.081 | 0.04 | Liu’an | 31.57 | 0.644 | 0.085 | 0.053 |
| Fuzhou | 29.22 | 0.679 | 0.099 | 0.071 | Fuzhou | 30.98 | 0.674 | 0.09 | 0.055 |
| Yuncheng | 29.13 | 0.728 | 0.111 | 0.1 | Guigang | 30.79 | 0.669 | 0.094 | 0.069 |
| Ganzhou | 28.96 | 0.673 | 0.099 | 0.069 | Zaozhuang | 30.66 | 0.626 | 0.087 | 0.061 |
| Shangluo | 28.79 | 0.702 | 0.111 | 0.102 | Jiaxing | 30.59 | 0.527 | 0.078 | 0.076 |
| Ji’an | 27.37 | 0.702 | 0.109 | 0.078 | Longnan | 30.43 | 0.761 | 0.109 | 0.087 |
| Chuzhou | 27.21 | 0.618 | 0.095 | 0.05 | Dongguan | 30.43 | 0.676 | 0.111 | 0.157 |
| Xuancheng | 26.10 | 0.652 | 0.107 | 0.066 | Zhangjiajie | 30.40 | 0.724 | 0.107 | 0.1 |
| Xinxiang | 26.05 | 0.724 | 0.117 | 0.089 | Huaihua | 30.35 | 0.74 | 0.103 | 0.082 |
| Suizhou | 25.77 | 0.696 | 0.123 | 0.112 | Xuzhou | 30.28 | 0.488 | 0.067 | 0.035 |
| Hengyang | 25.76 | 0.678 | 0.116 | 0.098 | Ganzhou | 29.34 | 0.682 | 0.096 | 0.055 |
| Xi’an | 25.58 | 0.656 | 0.116 | 0.105 | Hengyang | 29.21 | 0.679 | 0.101 | 0.087 |
| Kaifeng | 25.40 | 0.669 | 0.113 | 0.083 | Jieyang | 28.96 | 0.643 | 0.093 | 0.055 |
| Huangshan | 24.89 | 0.638 | 0.11 | 0.068 | Tianjin | 28.84 | 0.687 | 0.119 | 0.163 |
| Yongzhou | 24.87 | 0.672 | 0.115 | 0.077 | Yiyang | 28.35 | 0.727 | 0.106 | 0.072 |
| Xuzhou | 24.78 | 0.459 | 0.074 | 0.015 | Suizhou | 28.07 | 0.597 | 0.092 | 0.07 |
| Suqian | 24.57 | 0.558 | 0.095 | 0.05 | Huainan | 27.71 | 0.616 | 0.094 | 0.061 |
| Bengbu | 24.44 | 0.555 | 0.098 | 0.061 | Yulin | 27.71 | 0.644 | 0.097 | 0.051 |
| Meizhou | 24.16 | 0.619 | 0.109 | 0.065 | Kaifeng | 27.71 | 0.644 | 0.101 | 0.08 |
| Anyang | 24.13 | 0.69 | 0.123 | 0.092 | Bazhong | 27.48 | 0.705 | 0.109 | 0.064 |
| Yiyang | 23.83 | 0.701 | 0.127 | 0.097 | Dingxi | 27.48 | 0.763 | 0.115 | 0.077 |
| Ankang | 23.72 | 0.698 | 0.132 | 0.105 | Jining | 27.36 | 0.498 | 0.076 | 0.036 |
| Hefei | 23.40 | 0.487 | 0.088 | 0.044 | Yancheng | 27.21 | 0.504 | 0.082 | 0.062 |
| Dongguan | 23.37 | 0.599 | 0.118 | 0.111 | Shangluo | 27.14 | 0.714 | 0.114 | 0.079 |
| Quanzhou | 23.28 | 0.529 | 0.1 | 0.07 | Yongzhou | 26.98 | 0.642 | 0.1 | 0.06 |
| Nantong | 23.10 | 0.481 | 0.087 | 0.038 | Ji’an | 26.93 | 0.709 | 0.109 | 0.071 |
| Chizhou | 22.78 | 0.633 | 0.118 | 0.072 | Xinxiang | 26.32 | 0.693 | 0.109 | 0.063 |
| Xinzhou | 22.72 | 0.71 | 0.141 | 0.123 | Loudi | 26.22 | 0.69 | 0.11 | 0.075 |
| Dingxi | 22.63 | 0.73 | 0.141 | 0.106 | Pingdingshan | 26.03 | 0.685 | 0.109 | 0.063 |
| Zhangjiajie | 22.54 | 0.704 | 0.139 | 0.109 | Xianning | 25.82 | 0.662 | 0.113 | 0.095 |
| Jiujiang | 22.53 | 0.663 | 0.132 | 0.116 | Yichun | 25.67 | 0.694 | 0.11 | 0.062 |
| Lianyungang | 22.32 | 0.587 | 0.111 | 0.069 | Wuzhong | 25.59 | 0.731 | 0.116 | 0.056 |
| Liaocheng | 22.32 | 0.558 | 0.107 | 0.065 | Anyang | 25.55 | 0.672 | 0.107 | 0.053 |
| Weifang | 22.25 | 0.556 | 0.107 | 0.062 | Yueyang | 25.13 | 0.513 | 0.086 | 0.046 |
| Yancheng | 22.20 | 0.541 | 0.102 | 0.052 | Huaian | 24.91 | 0.479 | 0.082 | 0.047 |
| Tai’an | 22.14 | 0.515 | 0.097 | 0.047 | Puyang | 24.75 | 0.651 | 0.111 | 0.064 |
| Pingdingshan | 22.13 | 0.714 | 0.139 | 0.11 | Ma’anShan | 24.40 | 0.498 | 0.089 | 0.063 |
| Fuzhou | 22.12 | 0.514 | 0.103 | 0.075 | Anqing | 23.90 | 0.583 | 0.102 | 0.061 |
| Puyang | 22.02 | 0.58 | 0.113 | 0.073 | Yuncheng | 23.88 | 0.702 | 0.122 | 0.071 |
| Jining | 21.96 | 0.488 | 0.093 | 0.042 | Tongling | 23.74 | 0.44 | 0.075 | 0.02 |
| Huaian | 21.78 | 0.519 | 0.098 | 0.046 | Heyuan | 23.62 | 0.656 | 0.116 | 0.061 |
| Longnan | 21.77 | 0.702 | 0.139 | 0.094 | Hechi | 23.60 | 0.694 | 0.126 | 0.082 |
| Jiayuguan | 21.74 | 0.87 | 0.136 | 0.082 | Qingyuan | 23.60 | 0.655 | 0.114 | 0.057 |
| Xianning | 21.58 | 0.654 | 0.134 | 0.102 | Hezhou | 23.54 | 0.654 | 0.115 | 0.055 |
| Wenzhou | 21.49 | 0.632 | 0.123 | 0.066 | Shaoguan | 22.94 | 0.675 | 0.123 | 0.071 |
| Linfen | 21.42 | 0.691 | 0.136 | 0.084 | Pingxiang | 22.88 | 0.693 | 0.127 | 0.079 |
| Jiaxing | 21.25 | 0.483 | 0.099 | 0.062 | Chaozhou | 22.66 | 0.596 | 0.112 | 0.068 |
| Tianshui | 21.05 | 0.702 | 0.144 | 0.099 | Huludao | 22.65 | 0.612 | 0.116 | 0.073 |
| Taizhou | 20.95 | 0.446 | 0.086 | 0.022 | Zhangjiakou | 22.55 | 0.663 | 0.128 | 0.091 |
| Pingliang | 20.91 | 0.697 | 0.147 | 0.103 | Xiaogan | 22.33 | 0.657 | 0.126 | 0.088 |
| Jinzhong | 20.78 | 0.67 | 0.142 | 0.104 | Pingliang | 22.12 | 0.691 | 0.131 | 0.073 |
| Huludao | 20.62 | 0.665 | 0.138 | 0.085 | Guilin | 22.01 | 0.688 | 0.128 | 0.065 |
| Cangzhou | 20.57 | 0.605 | 0.131 | 0.104 | Lishui | 21.97 | 0.628 | 0.119 | 0.062 |
| Heyuan | 20.49 | 0.621 | 0.129 | 0.072 | Cangzhou | 21.91 | 0.592 | 0.116 | 0.075 |
| Loudi | 20.49 | 0.661 | 0.142 | 0.105 | Huzhou | 21.73 | 0.453 | 0.089 | 0.049 |
| Zhangjiakou | 20.33 | 0.726 | 0.15 | 0.102 | Bengbu | 21.68 | 0.516 | 0.104 | 0.065 |
| Dezhou | 20.04 | 0.557 | 0.122 | 0.08 | Tangshan | 21.67 | 0.637 | 0.137 | 0.128 |
| Yulin | 20.02 | 0.646 | 0.135 | 0.071 | Ankang | 21.59 | 0.72 | 0.144 | 0.1 |
| Huaibei | 19.98 | 0.512 | 0.113 | 0.073 | Shenyang | 21.37 | 0.577 | 0.115 | 0.062 |
| Huainan | 19.92 | 0.524 | 0.114 | 0.068 | Chenzhou | 21.11 | 0.621 | 0.123 | 0.067 |
| Datong | 19.89 | 0.71 | 0.155 | 0.109 | Linfen | 21.09 | 0.703 | 0.138 | 0.07 |
| Huaihua | 19.80 | 0.66 | 0.144 | 0.089 | Zhuzhou | 21.02 | 0.5 | 0.098 | 0.037 |
| Ezhou | 19.74 | 0.506 | 0.114 | 0.079 | Tianshui | 20.97 | 0.699 | 0.139 | 0.067 |
| Qingyang | 19.73 | 0.731 | 0.159 | 0.107 | Jinzhong | 20.87 | 0.72 | 0.146 | 0.087 |
| Hanzhong | 19.31 | 0.689 | 0.152 | 0.09 | Weifang | 20.69 | 0.46 | 0.092 | 0.034 |
| Yan’an | 19.28 | 0.622 | 0.141 | 0.1 | Shanwei | 20.53 | 0.587 | 0.122 | 0.072 |
| Lvliang | 19.26 | 0.741 | 0.163 | 0.109 | Fuxin | 20.53 | 0.684 | 0.145 | 0.107 |
| Wuhai | 19.20 | 0.8 | 0.229 | 0.368 | Chaoyang | 20.49 | 0.621 | 0.13 | 0.079 |
| Zaozhuang | 19.07 | 0.433 | 0.091 | 0.021 | Jinhua | 20.28 | 0.615 | 0.126 | 0.073 |
| Luohe | 19.01 | 0.594 | 0.146 | 0.123 | Xinzhou | 20.02 | 0.77 | 0.157 | 0.088 |
| Guigang | 18.82 | 0.607 | 0.133 | 0.058 | Qingyang | 19.92 | 0.687 | 0.144 | 0.075 |
| Jieyang | 18.75 | 0.625 | 0.139 | 0.074 | Dezhou | 19.79 | 0.521 | 0.111 | 0.06 |
| Hezhou | 18.58 | 0.619 | 0.142 | 0.072 | Xuchang | 19.50 | 0.453 | 0.093 | 0.019 |
| Nanping | 18.54 | 0.618 | 0.144 | 0.098 | Ulanqab | 19.32 | 0.773 | 0.153 | 0.08 |
| Shiyan | 18.16 | 0.673 | 0.162 | 0.104 | Laibin | 19.30 | 0.665 | 0.146 | 0.079 |
| Ningde | 17.98 | 0.666 | 0.156 | 0.092 | Shantou | 19.26 | 0.566 | 0.122 | 0.059 |
| Tieling | 17.89 | 0.688 | 0.164 | 0.114 | Xuancheng | 19.24 | 0.583 | 0.129 | 0.071 |
| Ma’anShan | 17.86 | 0.435 | 0.099 | 0.028 | Huaibei | 19.17 | 0.479 | 0.107 | 0.057 |
| Chaoyang | 17.57 | 0.703 | 0.16 | 0.076 | Nanping | 18.86 | 0.555 | 0.124 | 0.065 |
| Chaozhou | 17.55 | 0.585 | 0.143 | 0.079 | Zibo | 18.76 | 0.426 | 0.092 | 0.026 |
| Shanwei | 17.40 | 0.6 | 0.145 | 0.069 | Jiaozuo | 18.66 | 0.622 | 0.141 | 0.078 |
| Shantou | 17.40 | 0.6 | 0.145 | 0.076 | Huangshan | 18.50 | 0.487 | 0.111 | 0.053 |
| Fuxin | 17.31 | 0.641 | 0.157 | 0.089 | Chengde | 18.31 | 0.732 | 0.164 | 0.105 |
| Chengde | 16.70 | 0.726 | 0.167 | 0.072 | Xiangtan | 18.09 | 0.548 | 0.131 | 0.075 |
| Huangshi | 16.34 | 0.442 | 0.108 | 0.021 | Jincheng | 17.49 | 0.547 | 0.134 | 0.073 |
| Zhuzhou | 16.31 | 0.466 | 0.114 | 0.024 | Yunfu | 17.38 | 0.579 | 0.136 | 0.048 |
| Yueyang | 16.26 | 0.478 | 0.12 | 0.035 | Huangshan | 17.28 | 0.54 | 0.134 | 0.071 |
| Hebi | 16.16 | 0.539 | 0.146 | 0.083 | Suqian | 17.21 | 0.42 | 0.099 | 0.025 |
| Xianyang | 16.12 | 0.576 | 0.149 | 0.061 | Jinzhou | 17.06 | 0.656 | 0.164 | 0.101 |
| Rizhao | 16.07 | 0.459 | 0.118 | 0.045 | Chizhou | 17.00 | 0.472 | 0.12 | 0.065 |
| Huzhou | 16.05 | 0.411 | 0.104 | 0.026 | Wuzhou | 16.86 | 0.562 | 0.139 | 0.054 |
| Qinhuangdao | 15.96 | 0.665 | 0.172 | 0.094 | Ziyang | 16.41 | 0.684 | 0.163 | 0.056 |
| Jingmen | 15.89 | 0.53 | 0.145 | 0.08 | Lianyungang | 16.41 | 0.391 | 0.095 | 0.017 |
| Qingyuan | 15.80 | 0.632 | 0.162 | 0.066 | Fushun | 16.40 | 0.656 | 0.169 | 0.091 |
| Chenzhou | 15.54 | 0.576 | 0.157 | 0.081 | Baiyin | 16.30 | 0.741 | 0.176 | 0.081 |
| Hechi | 15.47 | 0.645 | 0.174 | 0.082 | Binzhou | 16.25 | 0.439 | 0.11 | 0.031 |
| Liuzhou | 15.45 | 0.533 | 0.144 | 0.065 | Qinhuangdao | 16.21 | 0.623 | 0.168 | 0.109 |
| Lishui | 15.42 | 0.617 | 0.173 | 0.113 | Zhangzhou | 16.13 | 0.448 | 0.114 | 0.036 |
| Zhanjiang | 15.38 | 0.615 | 0.163 | 0.065 | Siping | 16.00 | 0.696 | 0.173 | 0.091 |
| Bazhong | 15.23 | 0.609 | 0.168 | 0.072 | Datong | 15.86 | 0.69 | 0.181 | 0.098 |
| Huizhou | 15.16 | 0.474 | 0.126 | 0.039 | Tonghua | 15.83 | 0.688 | 0.174 | 0.067 |
| Taiyuan | 15.15 | 0.522 | 0.14 | 0.049 | Danton | 15.76 | 0.606 | 0.164 | 0.087 |
| Changzhi | 15.09 | 0.559 | 0.158 | 0.078 | Panjin | 15.56 | 0.623 | 0.173 | 0.109 |
| Langfang | 15.04 | 0.579 | 0.163 | 0.09 | Zhanjiang | 15.42 | 0.617 | 0.162 | 0.068 |
| Baoji | 15.03 | 0.557 | 0.151 | 0.052 | Zhongshan | 15.39 | 0.453 | 0.117 | 0.022 |
| Yunfu | 14.87 | 0.595 | 0.164 | 0.061 | Hebi | 15.29 | 0.437 | 0.118 | 0.036 |
| Jinzhou | 14.85 | 0.594 | 0.161 | 0.058 | Huizhou | 15.08 | 0.431 | 0.113 | 0.015 |
| Zunyi | 14.77 | 0.671 | 0.181 | 0.08 | Langfang | 15.07 | 0.558 | 0.157 | 0.082 |
| Suihua | 14.77 | 0.671 | 0.189 | 0.124 | Yan’an | 15.07 | 0.603 | 0.165 | 0.075 |
| Jinhua | 14.63 | 0.43 | 0.117 | 0.021 | Luohe | 15.05 | 0.418 | 0.113 | 0.03 |
| Wuhu | 14.55 | 0.416 | 0.115 | 0.024 | Xi’an | 14.96 | 0.554 | 0.145 | 0.031 |
| Anshun | 14.25 | 0.648 | 0.187 | 0.082 | Guiyang | 14.80 | 0.617 | 0.168 | 0.065 |
| Shaoguan | 14.24 | 0.57 | 0.168 | 0.079 | Jiujiang | 14.75 | 0.434 | 0.12 | 0.034 |
| Jiaozuo | 14.24 | 0.419 | 0.116 | 0.016 | Luoyang | 14.53 | 0.454 | 0.124 | 0.02 |
| Nanchong | 14.02 | 0.667 | 0.195 | 0.094 | Xianyang | 14.45 | 0.556 | 0.151 | 0.029 |
| Danton | 13.90 | 0.632 | 0.183 | 0.07 | Jingmen | 14.43 | 0.437 | 0.119 | 0.016 |
| Tongchuan | 13.63 | 0.619 | 0.2 | 0.12 | Chuzhou | 14.37 | 0.378 | 0.104 | 0.016 |
| Taizhou | 13.50 | 0.54 | 0.169 | 0.08 | Baoji | 14.30 | 0.572 | 0.157 | 0.038 |
| Guangyuan | 13.46 | 0.673 | 0.202 | 0.073 | Dazhou | 14.24 | 0.678 | 0.188 | 0.075 |
| Wuwei | 13.41 | 0.789 | 0.226 | 0.115 | Rizhao | 14.21 | 0.431 | 0.124 | 0.037 |
| Longyan | 13.39 | 0.432 | 0.128 | 0.023 | Daqing | 14.17 | 0.833 | 0.283 | 0.353 |
| Xuchang | 13.39 | 0.418 | 0.124 | 0.022 | Hanzhong | 14.13 | 0.589 | 0.167 | 0.048 |
| Sanming | 13.19 | 0.425 | 0.126 | 0.015 | Jiangmen | 13.91 | 0.449 | 0.129 | 0.025 |
| Jincheng | 12.99 | 0.433 | 0.134 | 0.025 | Zunyi | 13.81 | 0.657 | 0.179 | 0.042 |
| Siping | 12.98 | 0.649 | 0.216 | 0.131 | Anshan | 13.80 | 0.575 | 0.174 | 0.076 |
| Dazhou | 12.95 | 0.617 | 0.195 | 0.082 | Shiyan | 13.76 | 0.573 | 0.17 | 0.063 |
| Harbin | 12.91 | 0.615 | 0.199 | 0.087 | Anshun | 13.70 | 0.721 | 0.213 | 0.101 |
| Xiangtan | 12.90 | 0.445 | 0.135 | 0.02 | Maoming | 13.59 | 0.523 | 0.153 | 0.041 |
| Baiyin | 12.89 | 0.678 | 0.22 | 0.11 | Qinzhou | 13.59 | 0.566 | 0.179 | 0.091 |
| Hohhot | 12.65 | 0.633 | 0.222 | 0.17 | Liaoyang | 13.53 | 0.644 | 0.195 | 0.084 |
| Luoyang | 12.31 | 0.44 | 0.141 | 0.024 | Tongchuan | 13.47 | 0.586 | 0.172 | 0.04 |
| Zhangzhou | 12.30 | 0.424 | 0.137 | 0.028 | Baise | 13.34 | 0.702 | 0.211 | 0.089 |
| Anshan | 12.27 | 0.533 | 0.19 | 0.112 | Quang’an | 13.32 | 0.74 | 0.21 | 0.086 |
| Qiqihar | 12.13 | 0.639 | 0.222 | 0.121 | Yingtan | 13.25 | 0.414 | 0.126 | 0.026 |
| Yangquan | 11.84 | 0.474 | 0.165 | 0.051 | Changchun | 12.98 | 0.764 | 0.271 | 0.267 |
| Guilin | 11.60 | 0.527 | 0.182 | 0.052 | Zhaotong | 12.98 | 0.721 | 0.192 | 0.052 |
| Putian | 11.49 | 0.547 | 0.19 | 0.066 | Taizhou | 12.95 | 0.498 | 0.159 | 0.064 |
| Yingtan | 11.16 | 0.465 | 0.177 | 0.071 | Zhaoqing | 12.79 | 0.474 | 0.146 | 0.029 |
| Quang’an | 11.00 | 0.611 | 0.227 | 0.092 | Harbin | 12.78 | 0.639 | 0.2 | 0.083 |
| Laibin | 10.79 | 0.568 | 0.216 | 0.082 | Chongzuo | 12.77 | 0.638 | 0.205 | 0.076 |
| Qinzhou | 10.69 | 0.594 | 0.219 | 0.062 | Yingkou | 12.68 | 0.528 | 0.174 | 0.067 |
| Sanmenxia | 10.52 | 0.457 | 0.169 | 0.021 | Liupanshui | 12.64 | 0.743 | 0.229 | 0.134 |
| Tonghua | 10.46 | 0.615 | 0.251 | 0.128 | Qiqihar | 12.59 | 0.699 | 0.204 | 0.062 |
| Zhaoqing | 10.27 | 0.446 | 0.169 | 0.023 | Ningde | 12.51 | 0.417 | 0.132 | 0.02 |
| Binzhou | 10.25 | 0.342 | 0.13 | 0.01 | Changzhi | 12.46 | 0.445 | 0.143 | 0.027 |
| Liupanshui | 10.24 | 0.64 | 0.257 | 0.115 | Nanchong | 12.25 | 0.681 | 0.213 | 0.084 |
| Jiangmen | 10.20 | 0.425 | 0.164 | 0.027 | Wenzhou | 12.00 | 0.6 | 0.204 | 0.08 |
| Maoming | 10.19 | 0.51 | 0.198 | 0.05 | Guangyuan | 11.85 | 0.624 | 0.211 | 0.076 |
| Benxi | 10.13 | 0.482 | 0.189 | 0.053 | Lvliang | 11.33 | 0.708 | 0.23 | 0.056 |
| Pingxiang | 10.10 | 0.439 | 0.177 | 0.049 | Nanning | 11.08 | 0.482 | 0.173 | 0.04 |
| Suining | 9.98 | 0.587 | 0.229 | 0.051 | Wuhai | 11.07 | 0.791 | 0.374 | 0.445 |
| Nanning | 9.97 | 0.475 | 0.185 | 0.03 | Yangjiang | 11.05 | 0.502 | 0.19 | 0.074 |
| Lanzhou | 9.45 | 0.675 | 0.271 | 0.085 | Putian | 10.62 | 0.408 | 0.152 | 0.024 |
| Mianyang | 9.24 | 0.66 | 0.268 | 0.064 | Neijiang | 10.59 | 0.623 | 0.237 | 0.089 |
| Baicheng | 9.17 | 0.611 | 0.271 | 0.106 | Tieling | 10.54 | 0.555 | 0.209 | 0.062 |
| Wuzhou | 9.13 | 0.435 | 0.191 | 0.043 | Sanmenxia | 10.44 | 0.497 | 0.189 | 0.039 |
| Guiyang | 9.04 | 0.532 | 0.232 | 0.056 | Liuzhou | 10.38 | 0.472 | 0.175 | 0.022 |
| Yingkou | 8.93 | 0.425 | 0.189 | 0.039 | Suining | 10.26 | 0.604 | 0.233 | 0.071 |
| Neijiang | 8.82 | 0.63 | 0.273 | 0.068 | Meishan | 10.18 | 0.727 | 0.266 | 0.077 |
| Yibin | 8.47 | 0.706 | 0.304 | 0.089 | Yangquan | 10.17 | 0.462 | 0.185 | 0.053 |
| Luzhou | 8.45 | 0.603 | 0.27 | 0.06 | Weinan | 10.12 | 0.595 | 0.225 | 0.021 |
| Ziyang | 8.24 | 0.588 | 0.276 | 0.063 | Songyuan | 10.05 | 0.628 | 0.234 | 0.079 |
| Liaoyang | 8.14 | 0.428 | 0.21 | 0.046 | Deyang | 9.69 | 0.606 | 0.236 | 0.077 |
| Yangjiang | 7.68 | 0.427 | 0.22 | 0.043 | Benxi | 9.54 | 0.477 | 0.199 | 0.041 |
| Baise | 7.67 | 0.548 | 0.278 | 0.069 | Baicheng | 8.88 | 0.592 | 0.248 | 0.051 |
| Shuozhou | 7.39 | 0.435 | 0.232 | 0.053 | Beihai | 8.78 | 0.439 | 0.194 | 0.032 |
| Heihe | 7.19 | 0.599 | 0.315 | 0.052 | Liaoyuan | 8.40 | 0.56 | 0.255 | 0.035 |
| Panzhihua | 7.05 | 0.783 | 0.388 | 0.229 | Luzhou | 8.34 | 0.596 | 0.272 | 0.064 |
| Yichun | 7.04 | 0.586 | 0.325 | 0.082 | Zhangye | 8.27 | 0.919 | 0.223 | 0.052 |
| Changchun | 7.00 | 0.5 | 0.304 | 0.134 | Shuozhou | 8.00 | 0.5 | 0.24 | 0.047 |
| Chongzuo | 6.84 | 0.526 | 0.3 | 0.073 | Lanzhou | 7.95 | 0.611 | 0.289 | 0.075 |
| Zhaotong | 6.64 | 0.604 | 0.329 | 0.059 | Fangchenggang | 7.83 | 0.435 | 0.216 | 0.035 |
| Fangchenggang | 6.38 | 0.425 | 0.257 | 0.049 | Guyuan | 7.69 | 0.641 | 0.321 | 0.078 |
| Beihai | 5.80 | 0.415 | 0.273 | 0.038 | Mianyang | 7.69 | 0.513 | 0.253 | 0.047 |
| Leshan | 5.80 | 0.725 | 0.381 | 0.08 | Jilin | 7.66 | 0.589 | 0.273 | 0.045 |
| Zhangye | 5.50 | 0.786 | 0.429 | 0.1 | Zigong | 7.32 | 0.563 | 0.295 | 0.059 |
| Deyang | 5.50 | 0.5 | 0.335 | 0.047 | Yibin | 7.22 | 0.556 | 0.294 | 0.057 |
| Fushun | 5.34 | 0.381 | 0.271 | 0.035 | Tongliao | 7.13 | 0.509 | 0.271 | 0.031 |
| Qujing | 5.31 | 0.759 | 0.4 | 0.132 | Mudanjiang | 6.96 | 0.58 | 0.317 | 0.069 |
| Kiamusi | 5.18 | 0.576 | 0.402 | 0.063 | Jinchang | 6.65 | 0.832 | 0.326 | 0.103 |
| Zhongwei | 5.17 | 0.646 | 0.481 | 0.2 | Sining | 5.73 | 0.716 | 0.421 | 0.146 |
| Haikou | 5.00 | 0.455 | 0.351 | 0.072 | Ya’an | 5.67 | 0.708 | 0.456 | 0.152 |
| Meishan | 4.94 | 0.706 | 0.451 | 0.056 | Haikou | 5.50 | 0.458 | 0.334 | 0.094 |
| Jilin | 4.65 | 0.422 | 0.351 | 0.073 | Suihua | 5.27 | 0.479 | 0.337 | 0.064 |
| Zigong | 4.64 | 0.58 | 0.447 | 0.112 | Baotou | 5.18 | 0.576 | 0.454 | 0.185 |
| Guyuan | 4.40 | 0.489 | 0.425 | 0.084 | Leshan | 4.17 | 0.521 | 0.43 | 0.067 |
| Qitaihe | 4.28 | 0.535 | 0.453 | 0.055 | Qitaihe | 4.07 | 0.582 | 0.536 | 0.15 |
| Mudanjiang | 4.10 | 0.512 | 0.458 | 0.071 | Chifeng | 4.05 | 0.506 | 0.449 | 0.051 |
| Ya’an | 4.07 | 0.679 | 0.49 | 0.096 | Heihe | 3.80 | 0.76 | 0.451 | 0.056 |
| Chifeng | 3.89 | 0.487 | 0.421 | 0.028 | Zhongwei | 3.75 | 0.75 | 0.557 | 0.187 |
| Songyuan | 3.68 | 0.408 | 0.39 | 0.038 | Yichun | 3.71 | 0.531 | 0.536 | 0.095 |
| Liaoyuan | 3.67 | 0.367 | 0.378 | 0.053 | Shuangyashan | 3.50 | 0.875 | 0.406 | 0.055 |
| Jixi | 3.57 | 0.595 | 0.546 | 0.031 | Yinchuan | 3.25 | 0.542 | 0.587 | 0.158 |
| Ulanqab | 3.50 | 0.583 | 0.516 | 0.036 | Baishan | 3.20 | 0.64 | 0.737 | 0.245 |
| Wuzhong | 3.33 | 0.556 | 0.59 | 0.16 | Hegang | 3.20 | 0.64 | 0.737 | 0.245 |
| Baishan | 3.00 | 0.6 | 0.612 | 0.057 | Jixi | 3.20 | 0.64 | 0.737 | 0.245 |
| Hegang | 3.00 | 0.6 | 0.612 | 0.057 | Kiamusi | 3.20 | 0.64 | 0.737 | 0.245 |
| Jinchang | 2.72 | 0.544 | 0.612 | 0.057 | Panzhihua | 3.17 | 0.792 | 0.573 | 0.087 |
| Lijiang | 2.70 | 0.675 | 0.673 | 0.071 | Kunming | 3.14 | 0.786 | 0.542 | 0.05 |
| Tongliao | 2.42 | 0.346 | 0.495 | 0.035 | Wuwei | 3.07 | 0.614 | 0.537 | 0.011 |
| Shuangyashan | 2.29 | 0.457 | 0.651 | 0.04 | Lijiang | 2.90 | 0.725 | 0.69 | 0.162 |
| Sining | 2.00 | 1 | 0.5 | 0 | Shizuishan | 2.43 | 0.486 | 0.666 | 0.082 |
| Yinchuan | 1.64 | 0.411 | 0.781 | 0.075 | Hohhot | 2.40 | 0.4 | 0.561 | 0.039 |
| Shizuishan | 1.60 | 0.533 | 0.933 | 0.151 | Qujing | 2.13 | 0.708 | 0.797 | 0.057 |
| Sanya | 1.57 | 0.262 | 0.607 | 0.04 | Sanya | 2.13 | 0.304 | 0.527 | 0.04 |
| Hulunbuir | 1 | 1 | 1 | 1 | Hulunbuir | 2 | 1 | 0.5 | 0 |
| Jiuquan | 1 | 1 | 1 | 1 | Jiayuguan | 2 | 1 | 0.556 | 0.278 |
| Karamay | 1 | 1 | 1 | 1 | Jiuquan | 2 | 1 | 0.5 | 0 |
| Kunming | 1 | 1 | 1 | 1 | Baoshan | 1 | 1 | 1 | 1 |
| Urumqi | 1 | 1 | 1 | 1 | Karamay | 1 | 1 | 1 | 1 |
| Baoshan | 1 | 0.5 | 1.389 | 0 | Lincang | 1 | 0.5 | 1.389 | 0 |
| Lincang | 1 | 0.5 | 1.389 | 0 | Urumqi | 1 | 1 | 1 | 1 |
| Lhasa | 0 | 0 | 0 | 0 | Lhasa | 0 | 0 | 0 | 0 |
| Yuxi | 0 | 0 | 0 | 0 | Yuxi | 0 | 0 | 0 | 0 |
| Mean value | 28.35 | 0.628 | 0.202 | 0.112 | Mean value | 30.03 | 0.642 | 0.187 | 0.097 |
| City | Regional Classification | Seven Regional Classification | Block Type |
|---|---|---|---|
| Ankang | Western region | Northwest | Block I |
| Anqing | Central region | East China | Block I |
| Anshun | Western region | Southwest | Block II |
| Anyang | Central region | Central China | Block I |
| Anshan | Eastern region | Northeast | Block I |
| Bazhong | Western region | Southwest | Block II |
| Baicheng | Central region | Northeast | Block II |
| Baishan | Central region | Northeast | Block II |
| Baiyin | Western region | Northwest | Block II |
| Baise | Western region | South China | Block II |
| Bengbu | Central region | East China | Block III |
| Baotou | Western region | North China | Block II |
| Baoji | Western region | Northwest | Block I |
| Baoding | Eastern region | North China | Block II |
| Baoshan | Western region | Southwest | Block II |
| Beihai | Western region | South China | Block III |
| Beijing | Eastern region | North China | Block II |
| Benxi | Eastern region | Northeast | Block I |
| Binzhou | Eastern region | East China | Block I |
| Bozhou | Central region | East China | Block I |
| Cangzhou | Eastern region | North China | Block IV |
| Changzhou | Eastern region | East China | Block I |
| Chaoyang | Eastern region | Northeast | Block I |
| Chaozhou | Eastern region | South China | Block II |
| Chenzhou | Central region | Central China | Block I |
| Chengdu | Western region | Southwest | Block I |
| Chengde | Eastern region | North China | Block II |
| Chizhou | Central region | East China | Block I |
| Chifeng | Western region | North China | Block I |
| Chongzuo | Western region | South China | Block II |
| Chuzhou | Central region | East China | Block III |
| Dazhou | Western region | Southwest | Block II |
| Dalian | Eastern region | Northeast | Block I |
| Daqing | Central region | Northeast | Block I |
| Datong | Central region | North China | Block II |
| Danton | Eastern region | Northeast | Block I |
| Deyang | Western region | Southwest | Block II |
| Dezhou | Eastern region | East China | Block IV |
| Dingxi | Western region | Northwest | Block III |
| Dongguan | Eastern region | South China | Block III |
| Dongying | Eastern region | East China | Block IV |
| Ordos | Western region | North China | Block II |
| Ezhou | Central region | Central China | Block IV |
| Fangchenggang | Western region | South China | Block IV |
| Foshan | Eastern region | South China | Block I |
| Fuzhou | Eastern region | East China | Block I |
| Fushun | Eastern region | Northeast | Block I |
| Fuzhou | Central region | East China | Block I |
| Fuxin | Eastern region | Northeast | Block I |
| Fuyang | Central region | East China | Block II |
| Ganzhou | Central region | East China | Block II |
| Guyuan | Western region | Northwest | Block II |
| Quang’an | Western region | Southwest | Block IV |
| Guangyuan | Western region | Southwest | Block I |
| Guangzhou | Eastern region | South China | Block II |
| Guigang | Western region | South China | Block I |
| Guiyang | Western region | Southwest | Block I |
| Guilin | Western region | South China | Block II |
| Harbin | Central region | Northeast | Block I |
| Haikou | Eastern region | South China | Block II |
| Handan | Eastern region | North China | Block IV |
| Hanzhong | Western region | Northwest | Block I |
| Hangzhou | Eastern region | East China | Block III |
| Hefei | Central region | East China | Block I |
| Hechi | Western region | South China | Block I |
| Heyuan | Eastern region | South China | Block I |
| Heze | Eastern region | East China | Block I |
| Hezhou | Western region | South China | Block I |
| Hebi | Central region | Central China | Block II |
| Hegang | Central region | Northeast | Block II |
| Heihe | Central region | Northeast | Block I |
| Hengshui | Eastern region | North China | Block I |
| Hengyang | Central region | Central China | Block II |
| Hohhot | Western region | North China | Block II |
| Hulunbuir | Western region | North China | Block I |
| Huludao | Eastern region | Northeast | Block III |
| Huzhou | Eastern region | East China | Block I |
| Huaihua | Central region | Central China | Block III |
| Huai’an | Eastern region | East China | Block I |
| Huaibei | Central region | East China | Block I |
| Huainan | Central region | East China | Block I |
| Huanggang | Central region | Central China | Block I |
| Huangshan | Central region | East China | Block I |
| Huangshi | Central region | Central China | Block I |
| Huizhou | Eastern region | South China | Block II |
| Jixi | Central region | Northeast | Block I |
| Ji’an | Central region | East China | Block II |
| Jilin | Central region | Northeast | Block III |
| Jinan | Eastern region | East China | Block I |
| Jining | Eastern region | East China | Block II |
| Kiamusi | Central region | Northeast | Block III |
| Jiaxing | Eastern region | East China | Block II |
| Jiayuguan | Western region | Northwest | Block I |
| Jiangmen | Eastern region | South China | Block I |
| Jiaozuo | Central region | Central China | Block I |
| Jieyang | Eastern region | South China | Block II |
| Jinchang | Western region | Northwest | Block I |
| Jinhua | Eastern region | East China | Block I |
| Jinzhou | Eastern region | Northeast | Block I |
| Jincheng | Central region | North China | Block I |
| Jinzhong | Central region | North China | Block I |
| Jingmen | Central region | Central China | Block I |
| Jingzhou | Central region | Central China | Block II |
| Jiujiang | Central region | East China | Block I |
| Jiuquan | Western region | Northwest | Block II |
| Kaifeng | Central region | Central China | Block II |
| Karamay | Western region | Northwest | Block III |
| Kunming | Western region | Southwest | Block I |
| Lhasa | Western region | Southwest | Block II |
| Laibin | Western region | South China | Block I |
| Lanzhou | Western region | Northwest | Block II |
| Langfang | Eastern region | North China | Block II |
| Leshan | Western region | Southwest | Block I |
| Lijiang | Western region | Southwest | Block I |
| Lishui | Eastern region | East China | Block I |
| Lianyungang | Eastern region | East China | Block II |
| Liaoyang | Eastern region | Northeast | Block I |
| Liaoyuan | Central region | Northeast | Block II |
| Liaocheng | Eastern region | East China | Block I |
| Lincang | Western region | Southwest | Block I |
| Linfen | Central region | North China | Block II |
| Linyi | Eastern region | East China | Block I |
| Liuzhou | Western region | South China | Block II |
| Lu’an | Central region | East China | Block IV |
| Liupanshui | Western region | Southwest | Block II |
| Longyan | Eastern region | East China | Block I |
| Longnan | Western region | Northwest | Block II |
| Loudi | Central region | Central China | Block I |
| Luzhou | Western region | Southwest | Block I |
| Luoyang | Central region | Central China | Block II |
| Luohe | Central region | Central China | Block III |
| Lvliang | Central region | North China | Block I |
| Ma’anShan | Central region | East China | Block II |
| Maoming | Eastern region | South China | Block I |
| Meishan | Western region | Southwest | Block II |
| Meizhou | Eastern region | South China | Block II |
| Mianyang | Western region | Southwest | Block IV |
| Mudanjiang | Central region | Northeast | Block II |
| Nanchang | Central region | East China | Block IV |
| Nanchong | Western region | Southwest | Block I |
| Nanjing | Eastern region | East China | Block I |
| Nanning | Western region | South China | Block III |
| Nanping | Eastern region | East China | Block I |
| Nantong | Eastern region | East China | Block II |
| Nanyang | Central region | Central China | Block IV |
| Neijiang | Western region | Southwest | Block I |
| Ningbo | Eastern region | East China | Block II |
| Ningde | Eastern region | East China | Block II |
| Panzhihua | Western region | Southwest | Block I |
| Panjin | Eastern region | Northeast | Block II |
| Pingdingshan | Central region | Central China | Block I |
| Pingliang | Western region | Northwest | Block I |
| Pingxiang | Central region | East China | Block I |
| Putian | Eastern region | East China | Block III |
| Puyang | Central region | Central China | Block II |
| Qitaihe | Central region | Northeast | Block I |
| Qiqihar | Central region | Northeast | Block I |
| Qinzhou | Western region | South China | Block I |
| Qinhuangdao | Eastern region | North China | Block III |
| Qingdao | Eastern region | East China | Block I |
| Qingyuan | Eastern region | South China | Block II |
| Qingyang | Western region | Northwest | Block II |
| Qujing | Western region | Southwest | Block IV |
| Quanzhou | Eastern region | East China | Block I |
| Rizhao | Eastern region | East China | Block II |
| Sanmenxia | Central region | Central China | Block IV |
| Sanming | Eastern region | East China | Block II |
| Sanya | Eastern region | South China | Block IV |
| Xiamen | Eastern region | East China | Block I |
| Shantou | Eastern region | South China | Block I |
| Shanwei | Eastern region | South China | Block I |
| Shangluo | Western region | Northwest | Block I |
| Shangqiu | Central region | Central China | Block IV |
| Shanghai | Eastern region | East China | Block I |
| Shangrao | Central region | East China | Block I |
| Shaoguan | Eastern region | South China | Block I |
| Shaoyang | Central region | Central China | Block IV |
| Shaoxing | Eastern region | East China | Block IV |
| Shenzhen | Eastern region | South China | Block I |
| Shenyang | Eastern region | Northeast | Block I |
| Shiyan | Central region | Central China | Block I |
| Shijiazhuang | Eastern region | North China | Block II |
| Shizuishan | Western region | Northwest | Block II |
| Shuangyashan | Central region | Northeast | Block II |
| Shuozhou | Central region | North China | Block I |
| Siping | Central region | Northeast | Block II |
| Songyuan | Central region | Northeast | Block IV |
| Suzhou | Eastern region | East China | Block I |
| Suqian | Eastern region | East China | Block I |
| Suzhou | Central region | East China | Block II |
| Suihua | Central region | Northeast | Block I |
| Suizhou | Central region | Central China | Block II |
| Suining | Western region | Southwest | Block I |
| Taizhou | Eastern region | East China | Block III |
| Taiyuan | Central region | North China | Block I |
| Tai’an | Eastern region | East China | Block III |
| Taizhou | Eastern region | East China | Block III |
| Tangshan | Eastern region | North China | Block III |
| Tianjin | Eastern region | North China | Block II |
| Tianshui | Western region | Northwest | Block II |
| Tieling | Eastern region | Northeast | Block I |
| Tonghua | Central region | Northeast | Block I |
| Tongliao | Western region | North China | Block II |
| Tongchuan | Western region | Northwest | Block I |
| Tongling | Central region | East China | Block I |
| Weihai | Eastern region | East China | Block III |
| Weifang | Eastern region | East China | Block I |
| Weinan | Western region | Northwest | Block II |
| Wenzhou | Eastern region | East China | Block I |
| Wuhai | Western region | North China | Block III |
| Ulanqab | Western region | North China | Block I |
| Urumqi | Western region | Northwest | Block II |
| Wuxi | Eastern region | East China | Block III |
| Wuhu | Central region | East China | Block III |
| Wuzhong | Western region | Northwest | Block I |
| Wuzhou | Western region | South China | Block I |
| Wuhan | Central region | Central China | Block IV |
| Wuwei | Western region | Northwest | Block II |
| Xi’an | Western region | Northwest | Block II |
| Sining | Western region | Northwest | Block II |
| Xianning | Central region | Central China | Block I |
| Xianyang | Western region | Northwest | Block II |
| Xiangtan | Central region | Central China | Block II |
| Xiaogan | Central region | Central China | Block I |
| Xinzhou | Central region | North China | Block I |
| Xinxiang | Central region | Central China | Block I |
| Xinyu | Central region | East China | Block IV |
| Xinyang | Central region | Central China | Block I |
| Xingtai | Eastern region | North China | Block I |
| Xuzhou | Eastern region | East China | Block III |
| Xuchang | Central region | Central China | Block I |
| Xuancheng | Central region | East China | Block I |
| Ya’an | Western region | Southwest | Block II |
| Yantai | Eastern region | East China | Block III |
| Yan’an | Western region | Northwest | Block II |
| Yancheng | Eastern region | East China | Block III |
| Yangzhou | Eastern region | East China | Block III |
| Yangjiang | Eastern region | South China | Block I |
| Yangquan | Central region | North China | Block II |
| Yichun | Central region | Northeast | Block II |
| Yibin | Western region | Southwest | Block II |
| Yichang | Central region | Central China | Block IV |
| Yichun | Central region | East China | Block I |
| Yiyang | Central region | Central China | Block I |
| Yinchuan | Western region | Northwest | Block II |
| Yingtan | Central region | East China | Block I |
| Yingkou | Eastern region | Northeast | Block I |
| Yongzhou | Central region | Central China | Block I |
| Yulin | Western region | Northwest | Block III |
| Yulin | Western region | South China | Block I |
| Yuxi | Western region | Southwest | Block III |
| Yueyang | Central region | Central China | Block I |
| Yunfu | Eastern region | South China | Block I |
| Yuncheng | Central region | North China | Block I |
| Zaozhuang | Eastern region | East China | Block I |
| Zhanjiang | Eastern region | South China | Block I |
| Zhangjiajie | Central region | Central China | Block I |
| Zhangjiakou | Eastern region | North China | Block I |
| Zhangye | Western region | Northwest | Block II |
| Zhangzhou | Eastern region | East China | Block I |
| Changchun | Central region | Northeast | Block II |
| Changsha | Central region | Central China | Block IV |
| Changzhi | Central region | North China | Block II |
| Zhaotong | Western region | Southwest | Block II |
| Zhaoqing | Eastern region | South China | Block I |
| Zhenjiang | Eastern region | East China | Block III |
| Zhengzhou | Central region | Central China | Block III |
| Zhongshan | Eastern region | South China | Block I |
| Zhongwei | Western region | Northwest | Block II |
| Chongqing | Western region | Southwest | Block II |
| Zhoushan | Eastern region | East China | Block III |
| Zhoukou | Central region | Central China | Block I |
| Zhuhai | Eastern region | South China | Block IV |
| Zhuzhou | Central region | Central China | Block I |
| Zhumadian | Central region | Central China | Block I |
| Ziyang | Western region | Southwest | Block II |
| Zibo | Eastern region | East China | Block III |
| Zigong | Western region | Southwest | Block II |
| Zunyi | Western region | Southwest | Block I |
References
- The Report at the 20th National Congress of the Communist Party of China. Available online: https://www.gov.cn/xinwen/2022-10/25/content_5721685.htm (accessed on 27 February 2025).
- Li, Z.; Yao, L.; Wang, M.; Wei, G.; Sun, P. Does the digital economy catalyze the emergence of urban shrinkage?—Empirical evidence from Chinese prefecture-level cities. Cities 2024, 154, 105363. [Google Scholar] [CrossRef]
- Chen, Z.; Xing, R. Digital economy, green innovation and high-quality economic development. Int. Rev. Econ. 2025, 99, 104029. [Google Scholar] [CrossRef]
- Oghazi, P.; Mostaghel, R.; Hultman, M. International industrial manufacturers: Mastering the era of digital innovation and circular economy. Technol. Forecast. Soc. Change 2024, 201, 123160. [Google Scholar] [CrossRef]
- Okpalaoka, C.I. Research on the digital economy: Developing trends and future directions. Technol. Forecast. Soc. Change 2023, 193, 122635. [Google Scholar] [CrossRef]
- Duc, D.T.V.; Dat, T.T.; Linh, D.H.; Phong, B.X. Measuring the digital economy in Vietnam. Telecommun. Policy 2024, 48, 102683. [Google Scholar] [CrossRef]
- Du, M.; Huang, Y.; Dong, H.; Zhou, X.; Wang, Y. The measurement, sources of variation, and factors influencing the coupled and coordinated development of rural revitalization and digital economy in China. PLoS ONE 2022, 17, e0277910. [Google Scholar] [CrossRef]
- Li, Z.; Liu, Y. Research on the Spatial Distribution Pattern and Influencing Factors of Digital Economy Development in China. IEEE Access 2021, 9, 63094–63106. [Google Scholar] [CrossRef]
- Autor, D.; Dorn, D.; Hanson, G. On the Geography of Trade: Distance and the IT Revolution. Am. Econ. Rev. Insight 2020, 2, 333–350. [Google Scholar]
- Tapscott, D. The Digital Economy: Promise and Peril in the Age of Networked Intelligence; Mc Graw-Hill: New York, NY, USA, 1996. [Google Scholar]
- Ma, D.; Zhu, Q. Innovation in emerging economies: Research on the digital economy driving high-quality green development. J. Bus. Res. 2022, 145, 801–813. [Google Scholar] [CrossRef]
- Wang, L.; Chen, L. Impacts of digital economy agglomeration on carbon emission: A two-tier stochastic frontier and spatial decomposition analysis of China. Sustain. Cities Soc. 2023, 95, 104624. [Google Scholar] [CrossRef]
- Wang, L.; Chen, Y.; Ramsey, T.S.; Hewings, G.J.D. Will researching digital technology really empower green development? Technol. Soc. 2021, 66, 101638. [Google Scholar] [CrossRef]
- Li, L.; Hong, X.; Peng, K. A spatial panel analysis of carbon emissions, economic growth and high-technology industry in China. Struct. Change Econ. Dyn. 2019, 49, 83–92. [Google Scholar] [CrossRef]
- Bai, C.; Zhou, L.; Xia, M.; Feng, C. Analysis of the spatial association network structure of China’s transportation carbon emissions and its driving factors. J. Environ. Manag. 2020, 253, 109765. [Google Scholar] [CrossRef]
- Crespo Cuaresma, J.; Lutz, S.U. Modelling and projecting digital trends in European regions: An econometric framework. Reg. Stud. 2021, 55, 1696–1710. [Google Scholar] [CrossRef]
- Avom, D.; Nkengfack, H.; Fotio, H.K.; Totouom, A. ICT and environmental quality in Sub-Saharan Africa: Effects and transmission channels. Technol. Forecast. Soc. Change 2020, 155, 120028. [Google Scholar] [CrossRef]
- Dewan, S.; Kraemer, K.L. Information Technology and Productivity: Evidence from Country-Level Data. Manage. Sci. 2000, 46, 548–562. [Google Scholar] [CrossRef]
- Ghimire, A.; Ali, S.; Long, X.; Chen, L.; Sun, J. Effect of Digital Silk Road and innovation heterogeneity on digital economy growth across 29 countries: New evidence from PSM-DID. Technol. Forecast. Soc. Change 2024, 198, 122987. [Google Scholar] [CrossRef]
- Rammer, C.; Fernández, G.P.; Czarnitzki, D. Artificial intelligence and industrial innovation: Evidence from German firm-level data. Res. Policy 2022, 51, 104555. [Google Scholar] [CrossRef]
- Sun, Z.; Cheng, X.; Zhuang, Y.; Sun, Y. Spatial correlation network structure characteristics of carbon emission efficiency and its influencing factors at city level in China. Environ. Dev. Sustain. 2024, 26, 5335–5366. [Google Scholar] [CrossRef]
- Acemoglu, D.; Restrepo, P. Tasks, Automation, and the Rise in U.S. Wage Inequality. Econometrica 2022, 90, 1973–2016. [Google Scholar] [CrossRef]
- Yoo, Y.; Henfridsson, O.; Lyytinen, K. Research Commentary—The New Organizing Logic of Digital Innovation: An Agenda for Information Systems Research. Inform. Syst. Res. 2010, 21, 724–735. [Google Scholar] [CrossRef]
- Li, Z.; Yu, K.; Zhong, J.; Yang, J.; Zhang, D.; Zhu, J. Spatial correlation network characteristics and influencing factors of water environmental efficiency in three major urban agglomerations in the Yangtze River Basin, China. Sustain. Cities Soc. 2024, 104, 105311. [Google Scholar] [CrossRef]
- Autor, D.H. Why Are There Still So Many Jobs? The History and Future of Workplace Automation. J. Econ. Perspect. 2015, 29, 3–30. [Google Scholar] [CrossRef]
- Zhang, Y.; Hainan, L.; Feng, F.; Wu, X. Digital economy, education, human capital and urban-rural income disparity. Financ. Res. Lett. 2025, 71, 106464. [Google Scholar] [CrossRef]
- Wang, H.; Ge, Q. Spatial association network of economic resilience and its influencing factors: Evidence from 31 Chinese provinces. Humanit. Soc. Sci. Commun. 2023, 10, 290. [Google Scholar] [CrossRef]
- Song, S.; Wen, J.; Li, Y.; Li, L. How does digital economy affect green technological innovation in China? New evidence from the “Broadband China” policy. Econ. Anal. Policy 2024, 81, 1093–1112. [Google Scholar] [CrossRef]
- García-Murillo, M.; MacInnes, I. Digital Divide and Market Forces: A Global Analysis. Telecommun. Policy 2021, 45, 102183. [Google Scholar]
- Fingleton, B. Spatial econometrics and economic geography. J. Reg. Sci. 2011, 51, 172–191. [Google Scholar]
- Dilworth, E.; Tranos, E.; Lawson, D.J. Assessing geographic polarisation in Britain’s digital landscape through stable dynamic embedding of spatial web data. EPJ Data Sci. 2025, 14, 19. [Google Scholar] [CrossRef]
- Tang, L.; Lu, B.; Tian, T. Spatial Correlation Network and Regional Differences for the Development of Digital Economy in China. Entropy 2021, 23, 1575. [Google Scholar] [CrossRef]
- Zhu, W.; Chen, J. The spatial analysis of digital economy and urban development: A case study in Hangzhou, China. Cities 2022, 123, 1035633. [Google Scholar] [CrossRef]
- Zhang, H.; Li, X.; Luo, Y.; Chen, L.; Wang, M. Spatial heterogeneity and driving mechanisms of carbon storage in the urban agglomeration within complex terrain: Multi-scale analyses under localized SSP-RCP narratives. Sustain. Cities Soc. 2024, 109, 105520. [Google Scholar] [CrossRef]
- Li, X.; Zhang, Y.; Zhou, S.; Zhao, Z.; Zhao, Y. Exploration and future trends on spatial correlation of green innovation efficiency in strategic emerging industries under the digital economy: A social network analysis. J. Environ. Manag. 2024, 359, 121005. [Google Scholar] [CrossRef] [PubMed]
- Zhang, F.; Wu, X.; Zhou, W.; Fu, N. Research on the green innovation effect of digital economy network—Empirical evidence from the manufacturing industry in the Yangtze River Delta. Environ. Technol. Innov. 2024, 34, 103595. [Google Scholar] [CrossRef]
- Chen, S.; Zhang, Y.; Zhang, Y.; Liu, Z. The relationship between industrial restructuring and China’s regional haze pollution: A spatial spillover perspective. J. Clean. Prod. 2019, 239, 115808. [Google Scholar] [CrossRef]
- Liu, S.; Xiao, Q. An empirical analysis on spatial correlation investigation of industrial carbon emissions using SNA-ICE model. Energy 2021, 224, 120183. [Google Scholar] [CrossRef]
- Camacho, D.; Panizo-Lledot, Á.; Bello-Orgaz, G.; Gonzalez-Pardo, A.; Cambria, E. The four dimensions of social network analysis: An overview of research methods, applications, and software tools. Inf. Fusion 2020, 63, 88–120. [Google Scholar] [CrossRef]
- Xu, H.; Li, Y.; Zheng, Y.; Xu, X. Analysis of spatial associations in the energy–carbon emission efficiency of the transportation industry and its influencing factors: Evidence from China. Environ. Impact Asses. Rev. 2022, 97, 106905. [Google Scholar] [CrossRef]
- Cheng, H.; Wu, B.; Jiang, X. Study on the spatial network structure of energy carbon emission efficiency and its driving factors in Chinese cities. Appl. Energy 2024, 371, 123689. [Google Scholar] [CrossRef]
- Bai, R.; Lin, B. An in-depth analysis of green innovation efficiency: New evidence based on club convergence and spatial correlation network. Energy Econ. 2024, 132, 107424. [Google Scholar] [CrossRef]
- Zhang, H.; Jiang, L.; Zhou, J.; Chu, N.; Li, F. The characteristics and influencing factors of spatial network of city-based innovation correlation in China: From the perspective of high tech zones. Sci. Rep. 2023, 13, 16289. [Google Scholar] [CrossRef] [PubMed]
- Tian, J.; Meng, Z. Study on the effect of digital economy development on carbon emissions: Evidence from 30 provinces in China. Environ. Sci. Pollut. Res. 2023, 30, 126088–126103. [Google Scholar] [CrossRef] [PubMed]
- Guo, Z.; Ho, C.S.; Ling, G.H.T.; Rashid, M.F. Spatial spillover heterogeneity and moderated effects of the digital economy on agricultural carbon emissions: Evidence from 30 Chinese provinces. Environ. Dev. Sustain. 2025, 1–31. [Google Scholar] [CrossRef]
- Goldfarb, A.; Tucker, C. Digital Economics. J. Econ. Lit. 2019, 57, 3–43. [Google Scholar] [CrossRef]


| Indicator | Calculation Formula | Formula Description | Indicator Meaning |
|---|---|---|---|
| Network Density | Actual number of relationships/Maximum possible total number of relationships | The higher the density, the closer the spatial association relationships between cities. | |
| Network Connectivity | Degree to which any two members in the network are directly or indirectly reachable | Higher connectivity indicates stronger stability of the overall network structure. | |
| Network Hierarchy | Degree of asymmetric reachability among members in the network | Higher hierarchy indicates a more stringent network structure, with some cities having stronger dominant positions. | |
| Network Efficiency | Degree of redundancy in network connections | Lower efficiency indicates more spillover paths and a more stable network structure. | |
| Degree Centrality | Number of members directly connected to a member/Maximum possible number of direct connections | Higher degree centrality indicates stronger control of one city over others. | |
| Closeness Centrality | Sum of shortest distances from a member to all other members in the network | Higher closeness centrality means shorter distances between members, leading to closer association and collaboration. | |
| Betweenness Centrality | Extent to which a member acts as an intermediary for other members | Higher betweenness centrality indicates a more prominent intermediary role of a city in the network. |
| Variable | Observed Value | Mean Value | Standard Deviation | Minimum Value | Maximum Value |
|---|---|---|---|---|---|
| DEL | 2790 | 0.3341 | 0.113 | 0.07 | 0.80 |
| ECO | 2790 | 10.7886 | 0.562 | 9.01 | 13.06 |
| ISL | 2790 | 0.289 | 0.209 | 0.045 | 1.396 |
| UDL | 2790 | 5.7319 | 0.9585 | 0.6831 | 0.8019 |
| IDL | 2790 | 1.0889 | 0.6506 | 0.1679 | 7.4502 |
| EDU | 2790 | 6.6284 | 0.9135 | 3.8394 | 9.6397 |
| MAL | 2790 | 0.544 | 0.246 | 0.396 | 0.712 |
| TEL | 2790 | 0.003 | 0.003 | 0.000 | 0.063 |
| Block Type | Relationships Received | Relationships Overflow | Expected Internal Relationship % | Actual Internal Relationship % | Block Type Description | ||
|---|---|---|---|---|---|---|---|
| Internal | External | Internal | External | ||||
| Block I | 814 | 3777 | 814 | 3075 | 48.20 | 20.93 | Bidirectional Outflow |
| Block II | 306 | 960 | 306 | 358 | 31.29 | 40.08 | Net Beneficiary |
| Block III | 208 | 1587 | 208 | 1969 | 11.51 | 9.83 | Broker |
| Block IV | 167 | 1753 | 167 | 2665 | 7.91 | 5.90 | Net Outflow |
| Block Type | Density Matrix | Likeness Matrix | ||||||
|---|---|---|---|---|---|---|---|---|
| Block I | Block II | Block III | Block IV | Block I | Block II | Block III | Block IV | |
| Block I | 0.045 | 0.014 | 0.303 | 0.502 | 0 | 0 | 1 | 1 |
| Block II | 0.014 | 0.040 | 0.036 | 0.043 | 0 | 0 | 0 | 0 |
| Block III | 0.356 | 0.095 | 0.197 | 0.141 | 1 | 0 | 1 | 1 |
| Block IV | 0.652 | 0.251 | 0.175 | 0.332 | 1 | 1 | 1 | 1 |
| Variable | Actual Correlation Coefficient | Significance Level | Mean Coefficient | Standard Deviation | Minimum Value | Maximum Value | p ≥ 0 | p ≤ 0 |
|---|---|---|---|---|---|---|---|---|
| D | −0.076 | 0.000 | 0.000 | 0.011 | −0.023 | 0.066 | 1.000 | 0.000 |
| E | 0.132 | 0.000 | 0.000 | 0.011 | −0.026 | 0.049 | 0.000 | 1.000 |
| S | 0.013 | 0.130 | 0.000 | 0.012 | −0.025 | 0.059 | 0.130 | 0.871 |
| C | 0.001 | 0.170 | 0.000 | 0.012 | −0.032 | 0.049 | 0.170 | 0.830 |
| I | 0.032 | 0.008 | 0.000 | 0.011 | −0.030 | 0.044 | 0.008 | 0.993 |
| H | 0.013 | 0.097 | 0.000 | 0.011 | −0.025 | 0.072 | 0.097 | 0.903 |
| M | −0.026 | 0.001 | 0.000 | 0.012 | −0.027 | 0.058 | 1.000 | 0.001 |
| T | 0.074 | 0.000 | 0.000 | 0.013 | −0.026 | 0.070 | 0.000 | 1.000 |
| Variable | Unstandardized Regression Coefficient | Standardized Regression Coefficient | Significance Probability | Probability A | Probability B |
|---|---|---|---|---|---|
| D | −0.001 | −0.075 | 0.000 | 1.000 | 0.000 |
| E | 2.479 | 0.134 | 0.000 | 0.000 | 1.000 |
| S | 0.485 | 0.006 | 0.224 | 0.224 | 0.776 |
| C | 0.065 | 0.02 | 0.387 | 0.387 | 0.613 |
| I | 0.131 | 0.013 | 0.070 | 0.070 | 0.930 |
| H | 0.086 | 0.016 | 0.055 | 0.055 | 0.945 |
| M | −2.864 | −0.041 | 0.000 | 1.000 | 0.000 |
| T | 4.608 | 0.016 | 0.064 | 0.064 | 0.936 |
| Variable | Eastern City | Central City | Western City | |||
|---|---|---|---|---|---|---|
| Standardized Regression Coefficient | Significance Probability | Standardized Regression Coefficient | Significance Probability | Standardized Regression Coefficient | Significance Probability | |
| D | 0.000 | 0.898 | 0.000 | 0.048 | 0.000 | 0.001 |
| E | 0.108 | 0.267 | 0.103 | 0.260 | 0.319 | 0.008 |
| S | 0.227 | 0.017 | −0.000 | 0.379 | 0.152 | 0.073 |
| C | 0.030 | 0.388 | 0.045 | 0.335 | 0.034 | 0.365 |
| I | 0.260 | 0.012 | 0.155 | 0.094 | 0.158 | 0.099 |
| H | 0.000 | 0.050 | 0.263 | 0.008 | −0.000 | 0.011 |
| M | 0.229 | 0.036 | 0.140 | 0.171 | 0.118 | 0.206 |
| T | 0.061 | 0.343 | −0.143 | 0.152 | 0.096 | 0.211 |
| Regional | D | E | S | C | I | H | M | T | |
|---|---|---|---|---|---|---|---|---|---|
| Standardized Regression Coefficient | North China | 0.000 | 0.000 | 0.000 | 0.000 | 0.658 | 0.275 | 0.000 | 0.000 |
| East China | −0.000 | 0.527 | −0.101 | −0.002 | 0.403 | 0.129 | 0.039 | 0.459 | |
| Central China | −0.000 | 0.542 | −0.298 | 0.116 | 0.014 | −0.572 | 0.529 | −0.159 | |
| South China | 0.000 | 0.653 | −0.025 | 0.064 | 0.447 | 0.391 | 0.195 | 0.014 | |
| Northwest | 0.000 | −0.104 | 0.438 | 0.000 | 0.000 | 0.000 | 0.000 | 0.476 | |
| Southwest | 0.000 | 0.000 | 0.298 | 0.000 | 0.449 | 0.000 | 0.000 | 0.000 | |
| Northeast | 0.000 | 0.072 | 0.000 | −0.224 | 0.431 | 0.000 | 0.000 | 0.000 | |
| Significance Probability | North China | 0.036 | 0.393 | 0.800 | 0.651 | 0.000 | 0.019 | 0.336 | 0.030 |
| East China | 0.336 | 0.000 | 0.107 | 0.500 | 0.000 | 0.087 | 0.351 | 0.000 | |
| Central China | 0.017 | 0.004 | 0.008 | 0.163 | 0.452 | 0.000 | 0.000 | 0.170 | |
| South China | 0.234 | 0.005 | 0.416 | 0.354 | 0.001 | 0.014 | 0.094 | 0.482 | |
| Northwest | 0.506 | 0.316 | 0.009 | 0.094 | 0.518 | 0.000 | 0.090 | 0.310 | |
| Southwest | 0.894 | 0.481 | 0.044 | 0.593 | 0.005 | 0.000 | 0.208 | 0.210 | |
| Northeast | 0.000 | 0.566 | 0.218 | 0.929 | 0.008 | 0.055 | 0.511 | 0.001 |
Disclaimer/Publisher’s Note: The statements, opinions and data contained in all publications are solely those of the individual author(s) and contributor(s) and not of MDPI and/or the editor(s). MDPI and/or the editor(s) disclaim responsibility for any injury to people or property resulting from any ideas, methods, instructions or products referred to in the content. |
© 2025 by the authors. Licensee MDPI, Basel, Switzerland. This article is an open access article distributed under the terms and conditions of the Creative Commons Attribution (CC BY) license (https://creativecommons.org/licenses/by/4.0/).
Share and Cite
Yang, W.; Yan, M.; Wang, X.; Shi, J. Study on the Spatial Association Network Structure of Urban Digital Economy and Its Driving Factors in Chinese Cities. Systems 2025, 13, 322. https://doi.org/10.3390/systems13050322
Yang W, Yan M, Wang X, Shi J. Study on the Spatial Association Network Structure of Urban Digital Economy and Its Driving Factors in Chinese Cities. Systems. 2025; 13(5):322. https://doi.org/10.3390/systems13050322
Chicago/Turabian StyleYang, Wei, Mengjie Yan, Xiaohe Wang, and Jinfeng Shi. 2025. "Study on the Spatial Association Network Structure of Urban Digital Economy and Its Driving Factors in Chinese Cities" Systems 13, no. 5: 322. https://doi.org/10.3390/systems13050322
APA StyleYang, W., Yan, M., Wang, X., & Shi, J. (2025). Study on the Spatial Association Network Structure of Urban Digital Economy and Its Driving Factors in Chinese Cities. Systems, 13(5), 322. https://doi.org/10.3390/systems13050322