Abstract
Against the background of global climate change and increasing ecological vulnerability, enhancing ecosystem resilience has become a core task for coping with environmental shocks and achieving sustainable development. The urban energy structure plays a critical role in influencing the green development of the economy and the enhancement of environmental resilience. Existing studies have revealed the role of energy structure transformation in the identification of macroeconomic performance and environmental outcomes, but have neglected its impact on ecosystem resilience. This paper exploits the implementation of the New Energy Demonstration City pilot policy as a quasi-natural experiment. Using panel data of Chinese prefecture-level cities from 2010 to 2022, it constructs a multidimensional evaluation system of urban ecosystem resilience and employs a difference-in-differences (DID) model to empirically examine the impact of energy structure transformation on urban ecosystem resilience. It is found that energy structure transition significantly enhances urban ecosystem resilience, and this conclusion is verified through a series of robustness tests. Mechanism analysis shows that energy structure transformation comprehensively enhances urban ecosystem resilience through strengthening institutional regulation, optimizing resource allocation, promoting energy substitution, and enhancing public awareness. Heterogeneity analysis indicates that the strengthening effect of energy structure transition on urban ecosystem resilience is inclusive, and that this positive effect is greater in cities characterized by lower resource endowment and weaker governance capacity. This paper reveals the intrinsic mechanism of urban energy transition for ecological resilience enhancement, and provides an energy transition path for building more resilient urban ecosystems.
1. Introduction
Against the backdrop of intensifying global climate change and rising vulnerability of ecosystems, enhancing cities’ capacity to cope with environmental shocks and disaster risks has become increasingly critical.The United Nations 2030 Agenda for Sustainable Development explicitly proposes to build inclusive, safe, disaster-resilient, and sustainable cities, and the Paris Agreement establishes the global goal of “improving adaptive capacity, strengthening resilience, and reducing vulnerability to climate change”. The AR6 Synthesis Report of Climate Change 2023, released by the IPCC, states that, due to the substantial greenhouse gas emissions caused by human activities, the global surface temperature at the end of the 21st century is likely to increase by 1.5–4.5 °C compared to the pre-industrial level. This warming trend has directly led to frequent extreme weather events, including heat waves, heavy rainfall, flooding, and droughts. In the long term, this will have a widespread and far-reaching impact on population migration, economic growth, political stability, financial systems, and business operations, seriously threatening the stability of global urban ecosystems [1]. The massive consumption of traditional fossil fuels constitutes a fundamental driver of heightened urban ecological vulnerability worldwide. Since traditional energy sources are mostly fossil fuels, they lead to a large amount of carbon dioxide emissions, which cause serious damage to the ecological environment [2,3]. Therefore, energy structure transformation (EST) has great practical and strategic significance in the context of coping with the increasing global ecological vulnerability. However, existing studies largely focus on EST’s effects on pollution control and carbon reduction, while insufficient attention has been paid to its deeper role in reshaping urban ecosystem functions and enhancing their capacity to withstand complex environmental shocks. In particular, from the perspective of urban ecosystem resilience (UER), exploring the impacts of energy transition on the foundation of urban sustainability remains an important research path to be explored in depth.
Resilience is derived from the Latin word “resilio”, meaning “the ability to return to an initial state” [4]. UER refers to the ability of urban ecosystems to maintain or restore their basic functions and structures in the face of environmental pressures, climate change, pollution, and other shocks and changes [5]. The concept of ecological resilience is particularly applicable to urban systems because of the wide-ranging, open-ended, and uncertain nature of the changes that cities face [6]. Some studies have suggested that urbanization can enhance ecological resilience [7], but others have shown that China’s rapid urbanization and large-scale industrialization have had an impact on the environment and have instead impeded the enhancement of ecosystem resilience [8]. Notably, a synergistic relationship exists between economic development and ecosystem resilience, representing a crucial embodiment of the vision of a harmonious relationship [9]. Studies have also shown that environmental regulation policies and low-carbon city construction can effectively improve the level of urban ecosystems [10,11]. In this context, accelerating the shift toward a clean and low-carbon energy structure is key to mitigating emissions and climate risks, while simultaneously reinforcing UER and supporting sustainable development.
EST refers to the progressive shift in human energy use—from firewood to coal, coal to oil and gas, and ultimately to renewable and non-carbon sources—representing a fundamental transformation in the composition of the energy structure [12]. This transformation will make full use of abundant solar, wind, geothermal, biomass, and other renewable energy sources, actively explore the application of various new energy technologies in cities, decrease urban reliance on fossil fuels while enhancing the share of renewable energy in overall urban energy consumption, and enhance the capacity for the sustainable development of cities [13]. Studies have evaluated the comprehensive effects of EST from the perspectives of energy efficiency, ecological environment, green innovation, and industrial transformation. Studies have shown that in terms of energy use, the transition has effectively improved energy efficiency [14] and energy utilization efficiency [15]. Meanwhile, EST significantly reduces environmental pollution [16,17,18], and achieves the effect of pollution reduction and carbon reduction [19]. In terms of ecological and environmental governance, EST can exert a significant carbon emission reduction effect [20,21], improve urban carbon total factor productivity [22], significantly inhibit the degree of carbon lock-in of pilot enterprises in high-carbon industries, enhance urban ecological welfare performance [23], and make significant contributions to green and low-carbon development [23]. EST significantly fosters green innovation in both general enterprises and new energy sectors [24,25]. Meanwhile, it also enhances urban-level green innovation, including innovation efficiency [26,27] and green total factor productivity [28,29,30]. In addition, there are studies that extend to emerging areas such as new quality productivity [31] and sustainable development [32]. Most studies in the existing literature focus on the impacts of a single dimension, such as green innovation, energy efficiency, or pollution emissions. In addition, although some studies have focused on the overall performance of the urban green transition, fewer studies have explored UER. In 2014, China’s National Energy Administration (NEA) issued the “Notice on Announcing the List of Innovative New Energy Demonstration Cities (Industrial Parks) (First Batch)”, identifying 81 cities and eight industrial parks as the first batch of cities and industrial parks to create new energy demonstration cities and industrial parks, which marked an important step in the transformation of traditional energy sources to new energy sources. Figure 1 shows that industrial sulfur dioxide and particulate matter emissions have declined significantly after the policy was implemented, reflecting a phased improvement in ecological and environmental quality. Against the backdrop of ongoing policy evolution and accelerated green transition, whether the shift from traditional to new energy can enhance UER warrants an in-depth investigation. This paper leverages the new energy demonstration city pilot as a quasi-natural experiment to evaluate the causal impact of EST on UER and systematically examines its underlying mechanisms to inform the development of more resilient, adaptive, and sustainable urban ecosystems.
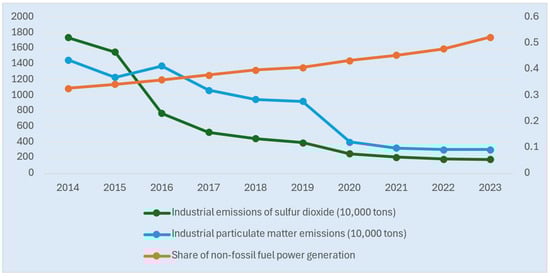
Figure 1.
The share of non-fossil fuel power generation in China and its relationship with industrial carbon dioxide emissions and industrial particulate matter emissions.
Consequently, this paper uses panel data from Chinese prefecture-level cities (2010–2022) to systematically assess the impact of EST on UER. A difference-in-differences approach is employed to identify policy effects, complemented by a multidimensional resilience evaluation system and multiple robustness and heterogeneity tests to analyze underlying mechanisms. The study finds that the EST significantly improves UER, and the effect is particularly prominent in small cities, non-tier-1 cities, non-Yangtze River Basin cities, non-environmentally friendly cities, non-resource cities, and high-energy-consuming cities. Mechanism analysis shows that the policy triggers resource allocation optimization through institutional regulation, thereby facilitating the transition of the energy structure toward cleaner alternatives, and stimulates the public’s green awareness under the guidance of policy signals. Further analysis shows the policy’s evolution from short-term behavioral incentives to a systemic enhancement of ecological resilience. At the same time, green finance itself has a significant positive impact on ecological resilience. Based on the empirical analysis, this paper provides policy recommendations to promote the construction of ecological civilization and institutional green transformation: first, to build a complete and adaptable green policy system at the governmental level; at the same time, to promote the green capacity leap and governance logic reshaping at the city level; and finally, to promote the integration of institutions, finance, and resources at the synergistic level. The synergistic promotion of these three aspects can better promote the green transformation of cities and the realization of the goal of ecological civilization.
The research contributions of this paper are as follows:
First, this paper enriches the research perspective on EST, expanding the theoretical boundaries of EST with a multi-dimensional driving mechanism that ranges from institutional regulation, resource allocation optimization, and energy substitution promotion to public awareness response. Existing research on EST mainly focuses on the identification of macroeconomic performance and environmental outcomes, with much of the literature on economic growth [33,34,35], industrial structure upgrading [36], and income effects [37], etc., developed from the perspective of or emphasizing its role in carbon emission reduction [38,39] and atmospheric pollution control [40] within the scope of envionmental synergistic effects. Most of these studies focus on evaluating the external results of changes in energy structure, while lacking a systematic description of its internal evolutionary logic and cross-system interaction mechanisms. This paper emphasizes that EST is a complex evolutionary system driven by institutional regulation, fiscal orientation, and social awareness. It analyzes the internal driving mechanisms and external synergistic pathways of energy transformation, providing theoretical support for understanding the multidimensional drivers and comprehensive effects of EST, and promoting EST research from result evaluation to mechanism identification.
Second, this paper expands the path analysis paradigm of UER research and proposes a two-way adaptation path of functional reconstruction and structural evolution. Existing literature mainly quantifies urban ecological resilience through indicator systems and assessment models, commonly applying resistance–adaptation–recovery [9], pressure–state–response (PSR) [41,42], dynamics–pressure–state–influence–response (DPSIR) [8,43], and other assessment models, arguing that UER is affected by natural conditions [44], socio-economic dimensions [41,45,46], and technological and managerial dimensions [47,48]. Previous studies have primarily emphasized the construction of resilience indices or the impact of individual environmental variables, generally neglecting how ecosystems achieve structural adaptation and functional renewal in response to external shocks. This paper emphasizes that urban ecosystems are dynamic networks with complex adaptive capabilities. Resilience is not only manifested in resistance to risks but also in evolutionary capabilities such as spatial pattern optimization and the restructuring of feedback mechanisms. This study promotes a shift in UER research from static measurement to dynamic governance, providing new theoretical support for enhancing urban sustainability. It also offers a mechanism identification framework and policy support pathways for improving urban ecological security and governance efficiency in the context of global ecological civilization construction.
Third, this paper deepens the research dimensions of the policy effects of new energy demonstration city pilot programs, revealing their institutional evolution logic and global comparative value. Existing studies have mostly focused on the direct impacts of the new energy demonstration city pilot policy on a single dimension, such as pollution reduction, technological innovation, or industrial upgrading [23,32,49], and have generally focused on the corporate perspective, exploring the impacts of the policy on guiding green investment [50], etc. There has been relatively little discussion of its role as a tool for institutional innovation in urban governance and environmental institutional systems. This paper treats new energy demonstration cities as a proxy variable for EST, analyzing their institutional functions in terms of policy pilot mechanisms, fiscal incentive allocation, and local governance adaptability. It points out that these cities are not only a means of promoting technology, but also a platform for institutional adaptation and policy learning. The new energy demonstration city program has also formed a market-oriented path distinct from Germany’s energy transition plan [51] and a community-based collaborative path different from Denmark’s small-scale distributed energy development [52]. This paper compares and reveals China’s institutional characteristics in terms of central coordination, local incentives, and policy flexibility, thereby expanding the international perspective of new energy policy research.
Fourth, this paper reconstructs the theoretical relationship between energy consumption and ecological and environmental impacts, breaking the linear paradigm between energy consumption and ecological impacts, and constructing a new logic of EST driving the stable evolution of ecosystems. Existing literature generally emphasizes the impact of energy consumption on specific environmental indicators, ranging from total carbon emissions [53,54] and air quality [55] to biodiversity [56,57]. Research has primarily focused on identifying the static relationships between total energy use, energy intensity, and environmental pressures, but has overlooked the fact that, in the context of continuously optimizing energy structures, energy utilization patterns themselves are also driving transformations in ecosystem functions. This paper adopts a dynamic response perspective based on the ecosystem, breaking away from the traditional linear causal paradigm between energy and pollution. It reveals that EST not only reduces environmental loads but also enhances system resilience, driving ecological environments toward higher-level stable states. This provides theoretically sound and practically applicable references for countries worldwide to achieve ecosystem resilience enhancement during energy structure transformation processes.
The subsequent sections of this paper are organized as follows: the second part presents the theoretical analysis and hypotheses, explaining the mechanism of EST on UER and presenting the core theoretical hypotheses of this paper; the third part outlines the research design, including model specification, variable construction, data description, and descriptive statistics; the fourth part presents the baseline regression results of EST on the resilience of urban ecosystems and its robustness test; the fifth part tests the mechanism of action from four perspectives: institutional regulation, resource allocation, energy substitution, and cognitive drive; the sixth part analyzes the heterogeneity from the perspectives of urban hierarchy, urban governance capacity, and urban endowment; the seventh part further discusses the structural leap and institutional regulation perspectives to explore the capacity leap effect of new energy demonstration cities; and finally, the last part summarizes the conclusions of this paper and presents policy recommendations.
The logical framework of this paper is shown in Figure 2:
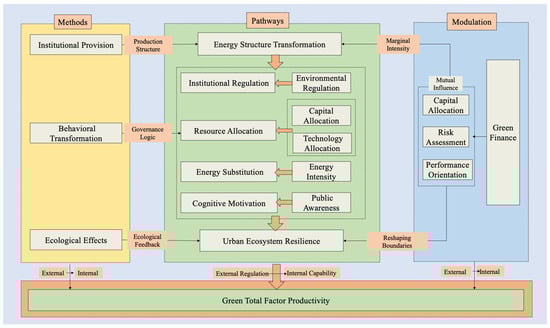
Figure 2.
Logical framework diagram of this paper.
2. Theoretical Analysis and Research Hypothesis
Through policy guidance and environmental regulation, cities are forced into green transformation and upgrading; at the same time, by relying on financial and technical support, EST strengthens the resource allocation effect and promotes the effective substitution of new energy sources for fossil energy sources; and with the help of policy signals and demonstration and publicity effects, it deepens public awareness and social consensus, ultimately improving the resilience of the urban ecosystem. The mechanism analysis is shown in Figure 3.
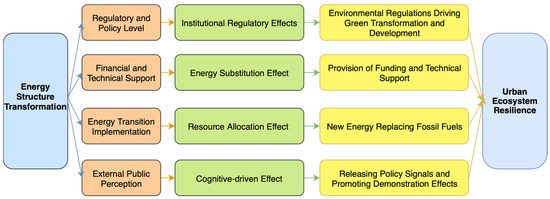
Figure 3.
Mechanism of EST on UER.
2.1. Institutional Regulation Effect
Policy implementation is typically supported by institutional arrangements, which serve as the initial channel for translating policy objectives into binding regulations, thereby laying the groundwork for enhancing UER at the institutional level. Among them, EST is both guiding and constraining, and is essentially a spatial manifestation of environmental regulation. First, the transition takes the formulation of energy standards as an entry point, and in the evaluation index system, mandatory targets such as the total amount of new energy utilization and the proportion of various new energy sources are explicitly set, so as to promote the establishment of more systematic ecological governance standards and implementation mechanisms by local governments. Second, the policy incorporates green development goals into the government’s governance responsibility system, and enhances the rigidity of the system’s implementation by improving the target responsibility mechanism as well as the incentive and constraint mechanisms. Local governments have advanced localized environmental regulatory systems by tightening emission standards, refining assessment mechanisms, and strengthening enforcement, thereby fostering urban green innovation and governance capacity [58]. This kind of environmental regulation improves the government’s governance level in pollution prevention and control, resource protection, and risk early warning [10,59,60], enabling cities to recognize, respond quickly, and recover effectively from environmental shocks, thus strengthening the system’s dynamic regulation and long-term adaptive capacity. Especially in the face of external uncertainty risks such as climate change and extreme weather, cities with strong environmental regulation systems tend to show stronger ecological resilience [61]. Finally, stringent environmental regulations limit corporate behavior by increasing pollution costs and narrowing the space for high-emission industries, thereby steering resource allocation toward greener, low-carbon, and more efficient development [62,63]. Rationally designed environmental policies will not inhibit the development of enterprises, as environmental regulations will force enterprises to strengthen technological research and development, and more energy-saving and emission-reduction-oriented advanced technologies will emerge [64,65,66]. This helps to optimize the urban industrial structure, reduce the environmental load, and enhance the stability of the ecosystem [67,68,69,70,71]. Policy regulation is transmitted from the national level to local governments and enterprises step by step, forming a vertical governance synergy, optimizing the urban ecosystem structure, and enhancing the resilience and sustainability of urban ecosystems while promoting the release of green innovation vitality. Based on this, this paper puts forward the following hypotheses:
H1.
EST can improve UER through the institutional regulation effect.
2.2. Resource Allocation Effect
On the basis of playing the role of external constraints through institutional regulation, EST further guides resource elements to green industry agglomeration, thus laying a resource base for energy structure optimization and green transformation. EST requires stronger local government support for the new energy industry, particularly in finance and technology. On the one hand, the positive role of financial support can effectively promote the development of innovation [72] and encourage the financial institutions to provide innovative financial services for the transformation of the energy structure and to establish a financing model suitable for the characteristics of distributed new energy. At the same time, China has enacted a series of fiscal and tax subsidy policies, such as the renewable energy VAT exemption policy and special guiding funds for green development, in order to stimulate the development and utilization of new energy and renewable energy, and to realize large-scale development [22]. On the other hand, the construction of EST also highlights the key role of technological resources in green transformation. Technology is not only one of the factors of production, but also a core resource to drive the development of new energy and support UER in cities [16]. Through the systematic allocation of resource elements in the dimensions of financial subsidies and technological guidance, EST not only improves the operational resilience and technological support capacity of the new energy system, but also provides cities with stronger resilience and adaptability in the face of external environmental shocks, which ultimately enhances UER. Based on this, this paper puts forward the following hypothesis:
H2.
EST can improve UER through resource allocation guidance.
2.3. Energy Substitution Effect
As institutional constraints intensify and resource allocation improves, policy effects shift from initial behavioral regulation toward substantive energy substitution, forming a key pathway for transforming the energy system. EST accelerates the substitution process by encouraging cities to promote the energy system substitution process centered on clean energy, reduce reliance on high-carbon energy sources such as coal and oil, and vigorously develop renewable energy sources such as wind, solar, and hydro energy, thus significantly increasing the proportion of green energy in overall energy consumption. EST plays an important role in promoting renewable energy consumption, optimizing the energy structure, and promoting the sustainable development of cities [73]. It can effectively improve energy efficiency, energy utilization efficiency, and total factor energy efficiency [14,15,74], while at the same time reducing the intensity of energy consumption, promoting an increase in the level of green energy consumption [75,76], and leading to the expansion of renewable energy technology innovation and renewable energy investment [77,78]. The shift toward energy alternatives enhances UER through multiple channels: (1) reducing pollution sources—less fossil fuel consumption leads to lower emissions and ecological pressure [79]; (2) strengthening the resilience of the energy system—a green and diversified energy structure improves the adaptive and restorative capacity to withstand external shocks [80]; and (3) promoting the construction of green infrastructure, including distributed energy resources. Green infrastructure construction, including distributed energy, energy storage systems, and green buildings, will enhance the risk resistance, self-control, and self-adaptation of the urban composite ecosystem as a whole, providing material support for the resilience of the urban system ecosystem [81]. Based on this, this paper proposes the following hypothesis:
H3.
EST can improve UER by increasing energy use efficiency.
2.4. Awareness-Driven Effect
As policy effects unfold, public acceptance of low-carbon energy and engagement in green initiatives steadily increase, advancing a cognitive shift from government-led action to societal co-construction. First, the release of policy signals in the process of demonstration policies has become an important mechanism to guide the public’s awareness. Policies release clear signals of energy restructuring and green, low-carbon development to all sectors of society through clear institutional regulation and goal orientation, which effectively reduces fluctuation and uncertainty in the public’s expectations of future policies in the context of information asymmetry. Second, the policy has also taken on the role of a signaling policy and plays a key role in disseminating green concepts. Cities implementing EST are expected to actively promote new energy awareness across society. Ways of publicizing and educating include setting up new energy exhibition halls or theme parks to receive public visits, publicizing and promoting new energy through the local media, and carrying out popularization and education on new energy and new energy technologies in local primary and secondary schools [82]. Finally, centralized piloting and targeted resource allocation have reinforced the policy’s spatial “demonstration effect”, boosting public recognition and support for new energy alternatives. On the basis of improved awareness, the public’s green consciousness has been awakened, which has gradually transformed into bottom-up participation, giving rise to more forms of social supervision and shared governance practices. The release of policy signals, publicity, and demonstration through multiple interactions continues to promote the deepening of public awareness, which has become an important social foundation for enhancing UER. Based on this, this paper proposes the following hypothesis:
H4.
EST can improve UER through enhancing public perception.
3. Research Design
3.1. Model Setup
This paper constructs a quasi-natural experiment based on the implementation of the pilot policy of new energy demonstration cities to assess its causal effect on UER. Considering that the implementation of the policy in each city has a strong exogenous nature, this paper adopts the double-difference method to identify the causal effect on UER. The specific regression settings are as follows:
The model observation data cover the years 2010–2022, with the observation data level being prefecture-level city-year. Here, denotes the UER of city in year , denotes EST, is the city-level control variable, and are the time fixed effects and city fixed effects, respectively, and is the random error term.
3.2. Explained Variable
3.2.1. Explained Variable: UER Index
UER refers to how the urban system promotes the benign interaction between the development of modern civilization and ecosystem protection under the guidance of the concept of ecological civilization, as well as the ability of the city’s ecosystem to maintain its stability, adaptability, and resilience in the face of a variety of internal and external shocks.
- (1)
- Selection of indicators
Referring to the research idea of Chu Erming [83] on ecosystem resilience measurement, this paper defines UER as the comprehensive level of a city’s ability to effectively constrain pollution emissions, maintain ecosystem status, and continuously improve environmental governance capacity in the face of ecosystem pressures or sudden shocks. On this basis, drawing on the framework of ecosystem resilience measurement by Guo Haihong and Liu Xinmin [42], integrating the environmental quality performance assessment method proposed by Zhang Jipeng and Peng Jingqiu [84], and combining it with the realistic characteristics of urban economic and social development, UER is further decomposed into state resilience, pressure resilience, and response resilience in three sub-dimensions, and weighted with the entropy value method. This constructs a chain structure of the UER system to more comprehensively reflect the steady-state performance of urban ecosystems, the degree of pressure, and their governance and adaptation capacity. The construction of indicators is shown in Table 1.
- (2)
- Variable Measurement
The entropy value method is a multi-indicator evaluation method. This paper adopts the entropy value method to assign weights to each indicator: it calculates the information entropy of the indicator and determines the weights of the indicators according to the impact of the relative changes of the indicators on the system as a whole, i.e., assigns weights according to the degree of difference in the sign value of each indicator. Indicators with a larger degree of relative change have larger weights.
Since the entropy value method requires handling multiple indicators with different units and scales, the raw data are standardized first. Common standardization methods include min–max normalization and Z-score normalization. The standardized data have the same measure and scale, which is convenient for subsequent calculation. Polar deviation normalization is performed through Equation (2):
where is the data of the th indicator in the th unit, is the standardized data, and and are the minimum and maximum values of the th indicator, respectively. For the standardized data, the scale value (relative weight) of each indicator, i.e., the proportion of each value in the indicator, is calculated by Equation (3), which reflects the relative contribution of each indicator in different samples.
where denotes the proportion of the th indicator in theth unit and n is the sample size. The entropy value and weight of each indicator are calculated by Equations (4) and (5):
The entropy value indicates the information quantity of the first indicator, where is a constant and n is the number of samples. A larger entropy value indicates more uniform information distribution of the indicator, lower variability, and smaller contribution to the comprehensive evaluation; a smaller entropy value indicates more concentrated information distribution of the indicator, greater variability, and greater contribution to the comprehensive evaluation. is the total number of indicators. The calculated weights ensure that the sum of all indicator weights equals 1.
Finally, according to the weight of each indicator and the standardized data, the comprehensive score of each unit is calculated by Equation (6):
where is the comprehensive score of the th unit, is the weight of the th indicator, and is the standardized value of the th indicator. According to the principle and steps of the entropy value method, the weight of each indicator is obtained, as shown in Table 1.

Table 1.
Construction of urban ecological resilience indicators.
Table 1.
Construction of urban ecological resilience indicators.
| Primary Indicator | Secondary Indicator | Weight | Tertiary Indicator | Unit | Direction | Weight |
|---|---|---|---|---|---|---|
| Urban Ecological Resilience Index (UER) | State Resilience Index (SRI) | 22.46% | Per Capita Water Resources | m3/person | + | 1.75% |
| Green Coverage Rate of Built-up Areas | % | + | 17.58% | |||
| Per Capita Urban Park Green Space Area | hectares/10,000 people | + | 1.54% | |||
| Per Capita Built-up Area | km2/10,000 people | + | 1.59% | |||
| Pressure Resilience Index (PRI) | 41.34% | Per Capita Industrial Wastewater Discharge | tons/person | − | 1.59% | |
| Per Capita Industrial Sulfur Dioxide Emissions | tons/person | − | 6.03% | |||
| Per Capita Industrial Smoke and Dust Emissions | tons/person | − | 10.00% | |||
| Per Capita Industrial Nitrogen Oxide Emissions | tons/person | − | 20.24% | |||
| Annual Average PM2.5 Concentration | μg/m3 | − | 3.48% | |||
| Response Resilience Index (RRI) | 36.21% | Industrial Sulfur Dioxide Removal Volume | tons | + | 11.24% | |
| Industrial Smoke and Dust Removal Volume | tons | + | 9.87% | |||
| Harmless Treatment Rate of Household Waste | % | + | 2.91% | |||
| Centralized Treatment Rate of Urban Sewage Plants | % | + | 2.46% | |||
| Comprehensive Utilization Rate of Industrial Solid Waste | % | + | 9.73% |
3.2.2. Core Explanatory Variable: EST
The explanatory variable of this paper is EST Treati,t, the pilot policy of new energy demonstration cities, used as the proxy variable of EST. Taking the time when the NEA announced the list of new energy demonstration cities (2014) as the policy implementation node, the 56 prefectural-level cities shortlisted and eligible for the list are assigned to the policy treatment group, while other prefectural-level cities (excluding municipalities directly under the central government) not included in the list form the control group. When a city belongs to the experimental group and the year is no earlier than 2014, Treati,t takes the value of 1; otherwise, it is 0.
3.2.3. Control Variables (Controls)
Following Sun Huangping [41], Lv [85], Chen Hao and Luo Lifi [86], and Lu Jin and Wang Enze [16], this paper selects a series of city-level influences as control variables: (1) The level of economic development (gdp) is measured by GDP per capita and controls for the effect of overall economic capacity on ecological resilience, including public investment and institutional enforcement; (2) population density (lnpop) is measured by the share of total population in the area of the administrative district at the end of the year; it can capture the population agglomeration effect, which may influence ecosystem pressure and adaptive load; (3) the level of openness to the outside world (open) is measured by the share of total imports and exports in GDP, reflecting the extent of integration into the global energy and ecological governance systems; (4) the level of human capital (hr) is measured by the number of university students per 10,000 people and serves as a proxy for the innovation potential and green awareness level of the city; (5) the industrial structure (str) is measured by the ratio of the value-added of the secondary industry to that of the tertiary industry, which helps control for the impact of industrial development stages on urban carbon emission intensity and ecological risks; (6) the level of urbanization (urb) is measured by the ratio of the ratio of urban population to resident population in the city area, reflecting the spatial structure of the city and its capacity to provide public services; (7) the level of infrastructure development (lninf) is measured by the per capita urban road area, which captures the material foundation for responding to external environmental shocks; (8) and land use intensity (lu) is measured by the proportion of built-up land area to the total area of the city, indicating the degree of urban development and compression of ecological space, which directly affects ecological resilience.
The inclusion of these control variables enables the model to account for potential confounding effects across economic, social, and spatial dimensions, thereby enhancing the identification validity of the impact of energy structure transformation on urban ecosystem resilience and ensuring the scientific rigor and robustness of the regression results.
3.3. Data Sources and Descriptive Statistical Analysis
In view of the problem of missing data for some cities at prefecture level and above in certain years, and in order to ensure the accuracy and reliability of the study, this paper follows the principle of data availability and excludes samples from cities with substantial missing data, finally selecting the panel data consisting of 290 cities at prefecture level and above in China from 2010 to 2022 for empirical analysis. The sample data were obtained from the 2010–2022 China Urban Construction Statistical Yearbook, China Environmental Yearbook, China Environmental Statistical Yearbook, China Statistical Yearbook, National Bureau of Statistics of China, Ministry of Ecology and Environment of the People’s Republic of China, and the environmental status bulletins of each region, and some of the missing data were filled in by linear interpolation. In order to control the possible interference of extreme values in the estimation, this paper implements two-sided 1% quantile shrinkage for all continuous variables and applies logarithmic treatment for some variables.
Table 2 reports the descriptive statistics of the variables. The statistical results show that the mean value of the EST variable is 0.148, i.e., about 14.8% of the sample belongs to new energy demonstration cities, which has a good basis for policy heterogeneity. In addition, the mean value of the ecosystem resilience index in this paper is 3.109; in order to facilitate the presentation of the regression coefficients, this paper multiplies the original ecosystem resilience index by 10, so that its actual mean value is 0.310. This is comparable to the data of Zhang Mingdou and Ren Yanding [10], whose data show that for 30 provinces (municipalities and districts) in mainland China from 2007 to 2019, the mean value is 0.532, and the difference of 0.222 may stem from the different study objects and time spans. In addition, other control variables in this paper are comparable with existing studies. Meanwhile, the effective sample size of each variable in this paper is 3712, which effectively ensures the completeness of the sample. The spatial analysis in Figure 4 shows that the resilience of China’s urban ecosystems is more pronounced in the central and eastern regions, which benefit from a stronger economic base, a well-developed infrastructure network, and earlier implementation of green governance policies that help to enhance ecosystem adaptability and resilience. In terms of time evolution, the overall UER in 2022 is significantly higher than that in 2010, showing an expansion pattern of “point to point and gradient progression”, which reflects the positive effects of the national green development strategy and the increasing capacity of local ecological governance in recent years.
Table 2.
Descriptive statistics.
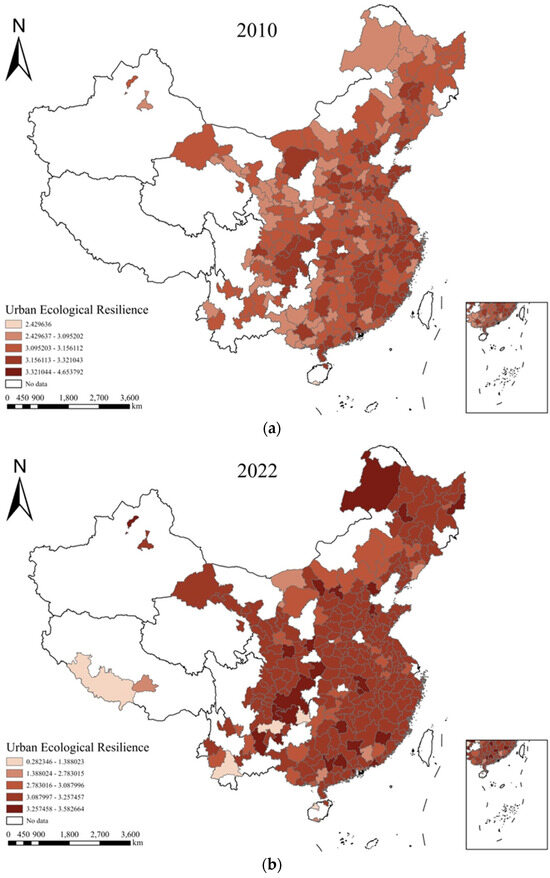
Figure 4.
(a) Spatial distribution of UER in Chinese cities, 2010; (b) Spatial distribution of UER in Chinese cities, 2022.
3.4. Correlation Analysis
Figure 5 presents the correlation analysis between the core explanatory variable (Treat), the explained variable (UER), and the control variables. The results show that all correlation coefficients are below 0.7, suggesting no multicollinearity. Additionally, Treat is positively associated with UER.
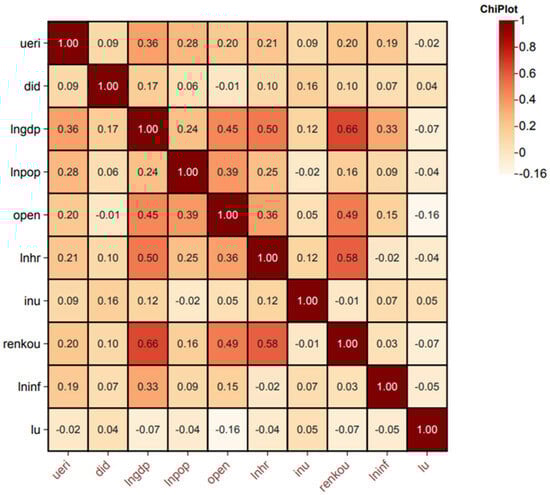
Figure 5.
Correlation analysis.
4. Empirical Results
The following empirical analysis tests the propositional hypotheses put forward by the theoretical model. First, the coefficients are estimated based on the double-difference regression equation of Equation (1) α, i.e., the impact effect of the EST on the resilience of urban ecosystems, and then the robustness test is carried out for the possible interfering factors.
4.1. Baseline Regression
Table 3 shows the results of the benchmark regression of EST on UER. Column (1) is the base model without controlling any fixed effects and control variables, column (2) controls the main control variables but adopts the no-fixed-effects setting, columns (3) and (4) introduce the one-dimensional fixed effects of city and time, respectively, and column (5) adopts the two-way fixed-effects model. EST has a significant positive effect on UER. Under the two-way fixed effects setting, the ecosystem resilience index of EST increases by about 1.9% on average. To further enhance the accuracy of the benchmark regression in this paper, the following is a robustness check of the benchmark regression results.
Table 3.
Baseline regression results.
4.2. Robustness Testing
4.2.1. Parallel Trend Test
The empirical validity of this study hinges on the parallel trend assumption, a necessary condition for the difference-in-differences (DID) model. To verify this, this study employs event analysis to conduct the parallel trends test [87]. As shown in Figure 6, the parallel trend test indicates that, during the pre-policy period (time(-4) to time(-1)), the estimated coefficients for UER between pilot and non-pilot cities under the new energy demonstration city pilot policy are close to zero, with vertical bars on the line representing the 95% confidence interval overlapping zero and showing no statistical significance. This confirms that the two groups exhibited similar UER trends prior to policy implementation, thereby satisfying the parallel trend assumption. Post-treatment, the coefficients turn significantly positive, with the policy’s impact becoming evident in the third year after implementation—likely reflecting policy lag, industrial chain adjustments, and the gradual process of ecological restoration. The positive effects persist through time6, suggesting cumulative benefits. Although the coefficients slightly decline at time7 and time8, they remain positive and partly significant, indicating sustained medium- to long-term improvements in urban ecological resilience.
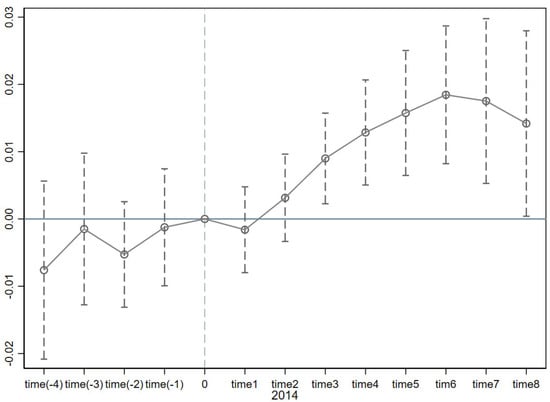
Figure 6.
Parallel trends test of the baseline regression.
4.2.2. Propensity Score Matching
The implementation of the policy exhibits selective bias, shaped by underlying regional characteristics such as natural resource availability and economic development conditions. This can lead to self-selection bias, which affects the model estimation results. Therefore, it is necessary to match the treatment group. The matching strategy in this study involves using the propensity scores estimated from the logit model to perform a 1:1 without-replacement matching, ensuring that each treatment group city is matched with a similar control group city. Table 4 reports the pre- and post-matching differences in covariates between the treated and untreated groups, allowing for assessment of the balance achieved through matching. Before matching, the majority of covariate differences were significant at the 1% level, while after matching, all covariate difference tests were insignificant. This indicates that the propensity score matching process in this study effectively mitigates self-selection bias, and using the matched sample for subsequent empirical research is reasonable. The results reported in column (1) of Table 5 demonstrate that the impact of EST on enhancing UER remains significantly positive after the matching procedure.
Table 4.
Balance test before and after matching. (a) Before matching: balance test; (b) after matching: balance test.
4.2.3. Replacement of Research Samples
Given their privileged access to policy resources, stronger administrative capacity, and advanced industrial foundations, municipalities and provincial capitals may exhibit a first-mover advantage and higher implementation intensity in EST, thereby influencing its marginal impact on ecosystem resilience. Building on the baseline regression in column (5) of Table 3, we exclude all municipalities and provincial capitals to mitigate bias related to administrative rank differences. As shown in column (2) of Table 5, we retain the same definitions for the control variables as in the baseline model and include both city-level and time fixed effects to account for unobserved heterogeneity. The analysis reveals that EST continues to exert a significantly positive influence on UER, demonstrating the robustness and generalizability of the policy effect even in the absence of major resource-intensive and administratively strong cities.
4.2.4. Reducing the Sample Period
This paper further takes into account that the systematic shocks caused by the nationwide outbreak of the COVID-19 epidemic in 2020–2021 may disturb the operation of the urban ecosystem and the pace of policy implementation, which in turn affects the stability of the regression results. To exclude the influence of special year shocks, this paper excludes the observation samples during the epidemic outbreak period (2020–2021) to reduce the interference of exogenous shocks on the estimated effect of EST. Evidence from column (3) of Table 5 suggests that the relationship between EST and UER remains significantly positive, which further validates the robustness of the policy effect under alternative specifications.
4.2.5. Excluding Policy Disturbances
Since the new energy demonstration city pilot policy was implemented in 2014, to further exclude the possible interference of other environmental policies in the same period on UER, this paper includes the following policy-related variables: firstly, the cross term between the energy-saving and emission reduction policy dummy variable and the time of approval is added to the model (jnjp) to control the potential impacts of the energy-saving and emission reduction target responsibility system on the green development of cities during the national “11th Five-Year” and “12th Five-Year” periods. To better isolate the policy effect, we add an interaction term between the policy dummy and approval year, capturing the possible impact of the energy-saving targets from the 11th and 12th Five-Year Plans. The results presented in column (4) of Table 5 indicate that both the sign and statistical significance of the core coefficients for EST remain largely consistent, thereby providing further evidence of the robustness of the policy effect. Second, to control for potential institutional overlap effects on ecosystem resilience, we include an interaction between the low-carbon city policy dummy and the implementation year (dtcs), reflecting the phased rollout of the policy by the NDRC since 2010. As reported in column (5) of Table 5, the regression results demonstrate that the impact of EST remains significantly positive, further supporting its independent contribution to the enhancement of UER. Finally, to control for the potential confounding effect of ecological civilization construction under the central environmental inspection system, we include an interaction term between the policy dummy and the pilot evaluation year (stwm). The estimation outcomes are presented in column (6) of Table 5. After controlling for the effects of this policy, the EST coefficients continue to show positive and significant associations, further reinforcing the robustness of the findings.
4.2.6. One-Period Lag
To examine the temporal dynamics and possible implementation lags of the policy, we lag the key explanatory variables by one period to assess their delayed effects on UER. The estimation results presented in column (7) of Table 5, derived from the one-period lag model, indicate that the effects remain positively signed and consistent with the baseline findings, thereby reinforcing the robustness of the policy impact. It shows that EST does not produce significant effects immediately after implementation, but may gradually release ecosystem resilience enhancement effects through multiple mechanisms.
Table 5.
Robustness tests.
Table 5.
Robustness tests.
| (1) | (2) | (3) | (4) | (5) | (6) | (7) | |
|---|---|---|---|---|---|---|---|
| Variable | UER | UER | UER | UER | UER | UER | UER |
| Treat | 0.0153 *** | 0.0204 *** | 0.0181 *** | 0.0171 *** | 0.0187 *** | 0.0180 *** | |
| (0.00365) | (0.00431) | (0.00430) | (0.00410) | (0.00445) | (0.00437) | ||
| jnjp | −0.0337 * | ||||||
| (0.0197) | |||||||
| dtcs | −0.0121 | ||||||
| (0.0108) | |||||||
| stwm | 0.00667 ** | ||||||
| (0.00322) | |||||||
| l.treat | 0.0147 *** | ||||||
| (0.00400) | |||||||
| Constant | 3.018 *** | 1.898 *** | 2.228 *** | 2.516 *** | 2.165 *** | 2.232 *** | 2.267 *** |
| (0.265) | (0.409) | (0.342) | (0.271) | (0.364) | (0.349) | (0.346) | |
| Excluding Provincial Capitals | No | Yes | No | No | No | No | No |
| Excluding Special Years | No | No | Yes | No | No | No | No |
| Control Variables | Yes | Yes | Yes | Yes | Yes | Yes | Yes |
| Year FE | Yes | Yes | Yes | Yes | Yes | Yes | Yes |
| City FE | Yes | Yes | Yes | Yes | Yes | Yes | Yes |
| Observations | 1870 | 3272 | 3138 | 3650 | 3712 | 3661 | 3425 |
| R2 | 0.976 | 0.972 | 0.971 | 0.964 | 0.973 | 0.973 | 0.978 |
Note: ***, **, and * indicate significance at 1%, 5%, and 10% statistical levels, respectively, with standard errors in parentheses.
4.2.7. Placebo Test
To prevent estimation bias caused by omitted control variables, this paper randomly selects the experimental group from the overall sample for regression and creates a fictional new policy treatment group by randomly selecting samples without repetition over the period 2010–2022. It then detects the policy effect with the baseline regression model and repeats the sampling 500 times for the placebo test. In Figure 7, the kernel density and p-value distribution of the placebo estimates based on randomly assigned treatment groups are presented. The coefficients are centered around zero, suggesting the absence of spurious treatment effects. Since the true estimated coefficient is 0.019, which is far from the result of the random distribution, this suggests that unobserved factors do not substantially affect the estimation results of this study.
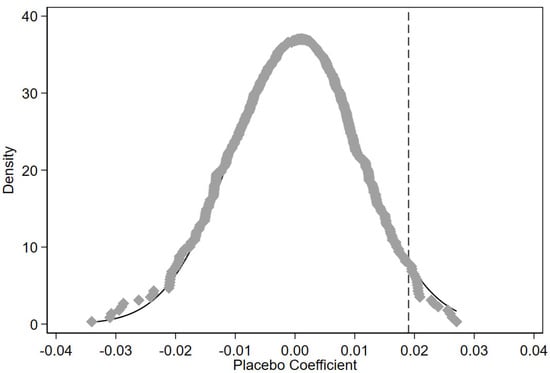
Figure 7.
Placebo test. Note: The horizontal axis of Figure 7 indicates the estimated coefficient and the vertical axis indicates the probability density.
5. Mechanism Analysis
EST, by strengthening institutional regulation, optimizing resource allocation, promoting energy substitution, and raising public awareness, enhances regulatory density and governance toughness, accelerates the energy paradigm shift from a carbon-intensive to a low-carbon model, and prompts environmental awareness to shift from external regulation to internal order, ultimately promoting the resilience reshaping of the ecosystem and a paradigm leap in the governance model.
Building on the preceding theoretical framework, this paper investigates how EST influences UER through a multi-dimensional mediation pathway consisting of institutional regulation, resource allocation, energy substitution, and cognitive drive. Accordingly, a multi-stage mediation model is developed to examine how policies stimulate resource reallocation, drive the green transformation of the energy system, and reshape public behavior, ultimately contributing to the synergistic improvement of ecological governance capacity and systemic resilience.
To deeply explore the mechanism of EST on UER, and following the methodology proposed by Jiang Ting [88], this paper constructs a mediated effects model to investigate how digital infrastructure affects the intermediary variables:
where is the mediating variable, i.e., environmental regulation, government environmental protection expenditure, green innovation level, energy consumption intensity, and public environmental perception, and the rest is consistent with the baseline regression model.
5.1. Institutional Regulation Effect
As a key institutional instrument for advancing ecological transformation at the national level, EST adopts a centrally led yet locally coordinated planning model that balances top-down strategic guidance with bottom-up implementation flexibility, thereby fully mobilizing local governments’ enthusiasm and institutional responsiveness in promoting green development [72,73]. Under the role of policy incentives, some cities have taken the initiative to incorporate ecological governance issues into the local governance system, and through the introduction of more stringent environmental regulatory policies, aim to advance ecological governance by transitioning from reactive measures to proactive and innovative strategies. The new energy demonstration city functions as a pilot program, incentivizing local authorities to actively regulate environmental practices.
This study employs sewage treatment charges as a representative proxy for the intensity of environmental regulation. The regression results in Table 6, column (1), demonstrate a positive and significant relationship between regulation intensity and UER. In this process, the local government focuses on building a localized and institutionalized environmental regulation system, including strengthening pollutant emission standards, refining the environmental protection target assessment mechanism, and enhancing the effectiveness of law enforcement and supervision [89], so as to achieve effective management of high-energy-consuming and high-emission behaviors. Therefore, environmental regulation is not only a significant path to realize green development, but also a key institutional guarantee for building a highly resilient urban ecosystem, which not only enhances the institutional capacity of localities in the identification and management of environmental risks, but also strengthens their resilience and restoration capacity in the face of ecological pressure.
Table 6.
Mechanism analysis.
5.2. Resource Allocation Guidance
Against the backdrop of green transformation, EST serves as a key institutional lever, with its resource allocation function primarily manifested in promoting green infrastructure investment and enhancing green R&D capacity. This paper employs the share of government spending on energy conservation and environmental protection within the general public budget as a proxy for green infrastructure investment [90], and uses the number of green patent applications as a proxy to represent green technological innovation capacity. These two indicators jointly capture the resource allocation mechanism from the dimensions of fiscal capital and innovation output, allowing us to examine their influence on UER. The estimation outcomes are reported in column (2) of Table 6, which indicates that the proportion of government energy-saving and environmental protection expenditures in general budget expenditures increases once the pilot initiative has been implemented, and this green fiscal variable has a significant positive impact on urban ecosystem resilience. From the standpoint of financial allocation, the EST significantly promotes local governments’ financial investment in green infrastructure, which in turn becomes a key fulcrum for enhancing UER. Policy incentives have pushed local governments to invest more in green infrastructure, especially in key areas such as smart grids, energy storage systems, green transportation, and clean energy supply. These investments have not only significantly improved urban energy efficiency and energy saving and pollution reduction outcomes [90,91,92,93], optimized the spatial layout of the urban energy system, and enhanced the efficiency of resource allocation, but also, by enhancing system redundancy and diversity, improved the overall operational stability and adaptability.
The results presented in column (3) of Table 6 demonstrate that green technological innovation contributes meaningfully to the improvement of UER. Technological innovation facilitates the upgrading of green products and services, enhances the provision of ecological and environmental governance resources [65], and reinforces the long-term resilience infrastructure of urban ecosystems. Viewed from the standpoint of innovation resource allocation, green technological innovation is broadly recognized as a fundamental engine for long-term growth in green productivity [94]. In the implementation process of EST, the policy clearly defines the goal of green transformation: not only does it set green standards and provide incentives such as financial subsidies and tax exemptions, but also lowers the financial barriers and uncertainties associated with green technology R&D, thereby strengthening the innovation incentives of enterprises and research institutions in areas such as clean energy, energy efficiency, and environmental protection. In addition, it promotes the cultivation of green markets and the strengthening of local government performance-oriented mechanisms, stimulates green competition among cities, optimizes the redistribution of innovation capacities, and creates an institutional environment conducive to the continuous evolution and application of green technology. This accelerates the agglomeration and diffusion of green technology at the city level, and stimulates the vitality of green-oriented technological innovation in the city [95]. In short, through technological progress, cities can utilize resources more efficiently, reduce environmental pressure, and enhance the self-regulation and restoration ability of the ecosystem.
5.3. Energy Substitution Effect
By providing institutional support and incentive mechanisms, EST encourages cities to accelerate energy system substitution centered on clean energy. This process reduces reliance on high-carbon-intensive energy sources while promoting the rapid development of renewable energy sectors—including wind, solar, and hydropower—thereby significantly increasing the share of green energy within the overall energy mix [96]. There is also a reverse trend in energy intensity [97,98], which accelerates the transition from high-carbon dependence to a low-carbon and high-efficiency green energy system, and serves as a key driver in facilitating the adoption of renewable energy, enhancing the energy structure, and fostering sustainable urban development [73].
This study incorporates energy intensity as a mediating variable, measured by the ratio of total energy consumption to gross regional product [99], to capture the pathway of the energy technology substitution effect. The results in column (4) of Table 6 show that a reduction in the intensity of energy use can enhance UER. On the supply side, technological innovation and upgrading—particularly through the intelligent and digital development of the energy system—enhance energy utilization and management efficiency [100]. This not only reduces energy consumption per unit of GDP but also improves resource efficiency, reflecting the combined effects of technological advancement and industrial upgrading. On the demand side, improvements in energy structure and reduced energy intensity enhance the ecosystem’s regulatory adaptability. The large-scale substitution and efficient use of clean energy significantly reduce greenhouse gas and pollutant emissions [72], alleviating environmental pressures, improving air quality, and promoting ecological restoration. These changes collectively strengthen the ecosystem’s self-repair capacity and resilience to external shocks.
5.4. Cognitive Driving Effect
With the promotion of green policies, the public has gradually shifted from being the object of governance to an active participant in ecological governance. The Chinese government has continuously optimized environmental policy tools and promoted command-based, market-incentivized and public-participation environmental regulation in parallel [101], which has led to profound changes in public environmental awareness and behavior. The government improves residents’ awareness of ecological issues through institutional guidance, publicity, and education, internalizes the green concept from external norms into codes of conduct in daily consumption and travel, and forms a social norms system centered on environmental responsibility.
To examine the policy’s cognitive driving effect within the social system, this paper constructs a public environmental concern index for prefecture-level cities.The index is based on Baidu Search Index data for keywords such as “environmental pollution” and “haze”, reflecting the public’s awareness of and responsiveness to ecological issues. As shown in columns (5) and (6) of Table 6, public environmental awareness—measured by Baidu search frequencies for “environmental pollution” and “haze”—has a significant positive effect on UER. These findings suggest that strengthening social participation through targeted policy design can effectively improve ecological resilience at the urban level. The empirical results show that public environmental concern substantially enhances UER, indicating that policies effectively stimulate the public’s willingness to participate in green actions by enhancing the basis of social awareness, thus playing a sustained role in enhancing social resilience. This phenomenon largely reflects the deepening institutionalization of the ecological civilization paradigm: the public is no longer only an object of ecological governance, but has gradually transformed into an important participant in green transformation. Increasing environmental concern has led to the formation of a collaborative governance network with green values, and residents have strengthened their self-organization and collaborative capacity through daily green practices, community collaboration, and public welfare monitoring, thus enhancing social resilience to ecological disturbances and environmental risks. At the same time, public environmental preferences continue to reshape policy and market behavior. On the one hand, driven by public opinion and the trend of green consumption, enterprises pay more attention to environmental protection investment and sustainable development paths; and in response to public satisfaction and environmental performance orientation [102], local governments increase investment in green infrastructure and pollution control, and improve governance responsiveness and transparency. The improvement of public awareness provides a solid social foundation for green policies, and also constructs a key support for the sustainable enhancement of the resilience of urban ecosystems.
6. Heterogeneity Analysis
To further examine the differentiated impacts of EST on UER, this paper conducts a heterogeneity analysis from three perspectives: urban hierarchy, governance capacity, and resource endowment. These dimensions correspond to the institutional reception, governance implementation, and structural foundations of policy transmission, respectively. They reflect the variation among cities in institutional acceptance, policy execution, and transformation basis, and significantly influence the vulnerability, responsiveness, and adaptive capacity of urban ecosystems. These factors, in turn, determine the strength of the path and expression of the policy role in ecosystem resilience and enrich the understanding of the unevenness of UER development.
6.1. City-Level Differences
6.1.1. City Size
As an important structural variable affecting the policy transmission mechanism, city scale profoundly shapes the path dependence and institutional response basis of urban green governance. The size of the city not only determines the local government’s resource allocation capacity and policy implementation means, but also directly affects its institutional flexibility and policy absorption efficiency. To systematically examine the heterogeneity of policy effects across cities of different sizes, this paper introduces a group dummy variable, assigning a value of 1 to small and medium-sized cities and 0 to others, thereby categorizing the sample for subgroup regression analysis. Columns (1) and (2) of Table 7 correspond to small cities and large/medium-sized cities, respectively. Regression results show that EST has a significantly positive effect in small cities, while its impact is statistically insignificant in large and medium-sized cities. Moreover, the difference observed between the two groups reaches statistical significance, indicating that smaller cities are more inclined to exhibit governance dynamics catalyzed by policy interventions. This may be attributed to their ongoing green system construction, greater incentive potential, and shorter institutional response pathways. In such cases, the marginal incentives of external policies can be fully released. While large and medium-sized cities have strong governance foundations and resource support, their governance structures are more solid, and institutional inertia and policy overlap limit the space for new incentives to reach them, thus weakening the significance of policy effects.
6.1.2. City Hierarchy
As an important manifestation of the hierarchical structure of the administrative and resource systems, the city level also serves as a critical driver of the implementation of national green policies. Differences in governance resources, policy priorities, and institutional weights between different levels of cities affect their institutional transformation capacity and behavioral response efficiency to the pilot policy. To identify the mechanism in depth, this paper sets up a grade dummy variable, assigning non-tier-1 cities to 1 and tier-1 cities to 0, according to which the groups are divided and the heterogeneity regression is carried out. Columns (3) and (4) of Table 7 represent first-tier cities and non-first-tier cities, respectively, and the results show that the EST significantly improves UER in non-first-tier cities, while it has no statistically significant effect in first-tier cities, and the difference between groups reaches a significant level. Compared with tier-1 cities, where the institutional system is more solidified, non-tier-1 cities are more resilient in receiving policy resources and stimulating governance vitality. On the one hand, these cities bear lighter institutional burdens and retain untapped policy space, allowing more focused implementation of transformative measures. On the other hand, their stronger reliance on pilot policies as strategic levers for development enhances their responsiveness and execution efficiency, thereby amplifying the marginal impact of EST.
Table 7.
Heterogeneous effects across city tiers.
Table 7.
Heterogeneous effects across city tiers.
| (1) | (2) | (3) | (4) | |
|---|---|---|---|---|
| Variable | UER | UER | UER | UER |
| Treat | 0.0264 *** | 0.00615 | −0.00215 | 0.0188 *** |
| (0.00479) | (0.00766) | (0.00855) | (0.00380) | |
| Constant | 2.482 *** | 2.194 *** | 4.124 *** | 1.599 *** |
| (0.276) | (0.737) | (0.346) | (0.581) | |
| Control Variables | Yes | Yes | Yes | Yes |
| Year FE | Yes | Yes | Yes | Yes |
| City FE | Yes | Yes | Yes | Yes |
| Observations | 2343 | 1331 | 454 | 3258 |
| R2 | 0.972 | 0.975 | 0.827 | 0.974 |
| Empirical p-value for group coefficient difference | 0.022 | 0.014 | ||
Note: *** indicate significance at 1% statistical levels, respectively, with standard errors in parentheses.
6.2. Urban Governance Capacity
6.2.1. Ecological Functional Location
Ecological functional location profoundly affects the policy response boundary and institutional mobilization basis of cities during the transformation process. Especially in the context of the continuous advancement of the institutionalization and rule-of-law process of ecological civilization construction, whether a city is located in a national key ecological protection area constitutes a key dimension of the heterogeneity of green governance capacity. To identify the differentiation characteristics of the policy implementation effect under the difference of ecological location, this paper sets up a dummy variable of ecological functional location, assigning a value of 1 to the cities along the Yangtze River Basin, and 0 to the cities not along the Yangtze River Basin, and conducts a group regression accordingly. Columns (1) and (2) of Table 8 correspond to cities located within the Yangtze River Basin and those outside the basin, respectively. The results indicate that EST has a significant positive impact on UER in non-basin cities, whereas the effect is statistically insignificant in cities located within the Yangtze River Basin. Moreover, the intergroup difference is statistically significant. This finding reveals the moderating effect of ecological functional location on policy incentives: cities in the Yangtze River Basin have been covered by multiple strategies due to their heavier ecological governance responsibilities, and have widely distributed policy resources. However, their governance focus is dispersed, their institutional penetration is limited, and their marginal policy incentive effect is weakened. In contrast, non-basin cities have relatively centralized governance tasks that have not yet been included in the intensive policy management framework, giving them stronger institutional space and implementation flexibility, and making it easier to rapidly release policy effects. Ecological location not only determines the initial empowerment of policy resources, but also invisibly reconfigures the institutional landing point and implementation momentum of green policies.
6.2.2. Strength of Policy Orientation
As a key institutional arrangement under China’s green development strategy, the designation of environmentally friendly cities reflects the central government’s differentiated expectations for local ecological governance. This institutional identity directly affects the local government’s role and degree of response in the process of green policy acceptance, resource deployment, and institutional mobilization. To analyze the differences in the response of cities under the strength of institutional orientation, this paper sets dummy variables, assigning environmental cities a value of 1 and non-environmental cities a value of 0, and accordingly conducts the test of heterogeneity. Columns (3) and (4) of Table 8 represent environmental and non-environmental cities, respectively, and the results show that EST presents a significant positive governance effect in non-environmental cities, while it does not show a significant effect in environmental cities, where the disparity between the groups reaches statistical significance. This result points to the “governance loading effect” of policy incentives, i.e., as a mature ecological governance region, environmental cities have long been intensively invested in policy resources, and their green infrastructures and institutional systems are relatively complete, however, institutional inertia and governance saturation make it difficult for new policies to exert a strong leverage effect. In contrast, non-environmental cities are still in the institutional development phase and possess higher policy flexibility, stronger incentive effects, and greater responsiveness to transformation goals. This again shows that the effect of policy implementation is highly dependent on the “development stage” of the local institutional environment, and the path of incentive release varies according to the city’s institutional positioning.
Table 8.
Heterogeneous effects across levels of urban governance capacity.
Table 8.
Heterogeneous effects across levels of urban governance capacity.
| (1) | (2) | (3) | (4) | |
|---|---|---|---|---|
| Variable | UER | UER | UER | UER |
| Treat | 0.00437 | 0.0316 *** | 0.00636 | 0.0223 *** |
| (0.00530) | (0.00630) | (0.00499) | (0.00489) | |
| Constant | 2.625 *** | 1.837 *** | 3.156 *** | 0.888 |
| (0.492) | (0.519) | (0.259) | (0.982) | |
| Control Variables | Yes | Yes | Yes | Yes |
| Year FE | Yes | Yes | Yes | Yes |
| City FE | Yes | Yes | Yes | Yes |
| Observations | 1412 | 2262 | 1429 | 2245 |
| R2 | 0.986 | 0.966 | 0.950 | 0.976 |
| Empirical p-value for group coefficient difference | 0.004 | 0.06 | ||
Note: *** indicate significance at 1% statistical levels, respectively, with standard errors in parentheses.
6.3. Urban Resource Endowment
6.3.1. Urban Resource Base
The structure of urban resource endowment constitutes an important foundation of its development path and policy adaptability. Against the background of an accelerated green transition, there are significant differences between resource cities and non-resource cities in terms of governance inertia and institutional flexibility. To examine whether the impact of EST varies by resource endowment, a dummy variable is constructed, where resource-based cities are coded as 1 and non-resource-based cities as 0. Columns (1) and (2) of Table 9 present the results for resource-dependent cities and cities without resource dependence, respectively. The findings indicate that EST has a significant positive effect on UER in non-resource-based cities, whereas its impact is not statistically significant in resource-based cities. Moreover, the difference in coefficients between these groups is highly significant. The results confirm the constraints of institutional path dependence and structural factors on policy effectiveness. Resource-based cities have long relied on fossil energy and primary processing industries, with solidified energy structures and strong institutional inertia, and tend to show weak absorption capacity and insufficient motivation for implementation in the face of green transition policies. Non-resource cities, on the other hand, rely more on policy guidance and structural adjustment to stimulate internal energy, and have stronger institutional adaptability and incentive transformation ability, which can more effectively transform policy incentives into green governance behavior. This difference reveals that resource endowment not only shapes the material conditions for development, but also profoundly influences the institutional logic of ecological policies.
6.3.2. Urban Energy Consumption
The level of energy consumption, serving as a key indicator of urban industrial structure and development intensity, also imposes varying constraints on the responsiveness to EST. To further explore the governance dynamics of the policy response, columns (1) and (2) of Table 9 show the results of the grouping of energy consumption below and above the mean, respectively. The results show that the EST exhibits a significant positive governance effect in high-energy-consuming cities, but not in low-energy-consuming cities, and the intergroup coefficient difference is near the threshold of statistical significance. This finding suggests that high energy pressure not only constitutes an external constraint on green transition, but also strengthens the governance motivation and willingness of city governments to act. Under the guidance of “dual-carbon” goal, high-energy-consuming cities, facing stronger environmental protection review and resource pressure, tend to be more inclined to promote improvement of the energy mix and green upgrading of industries with the help of policy tools, and thus show stronger institutional implementation and policy transformation effectiveness. In contrast, low-energy-consuming cities have mild governance pressures, weaker policy-driven urgency, and more gradual response paths, resulting in policy incentives not being fully released. The level of energy consumption is thus not only a physical indicator, but also reflects the differentiated logic of policy implementation motivation.
Table 9.
Heterogeneous effects across urban resource endowments.
Table 9.
Heterogeneous effects across urban resource endowments.
| (1) | (2) | (3) | (4) | |
|---|---|---|---|---|
| Variable | UER | UER | UER | UER |
| Treat | −0.000774 | 0.0323 *** | 0.0139 | 0.0280 *** |
| (0.00552) | (0.00732) | (0.00856) | (0.00515) | |
| Constant | 2.946 *** | 1.503 ** | 2.570 *** | 2.487 *** |
| (0.351) | (0.588) | (0.564) | (0.309) | |
| Control Variables | Yes | Yes | Yes | Yes |
| Year FE | Yes | Yes | Yes | Yes |
| City FE | Yes | Yes | Yes | Yes |
| Observations | 1453 | 2221 | 1723 | 1946 |
| R2 | 0.965 | 0.976 | 0.576 | 0.989 |
| Empirical p-value for group coefficient difference | 0.000 | 0.094 | ||
Note: ***, ** indicate significance at 1%, 5% statistical levels, respectively, with standard errors in parentheses.
7. Further Analysis
System-oriented ecological transformation policies do not directly generate green capacity but instead guide urban systems toward endogenous green governance through regulation, resource reallocation, and behavioral adaptation. Based on the mechanism analysis of the EST setting, the preceding sections reveal the multi-dimensional mechanism path from external regulation to internal response of “institutional regulation–resource allocation–energy substitution–cognitive drive”, which shows how the policy can realize the ecological system through the mediation of behavioral reshaping. It illustrates how policy effects are transmitted through behavioral reshaping to establish the micro-foundations of UER. However, whether this chain can be transformed into sustainable ecosystem stability does not depend on the strength of the feedback from a single link, but on whether cities have the systematic basis and operating mechanism to translate institutional incentives into green development capacity. In other words, the sustainability and depth of policy effects hinge on whether green factor allocation can shift from externally imposed directives to internalized inertia, allowing green behavior to become the natural equilibrium rather than a forced response. This process of capacity leap is the fundamental step for the pilot policy of new energy demonstration cities to realize the transition from a “regulatory tool” to a “developmental system”, and lays a deep foundation of technology–structure–institution synergy for the sustainable construction of UER.
In this context, this paper introduces two core variables, green total factor productivity (GTFP) and green financial development (GFD) level, to identify the evolution of EST from “short-term behavioral incentives” to “systemic ecosystem resilience enhancement”, from the dimension of capacity generation of green transformation to that of systemic support. The former captures structural improvements in green production efficiency, while the latter reflects the institutional environment’s role in regulating and amplifying policy impacts—together offering a theoretical and structural deepening of policy transmission mechanisms.
7.1. Green Total Factor Productivity—Policy-Driven Path of Capability Jumps
GTFP is not only the output performance of green transformation [103], but also an important intermediary variable for the policy effect “from input to embedding”. GTFP integrates green production efficiency, resource and environmental suitability, and technology absorption capacity, reflecting the ability of the system to reshape the deep logic of the urban production system. Policies should not only stimulate single-point actions, but also guide cities to form self-enhancing feedback mechanisms in green factor integration, industrial restructuring, and energy use patterns. When energy restructuring significantly improves the GTFP of a city, it means that the green production mode has gone beyond passive implementation and entered into a cycle where institutional incentives and systemic resilience are mutually reinforcing, a feedback mechanism that is the structural embodiment of GTFP.
The empirical results in Table 10 (1) further validate the above theoretical judgment. The regression shows that the EST significantly improves the level of urban GTFP, indicating that the institutional supply not only generates a response on the behavioral side, but also leaves a lasting imprint on the capacity side. This “regulation–behavior–capability” evolution chain indicates that the reshaping of ecosystem resilience is not a direct result of short-term policy pull, but a new dynamic equilibrium between urban production structure, governance logic, and ecological resilience after the systematic improvement of green efficiency.
7.2. Green Finance Development—The Amplification and Regulation Path of Institutional Support
Green finance develoment (GFD) [104] refers to financial guidance, through instruments provided by governments or organizations, aimed at environmental protection, ecological construction, and the sustainable development of society and the economy [105]. In the process of green transformation, green finance, as a key institutional arrangement connecting policy objectives and market behavior, provides stable financial support for projects through capital guidance and risk mitigation mechanisms. Its essence lies in the structural allocation of financial resources to lower the threshold of green transformation and enhance the market’s responsiveness to green development, thus enhancing the accessibility and transmission effectiveness of institutional incentives.
The empirical results in column (2) of Table 10 show that GFD itself has a significant positive effect on UER. At the same time, its interaction term with EST also presents a significant amplification effect, indicating that green finance effectively improves the institutional performance of policy incentives at the city level. In regions with more mature green finance systems, EST is more likely to realize resource docking and mechanism nesting, thus releasing greater ecological governance potential. Further, green finance not only regulates the marginal strength of institutional transmission, but also reshapes the target logic and behavioral boundaries of green governance in practice. Through the organic combination of capital allocation, risk assessment, and performance orientation, green finance promotes the transformation of policy incentives from “external regulation” to “endogenous mechanism”, providing institutional support and market foundations for the sustainable construction of UER. As a regulating node in institutional nesting, green development has shifted from passive implementation to active choice, constituting an important institutional pillar for the long-term operation of EST.
Table 10.
Further analysis.
Table 10.
Further analysis.
| (1) | (2) | |
|---|---|---|
| Variable | GTFP | GFD |
| Treat | 0.0872 *** | 0.0119 ** |
| (0.0225) | (0.00486) | |
| GFD | 0.0892 ** | |
| (0.0402) | ||
| Constant | 3.563 *** | 2.519 *** |
| (1.091) | (0.275) | |
| Control Variables | Yes | Yes |
| Year FE | Yes | Yes |
| City FE | Yes | Yes |
| Observations | 3597 | 3635 |
| R2 | 0.745 | 0.946 |
Note: ***, ** indicate significance at 1%, 5% statistical levels, respectively, with standard errors in parentheses.
8. Conclusions and Recommendations
8.1. Conclusions
In response to the escalating global climate crisis and the imperative of green development transformation, how to enhance the resilience and adaptability of UER under the “double carbon” constraint has become a core proposition of urban governance in various countries. As urbanization continues to advance, the resource pressure and environmental risks borne by ecosystems have increased significantly, and energy structure transformation under institutionalized pathways has gradually become the key to guiding cities toward a leap in ecological resilience. Taking China’s EST as the research carrier, this paper systematically identifies the multi-dimensional transmission mechanism of EST that empowers UER, and advances the understanding of driving mechanisms and policy synergy within the green transition, focusing on the shift from regulatory tools to developmental systems. The empirical analysis shows that EST significantly enhances overall UER, and realizes the deep embedding from external policy regulation to internal governance capacity through the optimal allocation of resources under the guidance of institutional regulation, the cleaner substitution of the energy system, and the enhancement of the public’s green awareness. This institutional stimulation not only drives synergistic changes in energy structure, technological pathways, and behavioral models, but also facilitates a shift from short-term incentives to long-term institutional capacities for green development. Of particular interest is that the marginal governance effect of EST is more significant in areas with a lower level of urbanization, weak governance capacity, and insufficient resource base, further highlighting its adaptive capacity, sensitivity to development stages, and institutional inclusiveness. At the same time, EST has improved the city’s GTFP, and green finance itself has also had a positive impact on ecological resilience. This indicates that, compared to traditional green policy tools that primarily rely on emission standards and resource constraints to achieve external compliance, energy transition policies place greater emphasis on guiding short-term behavior toward long-term capability upgrades, reflecting a functional evolution from “regulatory-oriented” to “development-oriented”. This evolution lays the institutional foundation and intrinsic motivation for building a coordinated, efficient, and systemically integrated green governance framework. In this context, how energy systems shape the long-term resilience of ecosystems has become a core issue that global cities must address in advancing sustainable development and ecological security strategies. The future of urban green transformation depends not only on the short-term incentive effects of governance tools but, more critically, on whether they can leave a sustainable capacity imprint at the systemic level, achieving a fundamental leap from external pressure-driven to internally generated capabilities.
8.2. Policy Suggestions
EST is not only an important institutional innovation for realizing the national “dual-carbon” goal, but also a core instrument that promotes UER and the transformation of the green development paradigm. This paper reveals, from both theory and empirical evidence, that energy restructuring systematically promotes the generation of urban green capacity and ecosystem sustainability through the multi-dimensional linkage path of “institutional regulation–resource allocation–energy substitution–cognitive drive”. Building upon these results, this study offers policy recommendations in three key areas of institutional design, urban governance, and policy synergy, with the aim of promoting the EST from “pilot exploration” to “systemic leap”, forming a more robust and sustainable mechanism for urban green development. At the same time, it contributes Chinese wisdom and Chinese solutions to the global climate change and ecological crisis.
8.2.1. Government Level: Build a Green Policy System with a Complete Structure and Strong Adaptability
Research indicates that in regions with weaker resource endowments and lower governance capabilities, EST demonstrates more significant effects on ecosystem improvement, highlighting the critical role of institutional supply in green transformation. First, institutional design should be optimized to enhance policy implementation capacity, establishing a green institutional framework that is both operational and regionally adaptive. This framework should establish hard targets for energy structure adjustment, green infrastructure development, and ecological space protection, thereby enhancing the rigidity and directionality of policy implementation. Second, institutional and resource allocation mechanisms should be integrated through cross-departmental coordination mechanisms to align energy objectives, project approvals, and land resource management, thereby improving policy efficiency and enforceability. Third, local ecological governance capabilities should be enhanced through differentiated support mechanisms, including fiscal transfers, technical assistance, and a “Green Capacity Enhancement Special Program” to strengthen the policy implementation capacity of medium and small cities.
Internationally, the EU and North America primarily rely on market mechanisms and legal frameworks to advance energy transitions, such as the EU’s Carbon Border Adjustment Mechanism (CBAM) and the U.S. Inflation Reduction Act (IRA), which respectively utilize carbon pricing and subsidy incentives to promote green investments. While these approaches have achieved significant results, they are heavily reliant on established institutional and market foundations. In contrast, China places greater emphasis on policy unity and institutional coordination, using developmental tools to guide green transformation while balancing efficiency improvements and capacity building. This approach, centered on institutional embedding and capacity leapfrogging, not only enhances urban ecological resilience but also provides a feasible model for other developing economies with weaker institutional foundations, highlighting the global significance and institutional characteristics of China’s experience.
8.2.2. City Level: Promoting Green Capacity Leapfrogging and Reshaping Governance Logic
It is found that EST not only stimulates short-term behavioral responses, but also enhances green total factor productivity by improving institutional implementation strength. Therefore, urban governance should focus on the construction of green capacity and mechanism innovation to promote the leap in ecosystem resilience: on the one hand, reshape the city’s economic structure with green efficiency as the guide. On the one hand, the city’s economic structure should be reshaped with an emphasis on green efficiency. This involves promoting EST and facilitating the green upgrading of industries by prioritizing the development of sectors such as energy conservation, new energy manufacturing, and high-end equipment. The goal is to establish a high-quality development system centered around green factor efficiency. On the other hand, the integration and innovation of green technology and governance mechanisms should be advanced by accelerating the construction of green technology platforms, promoting digital regulatory tools such as intelligent energy consumption monitoring systems and distributed energy grid management mechanisms, and enhancing the modernization of governance and UER with technology-driven enhancement. As a key node in the global strategy for climate change mitigation, the experience of cities in green transformation will provide a valuable model for the protection of ecosystems and the sustainable development of cities around the world.
8.2.3. Synergistic Level: Building a Three-Dimensional Green Policy System Integrating System–Finance–Resources
Empirical results show that the level of green financial development significantly enhances the ecosystem governance performance of EST, indicating that the effectiveness of the policy is highly dependent on the support of the financial system and the linkage of resources. Therefore, a “policy–finance–resource” triple synergistic system should be developed: Firstly, strengthen the green financial support system. Improve the green credit incentive mechanism, promote the development of green bonds, carbon financial instruments, and other innovative products, improve the green loan subsidy and carbon asset collateral mechanism, and enhance the proportion and accuracy of green finance in resource allocation. Secondly, promote the synergistic linkage and integrated operation of policy tools. Establish a policy portfolio consisting of financial subsidies, tax incentives, carbon market mechanisms, industrial guidance, and other diversified tools, and enhance the linkage and systemic nature of EST in the fields of environmental protection, finance, and science and technology. Lastly, improve the evaluation feedback and policy iteration mechanism. Build a policy effect assessment system based on UER, implement dynamic monitoring and hierarchical assessment, guide the continuous optimization of policy implementation, and promote policy revision and institutional evolution based on empirical data. This will facilitate China’s transition to a new phase of green development, while also advancing the enhancement of the global green financial system and the achievement of sustainable development goals.
EST has already shown remarkable results in building the green capacity of cities and improving UER. In the next stage, we should promote the evolution of the policy mechanism from an “incentive-based tool” to a “development-based system”, and build a systematic and sustainable strategic framework for urban green transformation. This will provide solid support for achieving global climate governance goals and the construction of an ecological civilization, while also demonstrating China’s leadership and responsibility in global green transformation and ecological security governance.
Author Contributions
Conceptualization, C.L.; Data curation, M.L., M.Y. and N.X.; Formal analysis, M.L., M.Y. and N.X.; Funding acquisition, C.L.; Investigation, M.L., M.Y. and N.X.; Project administration, C.L.; Resources, C.L.; Software, M.L., M.Y. and N.X.; Supervision, Y.T. and C.L.; Validation, M.L., M.Y., N.X., S.C. and Y.T.; Visualization, M.L., M.Y., N.X., S.C., Y.T. and C.L.; Writing—original draft, M.L., M.Y., N.X., S.C., Y.T. and C.L.; Writing—review and editing, M.L., M.Y., N.X., S.C., Y.T. and C.L. All authors have read and agreed to the published version of the manuscript.
Funding
This research was funded by the National Natural Science Foundation of China Youth Science Program (grant No. 72403269, No. 72103022).
Data Availability Statement
The original contributions presented in this study are included in the article. Further inquiries can be directed to the corresponding author.
Conflicts of Interest
The authors declare no conflicts of interest.
References
- Li, C.; Tang, W.; Liang, F.; Wang, Z. The impact of climate change on corporate ESG performance: The role of resource misallocation in enterprises. J. Clean. Prod. 2024, 445, 141263. [Google Scholar] [CrossRef]
- Su, J.; Liang, Y.; Ding, L. Exploration of China’s energy development strategy under the carbon neutrality goal. Chin. Acad. Sci. Bull. 2021, 36, 1001–1009. [Google Scholar] [CrossRef]
- Wang, S.; Ma, L. Does new energy demonstration city policy curb air pollution? Evidence from Chinese cities. Sci. Total Environ. 2024, 918, 170595. [Google Scholar] [CrossRef] [PubMed]
- Alexander, D.E. Resilience and disaster risk reduction: An etymological journey. Nat. Hazards Earth Syst. Sci. 2013, 13, 2707–2716. [Google Scholar] [CrossRef]
- Alberti, M.; Marzluff, J.M. Ecological resilience in urban ecosystems: Linking urban patterns to human and ecological functions. Urban Ecosyst. 2004, 7, 241–265. [Google Scholar] [CrossRef]
- Pickett, S.T.A.; McGrath, B.; Cadenasso, M.L. Ecological resilience and resilient cities. Build. Res. Inf. 2014, 42, 143–157. [Google Scholar] [CrossRef]
- Li, T.; Li, R.; Liu, Y. Does enhanced land use efficiency promote ecological resilience in China’s urban agglomerations? Environ. Impact Assess. Rev. 2025, 115, 108047. [Google Scholar] [CrossRef]
- Zhao, R.; Fang, C.; Liu, H. Evaluating urban ecosystem resilience using the DPSIR framework and the ENA model: A case study of 35 cities in China. Sustain. Cities Soc. 2021, 72, 102997. [Google Scholar] [CrossRef]
- Zhao, L.; Sun, Z. Coordinated development evolution and spatial convergence characteristics of coastal zone urban economic quality and ecological resilience. Econ. Geogr. 2023, 43, 119–129+240. [Google Scholar] [CrossRef]
- Zhang, M.; Ren, Y. Impact of environmental regulation on ecological resilience: A perspective based on “local-neighbor” effects. J. Beijing Inst. Technol. (Soc. Sci. Ed.) 2022, 24, 16–29. [Google Scholar] [CrossRef]
- Zhang, M.; Yang, Y. Impact and mechanism of low-carbon city construction on ecological resilience: A quasi-natural experiment based on low-carbon city pilot policy. East China Econ. Manag. 2025, 39, 69–81. [Google Scholar] [CrossRef]
- Zou, C.; He, D.; Jia, C. Connotation, path of world energy transition and its significance to carbon neutrality. Pet. Explor. Dev. 2021, 42, 233–247. [Google Scholar]
- Fan, Y.; Yi, B.W. The Laws, Driving Mechanisms, and China’s Path of Energy Transition. Manag. World 2021, 37, 95–105. [Google Scholar] [CrossRef]
- Zhou, A.; Wang, S.; Chen, B. Impact of new energy demonstration city policy on energy efficiency: Evidence from China. J. Clean. Prod. 2023, 422, 138560. [Google Scholar] [CrossRef]
- Wu, S.; Jiang, T.; Hong, M. Local government intervention and energy utilization efficiency: Evidence from China’s NEDC policy. Front. Environ. Sci. 2024, 12, 1499235. [Google Scholar] [CrossRef]
- Lu, J.; Wang, E. Impact of new energy demonstration city construction on regional environmental pollution control. Resour. Sci. 2019, 41, 2107–2118. [Google Scholar] [CrossRef]
- Yang, X.; Zhang, J.; Ren, S. Can the new energy demonstration city policy reduce environmental pollution? Evidence from a quasi-natural experiment in China. J. Clean. Prod. 2021, 287, 125015. [Google Scholar] [CrossRef]
- Feng, Y.; Nie, C. Re-examining the effect of China’s new-energy demonstration cities construction policy on environmental pollution: A perspective of pollutant emission intensity control. J. Environ. Plan. Manag. 2022, 65, 2333–2361. [Google Scholar] [CrossRef]
- Jiang, H.; Deng, F. Research on the coordinated governance effect of pollution reduction and carbon reduction in new energy demonstration city construction. Soft Sci. 2025, 39, 60–69. [Google Scholar]
- Huang, M.; Yang, L. Empirical test of carbon reduction effect of new energy demonstration city policy. Stat. Decis. 2025, 41, 54–59. [Google Scholar] [CrossRef]
- Wang, X.; Long, R.; Sun, Q. Spatial spillover effects and driving mechanisms of carbon emission reduction in new energy demonstration cities. Appl. Energy 2024, 357, 122457. [Google Scholar] [CrossRef]
- Li, F.; Zhang, X. Green and low-carbon development effect of China’s new energy demonstration cities. Resour. Sci. 2023, 45, 1590–1603. [Google Scholar] [CrossRef]
- Chen, B.; Jin, F.; Li, G. Can the new energy demonstration city policy promote green and low-carbon development? Evidence from China. Sustainability 2023, 15, 8727. [Google Scholar] [CrossRef]
- Chai, M.; Wu, C.; Luo, Y. New Energy Demonstration City Policy and Corporate Green Innovation: From the Perspective of Industrial and Regional Spillover Effect. Sustainability 2025, 17, 3179. [Google Scholar] [CrossRef]
- Song, Y.; Pang, X.; Zhang, Z. Can the new energy demonstration city policy promote corporate green innovation capability? Energy Econ. 2024, 136, 107714. [Google Scholar] [CrossRef]
- Liu, C.; Tang, C.; Liu, Y. Does the transformation of energy structure promote green technological innovation? A quasi–natural experiment based on new energy demonstration city construction. Geosci. Front. 2024, 15, 101615. [Google Scholar] [CrossRef]
- Chen, M.; Su, Y.; Piao, Z. The green innovation effect of urban energy saving construction: A quasi-natural experiment from new energy demonstration city policy. J. Clean. Prod. 2023, 428, 139392. [Google Scholar] [CrossRef]
- Yang, X.; Wang, W.; Wu, H. The impact of the new energy demonstration city policy on the green total factor productivity of resource-based cities: Empirical evidence from a quasi-natural experiment in China. J. Environ. Plan. Manag. 2022, 66, 293–326. [Google Scholar] [CrossRef]
- Yu, Z.; Xie, W.; Guo, J. Green effect of energy transition policy: A quasi-natural experiment based on new energy demonstration cities. Financ. Res. Lett. 2024, 66, 105669. [Google Scholar] [CrossRef]
- Sun, Y.; Liu, Z.; Liu, Y. Study on the impact of new energy demonstration city construction on green total factor productivity. Macroecon. Res. 2022, 11, 134–146. [Google Scholar] [CrossRef]
- Zhang, Z.; Li, P.; Wang, X. New energy policy and new quality productive forces: A quasi-natural experiment based on demonstration cities. Econ. Anal. Policy 2024, 84, 1670–1688. [Google Scholar] [CrossRef]
- Lee, C.; Ogata, S. Every coin has two sides: Dual effects of energy transition on regional sustainable development—A quasi-natural experiment of the New Energy Demonstration City Pilot Policy. Appl. Energy 2025, 390, 125772. [Google Scholar] [CrossRef]
- Marques, A.C.; Fuinhas, J.A. Is renewable energy effective in promoting growth? Energy Policy 2012, 46, 434–442. [Google Scholar] [CrossRef]
- Lin, M. Clean energy consumption, environmental governance and sustainable economic growth in China. Quant. Econ. Tech. Econ. Res. 2017, 34, 3–21. [Google Scholar] [CrossRef]
- Zhu, H.; Zheng, J.; Zhao, Q. Economic growth, energy structure transition and carbon dioxide emissions: An empirical analysis based on panel data. Econ. Manag. Res. 2020, 41, 19–34. [Google Scholar] [CrossRef]
- Jiang, S.; Du, H.; Xu, M. Dual structural transition of energy and industry under the “dual carbon” goal. Quant. Econ. Tech. Econ. Res. 2024, 41, 109–130. [Google Scholar] [CrossRef]
- Dai, H.; Masui, T.; Matsuoka, Y. Assessment of China’s climate commitment and non-fossil energy plan towards 2020 using hybrid AIM/CGE model. Energy Policy 2011, 39, 2875–2887. [Google Scholar] [CrossRef]
- Alves, M.R.; Moutinho, V. Decomposition analysis and Innovative Accounting Approach for energy-related CO2 emissions intensity over 1996–2009 in Portugal. Energy 2013, 57, 775–787. [Google Scholar] [CrossRef]
- Jiang, W.; Zhang, M.; Ji, P. Dynamic decomposition of industrial pollution emissions in China: Technological progress, resource allocation, and selection effects. Quant. Tech. Econ. Res. 2022, 39, 153–172. [Google Scholar] [CrossRef]
- Ma, L.; Zhang, X. Spatial effects of haze pollution in China and the influence of economic and energy structures. China Ind. Econ. 2014, 4, 19–31. [Google Scholar] [CrossRef]
- Sun, H.; Huang, Z.; Xu, D. Spatial characteristics and driving mechanisms of the coupling between urbanization and ecological environment in the Pan-Yangtze River Delta urban agglomeration. Econ. Geogr. 2017, 37, 163–170+186. [Google Scholar] [CrossRef]
- Guo, H.; Liu, X. Coupling coordination mechanism between new-type urbanization and ecological resilience in central cities along the Yellow River region. East China Econ. Manag. 2023, 37, 101–109. [Google Scholar] [CrossRef]
- Ying, Z.; Yuan, C.; Zhuolu, L. Ecological resilience assessment of an emerging urban agglomeration: A case study of Chengdu-Chongqing Economic Circle, China. Pol. J. Environ. Stud. 2022, 31, 2381–2395. [Google Scholar] [CrossRef]
- Chen, T.; Li, Y. Urban design strategies of urban water environment orientation based on perspective of ecological resilience. Sci. Technol. Rev. 2019, 37, 26–39. [Google Scholar] [CrossRef]
- Cao, T.; Yi, Y.; Liu, H. The relationship between ecosystem service supply and demand in plain areas undergoing urbanization: A case study of China’s Baiyangdian Basin. J. Environ. Manag. 2021, 289, 112492. [Google Scholar] [CrossRef] [PubMed]
- Mert, M.; Caglar, A.E. Testing pollution haven and pollution halo hypotheses for Turkey: A new perspective. Environ. Sci. Pollut. Res. 2020, 27, 32933–32943. [Google Scholar] [CrossRef]
- Li, D.; Yang, W.; Huang, R. The multidimensional differences and driving forces of ecological environment resilience in China. Environ. Impact Assess. Rev. 2023, 98, 106954. [Google Scholar] [CrossRef]
- Chang, X.; Guan, X. Spatio-temporal evolution and influencing factors of ecological efficiency in the Yangtze River Delta urban agglomeration during new-type urbanization. Econ. Geogr. 2020, 40, 185–195. [Google Scholar] [CrossRef]
- Xu, L.; Peng, S.; Wang, L. The synergy of pollution and carbon reduction by green fiscal policy: A quasi-natural experiment utilizing a pilot program from China’s comprehensive demonstration cities of energy conservation and emission reduction fiscal policy. Sustainability 2025, 17, 667. [Google Scholar] [CrossRef]
- Gao, Y.; Zhao, X. The impact of green transformation policy mix on carbon reduction and economic development. J. Xi’an Jiaotong Univ. (Soc. Sci.) 2025, 45, 39–54. [Google Scholar] [CrossRef]
- Baasch, S.; Maschke, J. Participatory governance in decentralized energy transition: Long-term findings from a municipal case study in Germany. J. Environ. Policy Plan. 2025, 27, 244–259. [Google Scholar] [CrossRef]
- Lund, H. The implementation of renewable energy systems. Lessons learned from the Danish case. Energy 2010, 35, 4003–4009. [Google Scholar] [CrossRef]
- Raupach, M.R.; Marland, G.; Ciais, P. Global and regional drivers of accelerating CO2 emissions. Proc. Natl. Acad. Sci. USA 2007, 104, 10288–10293. [Google Scholar] [CrossRef] [PubMed]
- Wang, Q.; Chiu, Y.H.; Chiu, C.R. Driving factors behind carbon dioxide emissions in China: A modified production-theoretical decomposition analysis. Energy Econ. 2015, 51, 252–260. [Google Scholar] [CrossRef]
- Zhang, L.; Wang, L.; Chai, J. Influence of new energy vehicle subsidy policy on emission reduction of atmospheric pollutants: A case study of Beijing, China. J. Clean. Prod. 2020, 275, 124069. [Google Scholar] [CrossRef]
- McDonald, R.I.; Fargione, J.; Kiesecker, J. Energy sprawl or energy efficiency: Climate policy impacts on natural habitat for the United States of America. PLoS ONE 2009, 4, e6802. [Google Scholar] [CrossRef]
- Hamed, T.A.; Alshare, A. Environmental impact of solar and wind energy—A review. J. Sustain. Dev. Energy Water Environ. Syst. 2022, 10, 1090387. [Google Scholar] [CrossRef]
- Tao, F.; Zhao, J.; Zhou, H. Has environmental regulation improved the quantity and quality of green technological innovation? Evidence from environmental target responsibility system. China Ind. Econ. 2021, 2, 136–154. [Google Scholar] [CrossRef]
- Shao, W.; Jin, Z.; Chen, Z. Spatial effects of environmental regulation on regional ecological efficiency: Based on the moderating role of fiscal decentralization. Financ. Econ. Forum 2023, 6, 103–112. [Google Scholar] [CrossRef]
- Burtraw, D.; Krupnick, A.; Palmer, K. Ancillary benefits of reduced air pollution in the US from moderate greenhouse gas mitigation policies in the electricity sector. J. Environ. Econ. Manag. 2003, 45, 650–673. [Google Scholar] [CrossRef]
- Zhang, L. The impact of environmental policy and environmental protection expenditure on regional carbon reduction: Also on the role of government execution. Price Theory Pract. 2018, 6, 38–41. [Google Scholar] [CrossRef]
- Niu, H.; Yan, C. Environmental taxation, resource allocation and high-quality economic development. J. World Econ. 2021, 44, 28–50. [Google Scholar] [CrossRef]
- Zhu, G.; Zhang, J.; Fan, Y. The impact of environmental regulation on resource misallocation in resource-based cities and its spatial heterogeneity. Sci. Geogr. Sin. 2025, 45, 1182–1192. [Google Scholar] [CrossRef]
- Kang, Y.; Yan, C. Environmental regulation and green transformation: An analysis from the perspective of green fiscal and taxation. J. Cent. Univ. Financ. Econ. 2024, 1, 29–46. [Google Scholar] [CrossRef]
- Acemoglu, D.; Aghion, P.; Bursztyn, L. The environment and directed technical change. Am. Econ. Rev. 2012, 102, 131–166. [Google Scholar] [CrossRef]
- Porter, M.E.; Linde, C. Toward a new conception of the environment-competitiveness relationship. J. Econ. Perspect. 1995, 9, 97–118. [Google Scholar] [CrossRef]
- Jeon, J.; Hong, S.; Yang, T. How technological innovation affects the structure of an industry: Entrepreneurship evolution in the biotechnology and pharmaceutical industry since 1980. Technol. Anal. Strateg. Manag. 2016, 28, 733–754. [Google Scholar] [CrossRef]
- Zhou, Q.; Zhang, X.; Shao, Q. The non-linear effect of environmental regulation on haze pollution: Empirical evidence for 277 Chinese cities during 2002–2010. J. Environ. Manag. 2019, 248, 109274. [Google Scholar] [CrossRef]
- Zhang, G.; Zhang, P.; Zhang, Z.G. Impact of environmental regulations on industrial structure upgrading: An empirical study on Beijing-Tianjin-Hebei region in China. J. Clean. Prod. 2019, 238, 117848. [Google Scholar] [CrossRef]
- Mao, J.; Guan, C. Do environmental regulations inhibit industrial structure upgrading?—A nonlinear threshold model analysis based on government behavior. Financ. Trade Res. 2020, 31, 29–42. [Google Scholar] [CrossRef]
- Wang, F.; He, Z. Environmental regulation, green innovation, and industrial structure upgrading. Stat. Decis. 2022, 38, 73–76. [Google Scholar] [CrossRef]
- Cui, L.; Sun, W.; Li, X. Environmental effects of new energy demonstration city construction. East China Econ. Manag. 2022, 36, 57–65. [Google Scholar] [CrossRef]
- Wu, J.; Zuidema, C.; Gugerell, K. Mind the gap! Barriers and implementation deficiencies of energy policies at the local scale in urban China. Energy Policy 2017, 106, 201–211. [Google Scholar] [CrossRef]
- He, Y.; Zhang, X.; Zhang, Y. Can new energy policy promote corporate total factor energy efficiency? Evidence from China’s new energy demonstration city pilot policy. Energy 2025, 318, 134782. [Google Scholar] [CrossRef]
- Liu, X.; Wang, C.; Wu, H. The impact of the new energy demonstration city construction on energy consumption intensity: Exploring the sustainable potential of China’s firms. Energy 2023, 283, 128716. [Google Scholar] [CrossRef]
- Zhang, Q.; Huang, X.; Xu, Y. New energy demonstration city pilot and green energy consumption: Evidences from China. Energy Rep. 2022, 8, 7735–7750. [Google Scholar] [CrossRef]
- Wang, W.; Wang, J.; Wu, H. Assessing the potential of energy transition policy in driving renewable energy technology innovation: Evidence from new energy demonstration city pilots in China. Econ. Change Restruct. 2024, 57, 160. [Google Scholar] [CrossRef]
- Ren, J.; Liu, Y.; Ren, Y. Renewable energy investment in China’s new demonstration cities: A quasi-natural experiment. Util. Policy 2025, 96, 101996. [Google Scholar] [CrossRef]
- Zhang, X.; Huang, X.; Zhang, D. Energy economic transformation pathways and policy research under the carbon neutrality goal. Manag. World 2022, 38, 35–66. [Google Scholar] [CrossRef]
- Wang, G.F.; Liu, H.; Wang, D.D. High-Quality Energy Development and Energy Security in China under the New Situation. Bull. Chin. Acad. Sci. 2023, 38, 23–37. [Google Scholar] [CrossRef]
- Bo, F.; Zhuang, G. Resilience connotation, application scenarios, and realization paths of green infrastructure. J. Cent. Univ. Financ. Econ. 2025, 6, 5–17. [Google Scholar] [CrossRef]
- National Energy Administration. Available online: https://zfxxgk.nea.gov.cn/auto87/201402/t20140212_1762.htm (accessed on 4 August 2025).
- Chu, E.; Sun, H.; Li, Y. Impact of smart city construction on ecological resilience. Manag. Rev. 2023, 36, 21–37. [Google Scholar] [CrossRef]
- Zhang, J.; Peng, J. Performance evaluation of environmental governance and its impact on local economy: An empirical analysis based on 2017 “2+26” cities’ air pollution governance and inspection. J. Anhui Norm. Univ. (Humanit. Soc. Sci. Ed.) 2022, 50, 148–157. [Google Scholar] [CrossRef]
- Lv, T.; Hu, H.; Zhang, X. Spatial spillover effects of urbanization on carbon emissions in the Yangtze River Delta urban agglomeration, China. Environ. Sci. Pollut. Res. 2022, 29, 33920–33934. [Google Scholar] [CrossRef] [PubMed]
- Chen, H.; Luo, L. The impact and spatial effects of environmental regulation on high-quality economic development: Based on the intermediary perspective of industrial structure transformation. J. Beijing Inst. Technol. (Soc. Sci. Ed.) 2021, 23, 27–40. [Google Scholar] [CrossRef]
- Li, C.; Wang, X.; Li, B. Urban Intelligence, Labor Supply of Residents, and Inclusive Employment: Evidence from a Quasi-Natural Experiment. J. Econ. Manag. Res. 2023, 44, 41–59. [Google Scholar] [CrossRef]
- Jiang, T. Mediation and moderation effects in causal inference empirical research. China Ind. Econ. 2022, 5, 100–120. [Google Scholar] [CrossRef]
- Liu, H.; Zhong, Y. Emission reduction effects and mechanisms of carbon trading and carbon tax. Commer. Res. 2023, 1, 98–107. [Google Scholar] [CrossRef]
- Li, C. The impact of government green investment on economic, social, and ecological benefits. Bus. Econ. 2021, 11, 78–80+139. [Google Scholar] [CrossRef]
- Wang, J.; Hu, X.; Song, J. Unleashing the power of green fiscal policies: Driving energy efficiency in China. Energy 2024, 312, 133402. [Google Scholar] [CrossRef]
- Zhou, Y.; Lin, B. The energy-saving effect of green fiscal policy: Empirical evidence from China’s comprehensive demonstration cities of energy conservation and emission reduction fiscal policy. Appl. Energy 2025, 378, 124784. [Google Scholar] [CrossRef]
- Huang, J.T. Sulfur dioxide (SO2) emissions and government spending on environmental protection in China—Evidence from spatial econometric analysis. J. Clean. Prod. 2018, 175, 431–441. [Google Scholar] [CrossRef]
- Ghisetti, C.; Quatraro, F. Green technologies and environmental productivity: A cross-sectoral analysis of direct and indirect effects in Italian regions. Ecol. Econ. 2017, 132, 1–13. [Google Scholar] [CrossRef]
- Xu, T.; Kang, C.; Zhang, H. China’s efforts towards carbon neutrality: Does energy-saving and emission-reduction policy mitigate carbon emissions? J. Environ. Manag. 2022, 316, 115286. [Google Scholar] [CrossRef] [PubMed]
- Fan, W.; Hao, Y. An empirical research on the relationship amongst renewable energy consumption, economic growth and foreign direct investment in China. Renew. Energy 2020, 146, 598–609. [Google Scholar] [CrossRef]
- Jiang, C.; Yan, Z.; Wang, M. From dual control of energy consumption to dual control of carbon emissions under the “dual carbon” target: Regulatory tools, effect simulation, and policy evaluation. China Ind. Econ. 2024, 11, 5–23. [Google Scholar] [CrossRef]
- Yang, X.; Yuan, J.; Ren, Y. Spatiotemporal evolution and influencing factors of resilience in resource-based cities—From the perspective of low-carbon energy transition. Stat. Decis. 2025, 41, 105–110. [Google Scholar] [CrossRef]
- Yang, G.; Wang, H.; Fan, H. The carbon emission reduction effect of the digital economy: Theoretical analysis and empirical evidence. China Ind. Econ. 2023, 5, 80–98. [Google Scholar] [CrossRef]
- Dian, J.; Song, T.; Li, S. Facilitating or inhibiting? Spatial effects of the digital economy affecting urban green technology innovation. Energy Econ. 2024, 129, 107223. [Google Scholar] [CrossRef]
- Yu, X. Mechanism and practice change of environmental regulation policy: An analysis based on policy evolution from 1978 to 2016. China Sci. Forum 2017, 12, 15–24+31. [Google Scholar] [CrossRef]
- Zheng, S.; Wan, G.; Sun, W. Public demands and urban environmental governance. Manag. World 2013, 6, 72–84. [Google Scholar] [CrossRef]
- Wang, B.; Liu, G. Energy saving and emission reduction and China’s green economic growth: From the perspective of total factor productivity. China Ind. Econ. 2015, 5, 57–69. [Google Scholar] [CrossRef]
- Si, L.; Cao, H. Can green credit policy improve corporate environmental social responsibility? Based on external constraints and internal concerns. China Ind. Econ. 2022, 4, 137–155. [Google Scholar] [CrossRef]
- Wang, X.; Wang, Y. Research on green credit policy promoting green innovation. Manag. World 2021, 37, 173–188+11. [Google Scholar] [CrossRef]


Disclaimer/Publisher’s Note: The statements, opinions and data contained in all publications are solely those of the individual author(s) and contributor(s) and not of MDPI and/or the editor(s). MDPI and/or the editor(s) disclaim responsibility for any injury to people or property resulting from any ideas, methods, instructions or products referred to in the content. |
© 2025 by the authors. Licensee MDPI, Basel, Switzerland. This article is an open access article distributed under the terms and conditions of the Creative Commons Attribution (CC BY) license (https://creativecommons.org/licenses/by/4.0/).