Abstract
Against the backdrop of the growing popularity of blockchain technology, this study investigates blockchain adoption strategies for the fresh food supply chain (FFSC) under a carbon cap-and-trade (CAT) policy. Taking a two-echelon supply chain consisting of a supplier and a retailer as an example, we designed four blockchain adoption modes based on the supplier’s strategy (adopt or not) and the retailer’s strategy (adopt or not). Combining influencing factors such as consumers’ low-carbon preference, consumers’ freshness preference, and carbon trading price (CTP), we established four game-theoretic models. Using backward induction, we derived the equilibrium strategies for the supplier and retailer under different modes and analyzed the impact of key factors on these equilibrium strategies. The analysis yielded four key findings: (1) BB mode (both adopt blockchain) is the optimal adoption strategy for both FFSC parties when carbon prices are high, and consumers exhibit strong dual preferences. It most effectively mitigates the negative price impact of rising carbon prices by synergistically enhancing emission reduction efforts and freshness preservation efforts, thereby increasing overall profits and achieving a Pareto improvement in the benefits for both parties. (2) Consumers’ low-carbon preference and freshness preference exhibit an interaction effect. These two preferences mutually reinforce each other’s incentive effect on FFSC efforts (emission reduction/freshness preservation). Blockchain’s information transparency makes these efforts more perceptible to consumers, forming a synergistic “emission reduction-freshness preservation” cycle that further drives sales and profit growth. (3) The adoption of blockchain by either the supplier or the retailer significantly lowers the cost threshold for the other party to adopt blockchain, thereby increasing their willingness to adopt. (4) CAT and consumer preferences jointly influence the adoption strategies of suppliers and retailers. Additionally, the adoption strategies of FFSC participants are also affected by the other party’s blockchain adoption status. Drawing on the above conclusions, this study provides actionable guidance for suppliers and retailers in selecting optimal blockchain adoption strategies.
1. Introduction
Consumer demand for fresh food is increasingly evolving, shifting from a singular focus on price towards a comprehensive consideration of multiple dimensions such as freshness and low-carbon attributes [1]. This shift in demand is driving the refinement of the FFSC (fresh food supply chain). However, the perishable nature of fresh food means that the entire chain, from production to consumption, is highly dependent on cold chain transportation and low-temperature storage. This process is accompanied by significant energy consumption: statistics show that 40% of global food requires refrigeration, and the fossil fuel energy consumed in the refrigeration stage of food transportation accounts for 15% of the global total [2]. Optimizing emission reduction pathways for this sector has become a global focus. In this context, regions and countries such as Europe, the US, Japan, and South Korea have pioneered the implementation of carbon labeling systems. These systems quantify the carbon footprint throughout a product’s lifecycle, providing consumers with a basis for making low-carbon choices. Simultaneously, policy tools like carbon taxes and carbon trading are widely applied in various countries. China has not only established multiple carbon trading pilots but has also launched a national carbon trading market, using market-based mechanisms to drive emission reductions [3]. This means the FFSC must achieve the dual challenge [4] of ensuring product freshness while simultaneously pursuing low-carbon objectives. Furthermore, the widespread issue of information asymmetry in the current FFSC makes it difficult for consumers to effectively identify and recognize the emission reduction initiatives of suppliers and the freshness preservation efforts of retailers. This directly impedes the flow of economic benefits generated by carbon reduction and freshness preservation efforts throughout the FFSC. Blockchain technology, with its characteristics of decentralization, immutability, and end-to-end traceability [5], offers a new approach to solving the challenges. Specifically, the FFSC can utilize blockchain technology to record key information in real-time—such as suppliers’ emission reduction measures, energy consumption data during cold chain transportation, and retailers’ application of freshness preservation technologies—onto the chain. This enables the efforts of suppliers and retailers to be visibly demonstrated and validated. In practice, Walmart, in collaboration with IBM, uses blockchain to track its leafy green vegetable supply chain, reducing product traceability time from the original 7 days to just 2.2 s. This technology allows for rapid identification of the source when food safety issues arise. Carrefour employs the IBM Food Trust blockchain platform to track its chicken and vegetable supply chains. Consumers can scan a QR code on the product to access complete information, including origin, production date, transportation data, and temperature data [6]. However, adopting blockchain technology also increases supply chain costs. Balancing the relationship between CTP (carbon trading price), blockchain implementation costs, and fresh food profits is crucial. Given this, this paper constructs a dynamic game theory model of a two-echelon FFSC (comprising a supplier and a retailer) against the backdrop of CAT (carbon cap-and-trade policy). Focusing on consumer preferences for low-carbon attributes and freshness, the model explores the optimal decisions and profit differences under four distinct blockchain adoption models.
This study aims to address the following questions:
- (1)
- How do the impacts of CAT and consumer dual preferences (for low-carbon attributes and freshness) on the FFSC’s emission reduction efforts, freshness preservation efforts, and pricing strategies differ under various blockchain adoption models?
- (2)
- What are the specific aspects of the interaction between consumers’ low-carbon preferences and freshness preferences after adopting blockchain technology in the supply chain?
- (3)
- Which blockchain adoption model can achieve a “win-win” situation for supply chain members? How can supply chain participants be guided to adopt this model?
The contributions of this paper are primarily reflected in the following three aspects: First, we incorporate scenarios where suppliers or retailers individually adopt blockchain technology into our model. This enables us to analyze blockchain’s impact on the fresh food supply chain from an internal perspective, thereby precisely examining decision-making logics and behavioral differences among members regarding technology adoption. Second, by integrating carbon cap-and-trade policies with consumers’ low-carbon preferences and freshness preferences, we explore blockchain applications in fresh food supply chains. This approach better aligns with real-world blockchain implementation scenarios and carries significant practical relevance. Finally, due to the prioritization of profit maximization by supply chain members in decision-making, different blockchain adoption strategies have emerged. We have defined clear boundary conditions for the adoption of blockchain in the fresh food supply chain. Through quantitative analysis of these boundary conditions, we investigated how carbon policies and dual consumer preferences (low-carbon and freshness) jointly influence blockchain adoption strategies, thereby guiding members towards mutually beneficial outcomes.
In the subsequent chapters, Section 2 reviews the research literature related to this paper; Section 3 elaborates on the research questions and puts forward basic assumptions for the model to be constructed; Section 4 establishes four game theory models for four different blockchain adoption modes and solves and briefly analyzes the models; Section 5 conducts a comparative analysis of the equilibrium solutions obtained in Section 4 and draws some conclusions; Section 6 carries out a numerical simulation analysis of the model constructed in this paper; and Section 7 summarizes the conclusions of this paper and provides corresponding management implications.
2. Literature Review
This paper will review relevant research progress from three aspects—Supply Chain Emission Reduction Strategies under CAT and Consumer Preferences and Application of Blockchain Technology—while also pointing out the shortcomings of existing research and the contributions of this paper.
2.1. Carbon Cap-and-Trade Policy and Supply Chain Emission Reduction Strategies
CAT incentivizes enterprises to reduce emissions through market mechanisms. For example, Yang et al. explored the impact of CAT on freshness preservation efforts in two types of FFSC dominated by suppliers and retailers, respectively [7]. Wang et al., against the backdrop of CAT, analyzed the replenishment behavior of retailers and the carbon trading behavior of suppliers within an FFSC comprising a single supplier and multiple retailers [8]. Liu et al. incorporated factors such as CTP, freshness preservation effort, and emission reduction effort to build a decision-making model for the FFSC. Under the CAT framework, they analyzed the impact of emission reduction and freshness preservation efforts on supply chain profit [9]. Bai et al. considered factors, including the freshness of fresh food, promotional effort, and carbon emission reduction level, studying the coordination and optimization of a manufacturer–retailer two-echelon cold chain under CAT [10]. Ma et al., assuming the demand for fresh products follows a multiplicative form of freshness, price, and random influencing factors, investigated the decisions and coordination within a supplier-third-party logistics (TPL)–retailer three-echelon cold chain under CAT [11]. Zhang et al. constructed a competitive decision-making model to explore the influence of carbon emissions from fresh food preservation on a traditional and low-carbon FFSC. They revealed how these two types of supply chains dynamically adjust product output, freshness level, and emission reduction level under CAT [12]. Dhanda et al. developed an FFSC model involving suppliers, TPL, and retailers, analyzing the impact of refrigerated logistics service price on retail price under CAT [13]. The aforementioned studies provide in-depth analyses of the impact of CTP on FFSC operations, encompassing areas such as freshness preservation efforts [7], replenishment behavior [8], profit-driven preservation and emission decisions [9], cold-chain coordination [10], multi-echelon logistics [11], competitive dynamics [12], and pricing strategies [13]. However, existing models universally assume perfect information symmetry across supply chain tiers. This overlooks the real-world opacity of emissions data and freshness verification, which directly compromises decision-making accuracy under carbon cap-and-trade policies. This study bridges these gaps by introducing blockchain as an enabling factor for carbon policy implementation, explicitly modeling its role in resolving information asymmetry. We further analyze how blockchain technology reconfigures the influence of CTP on adaptation strategies within FFSCs.
2.2. Preferences
Existing research identifies several key preferences consumers exhibit when purchasing fresh food, including low-carbon preference, freshness preference, channel preference, and traceability preference. For example, Richartz et al. employed a hybrid latent variable model to investigate the impact of the COVID-19 pandemic on consumer low-carbon preference and willingness to pay for fresh tomatoes. Their results indicated significant shifts in consumer preferences and WTP before and after pandemic lockdowns [14]. Xu et al. constructed a dual-channel supply chain game model that considered consumers’ increasing focus on freshness and carbon footprint when purchasing agricultural products. They explored the impact of consumer preferences on supply chain decisions, finding that the supply chain’s cost structure determines the freshness and low-carbon levels of fresh food [15]. Aparna et al. analyzed the impact of consumer channel preference, consumer demand shifting, and Buy-Online-Pickup-In-Store (BOPIS) services on retailer inventory strategies by developing a consumer demand function [16]. Du et al. analyzed the influence of consumer low-carbon preference on supply chain emission reduction efficiency, finding that an increase in this preference can incentivize emission reduction investments within the supply chain [17]. Meng et al. analyzed pricing strategies in a dual-channel FFSC by building a model that incorporated consumer green preference and channel preference, alongside government subsidies, aiming to explore optimal solutions under different scenarios [18]. Li et al. considered the influence of consumer low-carbon preference on a two-echelon supply chain, advocating for carbon emission cost-sharing to create a win-win situation for FFSC participants [19]. Fan et al. analyzed the influence of retailer altruism preference and consumer low-carbon preference on supply chain profits [20]. They found that moderate consumer low-carbon preference benefits low-carbon transformation in the supply chain, while excessive preference can be detrimental to profitability. Cao et al. posited that product price and green level determine consumer demand for agricultural products, while supply chain greening efforts can enhance the green level of these products [21]. Bera et al. examined the influence of consumer traceability preference, low-carbon preference, and brand preference on the decisions and pricing of supply chain participants [22]. Chen et al. discovered that consumers exhibit traceability preference and credit supervision preference and are willing to pay a premium for blockchain technology [23]. Existing research demonstrates that fresh food purchasing decisions are driven by multifaceted preferences, including low-carbon attributes [14,15,16,17], product freshness [15], purchase channels [16], and traceability [22,23]. These preferences significantly influence pricing strategies [18], emission efficiency [17], inventory management [16], and profitability [20]. Notably, consumers’ traceability preference makes them willing to pay premiums for blockchain-verified product attributes [23]. However, models capturing how consumer dual preferences (low-carbon and freshness) jointly influence blockchain adoption strategies remain scarce in existing studies. To bridge this gap, this research develops a demand model to analyze the joint impact of dual preferences on blockchain adoption boundaries and describes the interaction mechanism between low-carbon preference and freshness preference.
2.3. Application of Blockchain Technology
Blockchain’s traceability and data immutability offer new tools for enhancing transparency in the FFSC. Contini et al. examined blockchain’s role in increasing consumer trust in product information, arguing that the technology empowers consumers with knowledge and enhances their trust in product quality [24]. Wu et al. compared supply chain dynamics before and after blockchain adoption, finding that adoption is not necessarily optimal; its viability depends on fresh food freshness levels and the cost of blockchain technology [25]. Daksh et al. analyzed the impact on profits for a supply chain comprising a fresh food supplier and an e-commerce platform, comparing scenarios with and without blockchain adoption [26]. Liu et al. analyzed the competitive relationship between traditional and online sales channels, discovering that this competition incentivizes supply chain firms to adopt blockchain technology and increase freshness preservation efforts [27]. Li et al. focused on an FFSC with a supplier and an e-retailer, analyzing the impact of freshness preservation level and blockchain technology adoption level in the supply chain [28]. Xu et al. analyzed the correlation between blockchain adoption strategies and the establishment of third-party stores [29]. They found that adopting blockchain requires considering consumer freshness preference, information trust, and blockchain costs. Furthermore, establishing third-party stores can motivate firms to adopt blockchain. Plulo et al., through a case study of the global fresh-cut flower supply chain, found that suppliers can apply blockchain technology to specific segments based on practical needs rather than the entire chain, thereby reducing costs [30]. Yi et al. analyzed the factors influencing blockchain adoption in agricultural supply chains and proposed incentive strategies to promote its adoption [31]. Keskin et al. designed a smart contract concerning freshness consensus leveraging blockchain. By adjusting this contract, they enabled a win-win outcome for both supply chain parties [32]. Yuan et al. analyzed blockchain adoption strategies for an FFSC from a competitive perspective and provided optimized traceability solutions for products of varying quality [33]. Existing research demonstrates that blockchain, leveraging its immutability and traceability, not only enhances transparency in fresh food supply chains and strengthens consumer trust [24] but also enables the emergence of novel coordination mechanisms, such as freshness-centric smart contracts [32]. Concurrently, studies have explored the feasibility of blockchain implementation [25,26] and its impact on profits [26,28], channel competition dynamics [27,33], and partial implementation strategies [30]. However, models employed in these studies [24,25,26,27,28,29,30,31,32,33] universally presume synchronized, full-chain blockchain adoption, failing to account for real-world scenarios where individual supply chain members adopt the technology separately. Different from the above research, this study explicitly models scenarios where individual supply chain participants adopt blockchain technology, focusing specifically on the game-theoretic relationships that emerge among members post-adoption.
We summarize the most relevant literature in Table 1 and highlight the research gap. Existing research has primarily analyzed the impact of CAT on supply chain freshness levels, emission reduction intensity, output, and prices, and explored the influence of various consumer preferences (including low-carbon preference, freshness preference, channel preference, and traceability preference) on supply chain decisions. Crucially, consumer traceability preference makes them willing to pay for blockchain adoption by the supply chain. Existing research has investigated the application of blockchain technology in the FFSC, examining its impact on consumer trust, supply chain profits, and competitive dynamics. However, these studies mostly address scenarios where all participants adopt blockchain simultaneously. This paper differentiates itself from prior research in the following three key aspects: (1) Building upon existing studies on the impact of carbon policies, it further investigates how this impact changes after blockchain adoption and explores adaptation strategies for FFSCs. (2) Unlike existing consumer preference research, it compares the impact of consumers’ dual preferences (low-carbon and fresh) on FFSCs under different blockchain adoption strategies and analyzes the interaction between these two preferences. (3) It considers scenarios where individual FFSC participants adopt blockchain separately, analyzing the game-theoretic relationships that emerge post-adoption, rather than focusing solely on simultaneous adoption by all participants.

Table 1.
Literature comparison.
3. Problem Description and Underlying Assumptions
Under the dual context of government CAT regulating carbon emissions and continuous advancements in digital technology, this paper considers a two-echelon FFSC system comprising an upstream supplier and a downstream retailer. Suppliers transport processed fresh food to retailers, who then sell the fresh food to consumers. In this process, the supplier determines the wholesale price (w) of the fresh food based on production costs, while the retailer sets the retail price (p) based on market demand and the supplier’s wholesale price. Additionally, the average production volume of the supplier per cycle is q.
With the gradual improvement of consumers’ environmental awareness, an increasing number of consumers are showing low-carbon preferences and freshness preferences when purchasing fresh food. However, in the traditional FFSC system, consumers are faced with the problem of opaque product environmental protection information, making it difficult for suppliers’ emission reduction efforts to be effectively identified and recognized by consumers. To address the above pain points, suppliers and retailers can adopt blockchain technology and make full use of the characteristics of blockchain traceability technology, such as decentralization, openness, transparency, and non-tamperable information [5], to stimulate consumers’ enthusiasm for purchasing fresh food. The structure of a two-echelon FFSC based on blockchain technology is shown in Figure 1.
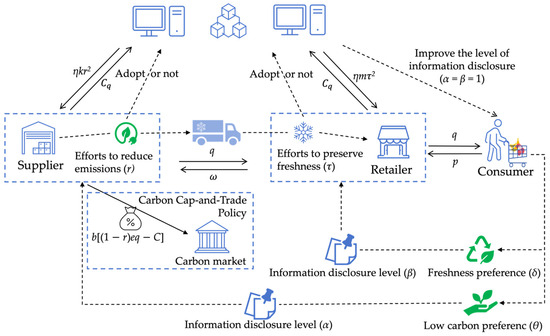
Figure 1.
The structure of a two-echelon FFSC based on blockchain technology.
Assumption 1.
In the two-echelon fresh food supply chain involved in this study, suppliers and retailers have clear primary divisions of responsibilities in emission reduction and freshness preservation. Suppliers are the main bearers of emission reduction responsibilities. They directly affect the carbon footprint of products through decisions, such as adopting clean energy, using sustainable packaging, and optimizing transportation routes. Meanwhile, their operational measures, such as cold chain transportation and packaging selection, also provide basic support for the freshness of products. This study assumes that suppliers take improving the emission reduction rate as their core decision-making goal. Retailers, on the other hand, mainly take on the responsibility of freshness preservation. They maintain product freshness by means of cold chain management, inventory turnover, and in-store handling. Their practices, such as energy efficiency management and waste disposal, also have an auxiliary impact on overall emission reduction. This study assumes that retailers take improving product freshness as their core decision-making goal. For example, Bakker Belgium, a subsidiary of the Belgian fresh food supplier Greenyard, has invested in an electric transport fleet and supporting charging facilities (powered by solar energy) to deliver fruits and vegetables to Delhaize supermarkets. This measure reduces CO2 emissions by 58 tons per year, while Delhaize focuses on store refrigeration technology and inventory management to ensure the freshness of delivered goods.
Assumption 2.
Under the CAT, the supplier is allocated a carbon cap denoted by C, and the CTP is denoted by b. If the actual carbon emissions fall below C, the surplus carbon allowance can be sold on the carbon trading market; conversely, exceeding C necessitates purchasing additional allowances. The supplier can also adopt emission reduction technologies to decrease carbon emissions, thereby enhancing the product’s environmental friendliness.
Assumption 3.
The carbon emissions per unit of fresh food product during production and transportation by the supplier are denoted by e. After the supplier invests in carbon reduction technology, the emission reduction rate per unit product is r. Following references [34,35], the investment cost for emission reduction is given by kr2, where k > 0. Similarly, the retailer’s freshness preservation effort level is denoted by τ, and the freshness preservation cost is mτ2, where m > 0 [28]. Furthermore, blockchain technology enables the end-to-end recording and precise tracking of energy consumption data, clearly revealing the energy usage status at each production stage [27]. By adopting blockchain, the supplier can collaboratively verify and monitor carbon emission data, effectively preventing data errors and inconsistencies, reducing carbon emission monitoring costs, and pinpointing high-energy-consumption stages. Based on this, the supplier can formulate targeted emission reduction strategies, avoid redundant investments, and lower reduction costs [36]. Consequently, after blockchain adoption, the supplier’s emission reduction cost coefficient k decreases. It is assumed that post-blockchain adoption, the emission reduction cost coefficient reduces to (1-η)k, and the freshness preservation cost coefficient reduces to (1 − η)m [37].
Assumption 4.
Consumer preferences consist of their low-carbon preference (θ) and their freshness preference (δ) for fresh food products. Consumers’ willingness to purchase fresh food changes in response to the disclosed unit product emission reduction rate (r) and the freshness preservation effort level (τ), as detailed in Section 4.1.
Assumption 5.
The cost for the decision-makers (supplier and retailer) to adopt blockchain technology is cq [33].
Assumption 6.
When supply chain members do not adopt blockchain, suppliers and retailers disclose product information to improve the efficiency of fresh food, which enhances consumers’ willingness to pay. It is assumed that the information disclosure levels of suppliers and retailers are α and β, respectively. If supply chain members adopt blockchain, the information disclosure level will become 1 [38].
The relevant parameters of this study are shown in Table 2.
Table 2.
Parameter list.
4. Model Construction and Solution
Based on the model assumptions proposed in Section 3, this section constructs demand functions for four different blockchain adoption modes and then establishes four game theory models and solves and briefly analyzes each model.
4.1. Consumer Demand Function
Following references [39,40], the potential market demand is denoted as d. It is assumed that consumer demand is a linear function of freshness preservation effort (τ), emission reduction effort (r), consumer freshness preference (δ), low-carbon preference (θ), and the retail price of fresh food (p). Since consumers’ preferences for fresh food (δ, θ) increase demand, and consumers prefer lower-priced products under otherwise equal conditions, consumer demand is positively correlated with consumer preferences (δ, θ) and negatively correlated with the retail price (p). Furthermore, considering the adoption status of blockchain technology, the consumer demand function for fresh food under different blockchain adoption modes is given by:
(1) NN model: Neither suppliers nor retailers have adopted blockchain technology
(2) NB model: Only retailers adopt blockchain technology
(3) BN model: Only suppliers adopt blockchain technology
(4) BB model: Both suppliers and retailers are adopting blockchain technology
4.2. Decision Model for Fresh Food Supply Chain in NN Model
CAT does not directly cut product carbon emissions. Instead, it spurs carbon-emitting entities to adopt carbon-reduction technologies, effectively lowering emissions [40]. In the FFSC, each stakeholder makes decisions to maximize individual profits, which is a dynamic game process.
In the first stage of the game, the retailer makes decisions based on the supplier’s efforts to reduce emissions (), and the wholesale price (), and determines the optimal order quantity and retail price . That is, given and , the retailer decides on p, q, and τ to maximize its expected profit:
In the second stage, the supplier determines the optimal wholesale price per unit of fresh food based on its own production and emission reduction costs, the quantity of fresh food purchased by retailers, and the carbon trading cost. That is, given b and C and , the supplier makes decisions on and r to maximize its expected profit:
By combining Formulas (1) and (2), the total profit of the FFSC system can be obtained:
Theorem 1.
(1) In the NN model, that is, when neither the supplier nor the retailer introduces blockchain, the optimal purchasing quantity and preservation effort level of retailers, as well as the adjusted wholesale pricing and emission reduction rate of suppliers, are as follows:
When ,
where .
(2) In the NN model, the optimal expected profits of the supplier and the retailer are presented below:
Proof of Theorem 1.
From Equation (6), it is easy to verify that is a strictly concave function with respect to and . By calculating , , , , the Hessian matrix of the e-commerce platform’s profit function can be derived. Therefore, the first-order and second-order leading principal minors of must satisfy and , respectively, indicating that is negative definite. Thus, the retailer’s profit reaches its maximum value.
Let , , a simultaneous solution yields
Substituting and into Equation (1) yields
Similarly, by verifying that is a strictly concave function of and , we can calculate that and . Therefore, has a maximum value. Let and , where , we solve the equations simultaneously to obtain the equilibrium solutions and . Substituting these into and , we derive the retailer’s optimal order quantity and freshness preservation effort. Finally, by plugging the equilibrium solutions into Equations (5) and (6), we obtain , , and , and then Theorem 1 is proven. □
Corollary 1.
In the NN model,
A: (1) ; ; ; ;
(2) When , , otherwise ; when ,, otherwise ; when , , otherwise ;
Please refer to Appendix A for the proof process of the Corollary in this article.
When CTPs rise under the NN model, the supplier’s increased costs lead to corresponding hikes in the wholesale and retail prices of fresh food. The rise in fresh food retail prices causes a decline in sales volume, reducing retailer profits. Changes in supplier profits depend on the carbon quota level: when the carbon quota exceeds a specific threshold, rising CTPs can boost supplier profits, as suppliers can sell surplus carbon allowances to increase their earnings. Conversely, if the carbon quota is low, supplier profits decrease alongside rising CTPs. Additionally, the supplier’s emission reduction effort depends on the cost coefficient k: when k is low, the supplier increases emission reduction efforts. However, if emission reduction costs exceed the saved carbon trading expenses, the supplier reduces emission reduction efforts. For retailers, when consumer freshness preference δ and product information disclosure level β both reach certain thresholds, rising CTPs can enhance the retailer’s freshness preservation efforts; otherwise, retailers reduce preservation efforts to control costs. In practice, blockchain platforms can enable real-time recording and sharing of supplier emission reduction data and retailer preservation data, maximizing information disclosure levels to optimize preservation effort effectiveness, which aligns with subsequent analysis:
B: (1) ; ; ;
(2) When , , , , otherwise , , ;
Consumers’ low-carbon preference influences the pricing strategy of the FFSC. When this preference strengthens, suppliers strategically raise wholesale prices, thereby driving up the retail price of fresh food. This price adjustment inversely impacts consumer demand: while heightened low-carbon preference incentivizes suppliers to increase emission reduction efforts, low product information disclosure levels prevent consumers from recognizing these efforts. Consequently, an increase in consumer low-carbon preference may paradoxically lead to a decline in product sales:
C: (1) ; ; ; ; ;
(2) When , , otherwise ;
Consumers’ freshness preference also impacts the pricing strategy of the FFSC. When this preference strengthens, retailers strategically raise retail prices, prompting suppliers to increase wholesale prices. These price adjustments affect consumer demand: although heightened consumer freshness preference incentivizes retailers to enhance freshness preservation efforts, insufficient product information disclosure prevents consumers from recognizing these efforts, leading to a paradoxical decline in product sales despite increased freshness preference.
Therefore, improving information disclosure levels constitutes the key pathway to maximizing the effectiveness of suppliers’ emission reduction efforts and retailers’ freshness preservation efforts, with blockchain technology adoption serving as the essential means to achieve this goal. In subsequent sections, this paper conducts further analysis on different blockchain adoption models (NB, BN, and BB).
4.3. Decision Model for Fresh Food Supply Chain in NB Model
In this section, both suppliers and retailers make decisions based on the principle of maximizing profits. Therefore, when the government adopts the CAT, the profit functions corresponding to the total profits of suppliers, retailers, and the system are as follows:
Theorem 2.
(1) In the NB model, when only retailers introduce blockchain technology, the optimal purchasing quantity and preservation effort level of retailers, as well as the adjusted wholesale pricing and emission reduction rate of suppliers, are as follows:
When ,
where , .
(2) In the NB model, the optimal expected profits of the supplier and the retailer are presented below:
where , .
The proof of Theorem 2 is similar to Theorem 1.
Lemma 1.
By comparing Theorem 1 and Theorem 2, when the blockchain adoption cost is , .
Lemma 1 shows that when the supplier does not adopt blockchain technology, if the cost of adopting blockchain is less than a specific threshold, the retailer will be more inclined to adopt blockchain technology. Therefore, is the boundary condition for the retailer to adopt blockchain technology.
Proof of Lemma 1.
Let . When (i.e., ), the retailer prefers blockchain adoption; otherwise, it does not. Setting , we solve the equation:
Solving the equation yields
Observing , when , . Thus, Lemma 1 is proven. □
Corollary 2.
In the NB model,
A: (1) ; ; ; ;
(2) When , , otherwise ; when , , otherwise ; when , , otherwise, , where .
Similar to Corollary 1, under the NB model, an increase in CTP leads to corresponding rises in the wholesale and retail prices of fresh food. The increase in retail prices causes a decline in sales volume, reducing retailer profits. Unlike the NN model, although retailer adoption of blockchain technology has no significant impact on wholesale prices under the NB model, this technology can enhance the effectiveness of freshness preservation efforts by improving the retailer’s information disclosure level, effectively reducing the magnitude of retail price increases and slowing the sales decline rate, thereby weakening the negative impact of CTP on retailer profits. Additionally, when consumer freshness preference is high, an increase in CTP can boost the retailer’s freshness preservation efforts, which aligns with the conclusion of Corollary 1. Meanwhile, the correlation between supplier profits, emission reduction efforts, and CTP shows no significant change:
B: (1) ; ; ;
(2) ; ; ; ; ; ;
In the NB model, retailer adoption of blockchain significantly amplifies the influence of consumer freshness preference on fresh food pricing strategies, thereby strengthening the incentive effect for retailers to enhance preservation efforts. Additionally, with increased product information transparency, market sales of fresh food will consistently maintain a positive correlation with consumer freshness preference. This positive linkage ensures that heightened freshness preference continuously drives revenue growth for both suppliers and retailers.
4.4. Decision Model of Fresh Food Supply Chain Under BN Model
In the BN model, when only suppliers introduce blockchain technology, the profit function corresponding to the total profits of suppliers, retailers, and the system is:
Theorem 3.
(1) In the BN model, the optimal purchasing quantity and preservation effort level of retailers, as well as the adjusted wholesale pricing and emission reduction rate of suppliers, are as follows:
When ,
where , .
(2) In the BN model, the optimal expected profits of the supplier and the retailer are presented below:
where , .
The proof of Theorem 3 is similar to Theorem 1.
Lemma 2.
By comparing Theorem 1 and Theorem 3, when the blockchain adoption cost is , .
Lemma 2 indicates that when the retailer does not adopt blockchain technology, if the cost of adopting blockchain is less than a specific threshold, the supplier will be more inclined to adopt blockchain technology. Therefore, is the boundary condition for the supplier to adopt blockchain technology.
The proof of Lemma 2 is similar to Lemma 1, where
Corollary 3.
In the BN model,
A: (1) ; ; ; ;
(2) when , , otherwise ; when and , , otherwise ; when , , otherwise ;
In the BN model, when CTPs rise, supplier adoption of blockchain technology moderates the increase in wholesale prices. As the wholesale price rise slows, fresh food sales gradually increase. When the carbon emission cap is low, if CTPs exceed a specific threshold, supplier profits achieve positive growth. Additionally, retail prices and retailer profits gradually rise with increasing CTP within a threshold range but decline once beyond this threshold. Corollary 3 further indicates that supplier blockchain adoption enhances the positive incentive effect of CTP on emission reduction efforts:
B: ; ; ; ; ; ;
In the BN model, suppliers adopting blockchain can enhance the utility of emission reduction efforts by improving information disclosure levels. Specifically, the tamper-proof nature of blockchain enables consumers to more clearly perceive suppliers’ emission reduction actions, thereby amplifying the impact of low-carbon preferences on supplier decision-making. This influence is not only reflected in increased emission reduction investments but will also be transmitted to wholesale pricing strategies and market sales volumes. Although wholesale prices rise due to optimized emission reduction costs—leading to corresponding retail price increases—the enhanced purchasing willingness driven by consumer low-carbon preferences will stimulate positive sales growth. Ultimately, this achieves a win-win situation for the benefit of FFSC participants.
4.5. Decision Model of Fresh Food Supply Chain in BB Model
In the BB model, where both suppliers and retailers introduce blockchain technology, the corresponding profit functions for suppliers and retailers are:
Theorem 4.
(1) In the BB model, the optimal purchasing quantity and preservation effort level of retailers, as well as the adjusted wholesale pricing and emission reduction rate of suppliers, are as follows:
When ,
where , .
(2) In the BB mode, the optimal expected profits of the supplier and the retailer are presented below:
where , .
The proof of Theorem 4 is similar to Theorem 1.
Lemma 3.
By comparing Theorems 2 and 4, when the blockchain adoption cost is , .
Lemma 3 indicates that on the premise that the retailer has adopted blockchain technology, if the cost of adopting blockchain is less than , the supplier will be more inclined to choose to adopt blockchain technology. Therefore, serves as the boundary condition for the supplier to adopt blockchain technology under this circumstance.
The proof of Lemma 2 is similar to Lemma 1, where
Lemma 4.
By comparing Theorems 3 and 4, when the blockchain adoption cost is , .
Lemma 4 indicates that on the premise that the supplier has adopted blockchain technology, if the cost of adopting blockchain is less than , the retailer will be more inclined to choose to adopt blockchain technology. Therefore, is the boundary condition for the retailer to adopt blockchain technology under this circumstance.
The proof of Lemma 2 is similar to Lemma 1, where
Corollary 4.
In the BB model,
A: (1) ;
(2) When , , , otherwise , , ; when and , , otherwise ; when , , otherwise ; when , , otherwise , where , .
In the BB model, compared to the BN model, simultaneous blockchain adoption by both supplier and retailer further suppresses the wholesale price increase trend. Notably, when CTPs exceed a specific threshold, wholesale prices exhibit an inverse variation trend, decreasing as CTPs rise. This shift in wholesale prices directly influences the retailer’s pricing strategy: fresh food retail prices decrease following the wholesale price decline, while market sales volumes consequently contract. Corollary 4 further indicates that simultaneous blockchain adoption by both parties maximizes the positive incentive effect of CTP on the supplier’s emission reduction efforts. Additionally, compared to the NB model, the rate of increase in the retailer’s freshness preservation efforts under the BB model is lower. This phenomenon stems from the retailer’s “free-rider” mentality: when the supplier adopts blockchain and increases emission reduction investment, product sales rise due to the enhanced transparency of low-carbon value. Consequently, to optimize cost structures, the retailer deliberately slows the pace of freshness preservation efforts.
B: ; ; ; ; ; .
Compared to the BN model, simultaneous blockchain adoption by both supplier and retailer further amplifies the impact of consumer low-carbon preferences on the FFSC beyond the BN baseline, maximizing the effectiveness of emission reduction efforts:
C: ; ; ; ; ; .
Compared to the NB model, such joint adoption further amplifies the influence of consumer freshness preferences beyond the NB baseline, maximizing the effectiveness of preservation efforts.
5. Comparison and Analysis
This section compares the equilibrium results under the above four models (NN, NB, BN, and BB) and discusses the equilibrium strategies of whether to adopt blockchain or not. Figure 2, Figure 3, Figure 4 and Figure 5 visualize the comparison results. In addition, referring to references [33,41], the relevant parameters are assigned as follows: , , , , , , , , , , and .
5.1. The Impact of Blockchain Adoption Strategy on Supply Chain
Proposition 1.
The impact of blockchain adoption strategies on emission reduction and preservation efforts.
A: ;
Proposition 1A indicates that the application of blockchain technology can incentivize suppliers to enhance their emission reduction efforts, but the incentive effects of different blockchain adoption strategies on suppliers’ efforts to improve emission reduction vary, which is consistent with the visualization results in Figure 2. Specifically, the supplier’s own adoption of blockchain technology exerts a more significant incentive effect on enhancing emission reduction efforts compared to retailer adoption. When both the supplier and retailer adopt blockchain simultaneously, the supplier’s emission reduction effort level is maximized.
B: When b < b1, ; when b1 < b < b2, ; when b > b2, , where , .
Please refer to Appendix A for the proof process of the Proposition in this article.
Proposition 1B indicates that retailers exhibit higher freshness preservation effort levels when adopting blockchain technology yet demonstrate “free-rider” behavior, consistent with the visualization in Figure 2b. Specifically, rising CTPs increase the supplier’s emission reduction efforts, leading to higher consumer purchases of fresh food. To reduce preservation costs, retailers lower their preservation effort levels while maintaining their own profits. Additionally, Proposition 1B reveals that at lower CTPs, the NB model yields higher retailer preservation levels, whereas when CTPs exceed a specific threshold, the BB model becomes the optimal approach for enhancing preservation efforts.

Figure 2.
The influence of CAT on emission reduction and preservation efforts. (a) The influence of b on emission reduction efforts; (b) The influence of b on preservation efforts.
Figure 2.
The influence of CAT on emission reduction and preservation efforts. (a) The influence of b on emission reduction efforts; (b) The influence of b on preservation efforts.

Proposition 2.
The impact of blockchain adoption strategy on the sales of fresh food.
A: When , ; when , ;
Proposition 2A indicates that the retail price of fresh produce is simultaneously influenced by CTPs and blockchain adoption strategies. Specifically, when CTPs are uniformly low, the cost of adopting blockchain technology outweighs supplier benefits, resulting in higher wholesale prices. Conversely, when CTPs are high, blockchain adoption enables suppliers to save on carbon trading costs. Under such conditions, simultaneous blockchain adoption by both suppliers and retailers minimizes wholesale prices—a finding consistent with Figure 3.
B: When , , otherwise .
Proposition 2B demonstrates that when CTPs exceed a specific threshold, retail prices decrease under supplier blockchain adoption and fall below levels observed without such adoption, aligning with Figure 3b. This occurs because blockchain adoption reduces suppliers’ carbon trading costs, lowering wholesale prices. Reduced procurement costs for retailers subsequently drive down retail prices.
C: When , , otherwise , where .
Proposition 2C establishes that when CTPs surpass a specific threshold, concurrent blockchain adoption by suppliers and retailers maximizes sales volume, as validated by Figure 3c. This phenomenon stems from Propositions 2A and 2B: above the carbon price threshold, blockchain implementation reduces both wholesale and retail prices. Furthermore, blockchain enhances product information transparency, allowing consumers to better perceive emission reduction and freshness-keeping efforts by suppliers and retailers, thereby significantly boosting purchase intention. The synergistic effect of these factors ultimately optimizes sales of fresh food under the BB strategy.

Figure 3.
The influence of CAT on the sales of fresh food. (a) The influence of b on wholesale prices of fresh food; (b) The influence of b on the retail price of fresh food; (c) The influence of b on the sales of fresh food.
Figure 3.
The influence of CAT on the sales of fresh food. (a) The influence of b on wholesale prices of fresh food; (b) The influence of b on the retail price of fresh food; (c) The influence of b on the sales of fresh food.

Proposition 3.
The impact of blockchain adoption strategy on the profits of the FFSC.
A: When and , ; when and , ;
B: When and , , otherwise . Where , , , , .
Proposition 3A demonstrates that when CTPs are low, retailers’ blockchain adoption increases supplier profitability, whereas suppliers achieve maximum profits by abstaining from adoption due to lower carbon trading costs. Conversely, when CTPs are high, suppliers’ cost savings from blockchain adoption exceed implementation expenses, leading to optimal supplier profitability under simultaneous adoption by both parties.
Proposition 3B indicates that retailers consistently attain higher profitability when suppliers adopt blockchain technology, whereas supplier non-adoption results in diminished retailer profits. This reveals retailers’ free-riding behavior, further establishing that supplier blockchain adoption is crucial for enhancing retailer profitability.
Finally, Proposition 3 establishes that when CTP exceed critical thresholds, mutual blockchain adoption enables Pareto improvement for both parties—a conclusion visually confirmed in Figure 4’s analytical demonstration.

Figure 4.
The influence of CAT on the profit of the FFSC. (a) The influence of b on supplier profits; (b) The influence of b on retailer profits.
Figure 4.
The influence of CAT on the profit of the FFSC. (a) The influence of b on supplier profits; (b) The influence of b on retailer profits.

5.2. The Impact of CTP and Consumer Preferences on Blockchain Adoption Strategies
Combining Lemma 1 to Lemma 4, the boundary conditions for suppliers and retailers to adopt blockchain technology are obtained. Based on these boundary conditions, further analysis was conducted to derive Propositions 4 and 5.
Proposition 4.
The impact of blockchain adoption strategy on the profits of the FFSC.
A: ;
B: ;
Proposition 4 indicates that when either the supplier or retailer adopts blockchain technology, it will lower the cost threshold for the other party to adopt the technology, thereby creating an incentive effect on the other party’s adoption behavior, which is consistent with the visual analysis in Figure 5.
Proposition 5.
The impact of blockchain adoption strategy on the profits of the FFSC.
A: ;
B: ;
C: ;
Proposition 5 establishes that in FFSC decision-making, blockchain adoption behaviors by suppliers and retailers are differentially influenced by factors, including CTP and consumer preferences, as visualized in Figure 5.
For suppliers: When retailers abstain from blockchain adoption, suppliers become more inclined to adopt as CTPs rise and low-carbon preferences strengthen, yet heightened consumer freshness preferences diminish adoption willingness. Conversely, when retailers have adopted blockchain, increases in all three factors significantly boost suppliers’ adoption motivation.
For retailers: Without supplier blockchain adoption, only intensified freshness preferences effectively drive retailer adoption. However, once suppliers pioneer adoption, rising carbon prices, stronger low-carbon preferences, and enhanced freshness preferences collectively incentivize retailers to follow suit.
Integrating Propositions 4 and 5 reveals three pathways to foster joint blockchain adoption: First, leverage carbon markets’ price regulation mechanisms; rationally elevating carbon prices enhances suppliers’ emission reduction incentives while amplifying blockchain’s value in carbon management. Second, strengthen consumer education programs to concurrently cultivate dual preferences for low-carbon consumption and freshness consciousness, harnessing this demand-side dual drive to motivate blockchain adoption across the FFSC. Third, encourage technological coordination between FFSC members; pioneering adoption by one party reduces the other’s implementation concerns, establishing a self-reinforcing cycle that ultimately achieves comprehensive blockchain integration and deep application throughout the FFSC.

Figure 5.
The influence of CAT and consumer preferences on the adoption boundaries of blockchain among FFSC participants. (a) The influence of θ on the adoption of boundary conditions in blockchain; (b) The influence of δ on the adoption of boundary conditions in blockchain; (c) The influence of b on the adoption of boundary conditions in blockchain.

6. Numerical Analysis
To validate the four blockchain adoption models mentioned above, the impact of consumer dual preferences on the adoption decisions of suppliers and retailers were further analyzed, and relevant conclusions were drawn. This section uses Matlab R2022b software for example simulation, and the relevant parameter assignments are consistent with Section 5: , , , , , , , , , , and [33,41].
6.1. The Impact of Consumer Preferences on Preservation and Emission Reduction Efforts Under Different Blockchain Adoption Models
Figure 6 reveals that consumers’ freshness preferences incentivize retailers to intensify fresh-keeping efforts, with mutual blockchain adoption maximizing such efforts when freshness preferences are high; conversely, under low freshness preferences, the BN strategy yields peak preservation efforts as retailers engage in free-riding behavior, leveraging the transmission effect of low-carbon preferences to boost sales and subsequently optimizing freshness standards while ensuring profit maximization.
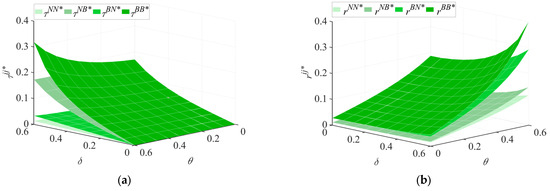
Figure 6.
The influence of consumer preferences on the level of preservation efforts and emission reduction efforts. (a) The influence of θ and δ on the level of preservation efforts (τ) of retailers; (b) The influence of θ and δ on supplier emission reduction efforts (r).
Please refer to Appendix B for the robustness test of Figure 6.
Figure 6b demonstrates that consumers’ low-carbon preferences drive suppliers to elevate emission reduction investments, where dual blockchain adoption maximizes suppliers’ reduction efforts. Furthermore, blockchain adoption by suppliers (versus retailers) more effectively enhances these efforts. Synthesizing Figure 6’s findings, it can be inferred that Corollary 5 holds.
Corollary 5.
The influence of consumer low-carbon preferences (θ, δ) on preservation and emission reduction efforts under different blockchain adoption models.
A: ;.
Corollary 5 establishes that heightened consumer low-carbon preferences amplify the positive impact of freshness preferences on preservation investments; conversely, enhanced freshness preferences intensify the stimulative effect of low-carbon preferences on emission reduction efforts, as shown in Figure 6. When both preferences strengthen simultaneously, they maximally stimulate FFSC investments in both emission reduction and freshness preservation.
6.2. The Impact of Consumer Preferences on Supply Chain Profits Under Different Blockchain Adoption Models
Figure 7 demonstrates that enhanced consumer preferences for both freshness and low-carbon attributes increase profitability for suppliers and retailers. This occurs because heightened low-carbon preferences drive suppliers to elevate emission reduction investments, while stronger freshness preferences incentivize retailers to intensify fresh-keeping efforts, as established in Section 6.1. Increased emission reduction investments lower suppliers’ carbon trading costs, whereas enhanced preservation efforts boost product sales. The synergistic effect of these mechanisms significantly amplifies profitability for both parties. However, the magnitude of this positive impact varies across blockchain adoption models, with the BB strategy exhibiting the most pronounced effect, enabling suppliers and retailers to achieve peak profitability.
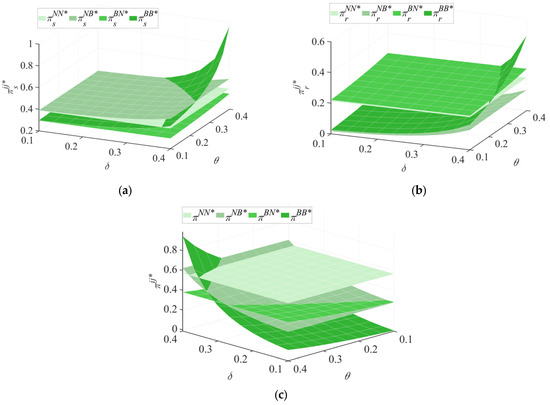
Figure 7.
The influence of consumer preferences on FFSC profits. (a) The influence of θ and δ on supplier profits; (b) The influence of θ and δ on retailer profits; (c) The influence of θ and δ on the total profit of the FFSC.
Please refer to Appendix B for the robustness test of Figure 7.
7. Conclusions
This study focuses on four different blockchain adoption models and constructs four game theory models: NN, NB, BN, and BB. By combining the CTP and consumers’ dual preferences, it conducts a systematic analysis of the decisions made by various parties under different blockchain adoption models in the FFSC and reveals the mechanism of blockchain technology in supply chain emission reduction, freshness-keeping, and profit improvement. The following elaborates on the results of this study and future research directions from three dimensions: the main findings, management insights, and research prospects.
7.1. Main Findings
This study investigates blockchain adoption in an FFSC under CAT, examining decision-making differences between suppliers and retailers across adoption models, analyzing impacts of carbon policies and dual consumer preferences on FFSC decisions, and conducting an in-depth assessment of blockchain’s role. The main findings are as follows:
Firstly, most existing studies assume complete information symmetry among various levels of the supply chain [7,8,9,10,11,12,13], which ignores the opacity of emission data and freshness in reality. This directly affects the decision-making of supply chain members under the CTP. This study introduces blockchain as an enabling factor for the implementation of the CTP and reveals its role in solving information asymmetry. The research finds that an increase in CTP will push up wholesale and retail prices and lead to a decline in sales volume. However, blockchain technology can alleviate this negative effect, and different adoption strategies have different effects. Among them, under the BB model (both parties adopt blockchain), blockchain synergy can maximize the enhancement of emission reduction efforts and even make the wholesale price reverse decline when the carbon price is high.
Secondly, there are boundary conditions for suppliers and retailers to adopt blockchain technology. Through the analysis of these boundary conditions, it is found that when either the supplier or the retailer adopts blockchain technology, it will reduce the cost threshold for the other party to adopt the technology, thereby increasing the other party’s willingness to adopt blockchain.
Thirdly, in existing studies, there is a lack of models on how consumers’ dual preferences (for low carbon and freshness) jointly affect blockchain adoption strategies [14,15,16,17,18,19,20,21,22,23]. To fill this gap, this study analyzes the joint impact of consumers’ dual preferences on the boundaries of blockchain adoption. The research finds the following: (1) The impact of consumer preferences on supply chain decisions varies depending on the entities that adopt blockchain. Specifically, consumer preferences are rooted in their environmental awareness, and the strength of such awareness depends on the information disclosure level of supply chain members. Therefore, when consumers’ preference for low carbon intensifies, under the BN model, the supply chain can further amplify the incentive effect of this preference on suppliers’ emission reduction efforts by improving the level of product information disclosure, thereby driving sales growth. When consumers’ preference for freshness strengthens, the NB model will significantly promote retailers to enhance their freshness preservation efforts. However, in the BB model, where suppliers have already adopted blockchain, retailers may reduce their own freshness preservation input due to “free-riding” behavior. (2) There is a significant interaction between consumers’ preference for low carbon and their preference for freshness, and blockchain technology will strengthen this synergistic effect. Specifically, on the one hand, the improvement of consumers’ low-carbon preference can enhance the marginal utility of freshness preference on freshness preservation efforts; on the other hand, the improvement of freshness preference will amplify the promoting effect of low-carbon preference on emission reduction efforts. This two-way enhancement reaches its peak under the BB model because the dual information transparency of blockchain makes it easier for consumers to perceive the efforts of the supply chain, forming an “emission reduction—freshness preservation” synergistic cycle, and ultimately improving the overall profit of the supply chain. (3) The BB model (both parties adopt blockchain) is the optimal choice in most scenarios, but its realization requires specific conditions. Specifically, when the CTP is higher than a certain threshold and consumers have strong dual preferences, this model can enable both suppliers and retailers to achieve Pareto improvement in profits, reaching a “win-win” situation; this is also a motivation for supply chain members to choose the BB model. In contrast, in the NB, BN, and NN models, suppliers and retailers are always unable to maximize their interests, so these models are not the optimal options.
Fourthly, the models used in existing studies [24,25,26,27,28,29,32,33] all presuppose that blockchain is implemented synchronously in the entire supply chain, failing to cover the real scenarios where supply chain members adopt blockchain individually. Different from existing studies, this study incorporates the situation where supply chain participants adopt blockchain technology individually into the model, focusing on exploring the game relationship between supply chain members after the application of blockchain technology. The research finds the following: (1) For suppliers, if retailers have not adopted blockchain technology, the increase in carbon prices and the enhancement of consumers’ low-carbon preferences will promote suppliers to adopt blockchain, while the improvement of consumers’ preference for freshness will weaken their willingness to adopt it. If retailers have already adopted blockchain technology, the increase in carbon prices, low-carbon preferences, and freshness preferences will all encourage suppliers to adopt blockchain. (2) For retailers, if suppliers have not adopted blockchain technology, only the strengthening of consumers’ preference for freshness can prompt retailers to adopt it. If suppliers have taken the lead in adopting blockchain technology, the increase in carbon prices, as well as the enhancement of low-carbon preferences and freshness preferences, will all drive retailers to follow suit in adopting blockchain.
7.2. Management Insights
Based on the conclusions in Section 7.1, we obtained the following management insights:
- (1)
- Emission reduction and freshness preservation can be achieved synergistically, and complete information disclosure has significant market value. The study shows that through the collaborative adoption of blockchain upstream and downstream in the supply chain (the BB model), enterprises can not only effectively cope with the pressure of carbon costs but also achieve dual improvements in emission reduction and freshness preservation. Blockchain technology enables emission reduction efforts (such as the use of clean energy) and freshness preservation measures (such as cold chain optimization) to be completely recorded and presented to consumers in an immutable manner. This transparency significantly enhances consumers’ perception and trust in the “green attributes” and “fresh quality” of products, thereby converting dual preferences into actual purchase willingness and brand loyalty. Therefore, in markets with high carbon prices and strong consumer awareness of environmental protection and freshness, enterprises should give priority to promoting the collaborative implementation of blockchain and transform the transparent supply chain into a core competitiveness.
- (2)
- Consumers respond positively to integrated information on “emission reduction—freshness preservation”, with significant marketing value. Managers should completely change the practice of spreading information on emission reduction and freshness preservation separately. The study confirms that consumers particularly recognize the synergistic relationship between the two (such as how low-carbon logistics promotes freshness preservation and how high-quality cold chains reduce carbon emissions). With the credible traceability platform provided by blockchain, enterprises can systematically display the whole-process efforts of products from low-carbon production to efficient freshness preservation, such as highlighting integrated information like “solar-powered cold chain transportation reduces carbon emissions and ensures freshness at the same time”. This marketing strategy can maximize the emotional resonance and persuasive effect of information, significantly improving consumers’ willingness to pay, especially in the high-end fresh food market.
- (3)
- Dynamically grasp the timing of adoption and use one party’s investment to reduce the other party’s risks. Although the synergy between emission reduction and freshness preservation is ideal, its realization depends on an appropriate blockchain adoption strategy. Enterprises need to realize that the early investment of either party (such as suppliers with strong carbon policy constraints taking the lead in emission reduction, or retailers driven by quality demands giving priority to freshness preservation) will create more favorable conditions for the subsequent participation of the other party by reducing information asymmetry (such as sharing data to reduce verification costs). Therefore, enterprises should regularly evaluate external policies (carbon prices) and internal preferences (changes in consumers’ attention to low carbon and freshness) and dynamically adjust investment strategies. After suppliers have proven emission reduction effectiveness with the help of blockchain, retailers’ introduction of freshness preservation traceability will achieve twice the result with half the effort, and vice versa. Through this strategic step-by-step implementation, enterprises can more steadily move towards a virtuous cycle of “emission reduction—freshness preservation—information transparency”.
7.3. Research Prospects
Although this paper explores the blockchain adoption strategies in the FFSC under the background of CTP and consumers’ dual preferences, there are certain limitations in the research design and scenario coverage:
- (1)
- The research framework only focuses on a two-echelon supply chain structure composed of suppliers and retailers and fails to include more market entities, such as third-party logistics enterprises, upstream producers, and terminal service providers into the analysis scope. As a result, it is difficult to fully reflect the complex ecology of multi-agent collaborative operations in the actual FFSC, and it is also unable to accurately capture the interactive game relationships among different subjects in the process of blockchain technology adoption.
- (2)
- Regarding the cost consideration in the application of blockchain technology, it is only set from a static perspective, and factors such as technological iteration and upgrading, dynamic cost changes brought about by economies of scale, and differences in technological input capabilities among different enterprises are not included. This reduces the applicability of the research conclusions in cost-sensitive scenarios.
- (3)
- In the analysis of the policy environment, in-depth exploration of the impact of variables, such as regional differences in the implementation intensity of CTP and the adjustment frequency of policy details on the decision-making of supply chain subjects, is lacking. Thus, it is difficult to fully reveal the logic of blockchain adoption strategy selection under policy uncertainty.
- (4)
- In the risk assessment of blockchain investment decisions, there is no systematic differentiation between the risk exposure differences of buyers (retailers) and sellers (suppliers), nor has a risk–return trade-off model similar to the “acceptance sampling operation curve” been constructed.
- (5)
- The model fails to account for preference heterogeneity among consumer groups. For instance, some consumers prioritize low-carbon attributes, others focus more on freshness, and others demand both. As a result, it is difficult to reveal the differentiated value propositions and adoption benefits of blockchain technology for different market segments.
Based on the above limitations, future research can be expanded and deepened from multiple dimensions:
- (1)
- The research model can be extended to a three-echelon or higher multi-echelon supply chain system, and a collaborative decision-making framework involving multiple subjects, such as producers, suppliers, retailers, and third-party logistics, can be constructed. This will be more in line with the actual operation of the entire FFSC from the production source to the consumer terminal.
- (2)
- Emphasis should be placed on incorporating the analysis of dynamic fluctuations in blockchain technology costs, comprehensively considering the changing laws of technology procurement costs, maintenance costs, and upgrade costs over time and with application scale. At the same time, the heterogeneous characteristics of policies in different regions and of different types should be introduced, such as differences in carbon quota allocation methods and gradients of policy implementation intensity, to enhance the adaptability of the model to the real economic environment.
- (3)
- It is possible to combine the actual operation cases of typical fresh food enterprises, verify the practical applicability of the theoretical model through data verification and model correction, and promote the research conclusions from the theoretical level to practical application.
- (4)
- A buyer–seller risk-balancing framework for blockchain investment could be introduced and a supply chain-specific “blockchain operation curve” constructed.
- (5)
- In the future, consumer questionnaires and cluster analysis can be used to identify customer groups with different preference types. Furthermore, the differences in the marginal impact of blockchain technology on the purchasing decisions of various groups can be analyzed, thereby helping enterprises formulate blockchain adoption and marketing strategies with clearer target markets and higher input–output efficiency.
Through in-depth research in these expanded directions, it is expected to provide a more operable and practical decision-making basis and path references for the in-depth integration of low-carbon transformation and digital upgrading of the FFSC.
Author Contributions
Conceptualization, Z.L. and T.Y.; methodology, T.Y.; software, T.Y.; validation, Z.L., T.Y. and B.H.; formal analysis, T.Y.; investigation, T.Y.; resources, L.S.; data curation, T.Y.; writing—original draft preparation, T.Y.; writing—review and editing, T.Y.; visualization, T.Y.; supervision, Z.L.; project administration, T.Y.; funding acquisition, B.H. All authors have read and agreed to the published version of the manuscript.
Funding
This research was funded by the Key Laboratory of Information Network Security, Ministry of Public Security: C23600-05.
Data Availability Statement
The original contributions presented in this study are included in the article. Further inquiries can be directed to the corresponding author.
Conflicts of Interest
The authors declare no conflicts of interest.
Abbreviations
The following abbreviations are used in this manuscript:
| FFSC | Fresh food supply chain |
| CAT | Carbon cap-and-trade policy |
| CTP | Carbon trading price |
Appendix A
Proof of Corollary 1.
A
where .
Let , solve to obtain , where . Therefore, if , , otherwise ;
Let , solve to obtain , where . Therefore, if , , otherwise ;
Let , solve to obtain , where . Therefore, if , , otherwise . □
Proof of Corollary 1.
B
where .
It is not difficult to observe that , , and have similar trends.
Let , solve to obtain , where . Therefore, if , , , , otherwise , , ; □
Proof of Corollary 1.
C
where .
Let , solve to obtain , where . Therefore, if , , otherwise . □
Proof of Corollary 2.
A
where , .
Let , solve to obtain , where . Therefore, if , , otherwise ;
Let , solve to obtain , where . Therefore, if , , otherwise ;
Let , solve to obtain , where . Therefore, if , , otherwise, , where . □
Proof of Corollary 2.
B
, where , . □
Proof of Corollary 3.
The proof of Corollary 3 is similar to Corollaries 1 and 2. □
Proof of Corollary 4.
The proof of Corollary 4 is similar to Corollaries 1 and 2. □
Proof of Proposition 1.
A
therefore, . □
Proof of Proposition 1.
B
It is not difficult to see from Figure 2b that and intersect at point (), and and intersect at point ().
Therefore, let , solving yields ;
Let , solving , .
Therefore, when b < b1, ; when b1 < b < b2, ; when b > b2, . □
Proof of Proposition 2.
The proof of Proposition 2 is similar to Proposition 1. □
Proof of Proposition 3.
The proof of Proposition 3 is similar to Proposition 1. □
Appendix B. Robustness Testing of Numerical Simulation Examples
In order to verify the robustness of the numerical simulation in Section 6 of the main text, we set different parameter values and plotted the changes in preservation efforts, emission reduction efforts, supplier profits, retailer profits, and total supply chain profits, as shown in Figure A1, Figure A2, Figure A3, Figure A4 and Figure A5.
Further, take m = 0.6, b = 0.3, and m = 0.3, b = 0.8, respectively, and redraw Figure 6a, as shown in Figure A1.

Figure A1.
The influence of θ and δ on the level of preservation efforts (τ) of retailers.
Figure A1.
The influence of θ and δ on the level of preservation efforts (τ) of retailers.

Take k = 0.3, b = 0.8, and k = 0.6, b = 0.3, respectively, and redraw Figure 6b, as shown in Figure A2.

Figure A2.
The influence of θ and δ on supplier emission reduction efforts (r).
Figure A2.
The influence of θ and δ on supplier emission reduction efforts (r).

Take k = 0.3, b = 0.1, and k = 0.6, b = 0.3, respectively, and redraw Figure 7a, as shown in Figure A3.

Figure A3.
The influence of θ and δ on supplier profits.
Figure A3.
The influence of θ and δ on supplier profits.

Take m = 0.6, b = 0.3, and m = 0.3, b = 0.8, respectively, and redraw Figure 7b, as shown in Figure A4.

Figure A4.
The influence of θ and δ on retailer profits.
Figure A4.
The influence of θ and δ on retailer profits.

Take k = 0.3, m = 0.6, b = 0.3 and k = 0.6, m = 0.3, b = 0.8, respectively, and redraw Figure 7c, as shown in Figure A5.

Figure A5.
The influence of θ and δ on the total profit of the FFSC.
Figure A5.
The influence of θ and δ on the total profit of the FFSC.

References
- Habib, M.; Singh, S.; Bist, Y.; Kumar, Y.; Jan, K.; Bashir, K.; Jan, S.; Saxena, D. Carbon pricing and the food system: Implications for sustainability and equity. Trends Food Sci. Technol. 2024, 150, 104577. [Google Scholar] [CrossRef]
- Chen, J.; Liao, W.; Yu, C. Route optimization for cold chain logistics of front warehouses based on traffic congestion and carbon emission. Comput. Ind. Eng. 2021, 161, 107663. [Google Scholar] [CrossRef]
- Bian, Z.; Liu, J.; Zhang, Y.; Peng, B.; Jiao, J. A green path towards sustainable development: The impact of carbon emissions trading system on urban green transformation development. J. Clean. Prod. 2024, 442, 140943. [Google Scholar] [CrossRef]
- Komijani, M.; Sajadieh, M.S. An integrated planning approach for perishable goods with stochastic lifespan: Production, inventory, and routing. Clean. Logist. Supply Chain 2024, 12, 100163. [Google Scholar] [CrossRef]
- Centobelli, P.; Cerchione, R.; Del Vecchio, P.; Oropallo, E.; Secundo, G. Blockchain technology for bridging trust, traceability and transparency in circular supply chain. Inf. Manag. 2022, 59, 103508. [Google Scholar] [CrossRef]
- Verna, E.; Genta, G.; Galetto, M. Enhanced Food Quality by Digital Traceability in Food Processing Industry. Food Eng. Rev. 2025, 17, 359–383. [Google Scholar] [CrossRef]
- Yang, Y.; Yao, G. Fresh-Keeping Decision and Coordination of Fresh Agricultural Product Supply Chain Considering Carbon Cap-and-Trade under Different Dominance. J. Syst. Sci. Syst. Eng. 2024, 33, 30–51. [Google Scholar] [CrossRef]
- Wang, M.; Zhao, L.; Herty, M. Joint replenishment and carbon trading in FFSCs. Eur. J. Oper. Res. 2019, 277, 561–573. [Google Scholar] [CrossRef]
- Liu, Z.; Huang, N.; Han, C.; Yang, M.; Zhao, Y.; Sun, W.; Arya, V.; Gupta, B.B.; Shi, L. An optimal decision for fresh products’ cold chain considering freshness and carbon emission reduction. Br. Food J. 2024, 126, 2477–2499. [Google Scholar] [CrossRef]
- Bai, Q.; Chen, M.; Xu, L. Revenue and promotional cost-sharing contract versus two-part tariff contract in coordinating sustainable supply chain systems with deteriorating items. Int. J. Prod. Econ. 2017, 187, 85–101. [Google Scholar] [CrossRef]
- Ma, X.; Wang, J.; Bai, Q.; Wang, S. Optimization of a three-echelon cold chain considering freshness-keeping efforts under cap-and-trade regulation in Industry 4.0. Int. J. Prod. Econ. 2020, 220, 107457. [Google Scholar] [CrossRef]
- Zhang, Y.; Fu, S.; Ma, F.; Miao, B. The complexity analysis of decision-making for horizontal fresh supply chains under a trade-off between fresh-keeping and carbon emission reduction. Chaos Solitons Fractals 2024, 183, 114893. [Google Scholar] [CrossRef]
- Dhanda, A.; Aggarwal, D.; Jain, L.; Tyagi, P.; Mittal, M.; Bansal, A. Optimizing Fresh Food Supply Chains: Leveraging 3PL for Carbon Reduction and Profit Maximization—A Game-Theoretic Analysis. In Proceedings of the 2024 IEEE International Conference on Electronics, Computing and Communication Technologies (CONECCT), Bangalore, India, 12–14 July 2024; pp. 1–6. [Google Scholar]
- Richartz, C.; Stark, S.; Kuhlen, M. Sustainability and crisis: Shifting consumer preferences for food products under the influence of the COVID-19 pandemic in Germany. J. Clean. Prod. 2025, 496, 145089. [Google Scholar] [CrossRef]
- Xu, J.; Xiong, S.; Cui, T.; Zhang, D.; Li, Z. Incorporating Consumers’ Low-Carbon and Freshness Preferences in Dual-Channel Agri-Foods Supply Chains: An Analysis of Decision-Making Behavior. Agriculture 2023, 13, 1647. [Google Scholar] [CrossRef]
- Joshi, A.; Pani, A.; Sahu, P.K.; Majumdar, B.B.; Tavasszy, L. Gender and generational differences in omnichannel shopping travel decisions: What drives consumer choices to pick up in-store or ship direct? Res. Transp. Econ. 2024, 103, 101403. [Google Scholar] [CrossRef]
- Du, S.; Zhu, J.; Jiao, H.; Ye, W. Game-theoretical analysis for supply chain with consumer preference to low carbon. Int. J. Prod. Res. 2014, 53, 3753–3768. [Google Scholar] [CrossRef]
- Meng, Q.; Li, M.; Liu, W.; Li, Z.; Zhang, J. Pricing policies of dual-channel green supply chain: Considering government subsidies and consumers’ dual preferences. Sustain. Prod. Consum. 2021, 26, 1021–1030. [Google Scholar] [CrossRef]
- Liu, M.-L.; Li, Z.-H.; Anwar, S.; Zhang, Y. Supply chain carbon emission reductions and coordination when consumers have a strong preference for low-carbon products. Environ. Sci. Pollut. Res. 2021, 28, 19969–19983. [Google Scholar] [CrossRef]
- Fan, R.; Lin, J.; Zhu, K. Study of game models and the complex dynamics of a low-carbon supply chain with an altruistic retailer under consumers’ low-carbon preference. Phys. A Stat. Mech. Its Appl. 2019, 528, 121460. [Google Scholar] [CrossRef]
- Cao, Y.; Tao, L.; Wu, K.; Wan, G. Coordinating joint greening efforts in an agri-food supply chain with environmentally sensitive demand. J. Clean. Prod. 2020, 277, 123883. [Google Scholar] [CrossRef]
- Bera, S.; Giri, B.C. Impact of consumer preferences on pricing and strategic decisions in a triopoly with heterogeneous smart sustainable supply chains. Expert Syst. Appl. 2024, 247, 123348. [Google Scholar] [CrossRef]
- Chen, X.; Shang, J.; Zada, M.; Zada, S.; Ji, X.; Han, H.; Ariza-Montes, A.; Ramírez-Sobrino, J. Health Is Wealth: Study on Consumer Preferences and the Willingness to Pay for Ecological Agricultural Product Traceability Technology: Evidence from Jiangxi Province China. Int. J. Environ. Res. Public Health 2021, 18, 11761. [Google Scholar] [CrossRef] [PubMed]
- Contini, C.; Boncinelli, F.; Piracci, G.; Scozzafava, G.; Casini, L. Can blockchain technology strengthen consumer preferences for credence attributes? Agric. Econ. 2023, 11, 27. [Google Scholar] [CrossRef]
- Zhang, Y.; Zhang, H.; Cheng, Y. The adoption strategy of blockchain technology for new and remanufactured products considering price and consumer preference. J. Ind. Prod. Eng. 2025, 42, 103–126. [Google Scholar] [CrossRef]
- Patel, D.; Sinha, A.; Bhansali, T.; Usha, G.; Velliangiri, S. Blockchain in Food Supply Chain. Procedia Comput. Sci. 2022, 215, 321–330. [Google Scholar] [CrossRef]
- Liu, Y.; Ma, D.; Hu, J.; Zhang, Z. Sales mode selection of FFSC based on blockchain technology under different channel competition. Comput. Ind. Eng. 2021, 162, 107730. [Google Scholar] [CrossRef]
- Li, Y.; Tan, C.; Ip, W.; Wu, C. Dynamic blockchain adoption for freshness-keeping in the fresh agricultural product supply chain. Expert Syst. Appl. 2023, 217, 119494. [Google Scholar] [CrossRef]
- Xu, Y.; Wang, J.; Cao, K. Interaction between joining platform blockchain technology and channel encroachment for fresh agricultural product firms. Int. Trans. Oper. Res. 2024, 31, 3565–3591. [Google Scholar] [CrossRef]
- de Carvalho, P.R.; Naoum-Sawaya, J.; Elhedhli, S. Blockchain-Enabled supply chains: An application in fresh-cut flowers. Appl. Math. Model. 2022, 110, 841–858. [Google Scholar] [CrossRef]
- Yi, Y.; Bremer, P.; Mather, D.; Mirosa, M. Factors affecting the diffusion of traceability practices in an imported fresh produce supply chain in China. Br. Food J. 2022, 124, 1350–1364. [Google Scholar] [CrossRef]
- Keskin, N.B.; Li, C.; Song, J.-S. The Blockchain Newsvendor: Value of Freshness Transparency and Smart Contracts. Manag. Sci. 2025, 71, 6666–6682. [Google Scholar] [CrossRef]
- Yuan, H.; Zhang, L.; Cao, B.-B.; Chen, W. Optimizing traceability scheme in a fresh product supply chain considering product competition in blockchain era. Expert Syst. Appl. 2024, 258, 125127. [Google Scholar] [CrossRef]
- Liu, Z.; Huang, Y.-Q.; Shang, W.-L.; Zhao, Y.-J.; Yang, Z.-L.; Zhao, Z. Precooling energy and carbon emission reduction technology investment model in a fresh food cold chain based on a differential game. Appl. Energy 2022, 326, 119945. [Google Scholar] [CrossRef]
- Du, H.; Lu, K. Visualization service investment strategies for a self-operated fresh agricultural product e-tailer. J. Retail. Consum. Serv. 2023, 75, 103455. [Google Scholar] [CrossRef]
- Li, Z.; Xu, X.; Bai, Q.; Chen, C.; Wang, H.; Xia, P. Implications of information sharing on blockchain adoption in reducing carbon emissions: A mean–variance analysis. Transp. Res. Part E Logist. Transp. Rev. 2023, 178, 103254. [Google Scholar] [CrossRef]
- Dou, G.; Wei, K.; Sun, T.; Ma, L. Blockchain technology adoption in a supply chain: Channel leaderships and environmental implications. Transp. Res. Part E Logist. Transp. Rev. 2024, 192, 103788. [Google Scholar] [CrossRef]
- Wang, Y.-Y.; Tao, F.; Wang, J. Information disclosure and blockchain technology adoption strategy for competing platforms. Inf. Manag. 2021, 59, 103506. [Google Scholar] [CrossRef]
- Bai, Q.; Gong, M.; Xu, X. Effects of carbon emission reduction on supply chain coordination with vendor-managed deteriorating product inventory. Int. J. Prod. Econ. 2019, 208, 83–99. [Google Scholar] [CrossRef]
- Iyke-Ofoedu, M.I.; Takon, S.M.; Ugwunta, D.O.; Ezeaku, H.C.; Nsofor, E.S.; Egbo, O.P. Impact of CO2 emissions embodied in the agricultural sector on carbon sequestration in South Africa: The role of environmental taxes and technological innovation. J. Clean. Prod. 2024, 444, 141210. [Google Scholar] [CrossRef]
- Muzumdar, A.; Modi, C.; Vyjayanthi, C. A permissioned blockchain enabled trustworthy and incentivized emission trading system. J. Clean. Prod. 2022, 349, 131274. [Google Scholar] [CrossRef]


Disclaimer/Publisher’s Note: The statements, opinions and data contained in all publications are solely those of the individual author(s) and contributor(s) and not of MDPI and/or the editor(s). MDPI and/or the editor(s) disclaim responsibility for any injury to people or property resulting from any ideas, methods, instructions or products referred to in the content. |
© 2025 by the authors. Licensee MDPI, Basel, Switzerland. This article is an open access article distributed under the terms and conditions of the Creative Commons Attribution (CC BY) license (https://creativecommons.org/licenses/by/4.0/).