The following sections present the results of the experiments outlined in the previous section. First, we compare the COVID-19 results to the model results for measles, then we show the differences in the COVID-19 model based on different values and infectious periods, and finally, we look at how two different interventions influence both outbreaks.
3.1. COVID-19 Model Results vs. Measles Model Results
In order to be sure that the model is taking into account the interactions of the different parameters that describe the disease, we compare the outbreaks produced from the model with COVID-19 dynamics to the model with measles dynamics. If we do not see key differences in the results, it would be concerning that the COVID-19 model was not accurately capturing the dynamics of COVID-19, but instead just reproducing the measles dynamics. Although the of COVID-19 is still only being estimated, for ease of comparison, we compare the results from the measles model to the results from the COVID-19 model with an of 3.28. To also make the models more comparable, we do not include any existing immunity in the measles model, so all agents are susceptible.
The results, showing some key outbreak characteristics for the measles model and the COVID-19 model, can be found in
Table 1.
From the table, we can see that the measles outbreak has a higher total number of infected. This is likely because measles has a higher
; therefore, the virus is more easily transmittable. The differences between the two outbreaks can be further seen in
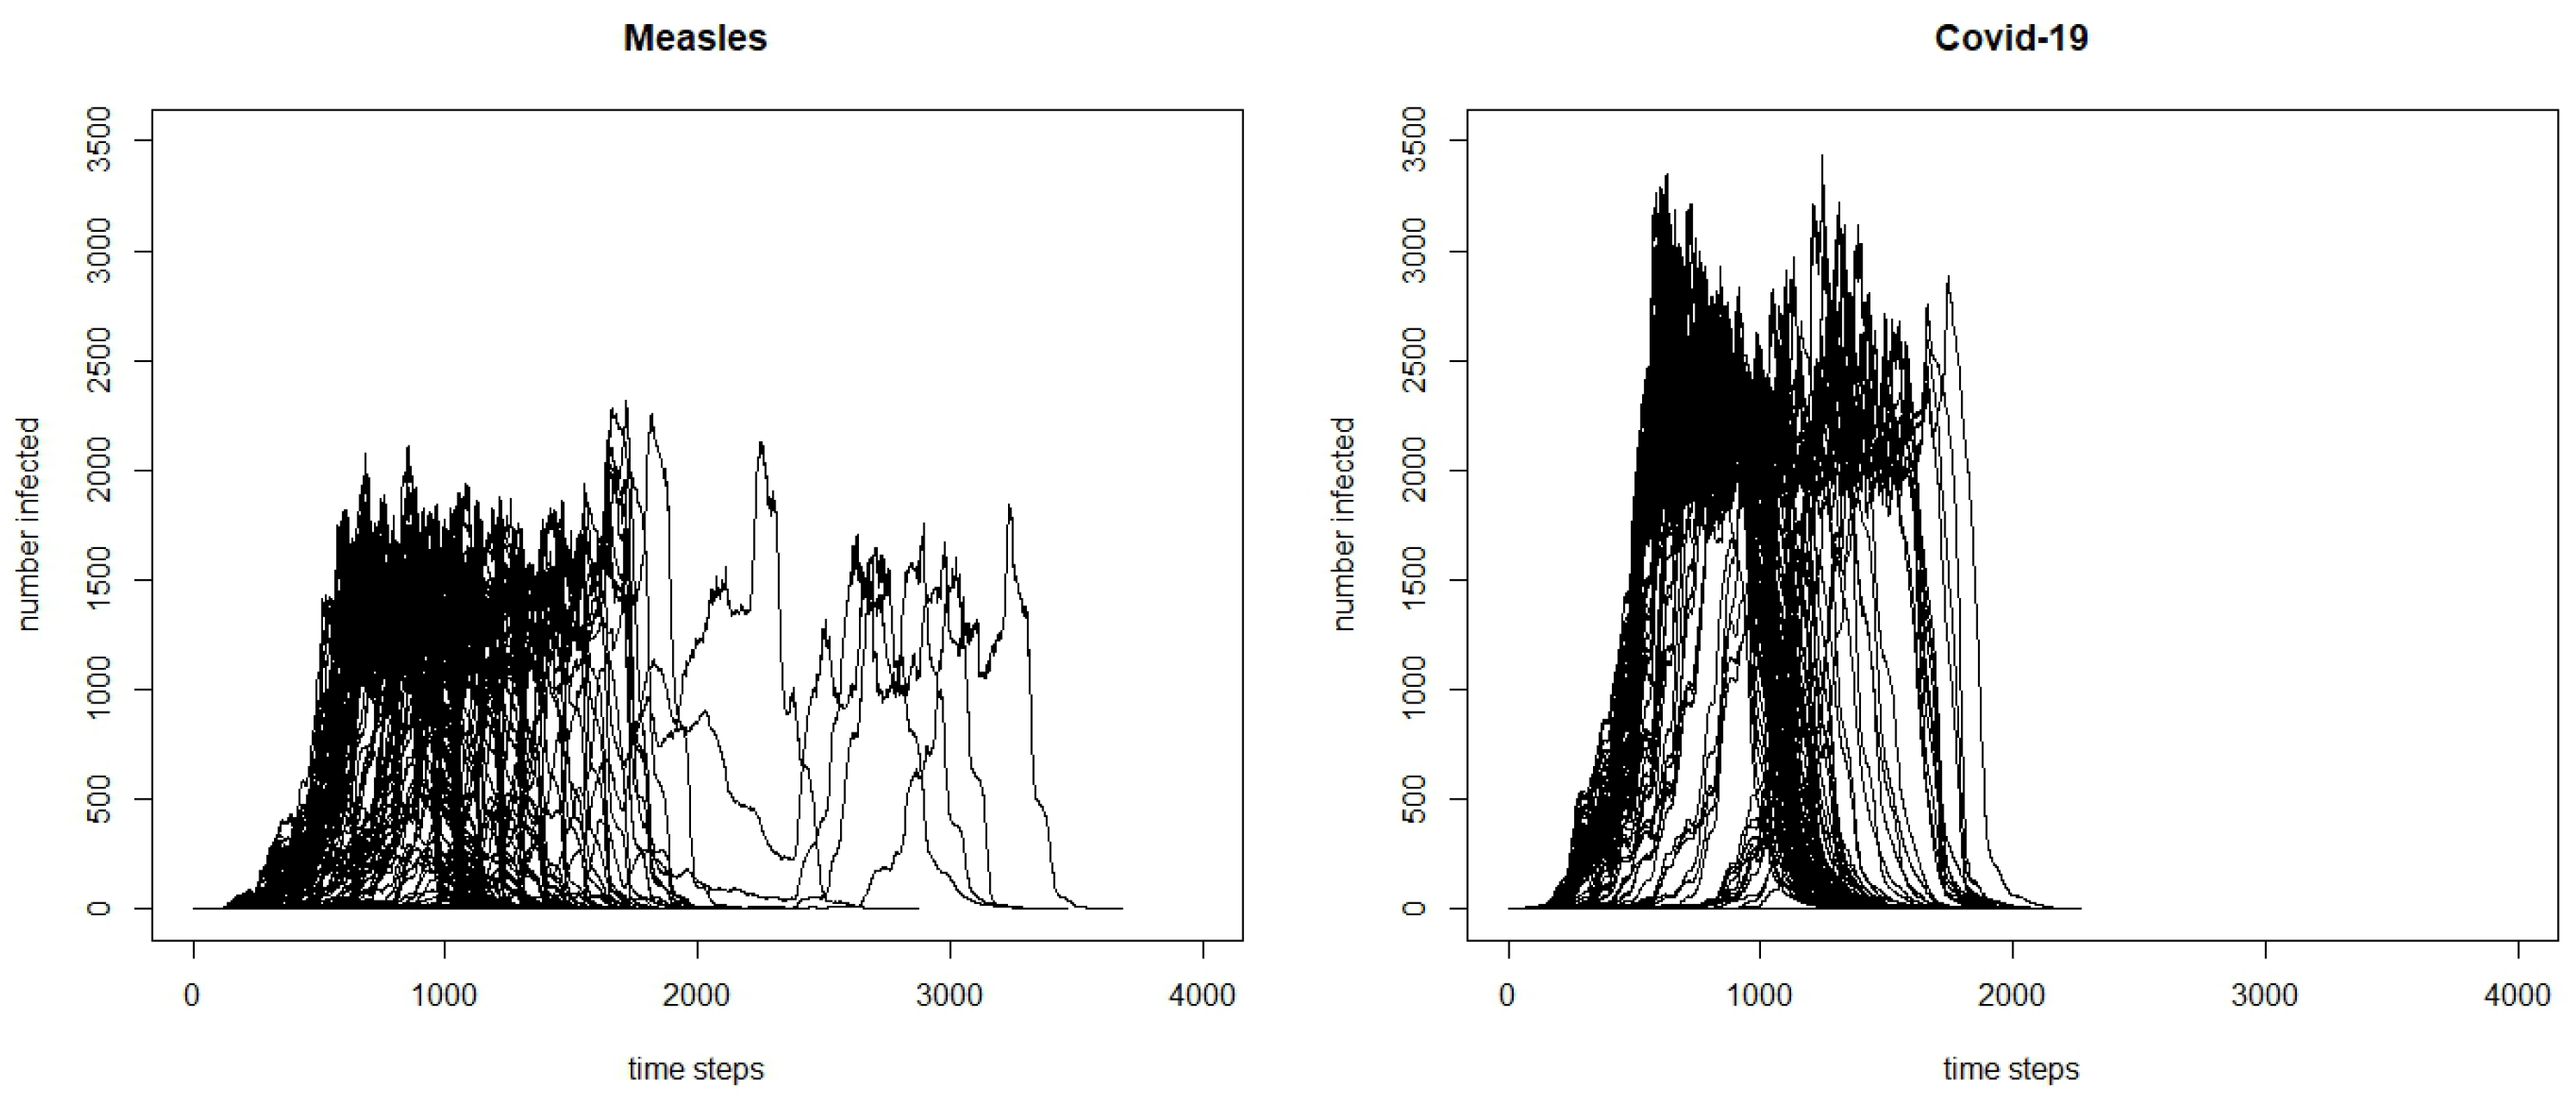
Figure 1. The COVID-19 outbreak seems to take off faster, and reaches a higher peak. Although at first, this higher peak and faster initial spread might seem counter-intuitive, because measles has a higher
than COVID-19, there are a number of factors that are causing this difference. One is the other characteristics of the virus, especially the incubation period. While COVID-19 has an average incubation period of approximately 5 days, measles has a much longer incubation period, with an average of approximately 10 days. This means that the serial interval, the time between the symptom onset of a primary case and the symptom onset for a secondary case, will be longer for measles, and it takes longer for an agent infected in the measles model to move between the exposed and infected state than in the COVID-19 model; thus, the number of agents in the infected state for COVID-19 will grow faster earlier on in the model. Additionally, because there is a high percentage of COVID-19 cases that are mild and in some cases, asymptomatic, we have built it into the model so that mild cases are not as likely to stay at home when sick compared to more severe cases. Because a number of agents with mild cases will be going about their day as normal, they will be infecting more cases compared to the agents with measles who have a higher likelihood of staying home. The differences between the two models show that it is important to tailor the disease dynamics and behaviors of the agents to a particular infectious disease.
3.2. Modelling COVID-19 Dynamics
After determining that changing the disease dynamics of the model from those for measles to those for COVID-19 leads to expected differences in model results, we next consider how altering the COVID-19 dynamics will further affect the model. Although there are estimates of the parameters needed for modelling the spread of COVID-19, they are only estimates based off of available data. We set the exposed period from the estimated values and the infectious period as the estimated symptomatic period but investigate the effects of different
values on the model output.
is an important parameter because it modulates how infectious a disease is, and also influences what level of herd immunity would be needed for an outbreak to not take hold. Herd immunity is the concept that if a population contains a certain proportion of immune individuals, this will result in population-level protection from the disease. The higher the
value, the higher the herd immunity that is needed [
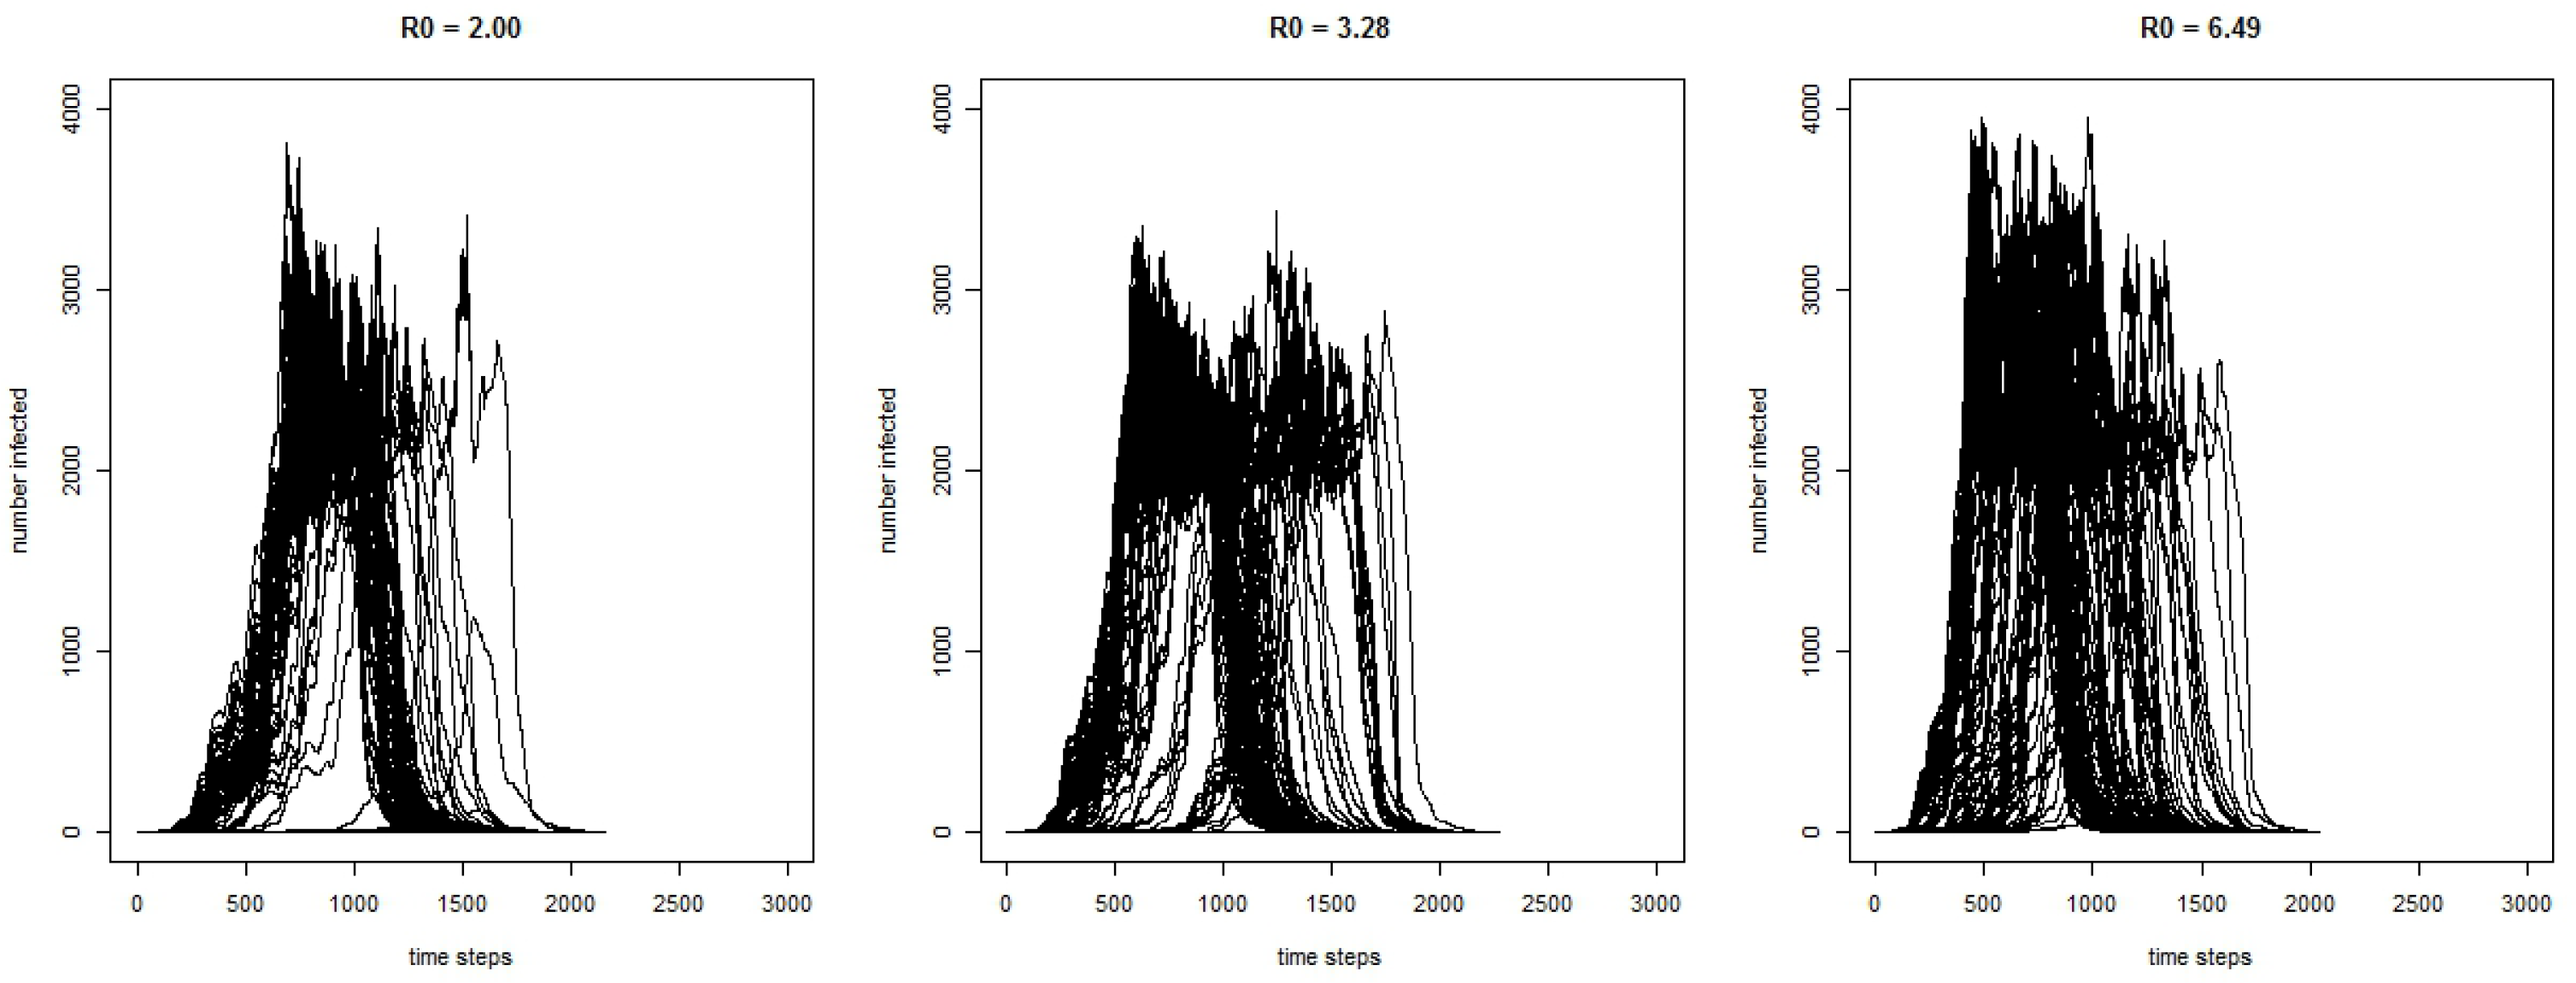
31]. This should result in a larger number of individuals becoming infected in an entirely susceptible population. In order to investigate the scale of potential COVID-19 outbreaks compatible with the possible range of values for the basic reproductive number, we used the COVID-19 model to simulate a number of different outbreak scenarios.
Figure 2 shows the curves for the 300 runs for the COVID-19 model for the number of infected agents for each time-step with three different values of
. As expected, the results show that with a higher
, the outbreak has a greater magnitude.
Some key characteristics of the simulated outbreaks can be seen in
Table 2 for model runs where the disease spreads beyond the initially infected agent. Without interventions, the model shows that, on average, the total number of individuals infected by the end of the outbreak ranges between 25,671 and 28,058. The average length of the outbreak ranges from 105.22 days to 114.86 days. The average maximum number of agents infected at any one time ranges from 2240 to 2766, and this peak occurs, on average, between 43.88 days into the outbreak to 59.06 days.
The model behaved as we expected, with regard to the difference in the values. A higher results in a greater number of cases and faster growth in the outbreak, reaching the peak sooner.
To further adjust the model, we change the infectious period so that agents can be infectious before they are symptomatic. Not only does being infectious before developing symptoms give the agents a longer infectious period, which influences the number of agents they can spread the virus to, but it also influences their actions. When an agent has no symptoms, they will not consider staying home, thus spreading the virus to more agents.
Table 3 shows the results comparing the COVID-19 model with the average
of 3.28 with two different infectious period scenarios.
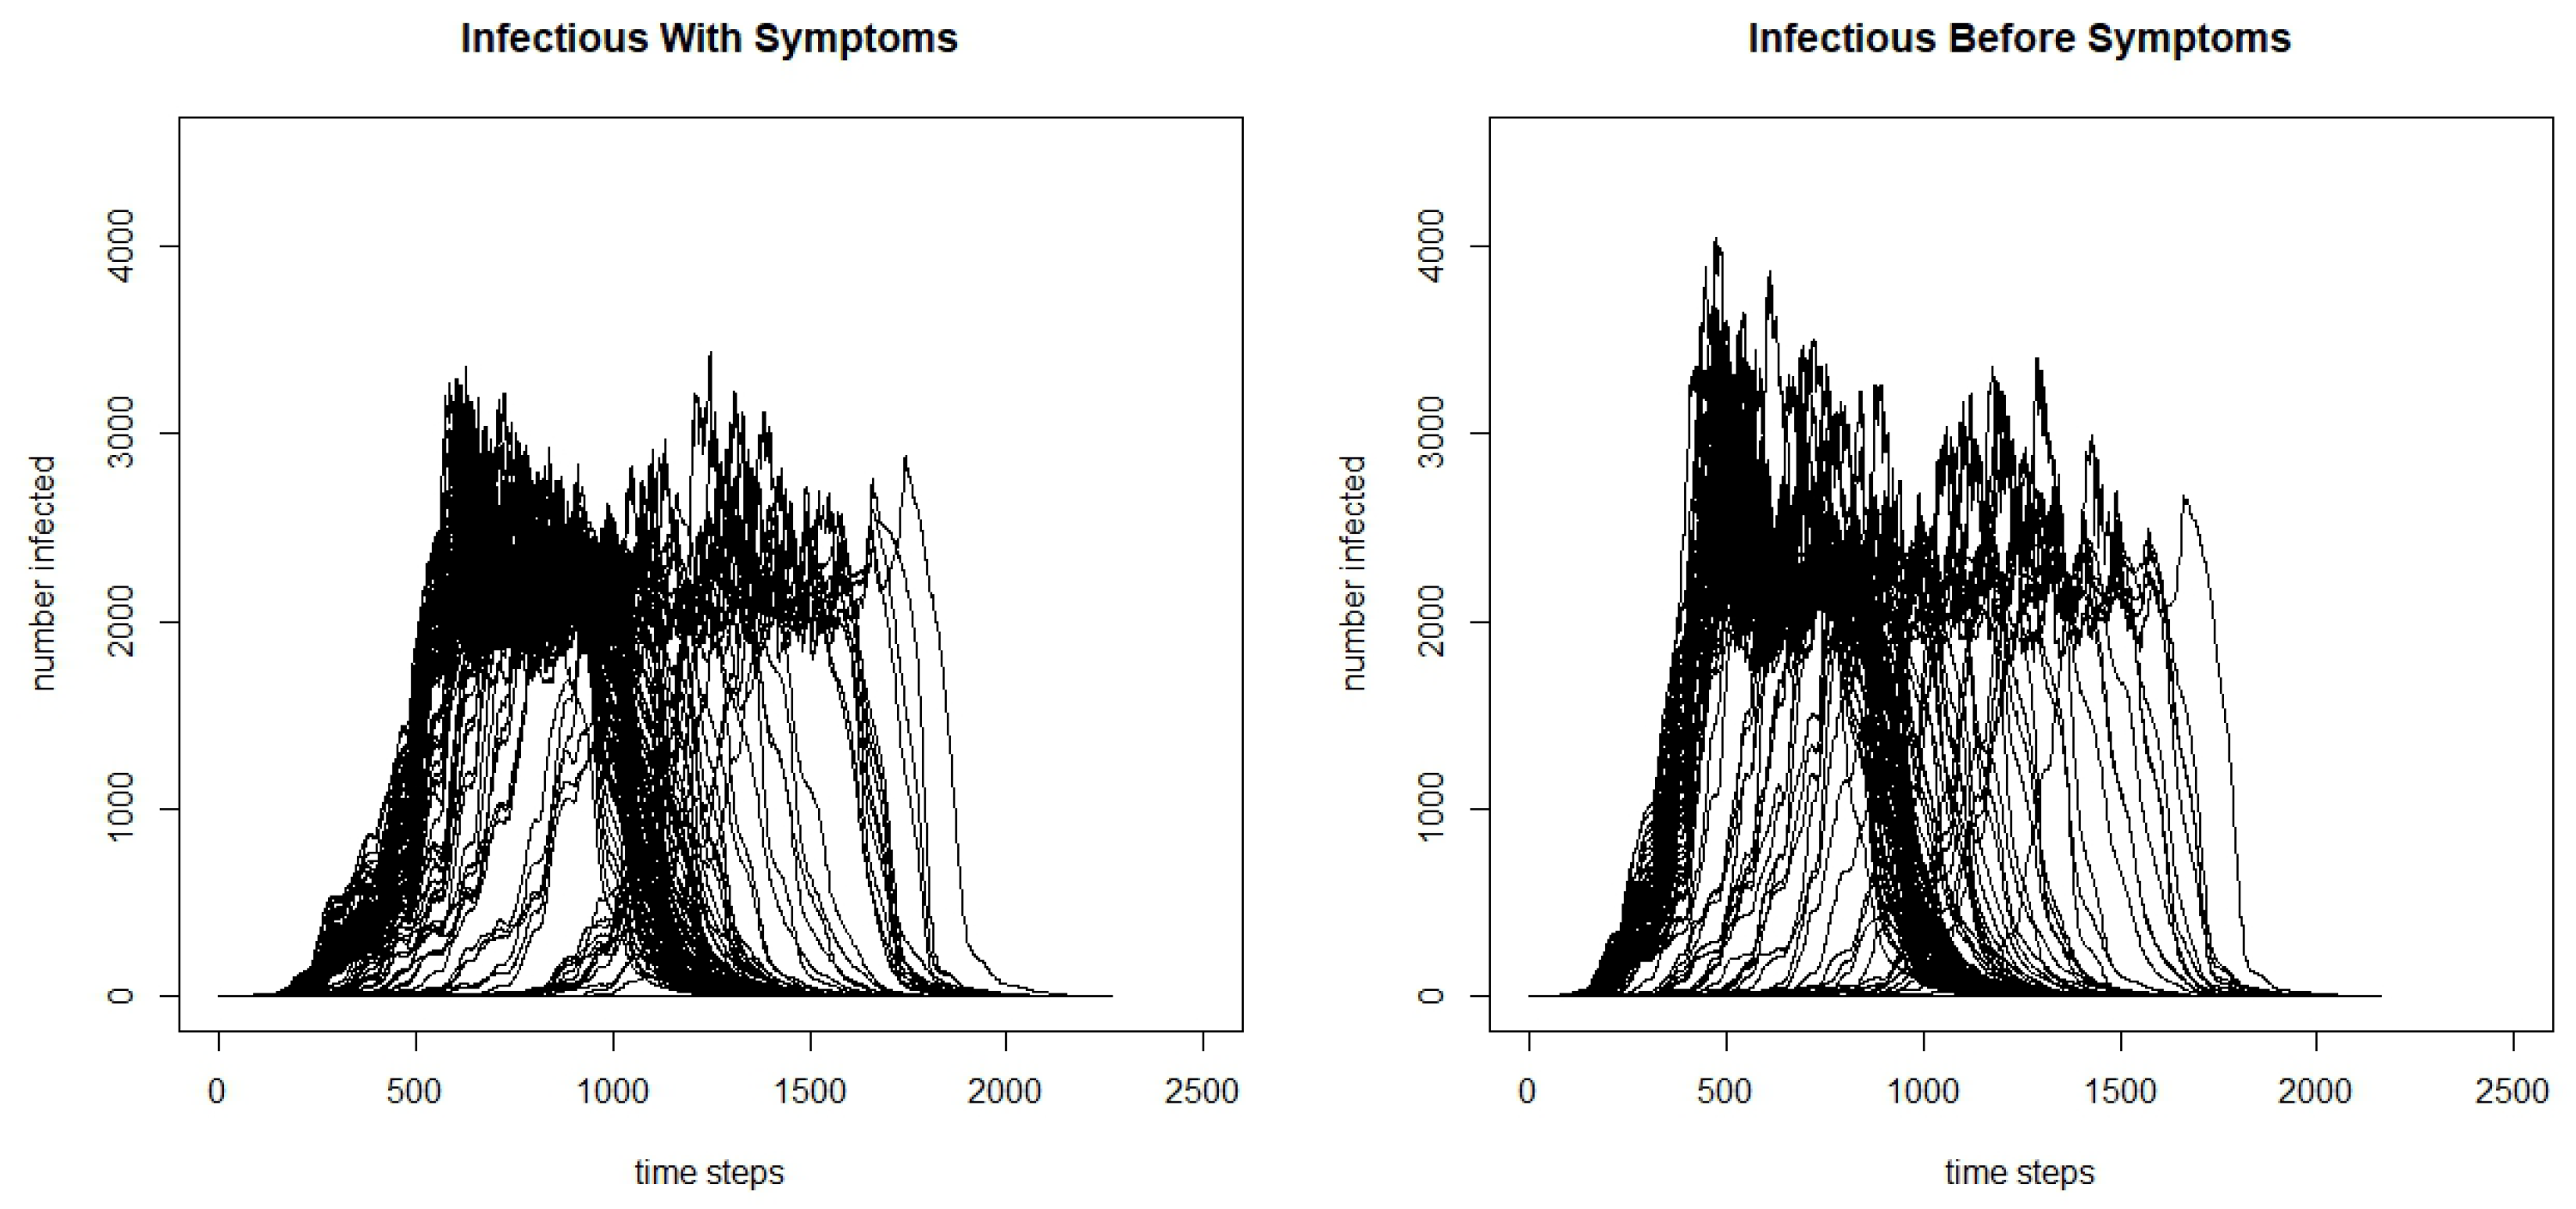
From the table, we can see that the total infected and the maximum number infected are significantly greater when the agents are infectious before symptoms begin, and we claim significance here as the confidence intervals do not overlap. Additionally, we see that the days to the maximum number of people infected is lower, and when agents are infectious before symptoms, it reaches the peak faster. We can see the differences by further comparing the infection curves for the model where agents are infectious before they develop symptoms and the model where they are only infectious after developing symptoms in
Figure 3. Although there is variation in the runs, we can see that there is a higher peak in the model where agents are infectious before symptoms begin, and faster initial growth.
3.3. Interventions and Their Influence on the Outbreaks
One advantage of agent-based models is their adaptability to simulate different outbreaks on the same population, as seen in the previous two sections. However, another advantage is the ability to simulate intervention strategies. The outbreaks in the previous sections for both measles and COVID-19 stopped after herd immunity was reached. However, in both cases, there were a large number of total infected by the end of the outbreak which, especially in the case of COVID-19, would lead to a relatively large number of deaths. An outbreak of the severity of measles or COVID-19 spreading through a population unimpeded is unrealistic. In any population, there is a level of immunity to measles due to individuals having the disease or having been vaccinated, and as we have seen with COVID-19, most countries have implemented a number of measures to control the pandemic, such as school closures and movement restrictions that are aimed at isolating the individuals who are infectious so that they cannot spread the disease to others.
In this section, we simulate two intervention strategies on the measles model, and two intervention strategies on the COVID-19 model. One strategy is including vaccination and existing immunity. For the vaccination policy, for comparability, we base the level of immunity in the population on Irish measles vaccination rates. An agent’s immunity is thus determined by their age: older agents are assumed to have had measles and be immune, and for younger agents we take the percentage of agents that were vaccinated for measles for each age group and give that percentage of agents immunity. For the vaccination policy scenario, we apply the same measles vaccination rates by demographics to the COVID-19 model. This, in effect, turns COVID-19 into a childhood disease, as measles is, because the older population has pre-existing immunity while the younger population is not fully immune due to lower-than-desired vaccination rates. While this is unrealistic for the current situation with COVID-19, running the vaccination intervention experiment in this way enables us to directly compare the effectiveness of the vaccination intervention for diseases with different s and symptomatic/infectious dynamics. Furthermore, it also enables us to consider COVID-19 dynamics after a vaccination has been developed and deployed in the population for a number of years.
The second intervention strategy considered is a school closure policy where schools in the county will close when 100 agents are infected and will reopen when there is only one agent infected in the county. In this school closure scenario, there is no pre-existing immunity in the population for either the measles or COVID-19 model. This intervention strategy is more analogous to the strategies used to control COVID-19 so far with movement restrictions and control of the outbreak through isolation.
The results for the measles scenario with no interventions, with vaccination, and with school closures for runs when outbreaks occur can be found in
Table 4.
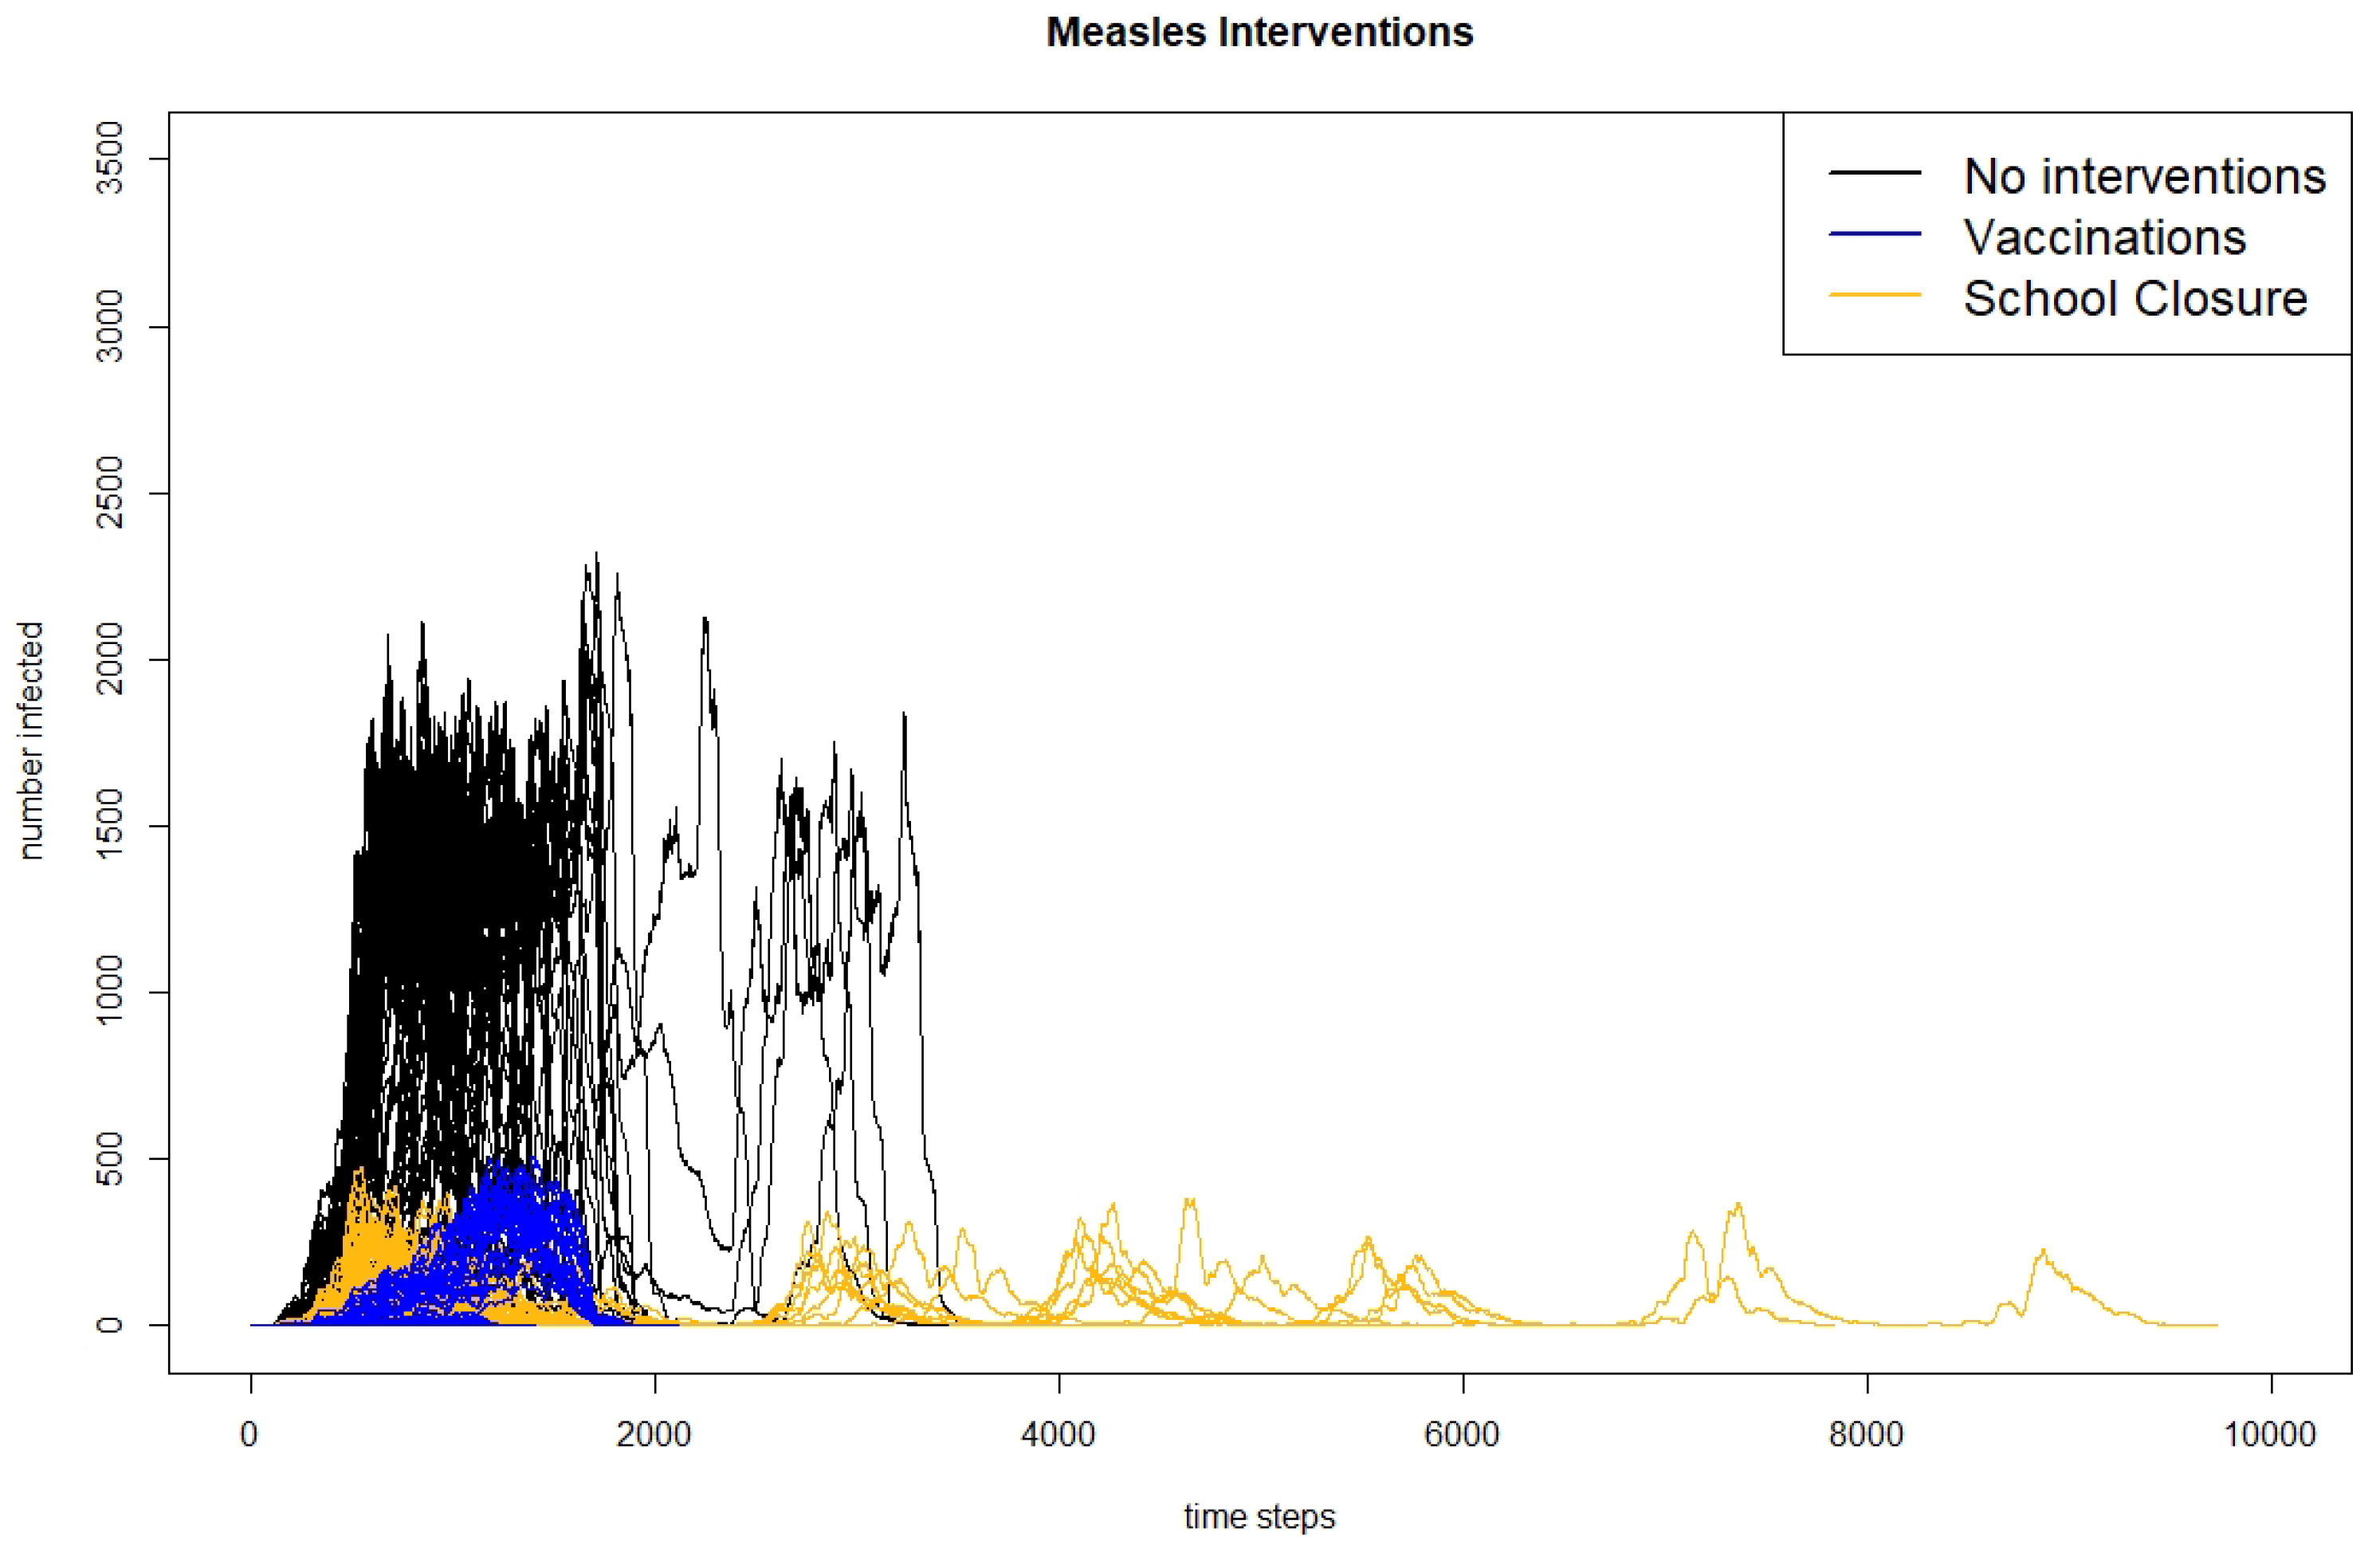
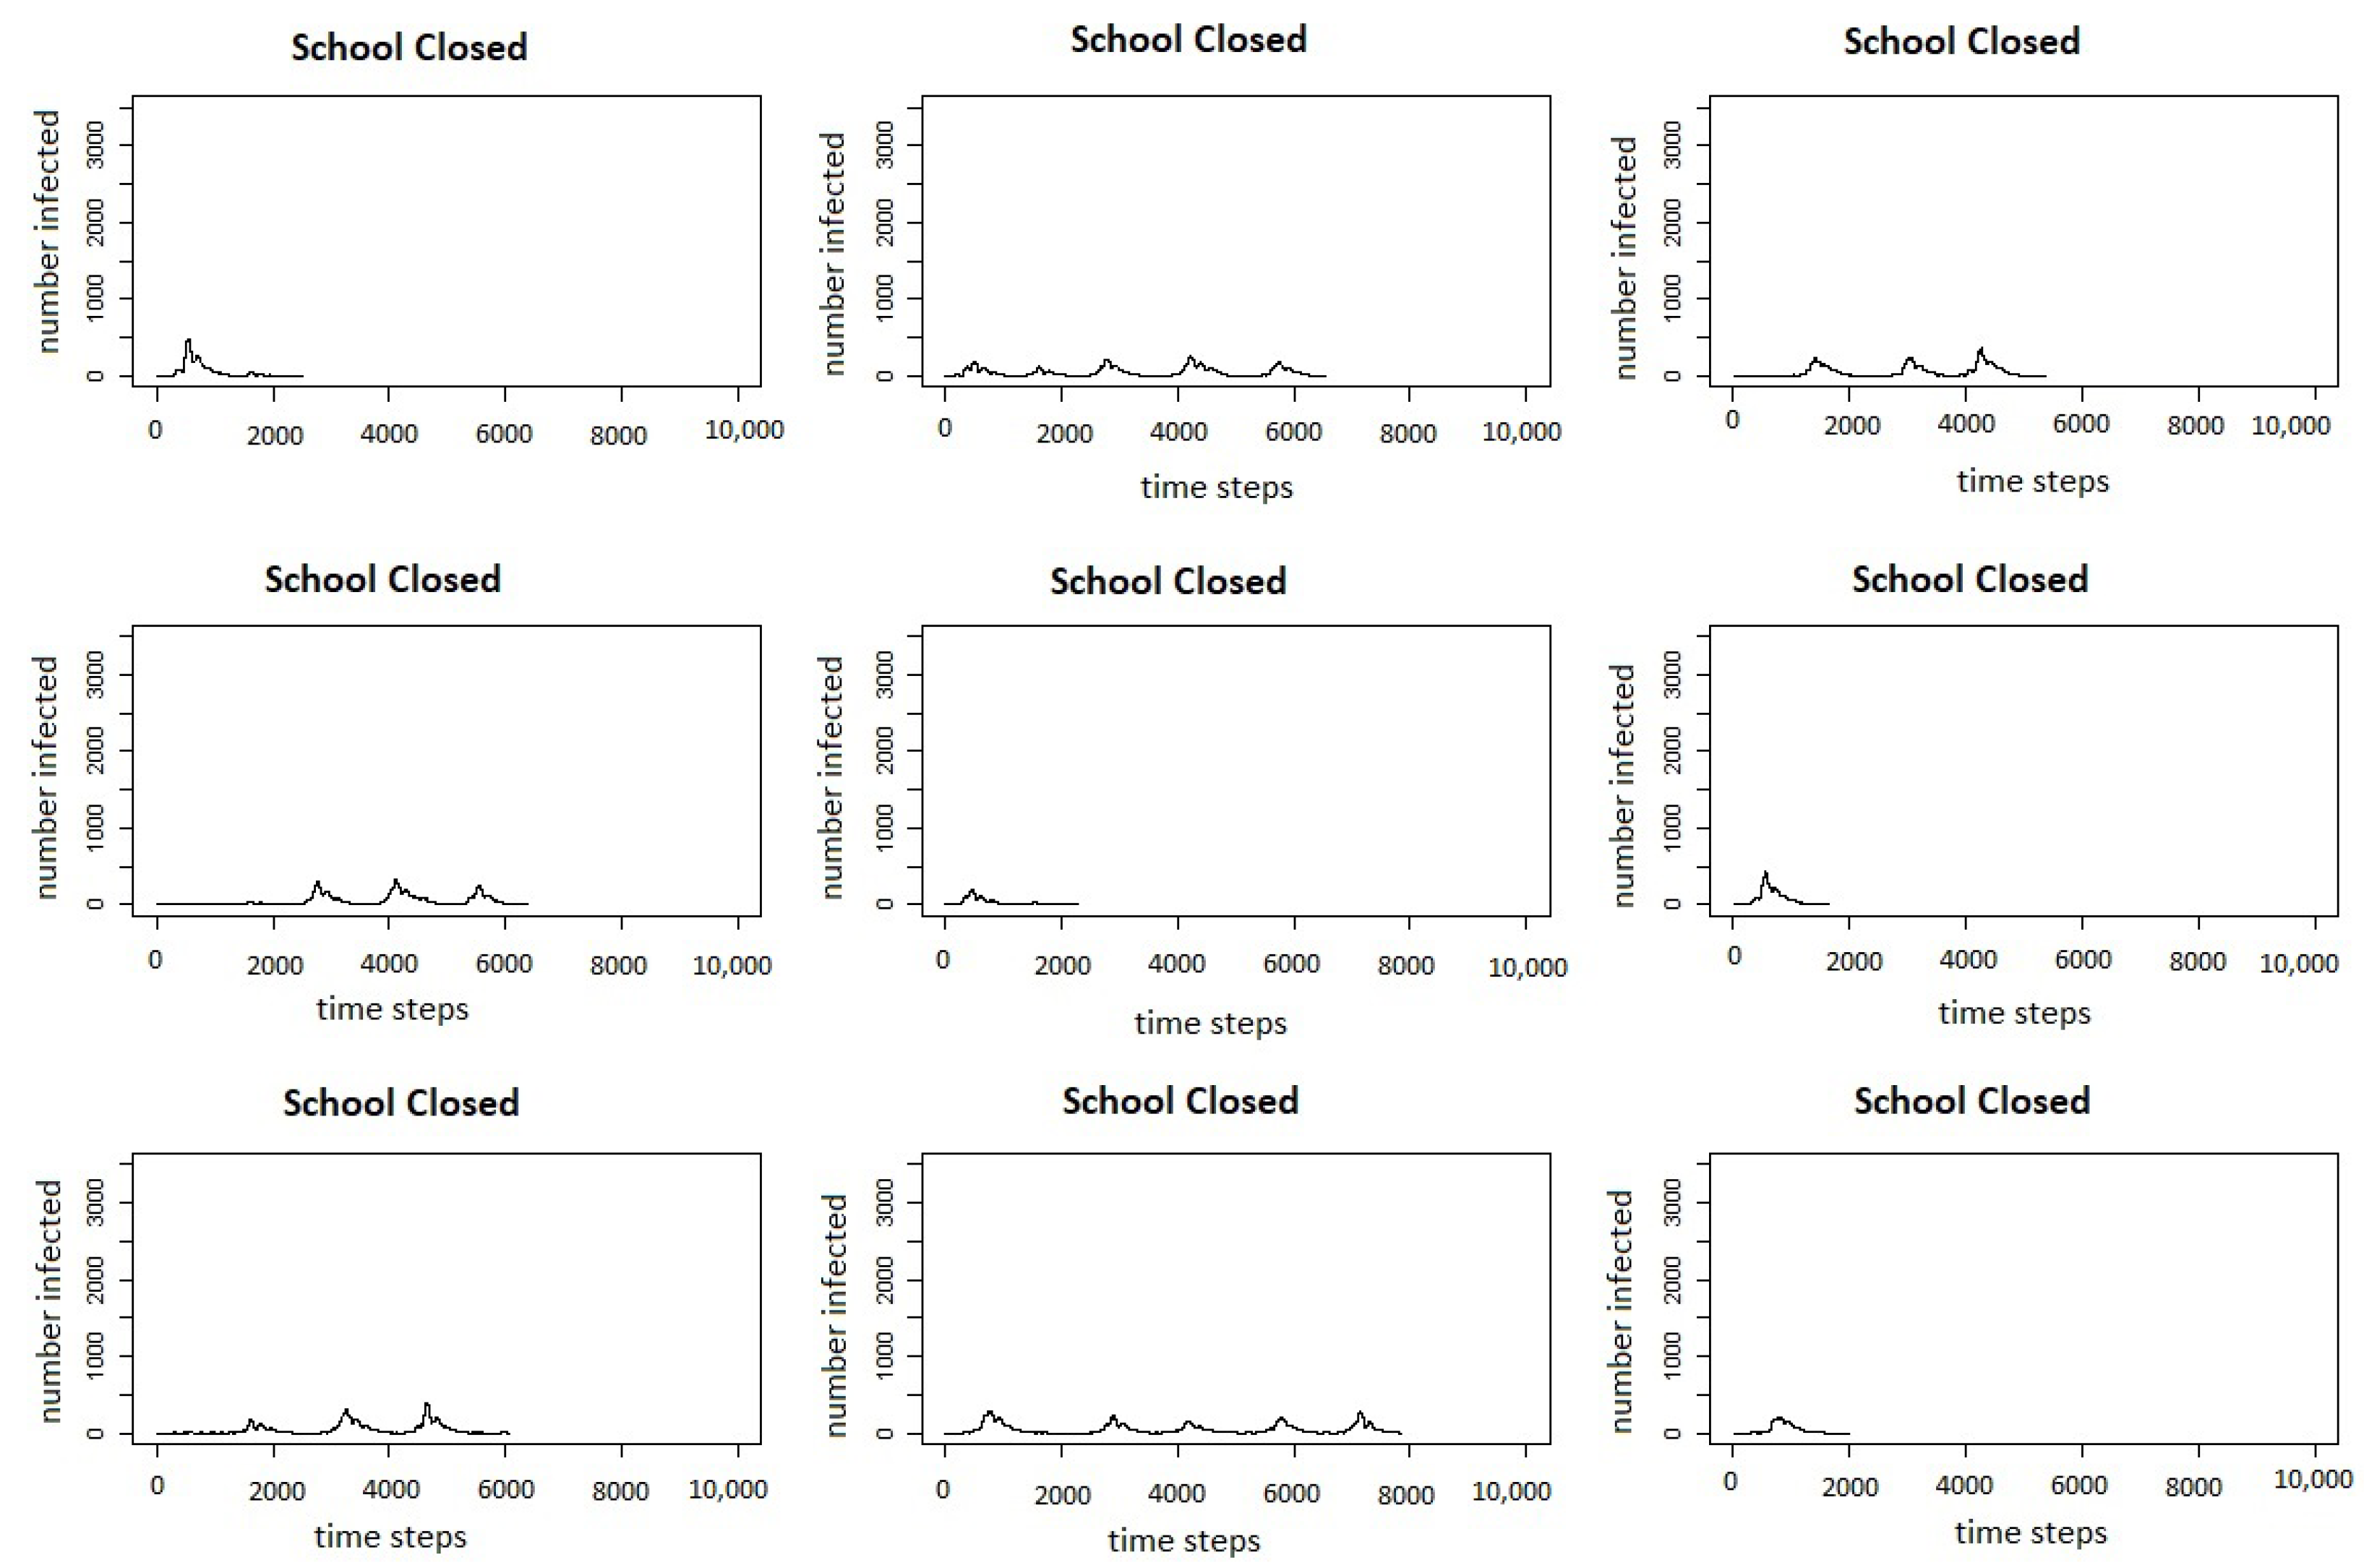
The table shows results for when the outbreak takes off and more than one agent is infected. We can see that with Irish vaccination rates, the outbreaks are significantly reduced in size, dropping from an average of 29,275 agents infected in the scenario with no interventions to 602 in the scenario with vaccination. The scenario with school closures also reduces the number of agents infected, but only to 868. Similarly, the maximum number of agents infected drops when either intervention is introduced, but more so with vaccinations than with school closures. Although the number of days to reach the peak does not change much between scenarios, the total number of days of the outbreak is increased for the scenario with school closures. This is likely because the school closures result in multiple waves of the outbreak when the schools reopen again. The multiple peaks of the outbreak can be seen in
Figure 4, which shows the infection curves for all 300 runs of each scenario presented in
Table 4 and in
Figure 5, which shows the infection curves for nine individual runs of the measles school closure scenario.
Results for the COVID-19 scenarios with no interventions, with vaccinations, and with school closures using an
of 3.28 across all three scenarios can be seen in
Table 5.
From the table, it can be seen that compared to the scenario with no interventions, both using measles-level vaccinations and immunity and closing schools in the county of Leitrim, Ireland results in a large decrease in the average total infected agents, as well as the maximum number of agents, with school closures resulting in a greater decrease in cases than vaccination. This is a surprising result, as we would expect that reducing the number of susceptible agents through vaccination would have a greater impact on reducing the size of the outbreak; however, this is likely due to the interaction of different characteristics of COVID-19 and the intervention strategies. Because agents are infectious before showing symptoms and do not adjust their actions in the exposed state, these infectious but presymptomatic agents will continue to go to school, bringing the disease to school where they have a high number of contacts with other students who will become infected and bring the disease home to spread to their family and others in their social networks. Similarly, those infected but only with mild symptoms will continue to go to school again, bringing the disease to their classmates who will take it home. Although COVID-19 is often thought of as a disease that affects the older populations, there is growing evidence that children are also infected at a higher rate than previously thought. Closing schools stops infected students from bringing the disease into the school population, where it will have many opportunities to spread.
We also see that while the time to the maximum number of agents infected or the time to the peak does not change much between the scenario without interventions to the scenario with school closures, the time to the max infected increases by almost 20 days going from the scenario without interventions to the scenario with vaccinations. Additionally, the average total length of the outbreak increases from about 115 days without interventions to about 135 days with vaccinations, and about 141 days with the school closures. Thus, while both interventions lead to a decrease in the total number of cases, they increase the length of the outbreak by almost a month. The reason for this increase in the length of the outbreak can likely be seen when looking at the curves showing the total number of infected agents over time.
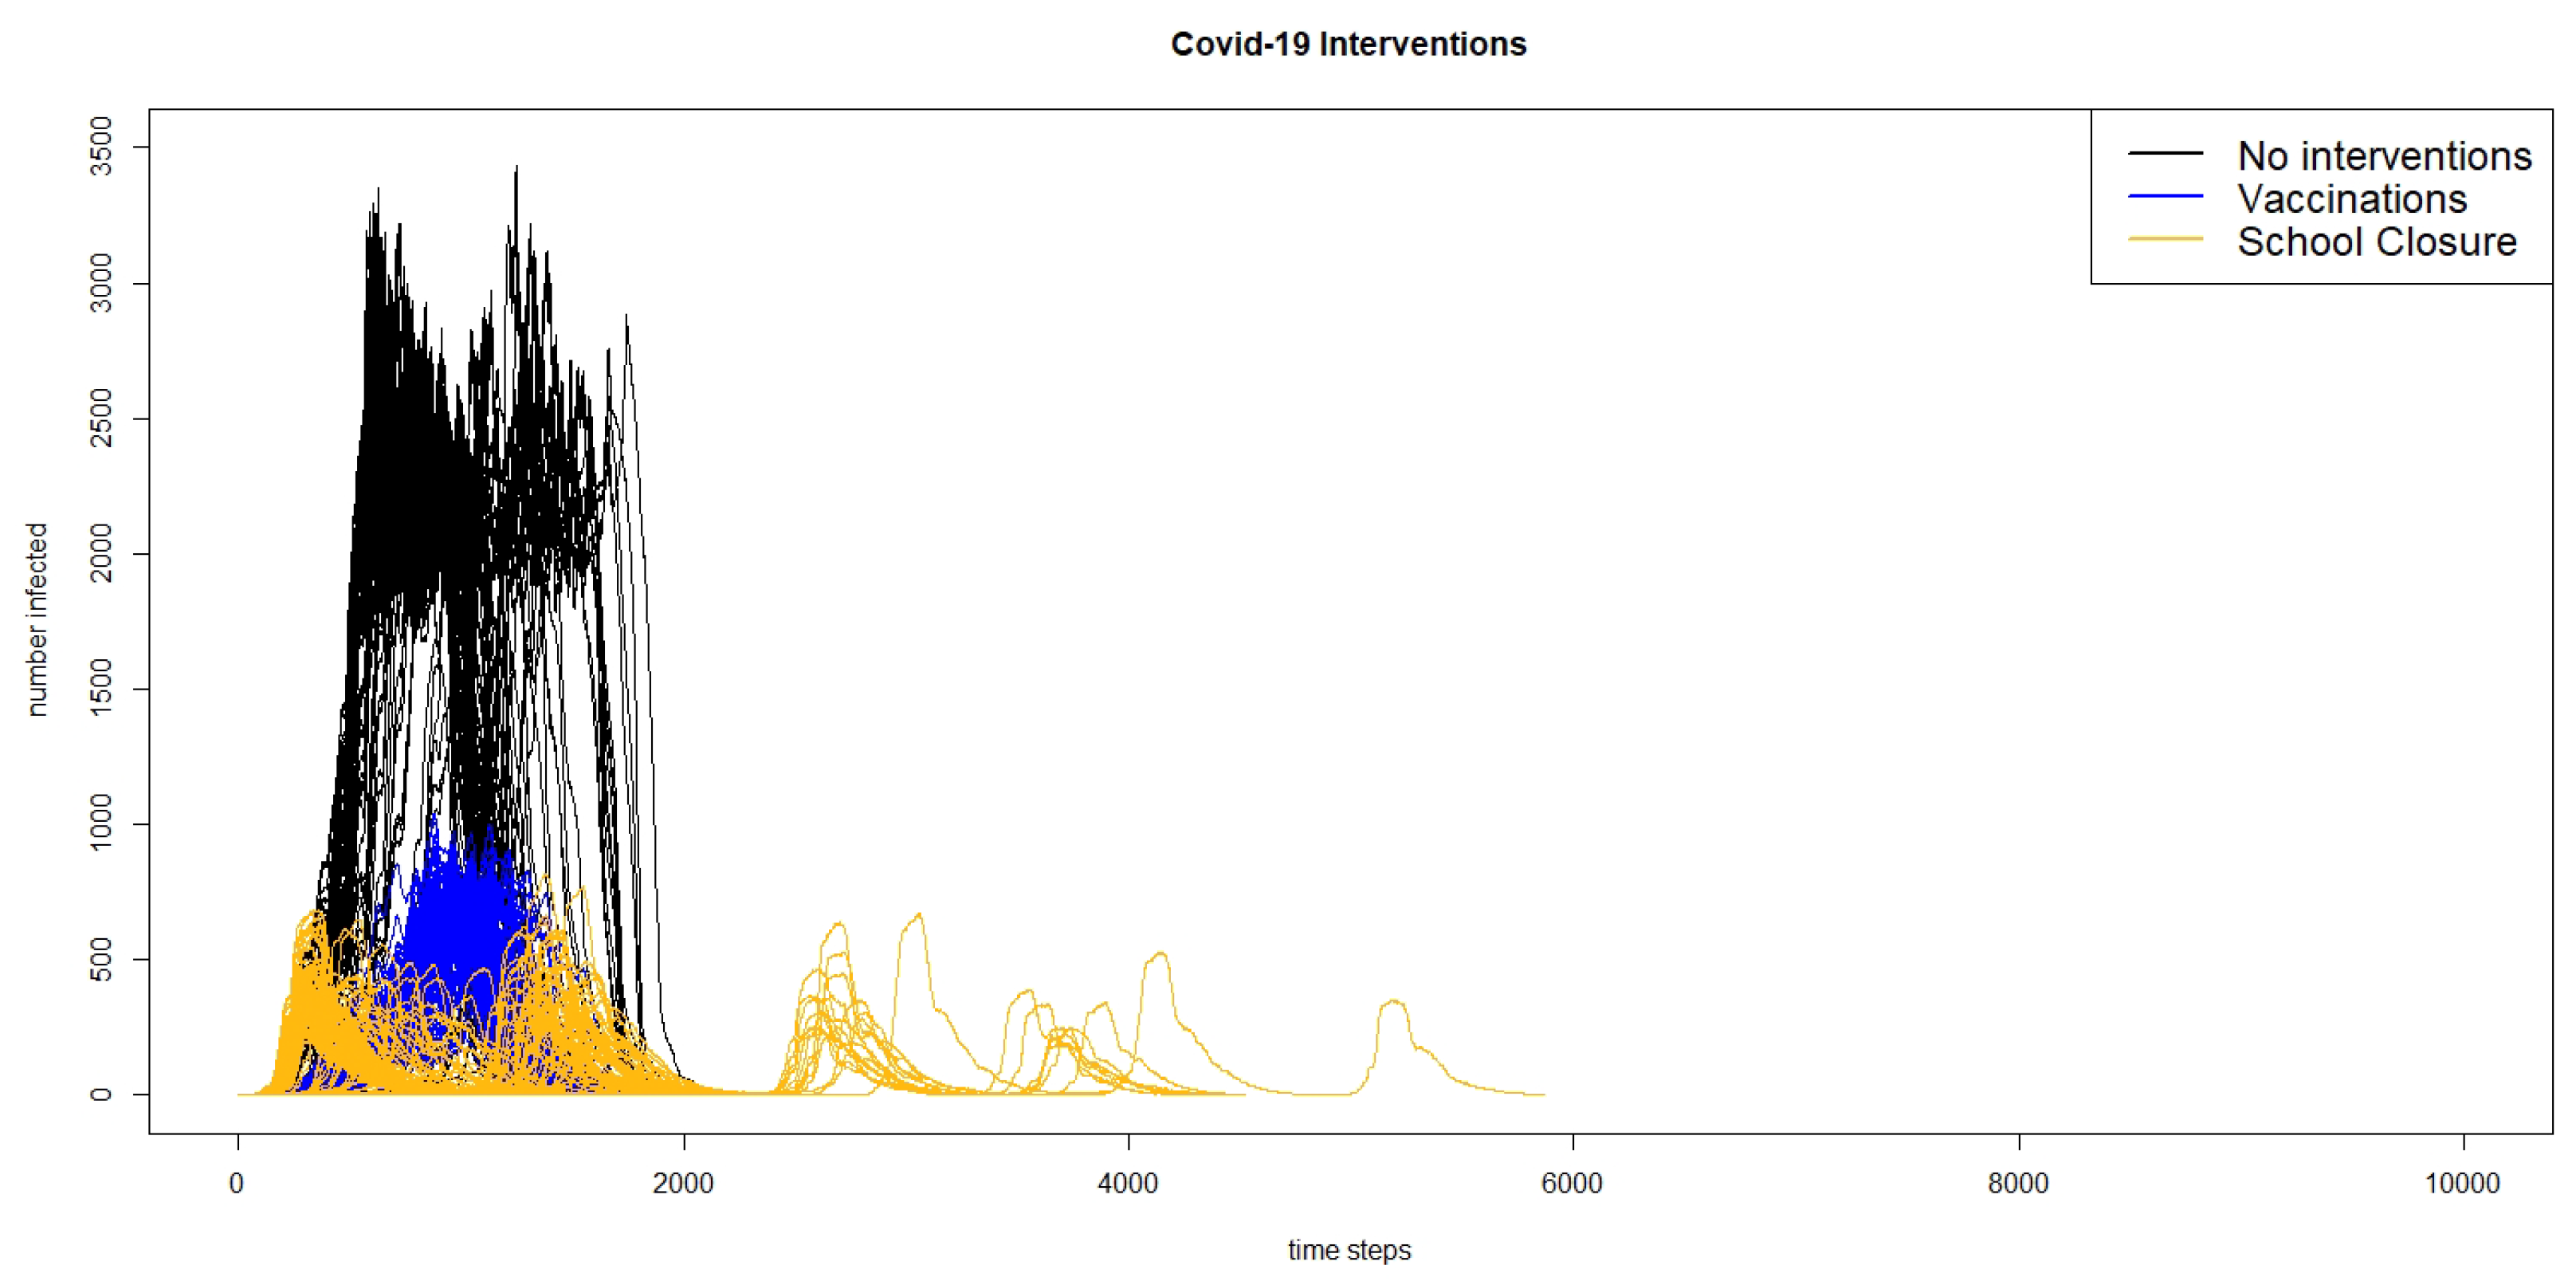
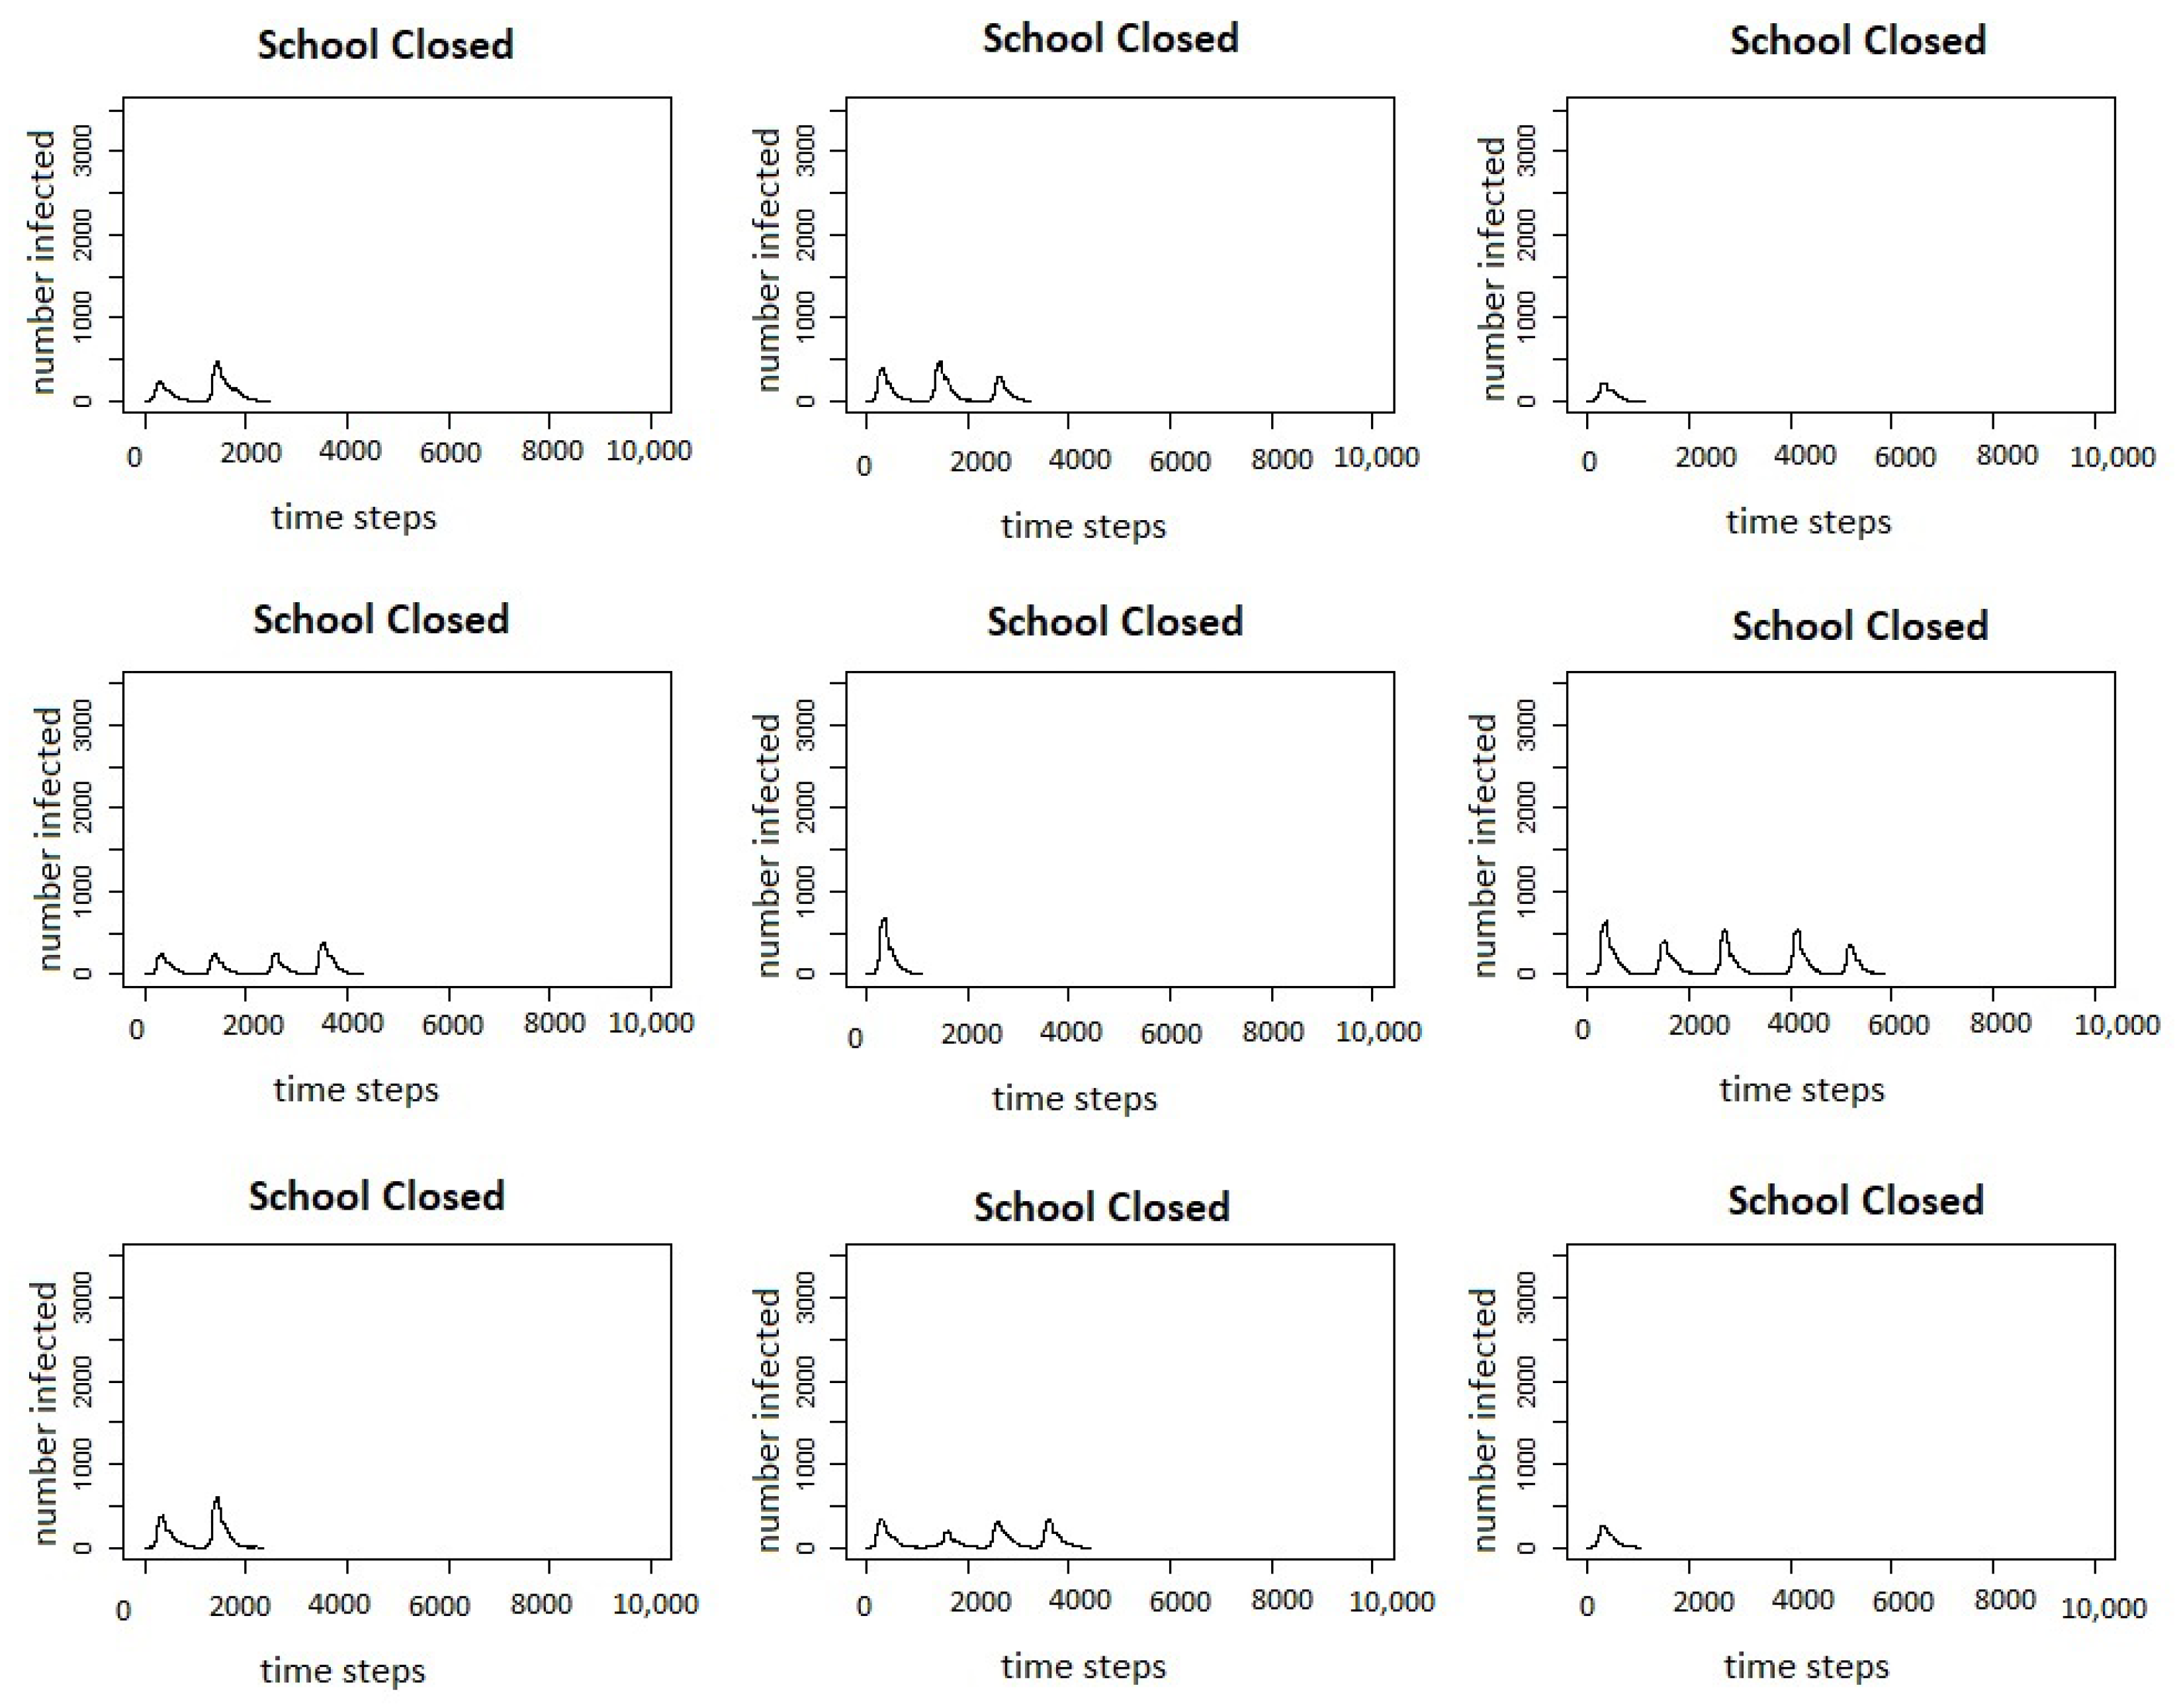
Figure 6 shows the infection curves for all of the 300 runs of the three different scenarios of the COVID-19 model: no interventions, vaccinations, and school closures, and
Figure 7 shows the infection curves for nine individual runs of school closures.
In both figures, we can see that in a number of runs, there are multiple peaks of the outbreak. Even though the schools do not reopen until there are fewer than two agents infected in the county, this does not count exposed agents, and if there are a number of agents exposed, they may start spreading the virus again once the schools are re-opened. Comparing the results of the model for the intervention scenario for measles with vaccination and the scenario for COVID-19 with school closures, we can see that the responses to interventions are very different. The measles outbreaks reach one small peak and then die out, whereas in many cases, the COVID-19 outbreaks reach multiple peaks.
Comparing the results between diseases, it is interesting to note that the measles outbreaks with vaccination and school closures are significantly smaller than the COVID-19 outbreak with the same vaccination rates. This is likely because of a number of characteristics of COVID-19 that are different than measles: agents are infectious before showing any symptoms, and there are a large number of mild cases. Agents who are presymptomatic but infectious will not change their behaviour in the model, and agents with mild cases will likely stay home less often than those with more severe cases; both of these factors should drive up the number of those infected, and are not present in the measles model. It is also important to see that the school closure policies reduce the size of the COVID-19 outbreak more than vaccinations, while the vaccinations reduce the size of the measles outbreak more than school closures. Again, this can be contributed to the characteristics of the disease. The presymptomatic and mild COVID-19 cases play a large role in the outbreak dynamics, and these individuals do not change their behaviour to staying home more when sick, as the symptomatic agents in the measles model would; thus, movement restrictions are more successful at controlling the COVID-19 outbreak, because these individuals will not be mixing with their peers, leading to fewer infections.
3.4. COVID-19 in Leitrim: Real Interventions and Timings
The experiment reported in the previous section demonstrated the flexibility of agent-based models in terms of simulating the effect of interventions on the complex dynamics of a disease spreading through a population and environment. In this section, we report on an experiment that assessed the ability of our COVID-19-adapted, agent-based model to replicate the dynamics of a real COVID-19 outbreak through a population when the actual interventions imposed during the real outbreak are simulated in the model.
We focus on simulating the COVID-19 outbreak in Leitrim County, Ireland, using real timings and interventions. Although the first case of COVID-19 was reported in the Republic of Ireland on 29 February 2020, there were no cases reported in Leitrim until the 21st of March, when three cases were reported. In response to the COVID-19 outbreak, Ireland has taken a number of country-wide mitigation measures. On 13th March, all schools and universities were closed, and on 28th March, a nationwide lockdown was implemented. The initial lockdown required all non-essential workers to stay within 2 km of their home, and all restaurants, pubs, and non-essential shops were closed.
To simulate these measures, we make a number of changes to the model, mostly to the transportation component of the model. When schools are closed, students do not attend school, and move about their day as if it was a weekend until lockdown occurs. Working agents are classified as either essential or non-essential to determine if they continue to work during lockdown, and 20% of working agents are considered to be essential [
32]. During lockdown, all non-essential agents stay within their small area, and have a 90% chance of being in their home at a given point during daytime hours. Although Ireland has gone through a number of phases to lift the lockdown measures starting with Phase 1 on 18 May 2020, in the modelling scenario, we do not lift the lockdown measures but run the simulation until there are no additional cases in the county. To mimic the outbreak in Leitrim, we start the scenario with three agents infected after the schools have already been closed.
The results from running the model mimicking the real Irish interventions for COVID-19 compared to no interventions can be found in
Table 6. As expected, implementing the interventions results in a large reduction of agents infected, with an average of 304 agents having been infected at the end of the outbreak compared to 26,134 with no interventions. Similarly, there are, on average, only 48 agents infected at the peak of the outbreak with interventions, compared to 2144 without interventions. Looking at the timings of the outbreaks, the interventions increase the total number of days until there are no longer any exposed or infected agents to 142 days from 115 days, and increase the days until the peak to 63 from 57. This is likely due to the slower spread because agents are staying home and not interacting with each other as often, thus, the rapid growth in cases is not seen in the intervention scenario. This results in the susceptible pool of agents staying larger for a longer period of time. However, reducing the number of contacts an agent has also reduces the effective reproductive number (
):
is reduced because it takes into account both the number of individuals who are no longer susceptible (which still grows under the intervention, if at a reduced rate), and how public health interventions slow transmission. This reduction in
also leads to a reduction in the number of non-susceptible individuals in the population needed to reach herd immunity. Therefore, the outbreak with the intervention results in fewer people being infected overall, because there is a lower level needed for herd immunity, but the outbreak lasts longer because the slower growth rate means it takes longer to reach this reduced herd immunity level.
In the real COVID-19 epidemic, there were 83 confirmed cases in Leitrim from 29 February until 19 July 2020. This is 142 days into the epidemic, the average time for the outbreak to last in the simulation model. From 19 July through 5 August 2020, there were only two more cases identified in the county. Although, at first, 83 cases appears to be much smaller than the simulated 304 cases in the agent-based model, the model identifies all cases including those who would be asymptomatic or mild and would not have been tested, while the 83 cases are only those who have been identified through testing. If we assume that the average number of cases simulated in the model is the real number of cases in Leitrim, this would result in approximately 27% of cases being identified. This is in line with the results from a seroprevalence study that was carried out in Ireland in the summer of 2020 which found that the number of estimated cases based on the study results was three times higher than the identified cases [
33].


