Article

Identifying Climate Adjacency for Enhancing Climate Action Using Systems Thinking and Modelling

DESTA Research LLP, New Delhi 110016, India
*
Author to whom correspondence should be addressed.
Systems 2021, 9(4), 83; https://doi.org/10.3390/systems9040083
Submission received: 11 October 2021 / Revised: 10 November 2021 / Accepted: 11 November 2021 / Published: 16 November 2021
(This article belongs to the Special Issue System Dynamics: Insights and Policy Innovation)

Abstract

:
This paper presents findings from a process aimed at identifying the climate linkages of non-climate focused environment and development projects in India. Findings from four case studies based on workshops using participatory systems thinking are summarized. These climate adjacencies are documented as systems stories using the tools of systems thinking—behavior over time graphs and causal loop diagrams. These place-based stories highlight how the environment and development projects have linkages with climate change mitigation and adaptation. An attempt has been made to convert one of the systems stories into a computable simulation model using system dynamics modelling. A small concept model has been created thus and used to perform simulation runs. Four scenarios have been generated and the results discussed. Our learning from converting feedback maps into stock-flow models is presented. The insights generated from interpreting the feedback maps and simulation results are also presented. These insights are then compared and the benefits of simulation evaluated. The paper highlights the need to document climate linkages of non-climate-focused development projects and the benefit of converting systems stories into simulation models for developing operational insights. The important role such methods can play in developing capacities for enhancing climate action is also discussed.

1. Introduction

There is growing evidence that the world is headed towards an increase of at least 1.5 °C in average global surface temperature relative to pre-industrial levels by the year 2100 due to anthropogenic climate change [1]. If left unchecked, the growing global emissions of greenhouse gases (GHG) could lead to an increase in average global surface temperature of up to 5.7 °C by year 2100 [1]. It is estimated that the last time global surface temperature sustained at or above 2.5 °C higher than pre-industrial levels was over 3 million years ago [1]. Thus, the future in a climate-changed world would pose unprecedented challenges for human civilization [2].
There is a likelihood of an increase in climate extreme events such as droughts, floods, cyclones and heat waves due to climate change. This would create varying degrees of impact on people living in different parts of the world. The increase in frequency and intensity of such events would challenge the existing adaptive capacities of human settlements to sustainably cope with such impacts [3].
The two fundamental approaches for developing a response to climate change are with regard to (a) mitigation, i.e., reducing GHG emissions to reduce the extent of warming and (b) adaptation, i.e., to adapt to the existing and anticipated changes in climate and local ecosystems [4,5]. Mitigating climate change requires limiting cumulative global GHG emissions and reaching at least net zero CO2 emissions [1]. Alongside, the adaptive capacities of people need to be improved for them to be able to sustainably cope with the changes already underway. Hence, a mix of both adaptation and mitigation is required for managing the threat of climate change.
The science of climate change needs to transcend scientific and geographic boundaries and lead to local action. However, simply making people and communities aware of the research findings and the science behind them does not guarantee social action [6]. People need to learn for themselves by exploring how the decisions they take affect the climate and their adaptive capacities and benefit them in the long run. Tools and methodologies that can accelerate the process of identifying and developing place-based strategies and solutions could be an effective way of operationalizing mitigation and adaptation strategies [6,7].
Systems thinking and system dynamics modelling are disciplines that can allow people to test their assumptions about how their actions impact the climate change process and their own adaptive capacities before they are implemented. A prominent example of using system dynamics in such a direction is the work of Climate Interactive, which strives to achieve this by allowing users to experiment with their assumptions and policies that can help limit global warming and learn through the experiment results [8]. Their interactive simulation tool expedites people’s learning journeys by closing the loop between taking decisions, seeing the results and modifying the decisions through a virtual learning environment. The simulation tools, En-ROADS and C-ROADS, are being used by officials and policymakers in key UNFCCC parties, including the United States, China and the United Nations [8].
Such efforts help improve understanding of the consequences of our actions at a global and national scale. The science of climate change, to some extent, also informs us about the consequences at a regional scale. However, there is a need to contextualize the meaning of climate change impacts at the grassroots level and for local ecosystems. People need to assess the impact of their own activities/actions on climate change and on their own adaptive capacities. This requires a closed-feedback-loop learning environment: how climate change impacts their lives and livelihoods and how their lives and livelihood impact climate change, their local ecosystems and their own adaptive capacities.
Although few, there are some examples where scenario planning through participatory approaches and systems thinking and modelling tools have been used to test how people relate their own actions to the sustainability of their local ecosystems in context of climate change [9,10]. Such efforts show that people do have capabilities to intuitively relate their actions with climate change but do not necessarily evaluate and modify them in order to mitigate their adverse effects. Formal methods and processes are needed to provide them an opportunity to reflect and revise their activities and align their vision with climate change goals (mitigation and adaptation). Applying tools and processes of systems thinking and system dynamics modelling at a local scale can expedite the learning of people and enhance their awareness about their own adjacencies with climate change. In recent times, a few efforts to use narratives to develop system dynamics models in context of climate change have begun to emerge [11]. However, no study, to our knowledge, has attempted to document the climate linkages of non-climate-focused projects using the tools and methods of participatory systems thinking.
The research question of whether non-climate-focused projects have climate adjacencies and if yes, of what kind, is an important one which we hoped to answer through the effort described in this paper. In this paper, we summarize findings from four case studies of social and environmental development projects aimed at identifying the climate adjacency (incidental linkages with climate change which may not appear to be directly related but exist in parallel) using participatory systems thinking. These adjacencies were mapped, through participatory workshops, with agencies using the tools of systems thinking. The aim of these workshops was to identify how each agency’s work linked to climate change adaptation and mitigation and what the impact of that link was on the community and local ecology. As described in the next section, the process was chosen to be a participatory one in order to capture the stories/narratives of these agencies working on the ground through systems thinking and use those to build a formal understanding of how their work and climate change impact each other. These linkages—which are usually considered outside a project’s boundaries—were identified through the use of systems thinking tools. In this paper, we have summarized the insights drawn from these cases and also presented a small system dynamics model (concept model) of one causal loop diagram to illustrate the need for simulating the feedback maps in order to test the insights, conduct policy experiments and explore their contingencies. This paper draws from a larger report [12] which contains more detail on the projects as well as on each of the cases summarized here.

2. Materials and Methods

The method used to map out the climate adjacencies of the aforementioned projects was participatory systems thinking carried out through in-person workshops with the different teams at each of their project locations in different parts of India. The participants were familiarized with the tools and basic concepts of systems thinking and were made to develop the behavior over time graphs (BOTGs) of key variables pertaining to resources and the climate. The causal loop diagrams (CLDs) were created and evaluated during the workshop by authors of this paper in an iterative manner with participants’ inputs (as detailed below). The workshops were 4 days long and included site visits. This process followed is summarized below:
  • Familiarization with project: project teams made presentations about their projects in order to familiarize us with the details of the social–ecological systems they were intervening in, their project designs, rationales and expected and achieved results;
  • Introduction to systems thinking and workshop purpose: we carried out a short presentation on systems thinking and its tools to familiarize the participants with them, and also laid out the goals of the workshop;
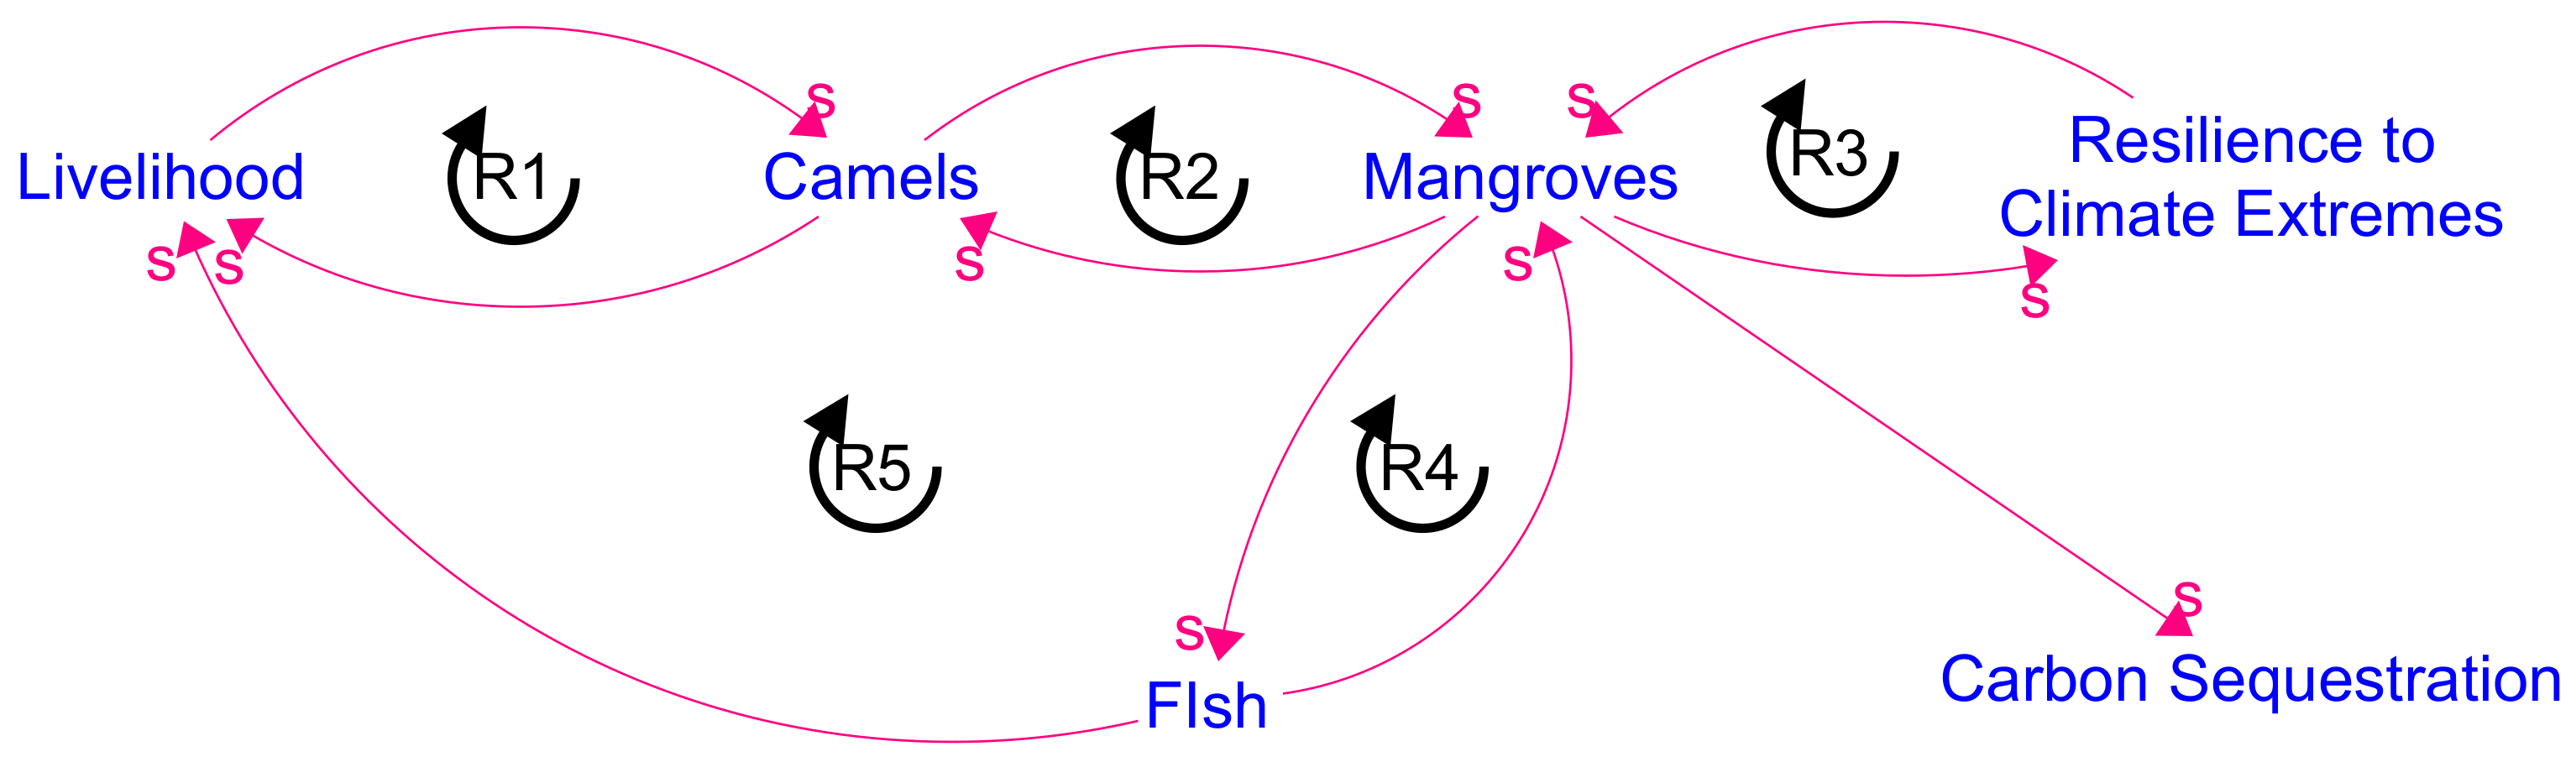
  • Understanding historical dynamics through BOTGs: Collectively, with the project teams, key indicators aligned with their work and broadly aligned with climate change (e.g., related to resources and livelihoods, such as commons, water, energy, agriculture and forests) were shortlisted. The project teams were then broken down into groups and they were asked to draw out the historical evolution of the variables in the form of BOTGs, marking the key shifts or changes in dynamics they had observed/had evidence of from the past and the reasons for the shifts. They also drew the reference modes for their ‘hope’ and ‘fear’ for the future, as is done commonly in participatory systems thinking exercises. A short demo was done to familiarize them with this tool and process of applying it;
  • Presentation of BOTGs by participants: Each group then presented their BOTGs to the larger group and explained the reasoning for the shapes of change. A Q&A between the larger group and the presenting group ensued and, in many of the cases, the trends of the graphs were revised by the teams based on new information or data that someone from another group provided;
  • Developing CLDs by listening to participants: As the participants presented their BOTGs and narrated the stories and reasons behind the trends and shifts in dynamics, it provided rich causal information for us as modellers to map out causal interactions that were inherent in the narratives. This led to the creation of multiple causal loop diagrams ‘live’ in the workshop settings. These were then presented to the group and verified/validated. They underwent change based on feedback and then were revised and finalized if the group thought that they were able to capture the causal logics in their landscapes adequately;
  • Presentation on climate change mitigation and adaptation: We then made a presentation highlighting important trends in climate change, climate impacts and climate mitigation and adaptation to familiarize the team and bring participants onto the same page regarding climate change and climate action;
  • Listing of project activities: All the main project activities of the concerned project were listed by the participants;
  • Using mitigation and adaptation matrices to position project activities: Participants used 2 frameworks given to them (provided in supplementary material) to position their activities in terms of their impacts on livelihoods and the environment (relevant for adaptation) and carbon sources and sinks (relevant for mitigation). This was done in breakout groups and then finalized through group review;
  • Generating systems stories capturing linkages with adaptation and mitigation: Listening to the reasoning behind the charts prepared by the participants provided information rich with causal interplays which was used to make CLDs capturing them.
Overall, the process followed the iceberg model of systems thinking—where we used our time in the workshop to go deeper into the iceberg—identifying indicators as events, drawing patterns seen over time and then going deeper towards the system structure through the tools of systems thinking—BOTGs and CLDs. The process also provided a glimpse into the mental models of the participants and the organization in the form of their approach and assumptions behind their project’s theory of change. The overall process is captured in Figure 1, with images of a BOTG drawn up by participants in the workshop and a corresponding CLD developed during the session (given for illustrative purpose).

3. Results

This process resulted in the coproduction of various climate linkages of the agencies’ projects, which are captured as ‘systems stories’ in this section.

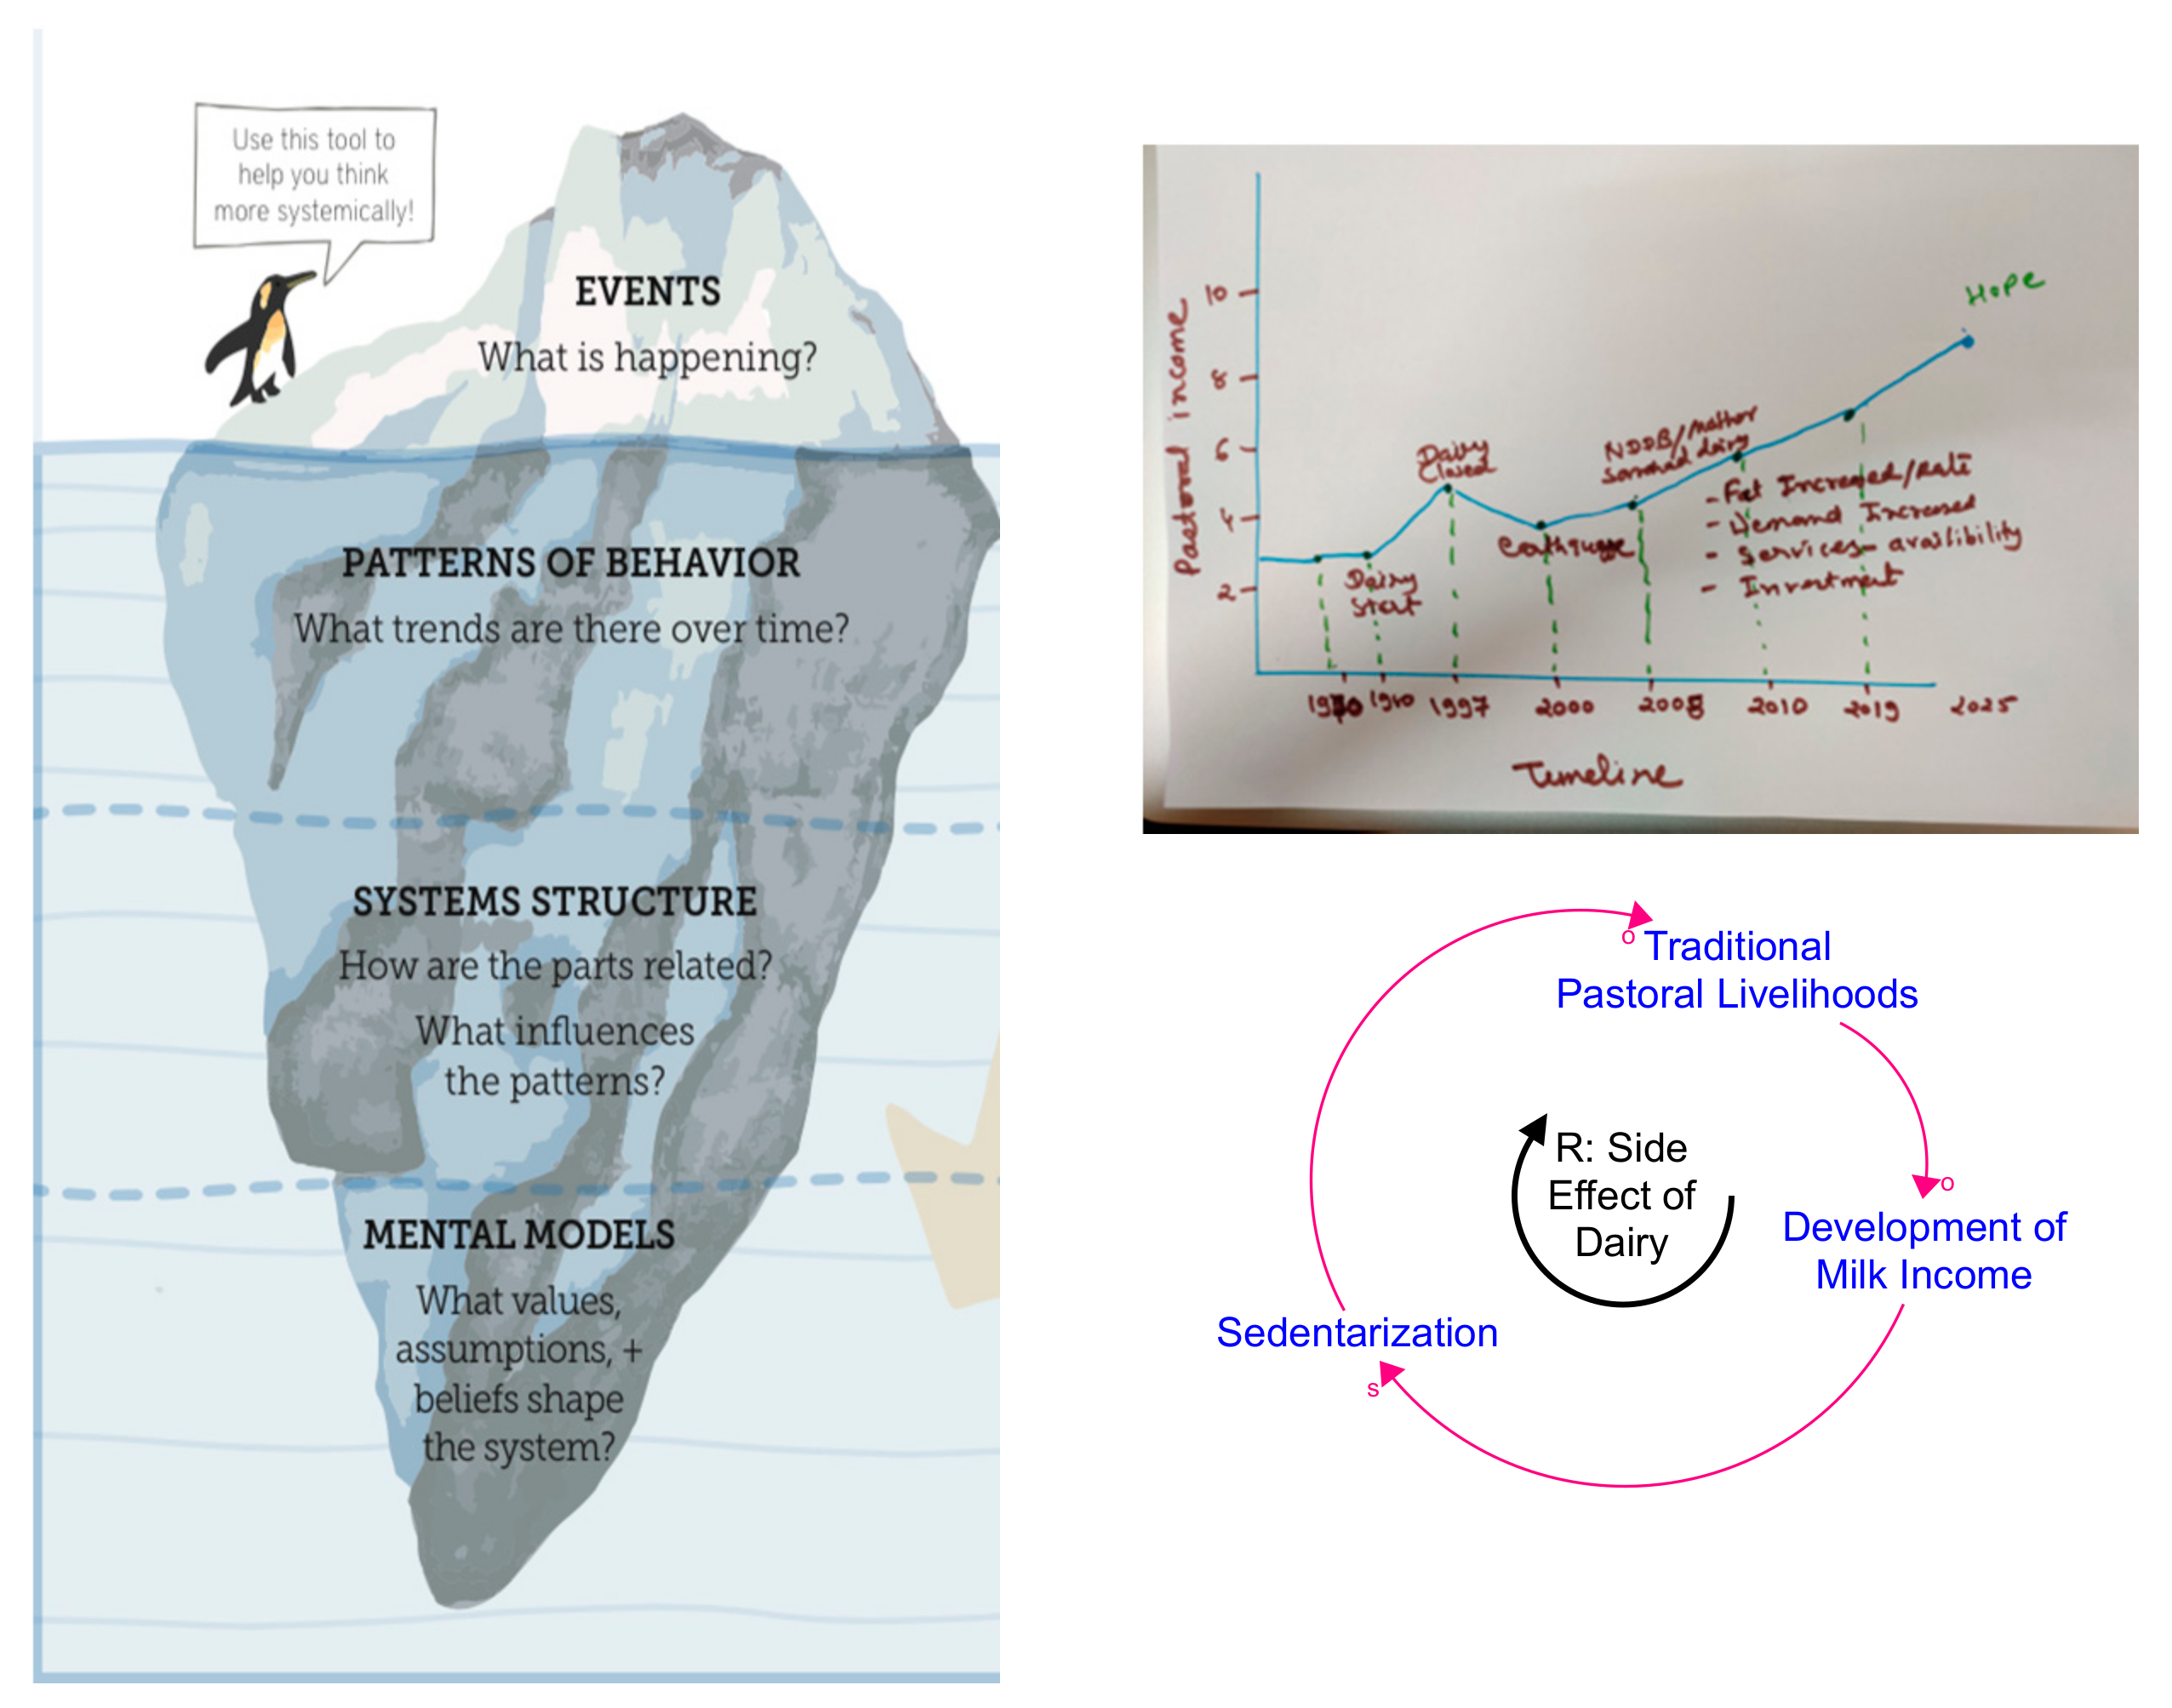
3.1. Short Note on the Notation of Causal Loop Diagrams

The systems stories presented next will use the notation of causal loop diagrams (CLDs), a key tool used in systems thinking [13,14]. A CLD consists of variables connected by causal arrows, from cause to effect. The ‘s’ and ‘o’ signs represent similar and opposite polarities, respectively, between the connected cause and effect variables. An ‘s’ implies the cause and effect variables both change in the same direction (i.e., if the cause variable increases, the effect variable increases, and vice versa), while an ‘o‘ implies that the cause and effect variables change in the opposite direction (i.e., if the cause variable increases, the effect variable decreases, and vice versa). When a chain of causation beginning at a variable feeds back onto the variable (after influencing other variables in the chain of causation), a feedback loop is formed. Loop labels (B and R) characterize the nature of the feedback loops. R stands for a reinforcing loop, in which a change in a variable in one direction is amplified further by the causation inherent in the loop (when tracing the causes and effects in that feedback loop). Reinforcing loops result in one-way exponential growth or collapse. B stands for balancing loops, in which a change in a variable in one direction is dampened by the causation inherent in the loop (when tracing the causes and effects in that feedback loop). Balancing loops tend to resist change in any direction and are fundamentally goal-seeking or oscillatory in nature (when there are time delays between cause and effect) [13,14].

3.2. Systems Stories

3.2.1. Loss of Pastoral Mobility

Traditional forms of pastoralism were inherently adapted to the vagaries of local weather and climatic changes [15,16]. The paths pastoralists chose to travel and the landscapes they visited were in sync with the changes in weather and weather conditions [15]. Thus, their adaptive capacity relied on continuance of their nomadic way of life and on some certainty in weather variations. However, given the fact that pastoral livelihoods are fast eroding and threads of intergenerational knowledge are breaking up, there is a need for interventions that can secure their livelihood. These interventions come with some level of integration with modern technology and create market linkages. This tends to push the community’s traditional way of life and culture out of its known equilibrium. A case in point is seen in the Banni grasslands in Kutch, India, captured in Figure 2, where, in order to save pastoral livelihoods, initiatives such as dairy-based milk production were introduced. This led to an increase in the milk-based income of pastoralists and an exponential growth in the buffalo population. However, it also led to sedentarization of the pastoralists in order to remain close to the dairy collection centres and chilling units which are essential in order to give a steady supply of milk to the dairy, which the dairies require. This unintended consequence poses a challenge to the very basis of traditional pastoral practices—mobility, which was also an important contributor to their adaptive capacity for managing weather and climate uncertainties. Thus, although the sedentarization helps the dairies to grow (reinforcing loop in Figure 2), the unintended consequence is erosion of traditional pastoral practices and adaptive capacity.

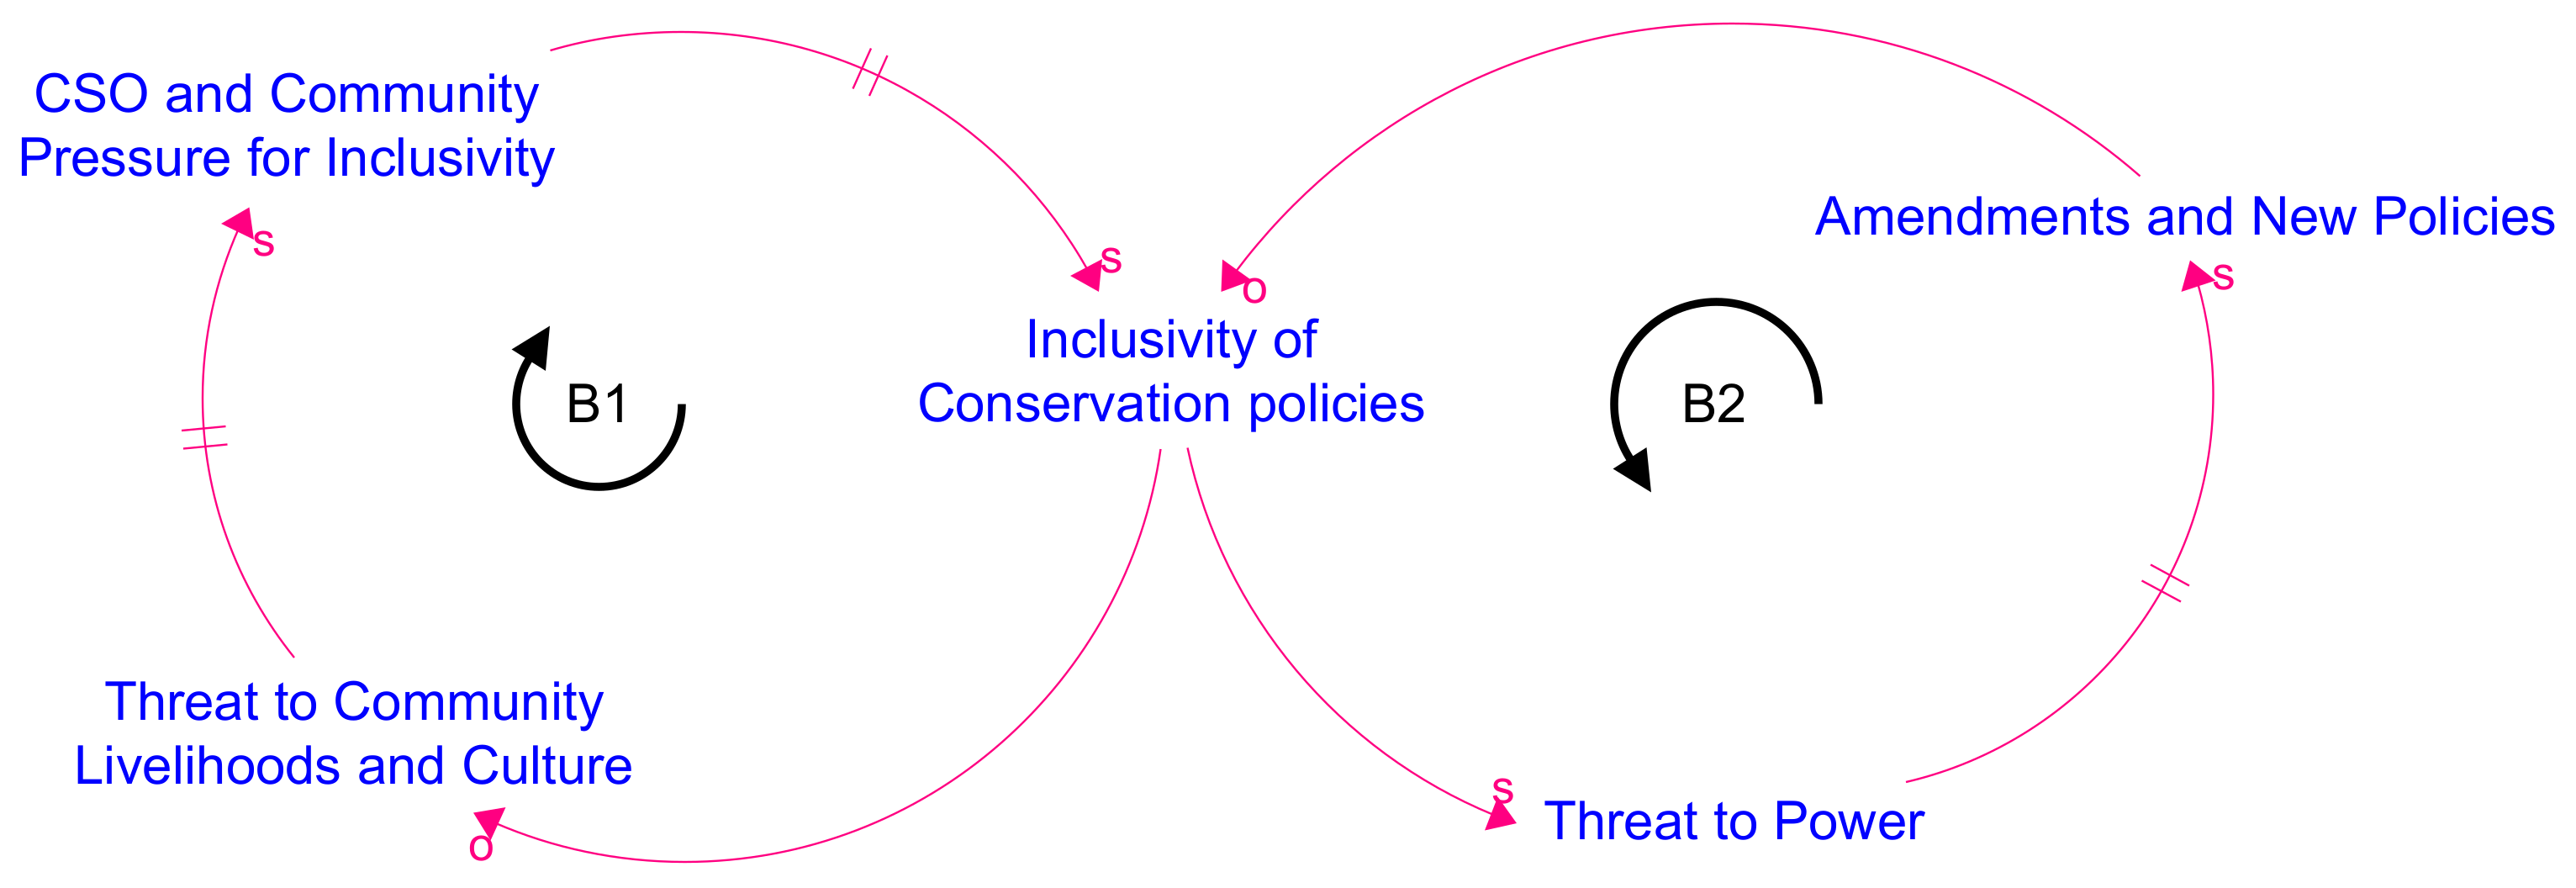
3.2.2. Role of Mangroves for Livelihoods, Adaptive Capacity, Mitigation and Risk Reduction

Mangroves act as common grazing grounds for the Kharai Camels (a unique camel breed with the ability to swim) and form the livelihood base for the camel-rearing pastoralists of Kutch [17,18]. The mangroves play a crucial role in sustaining multiple livelihoods and providing multiple climate benefits:
  • They provide food and fodder for Kharai camels [17,18], maintain a habitat for fish and provide enough biodiversity for the fish population to survive and thrive [19] The Kharai camel and fish provide the base of livelihoods for the local pastoralists;
  • They create flood resilience and work as carbon sinks (fixing carbon from the atmosphere through photosynthesis and also into the soil) [19,20];
  • Because of their dense root systems, mangroves trap sediments which help in stabilizing coastlines, prevent erosion from waves and storms and protect the coasts during cyclones [19,20].
As such, mangroves are integral to the local community’s adaptive capacity. However, mangroves are being destroyed by the privatization of coastal land, which is being done to develop salt pans and industrial units [17,18]. The close-knit interconnections between mangroves, biodiversity, livelihoods and adaptive capacity as well as carbon sequestration are shown as a set of five reinforcing loops in Figure 3. Camels provide livelihoods for pastoralists, which incentivizes them towards conserving the mangroves (R1). At the same time, mangroves provide a habitat for camels and are essential for their survival. In addition, grazing by the camels helps to maintain the mangroves by promoting fresh growth of vegetation (R2). Mangroves also provide a habitat for fish, which by maintaining the local ecological balance, help in sustaining the mangroves (R4). Fish also provide a means of livelihood for fisherfolk (R5). Additionally, as explained earlier, mangroves provide resilience to climate extremes and people, having valued this property, have conserved them (R3). Mangroves are also important carbon sinks.
The development of industries is thus coming at the cost of not only the loss of mangroves, which are a habitat to unique biodiversity such as Kharai camels and traditional livelihoods, but also at the cost of adaptive capacity and increased disaster risk from climate extremes. The particular project of the agency we were working with was trying to secure land rights for pastoralists on the mangroves and has strong climate adjacencies, as described above.

3.2.3. Adaptation–Mitigation Linkages in Context of Plantations

The CLD in Figure 4 shows how focusing on mitigation through external interventions alone can lead to maladaptation1 and reduced adaptive capacities of the communities. For example, large-scale plantations carried out on grasslands or in existing patches of forests with the goal of improving carbon sinks to mitigate the extent of climate change (B1) (or making up for forest loss elsewhere) sometimes lead to dominance of only certain plant species (monocropping), creating an imbalance in the local biodiversity of the landscape. Over time, as more area is converted into tree plantations, the existing biodiversity reduces. This then limits the landscape’s potential to sequester carbon. Over time, this could lead to underachievement of the goal, resulting in more plantations for increasing mitigation, thus creating a vicious cycle that is ultimately self-defeating in purpose (R2).
In addition, loss of biodiversity can have negative impacts on communities and livestock: It can lead to a reduction of provisioning services such as food, fodder and water, which reduces the communities’ adaptive capacities and perhaps also changes their behavior towards this new ecosystem. More consumptive practices could emerge within the communities as an outcome of the shortfall in ecosystem provisioning. This could further reduce their adaptive capacities as a result of the degraded ecosystem, forming a vicious cycle (R1). Thus, the linkages between mitigation and adaptation at the local level must be properly understood before any interventions with a singular focus are implemented. The work of agencies attempting to form a bridge and produce dialogue between plantation implementers and local communities thus assumes great importance, not only through a biodiversity and livelihood lens, but also through a climate change lens.

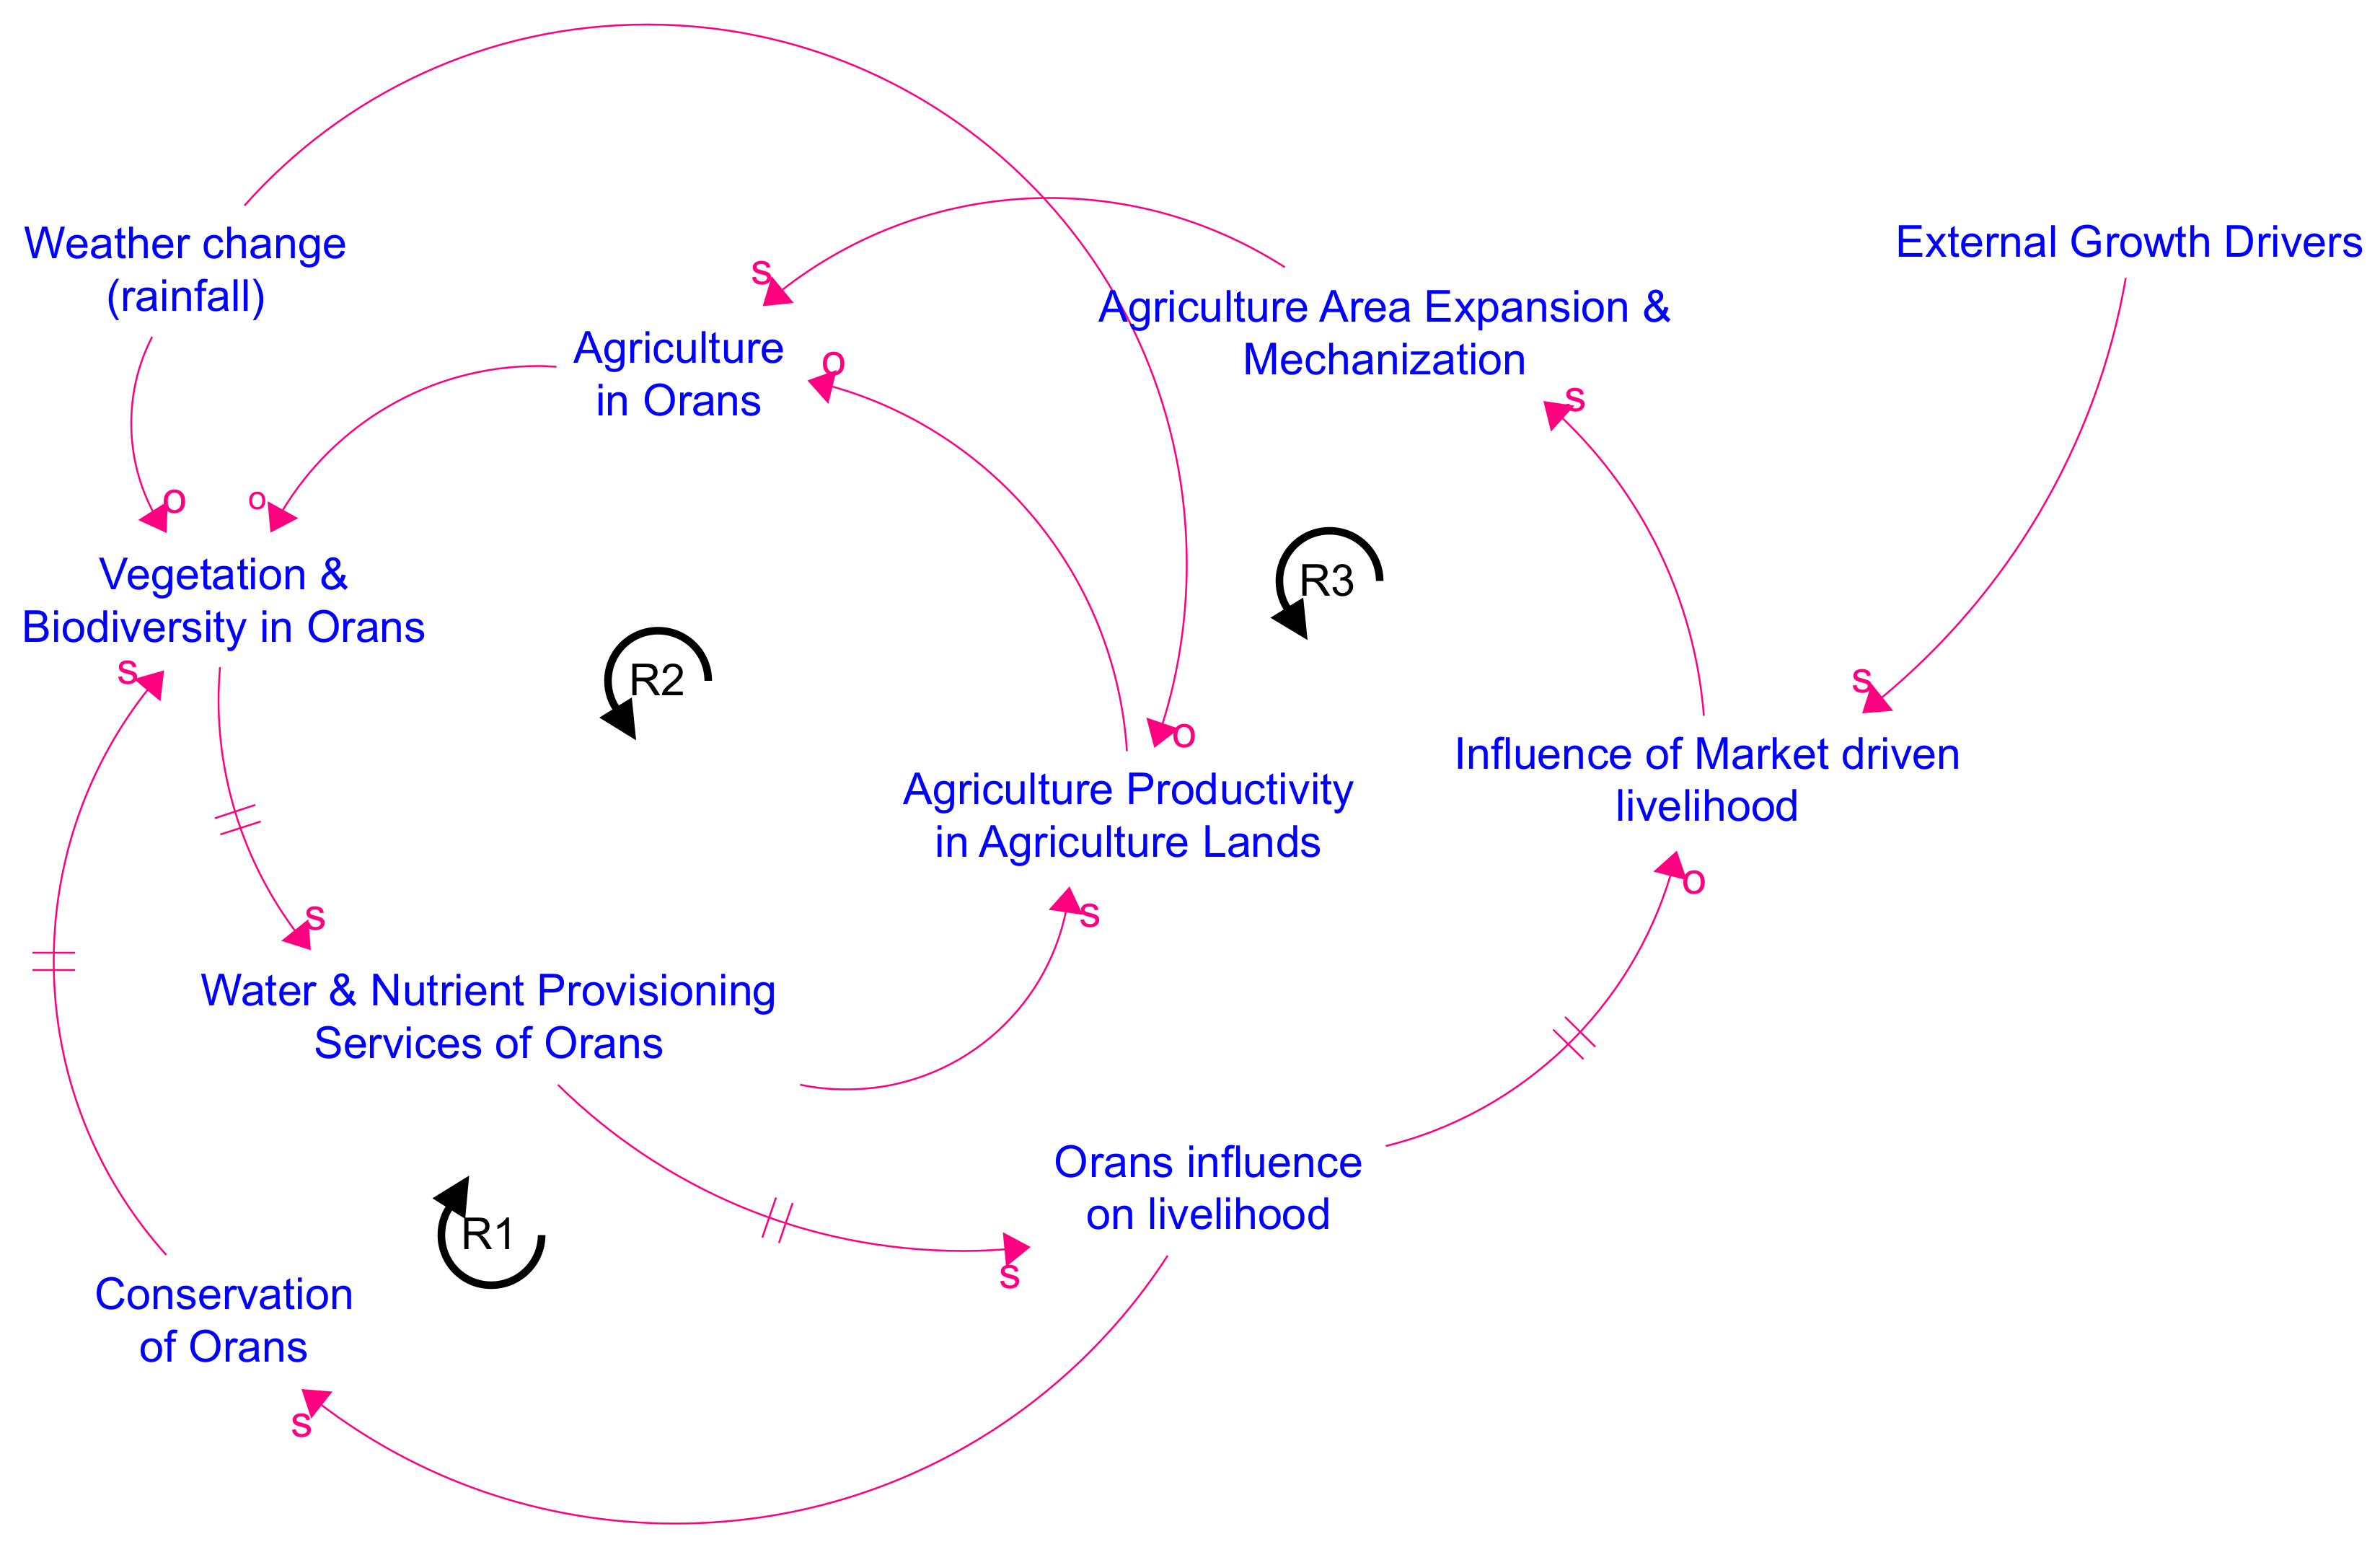
3.2.4. Escalation in the Conservation Discourse

There was an observation that the relationship between the two dominant schools of thought on conservation—community-based conservation of nature and isolated ‘protected island’ conservation of nature—was escalating efforts from both sides. This is presented through the escalation systems archetype [21] shown in Figure 5.
To increase the inclusivity of conservation policies, civil society organizations (CSOs) and communities have been fighting for rights and laws that allow for more inclusion (B1). After years of struggle, the communities see some success in the form of new laws or policies which are more inclusive. However, this creates a perception of threat to the other school of thought which believes protected islands are necessary. This has led to pressure from their lobbies for amendments to the laws/policies (B2). Over time, this has been wearing down the inclusivity that communities gained through their effort which, in time, would lead to more pressure building up from the communities. The end result of this escalation is often a breakdown in the discourse.
This escalation is counterproductive to achieving the goals of sustainable development, including adaptation to climate change. If the common goal of achieving SDGs is to be achieved, then it necessitates first achieving goal 17, which pertains to partnerships. Thus, from a climate change perspective, where acting fast and decisively is important, partnerships need to be strengthened and dialogue improved. Thus, projects working to strengthen dialogue between such contesting parties are important from a climate adjacency lens as well.

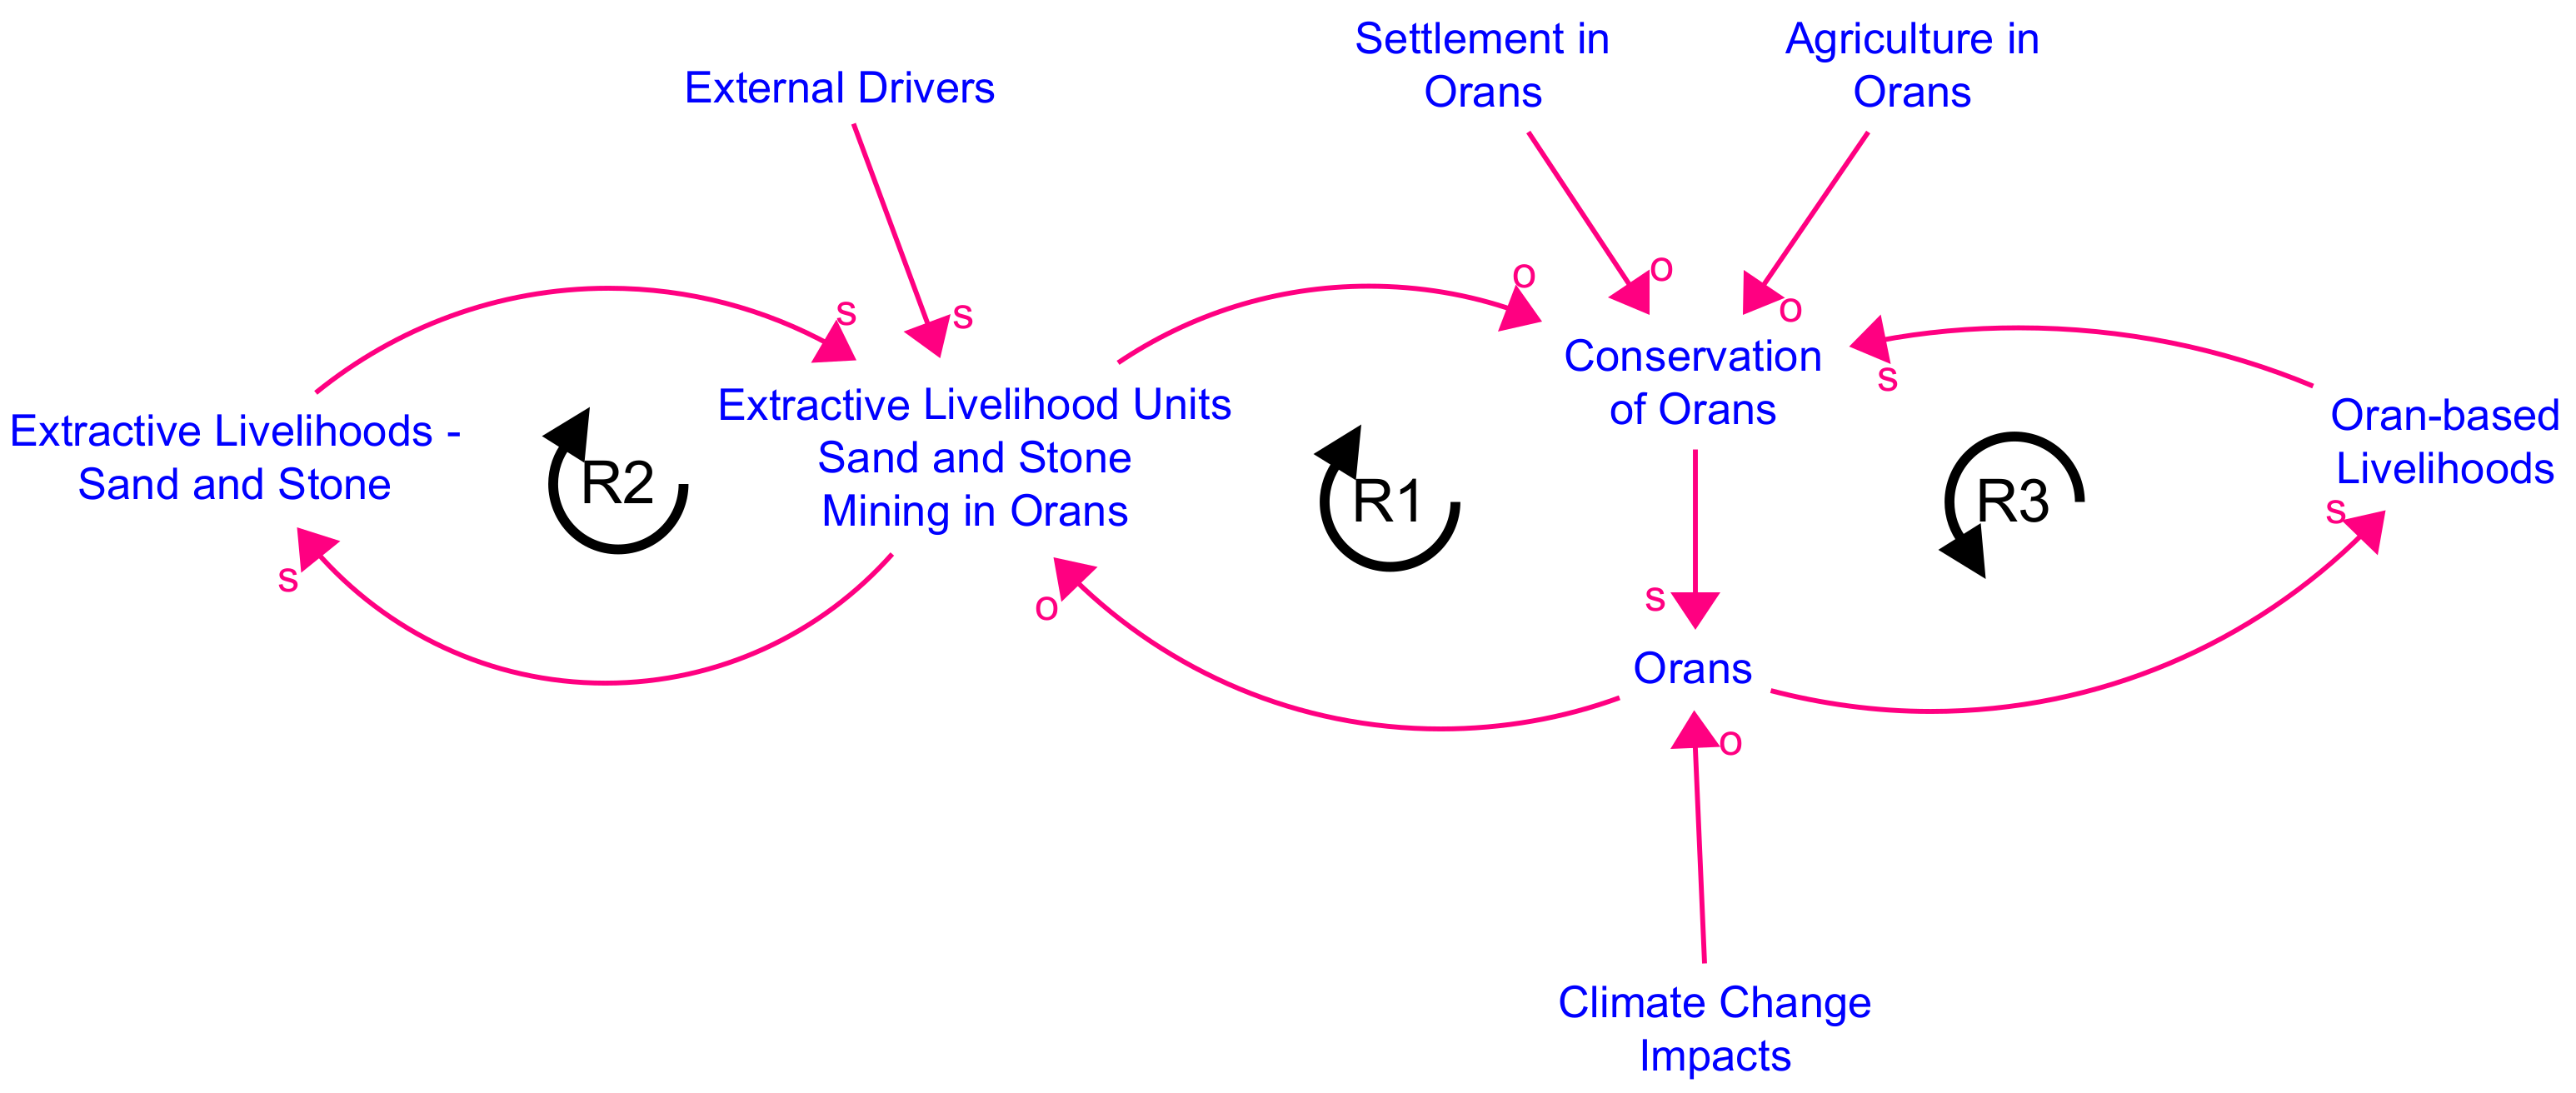
3.2.5. Oran-Based Livelihoods and Conservation

Orans are community-conserved and managed areas in Rajasthan, India, which have been in existence for more than 500 years [22,23]. They are forest patches protected in the name of some god or goddess by the local communities. This concept historically evolved as a way to support the local livestock-dependent livelihoods [24,25]. Traditionally used for livestock grazing and fodder collection, they support communities by providing them with food, fodder, fuel wood and water and other environmental regulatory services [24,25,26]. The communities have the joint responsibility for sustainably managing the Orans [24,25]. By being associated with local deities, they play a role in the cultural and spiritual identity of local communities [24,25]. Orans provide all four ecosystem services—including food, fodder, fuel wood and water—to communities and are, as such, the source of a number of livelihoods, including honey making, ethno-medicines, timber-based agriculture implements, house construction, handicrafts, and pottery [24]. In addition, they provide water for domestic, livestock and agricultural purposes. During times of low rainfall, Orans have historically proven to be a source of freshwater, food, fodder and livelihoods for communities, thus providing adaptive capacity to people. Further, as the livelihoods are coevolved with Orans, and are non-exploitative and conservative in nature [24,25]. Furthermore, the act of grazing and pruning also stimulates regeneration. This makes it a reinforcing relationship that strengthens both community livelihoods and Oran conservation as seen in Figure 6. These livelihoods can thus be seen to be a form of ecosystem-based adaptation2 (EbA) [27]. Projects working to preserve Orans and Oran-dependent livelihoods, such as that of the agency we worked with, thus have strong positive climate adjacencies.

3.2.6. Maladaptation in Orans

Increasingly, however, there are instances of maladaptation happening in and around the Orans. For example, settlements on the peripheries of the Orans have been observed to be encroaching on their boundaries and mining for sand/stone has been increasing. This disturbs the ability of the Orans to provide the ecosystem services. It also changes the mindset of the community youth towards the value of the Orans. When people do not see as much value in the Orans, governance of the Orans weakens, and this promotes activities in its place that are often influenced by non-local forces such as sand and stone mining [24,25].
Figure 7 shows how activities such as settlement and agriculture in the Orans can bring down their ability to provide ecosystem services for Oran-based livelihoods and bring down their value over time in the eyes of the community, particularly the youth. This then can lead to an increased uptake of sand and stone mining activities in Orans, leading to their depletion (R1). Unearthing of Orans is a highly damaging activity as it not only erodes the vegetation but also destabilizes the landscape. Sustenance of such maladaptive practices leads to the emergence of different kinds of livelihoods upon which people and families start depending for their income. Such activities, if not stopped at their early stages, can lead to irreversible changes in the relationship between people and the Orans (R2). It is especially the young generation which becomes conditioned to viewing Orans in their degraded state and fails to acknowledge their value since the flow of ecosystem services is insignificant. This then also forms a fertile ground for maladaptation where climatic stressors can force people to further take up exploitative livelihoods to cope—as Orans are in a degraded state and do not give adaptive capacity to people—which then leads to a further deterioration of the Orans, ultimately locking people into maladaptation.

3.2.7. Agriculture-Driven Maladaptation in Orans

The CLD in Figure 8 depicts a story of change in the agricultural practice and associated encroachment of Oran land.
Traditionally, the conservation of Orans was driven by the flows of resources it provided for livelihoods, forming an incentive for strong community governance (R1), as described in detail earlier. Agriculture on lands outside Orans benefited from the flow of water and soil fertility which maintained the agriculture productivity. This sustained both the agriculture and the Orans. However, two factors have influenced a shift in the agriculture practice and led to the encroachment of Orans:
  • Weather change: Weather changes, mainly in the rainfall, have led to a reduction in agriculture productivity due to shortfall in water availability. This has created the need for either drilling borewells or moving closer to/inside the Orans (which are traditionally high-fertility zones due to rich biodiversity and water availability) for agricultural activities. As the land under Orans is reduced, it also reduces its vegetation and thereby the flow of ecosystem services. This then reduces the ability of farmers to maintain their agriculture productivity even outside of the Orans, thus creating a reinforcing loop, escalating pressure from farmers to move closer to and inside the Orans, encroaching on the land for agriculture (R2). Instances of borewells being drilled in Orans have also been found of late;
  • Change in market forces: Market prices which drive the demand for crop varieties also create an additional demand on resources such as water and land and pressure on soil fertility and agriculture. In order to increase their income, farmers are incentivized to move towards farm mechanization and to expand their cropping intensity, both of which are incentives to encroach on the Orans. This effect also works towards making the reinforcing loop R2 more dominant, increasing the pressure on Orans and consequently impacting the balance between Orans and agriculture, as described before. Thus, market forces incentivizing changes in agricultural practice and crop choices also creates a simultaneous pressure for expansion and thereby encroachment of Oran land.
Changes in local weather add to these reinforcements, making the system move in the direction of rapid encroachment, depletion of Orans, reduction in water availability and falling productivity of land outside Orans. All these together lead to the emergence of a maladaptive system where the method of coping itself reduces the adaptive capacities of the people to cope with increasing weather changes.
Furthermore, over time, the value of Orans in the eyes of people, especially the younger generation, goes down, which weakens its governance, thereby creating a social–ecological system fit for maladaptation and erosion of their own adaptive capacities (R3). Projects working to strengthen Oran conservation and Oran-based livelihoods can be seen to have strong linkages with climate change and adaptive capacity.

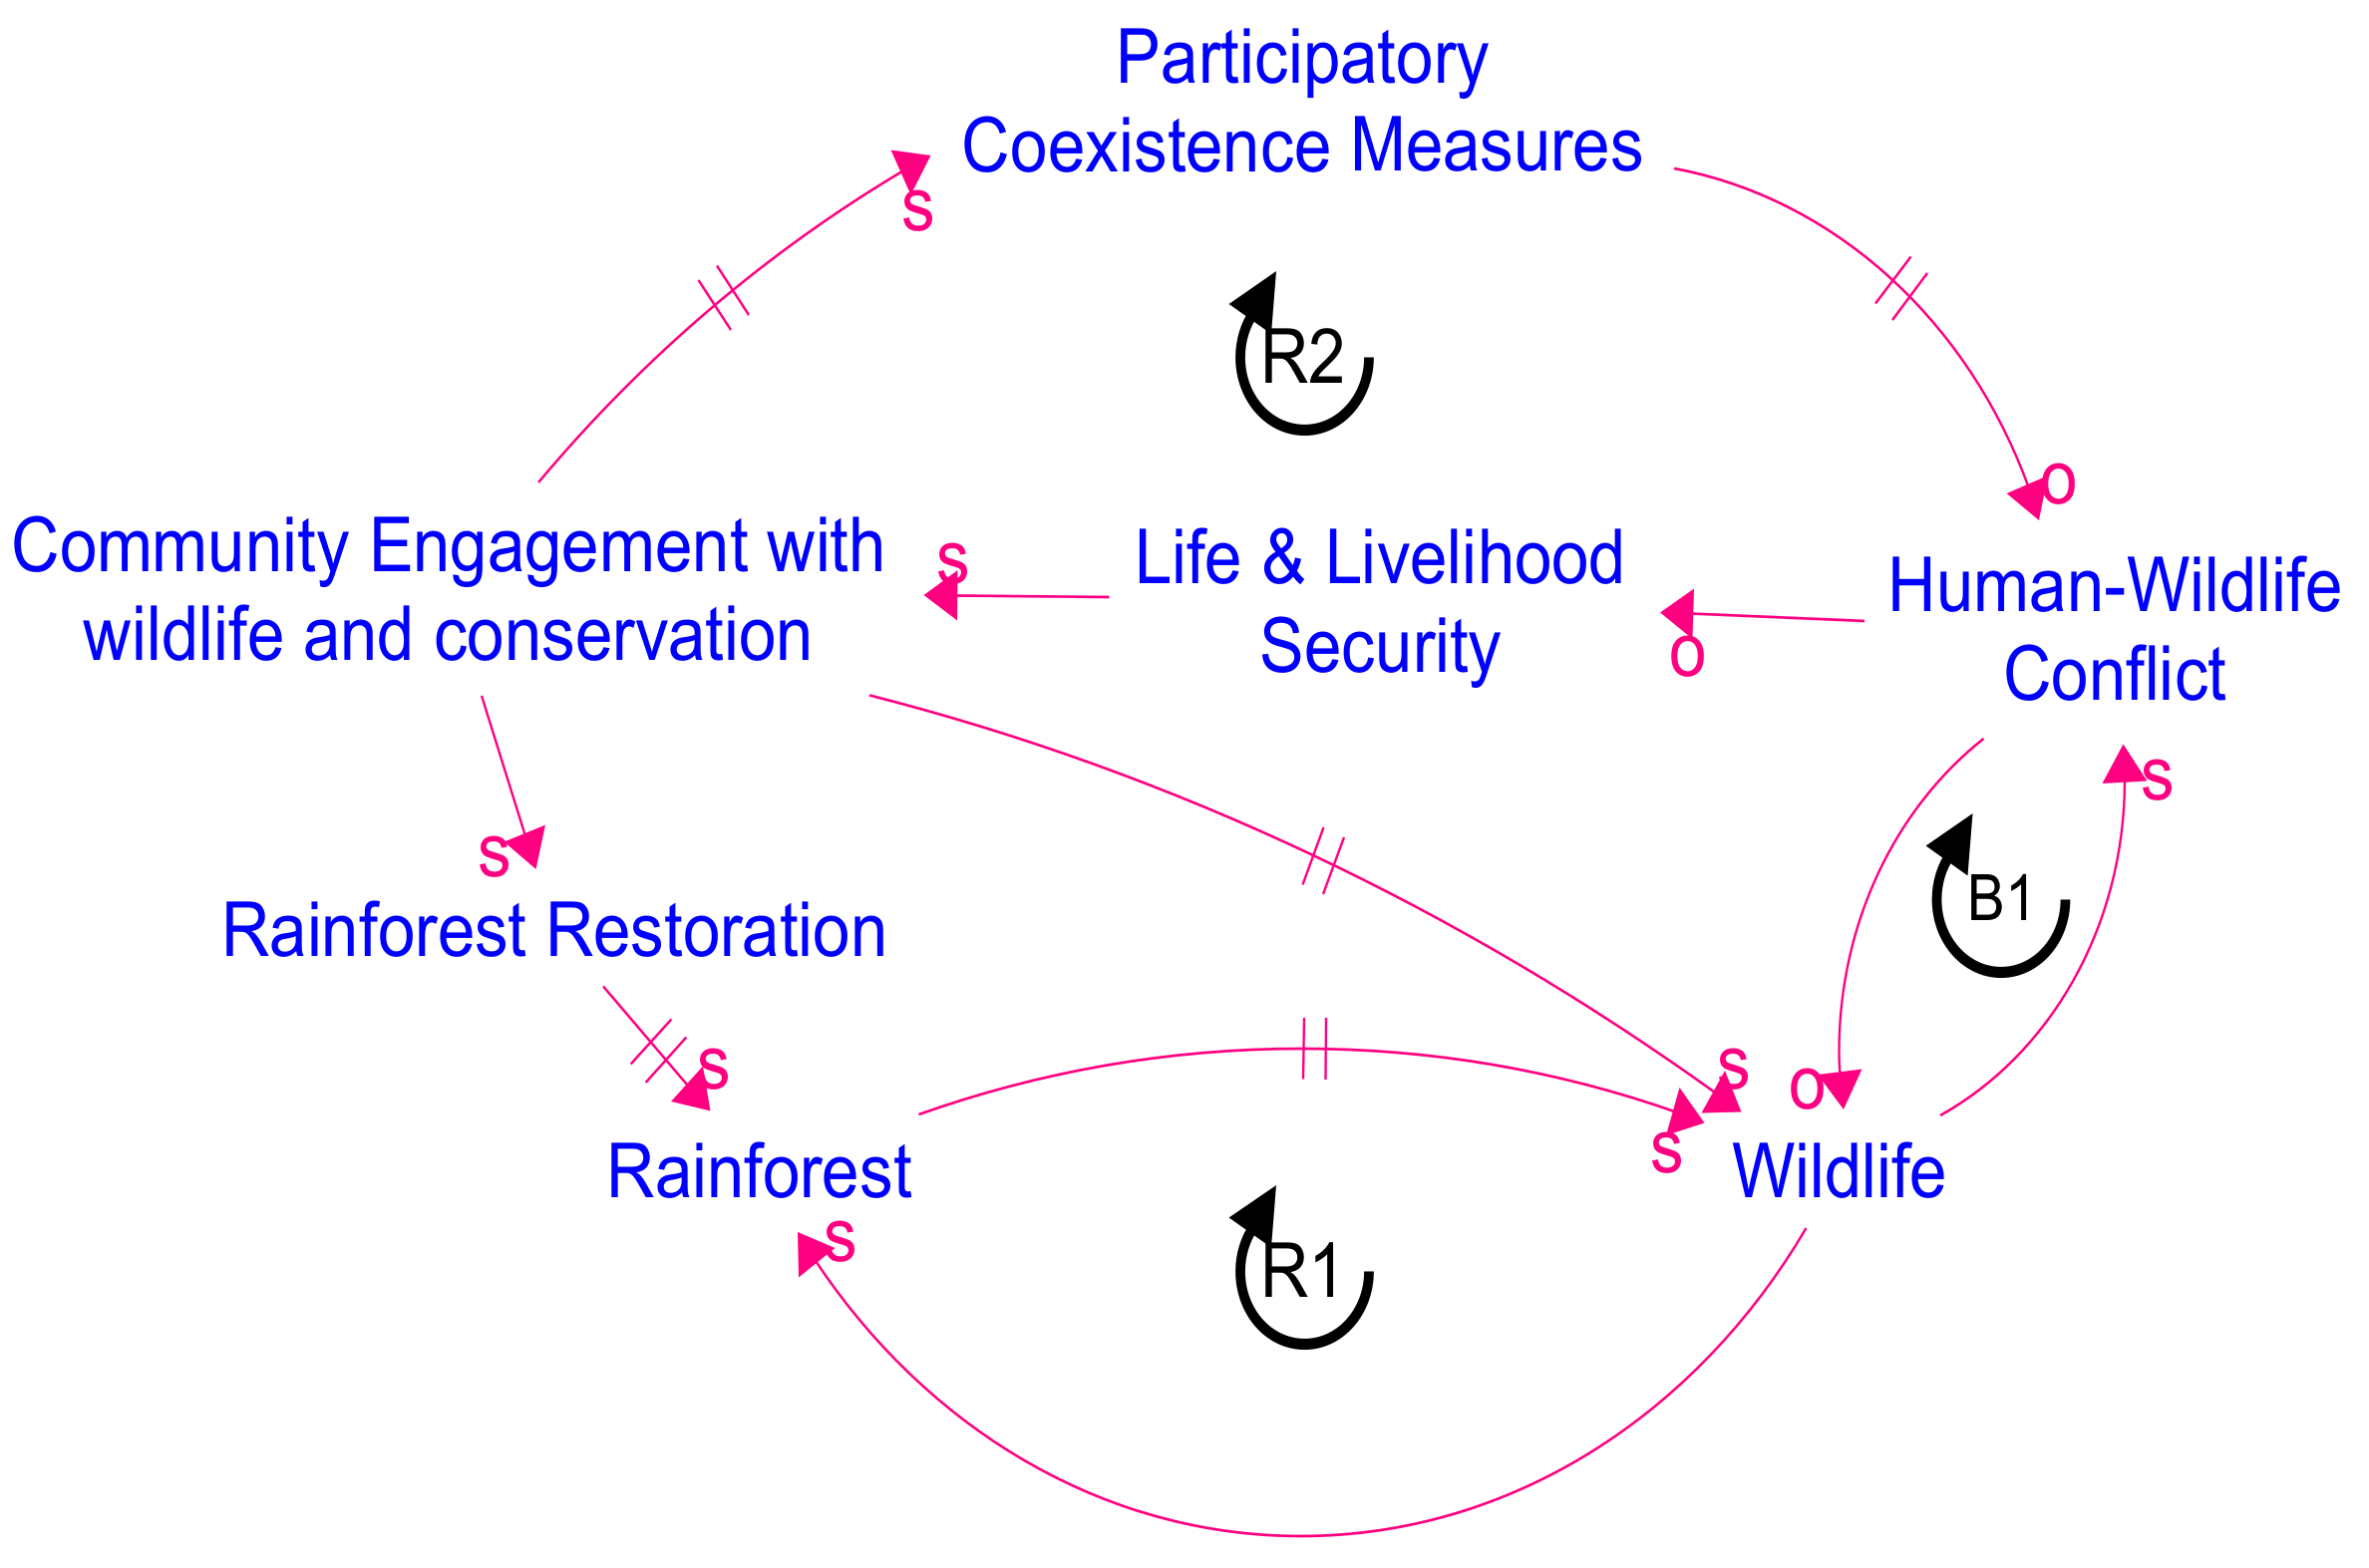
3.2.8. Rainforest Restoration and Wildlife and Community Coexistence

Rainforests are one of the most effective forms of carbon sink. Their role in climate change mitigation is significant [28]. Additionally, as shown in the CLD in Figure 9, the biodiversity they bring to the landscape (R1) can benefit communities through the increase in tourism, improved provisioning of water, reduction in pest attacks on crops and fertile land and regulation of the microclimate and soil stability, especially at times of climate extremes. All this can contribute to improving the adaptive capacities of people. However, the increase in wildlife populations can increase human–animal conflict. To this, communities often respond antagonistically, harming/threatening wildlife, in order to reduce conflict (B1). This is ultimately detrimental to both wildlife and people. In order to address this, the community’s engagement in conservation and participatory coexistence measures, such as early warning signals about elephant movement and development of wildlife corridors allowing safe movement, are important interventions, although they can take time to reach fruition (R2). Efforts in conservation education can also help to build the knowledge, awareness and appreciation within the community towards wildlife and conservation. All these, in turn, play an important role in sustaining and strengthening the culture of coexistence between people and nature. A harmonious relationship can play an important role in adaptation as changes in weather might alter ecosystem function and animal movements, increasing conflict. Having a system which has measures in place ensuring the parts are better in sync, enabling effective and speedy response, can enhance adaptive capacity. There are also other adaptation benefits from rainforests which can aid adaptive capacity, such as improved stream functioning providing water security to those in the catchment area. Rainforest restoration and associated activities to ensure a harmonious coexistence of communities and wildlife thus have strong climate adjacencies both from a mitigation and adaptation perspective.

4. Discussion

4.1. Takeaways from the Process

Below are the overall insights and takeaways that these case studies and the process provided:
  • The process of participatory systems thinking was successful in identifying and documenting the climate adjacencies of local non-climate-focused projects;
  • It was found that participants had an intuitive understanding about the climate adjacencies of their projects, and systems thinking tools helped them to crystallize and express them in the form of systems stories. Thus, the workshops provided a platform for them to formally reflect on these adjacencies and collectively identify them;
  • Through the participatory process of systems thinking, the participants became aware of the similarities and differences between the mental models (assumptions) of each other on how they saw the linkages of their work with climate change. This, to some extent, facilitated individual and team learning;
  • The systems stories indicated that resilience towards climate change cannot be developed in isolation. All local social–ecological systems need to factor in the non-local influences of the larger system that they are part of. Resilience has to be built not just for climate, but also for market and economic uncertainties. The interplays between local and non-local systems need to be understood and their effects need to be internalized in the project design;
  • Climate change mitigation and adaptation cannot and should not be seen as separate goals. One cannot be achieved without the other. All adaptation activities should try to strive towards mitigation. Additionally, all mitigation activities should be evaluated for their impact on adaptive capacities and on the environment. Too much focus on only one of these goals can lead to maladaptation and ultimately defeat the intended climate goal;
  • Identifying maladaptation in its early stages is important as it can create a path dependence for the system to evolve towards promoting maladaptive practices. There is some element of irreversibility built into social–ecological systems in the way the systems transform themselves into new cultures in context of their changed environments. Early-stage interventions must be pursued to counter maladaptation and promote proactive adaptation in order to avoid creation of this path dependence.

4.2. System Dynamics Concept Models

Developing causal loop diagrams (also known as feedback maps or systems maps) is an essential step in helping people to think in systems and look at the interconnection of parts rather than looking at parts in isolation. CLDs are popular tools to develop a hypothesis, share it and communicate the feedback structure with people [29,30]. However, CLDs do not provide an operational description of how things work; they do not allow formal testing of the hypothesis through simulation [31]. The testing process relies on face validation of the causal connections and the plausibility of the hypothesis, i.e., the realistic representation of its causal connections. The dynamic pattern or behavior generated by the causal loop diagrams is left to the mental simulation abilities of people [13]. Hence, the type of simulation outcomes they generate still remain hypothetical and, to some extent, speculative. Sometimes triangulating mental simulations with real-world data/estimations, experience and perceptions of stakeholders is useful.
Combined, causal loop diagrams and the plotting of dynamic patterns of behavior provide the full range of utility for capturing the spatial and temporal complexity of a system, but it still does not allow the testing of underlying assumptions or make the contingencies explicitly clear [32]. Sometimes, key assumptions about the system being investigated go untested, such as whether the system is nonlinear or stochastic [33]. Overemphasizing the role of feedback loops in generating the behavior of a system or model often blinds us towards the crucial role of time delays and accumulation processes [29,30]. The process of developing stock-flow models is a useful and revealing exercise for testing these assumptions [33]. Thus, computer simulations have a role to play, and it is important to develop computable models of causal loop diagrams and experiment with them to understand the contingencies of their behavior. Our mental models sometimes tend to miss out on critical feedback loops, time delays and are often unable to cognitively simulate the nonlinear dynamics [13]. Simulation models help us to become aware of these and then serve as useful tools to make others reflect on them and thereby expedite our learning process.

4.3. Developing Computable Concept Models

Converting causal loop diagrams into system dynamics simulation models is not a trivial task [34]. The process of translating CLDs to system dynamics models leads to an expansion of the detailing of the model structure—e.g., through an increase in number and need for parameterization of variables—in order to make them less ambiguous and more specific. As a first step, the purpose of converting feedback maps into computable simulation models should be to conduct policy experiments and perform sensitivity runs in order to test the insights generated through the feedback maps. It may also bring out additional insights and contingencies. The model development must be a rapid and relatively inexpensive exercise.
Small concept models can act as the necessary bridge between gaining initial insights and building consensus on the contingencies before developing full-scale simulation models. Small models are said to consist of a few significant stocks and, at most, seven or eight major feedback loops [35]. Small system dynamics models offer unique flexibility by capturing important insights about the behavior of the system arising from the feedback structure of the system while making these insights relatively easy to understand and communicate to a wide audience [35]. The learnings from small concept models then can provide clear requirements on portions of the model in need of expansion and the nature of the detailing necessary in order to provide additional insights. However, excessive model detail can interfere with clarity and comprehensibility. Increasing the number of variables leads to a disproportionate increase in the number of parameter values that need to be estimated and the amount of sensitivity testing that needs to be done [36]. Presenting a more complicated model formulation is likely to be too much for a non-SD audience to absorb and would not allow them to build an intuition for the results it may generate [37]. Thus, learning from small concept models can build efficiency in the modelling process and also provide opportunity to build consensus among different stakeholders on the need for model development and the questions the large-scale model should answer.
To illustrate this point, we converted one of the systems stories, namely the story shown in Figure 7 about sand and stone mining and Orans, into a system dynamics concept model. We generalized the specific case of sand/stone mining into consumptive/extractive livelihoods and also added the Oran livelihood-conservation loop shown in Figure 6 to complete the picture that is seen in reality—Oran-based livelihoods coexisting with/facing competition from industrial/extractive ones. The combined CLD is given below in Figure 10, which also highlights the interplay of climate and non-climatic drivers impacting the system.
The CLD appears to show an adaptation of the success-to-the-successful archetype [38], with the structure facilitating growth towards either of the livelihoods given an initial push in either direction. While converting this CLD into a computable stock-flow model, we had to make explicit the causal pathways behind each connection in Figure 10. It emerged that the natural way to model this competition between livelihoods would be by making use of the ratio between the incomes from the two kinds of livelihoods as the interface which influences the decision making of people towards either conservation of Orans (if the Oran-based income is higher) or towards increasing extractive units (if income from those is higher). A simplified version of the stock-flow diagram (SFD) of the model is given in Figure 11, along with how the loops in the SFD correspond to the CLDs.
In addition to the notation used previously in the CLDs, the reader will see stocks (rectangular blocks) and flows (taps with faucets) in Figure 11. Stocks represent places of accumulation in the system and flows represent rates of change. Stocks only change when the flows into them (inflows) or out of them (outflows) change [13,14].
The feedback loops R1, R2 and R3 shown in the CLD in Figure 10 are captured in the SFD in Figure 11 with the same names—R1, R2 and R3—and these are the central drivers of the dynamics. They are explained below:
R1: As the Orans deplete, the ratio of income from Orans to income from extractive units reduces, which increases the uptake of livelihoods from extractive units, increasing extractive units, which results in a greater extraction of Oran vegetation and feeds back into a reduction in income from Orans.
R2: As the extractive units increase, the income from extractive units increases and the ratio of income from Orans to industries decreases, which, in turn, tilts the scale in favor of extractive livelihoods, with people seeing more income and value coming from them than Orans and shifting towards them. This results in more industrial units being set up, leading to a greater extraction of Orans and increasing the income further.
R3: If vegetation in Orans increases, the income from Oran-based livelihoods increases, tilting the ratio between livelihoods in favor of Orans, which incentivizes people to conserve Orans and results in the maintenance and continuous regeneration of Orans.
R4: This is the natural stock-dependent regeneration of the Orans.
All of these reinforcing loops can, of course, work both ways. Additionally, there are a few important balancing loops which were not apparent in Figure 10, but which emerged while making the formal model. These are captured below:
B1: This is the impact of carrying capacity—as the vegetation in Orans approaches the carrying capacity, there is a reduction in the regeneration (density effect), bringing down the rate of regeneration of Orans as they approach their carrying capacity.
B2: The industrial units are extractive and reduce the vegetation. If the vegetation depletes to zero, the new industries will not have a resource base to exploit, and this limits the inflow of industries.
There are also a few other balancing loops pertaining to the stock-based limit to outflows which have been left out so as to highlight the major loops from a feedback and dynamic behavior perspective. They may be seen in the full model figure given in the supplementary material.

4.4. Insights from the Process of Converting the CLD to SFD

Straight away, from the process of making the SFD model from the CLD, a few insights emerge:
  • Oran-based livelihoods are non-consumptive in nature, i.e., the stock of vegetation in an Oran does not deplete through Oran-based livelihoods and that livelihood income is generated, without consumptive outflow, from the vegetation stock. This is an assumption; however, it is borne out through the description in the text given earlier. This also means that the feedback from the change in the state of Orans is much faster in the case of Oran-based livelihoods as compared to industrial livelihoods;
  • The extractive livelihoods (such as mining) are consumptive livelihoods, i.e., leading to an outflow from the stock of vegetation, and the income from mining is dependent on the rate of outflow. This also means that the impact of depleting/growing Oran vegetation reflects indirectly and in a much more delayed manner on extractive livelihoods, since they do not receive feedback until the Orans have depleted substantially and the outflow from the stock receives feedback from the stock;
  • The Oran-conservation ‘EbA’ loop (R3) cannot indefinitely increase the Oran vegetation as it may appear from the CLD in Figure 5. This is because, as the vegetation in Orans approaches carrying capacity, B1 becomes dominant and limits the growth;
  • Missing balancing loops: There are many balancing loops which might be left out in participatory CLD making—as evidenced by loops B1 and B2 explained above—and also other balancing loops which limit the outflows based on stock values. Depleting stocks will curtail outflows if outflows exceed the stock value captured in the full SFD given in the supplementary material.

4.5. Developing the Simulation Model

The computable system dynamics simulation model was developed based on the SFD described above. The model parameterization and assumptions are described below.

4.5.1. Model Parameterization

The stock-flow model described was calibrated so as to reach equilibrium initially, with all flows balancing out, and no change in the stock values. This is as per the good practice in system dynamics, as described in [14]. The initial values for the stocks and parameter values were chosen accordingly with some judgement on what is realistic made by us as modellers. The values can be accessed in the supplementary material. Furthermore, the values were also chosen so as to be able to recreate a base case reference mode. The reference mode taken for the base run was that of the accelerated depletion of Orans over time with extractive uses of Orans growing, as borne out in the reference scenario shown in the next section (Figure 12). This is consistent with what is seen in the real world [25].

4.5.2. Key Modelling Assumptions

  • Incomes from the two livelihoods in question are the central decision-making factor used by the community. Thus, as incomes from one source of livelihood increase relative to the other, this drives the motivation of people to move towards those livelihoods and vice versa. Non-income-based motivations are not considered here;
  • The impact of climate extremes is to reduce the vegetation. This assumption is taken in order to test the responsiveness of the system to climatic extremes;
  • The Oran vegetation loses its ability to regenerate itself once it approaches a maximum carrying capacity. Until that time, the regeneration rate is constant (although the regeneration flow is stock-dependent and will vary with the stock value).
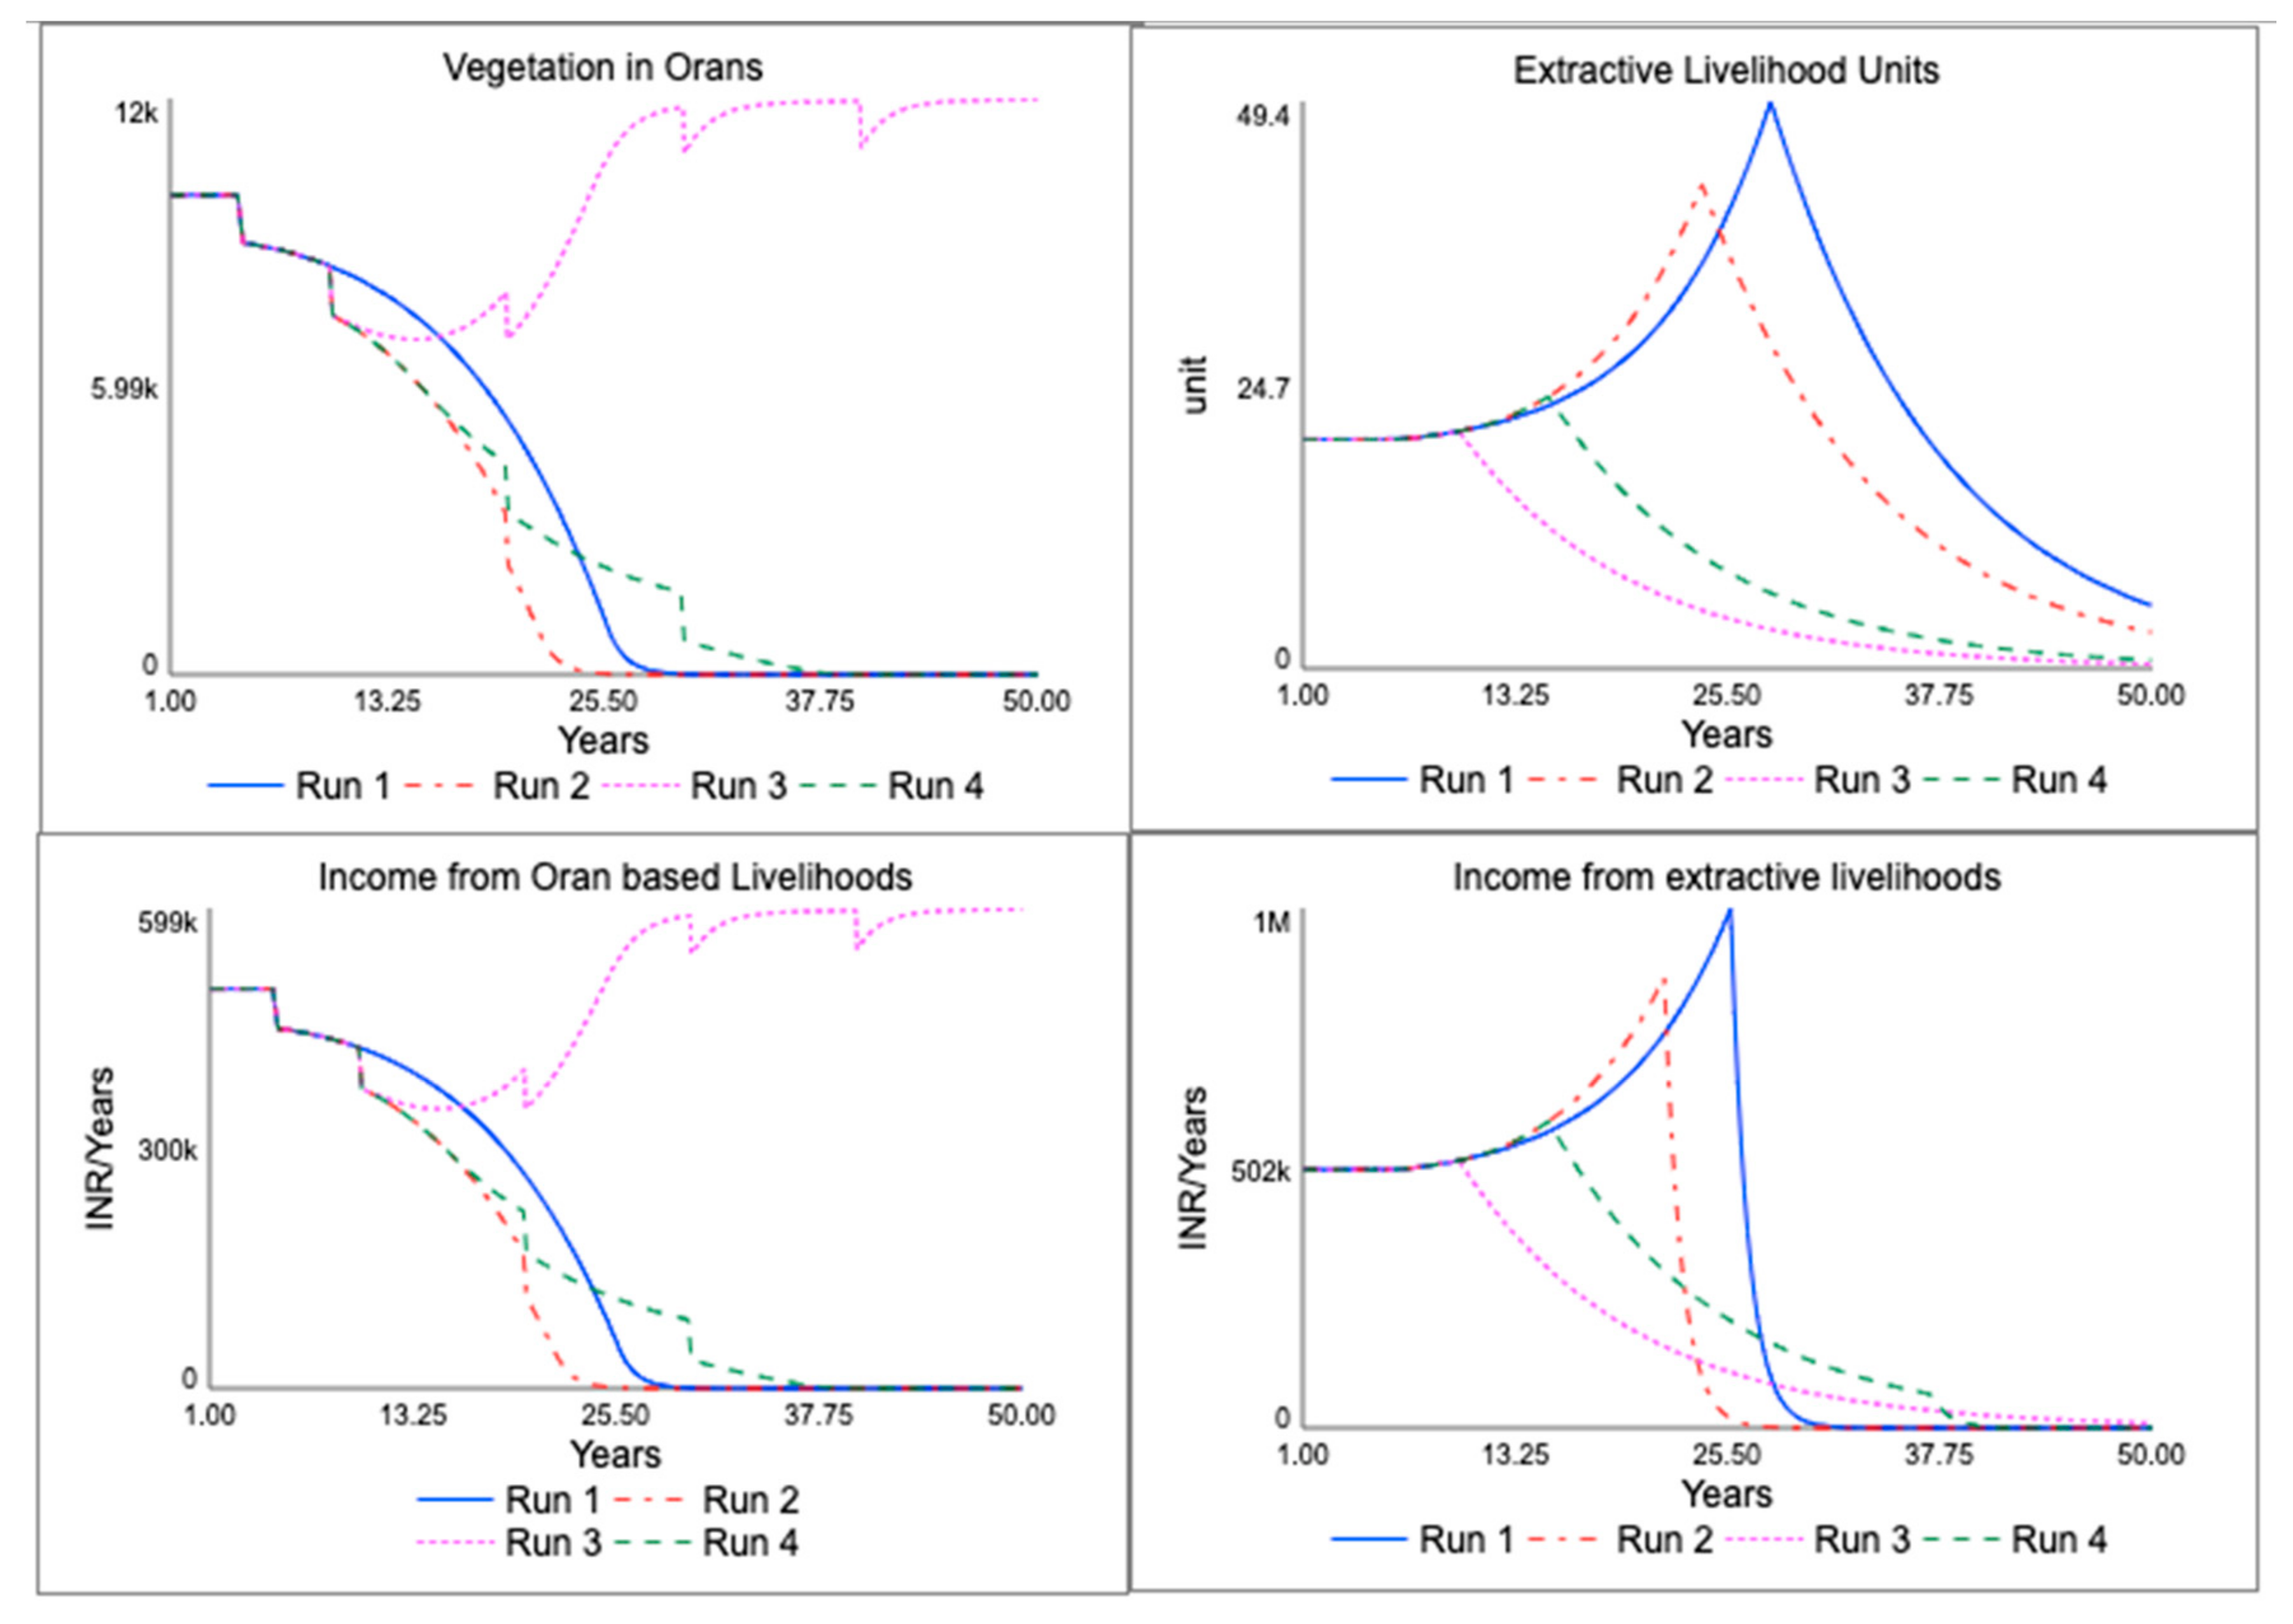
Scenario runs using the concept model were developed and are presented below. Four runs are presented—Base Run, Climate Change-Induced Climate Extremes and Maladaptation, Proactive Adaptation and Delayed Policy Change.

4.6. Scenario Runs

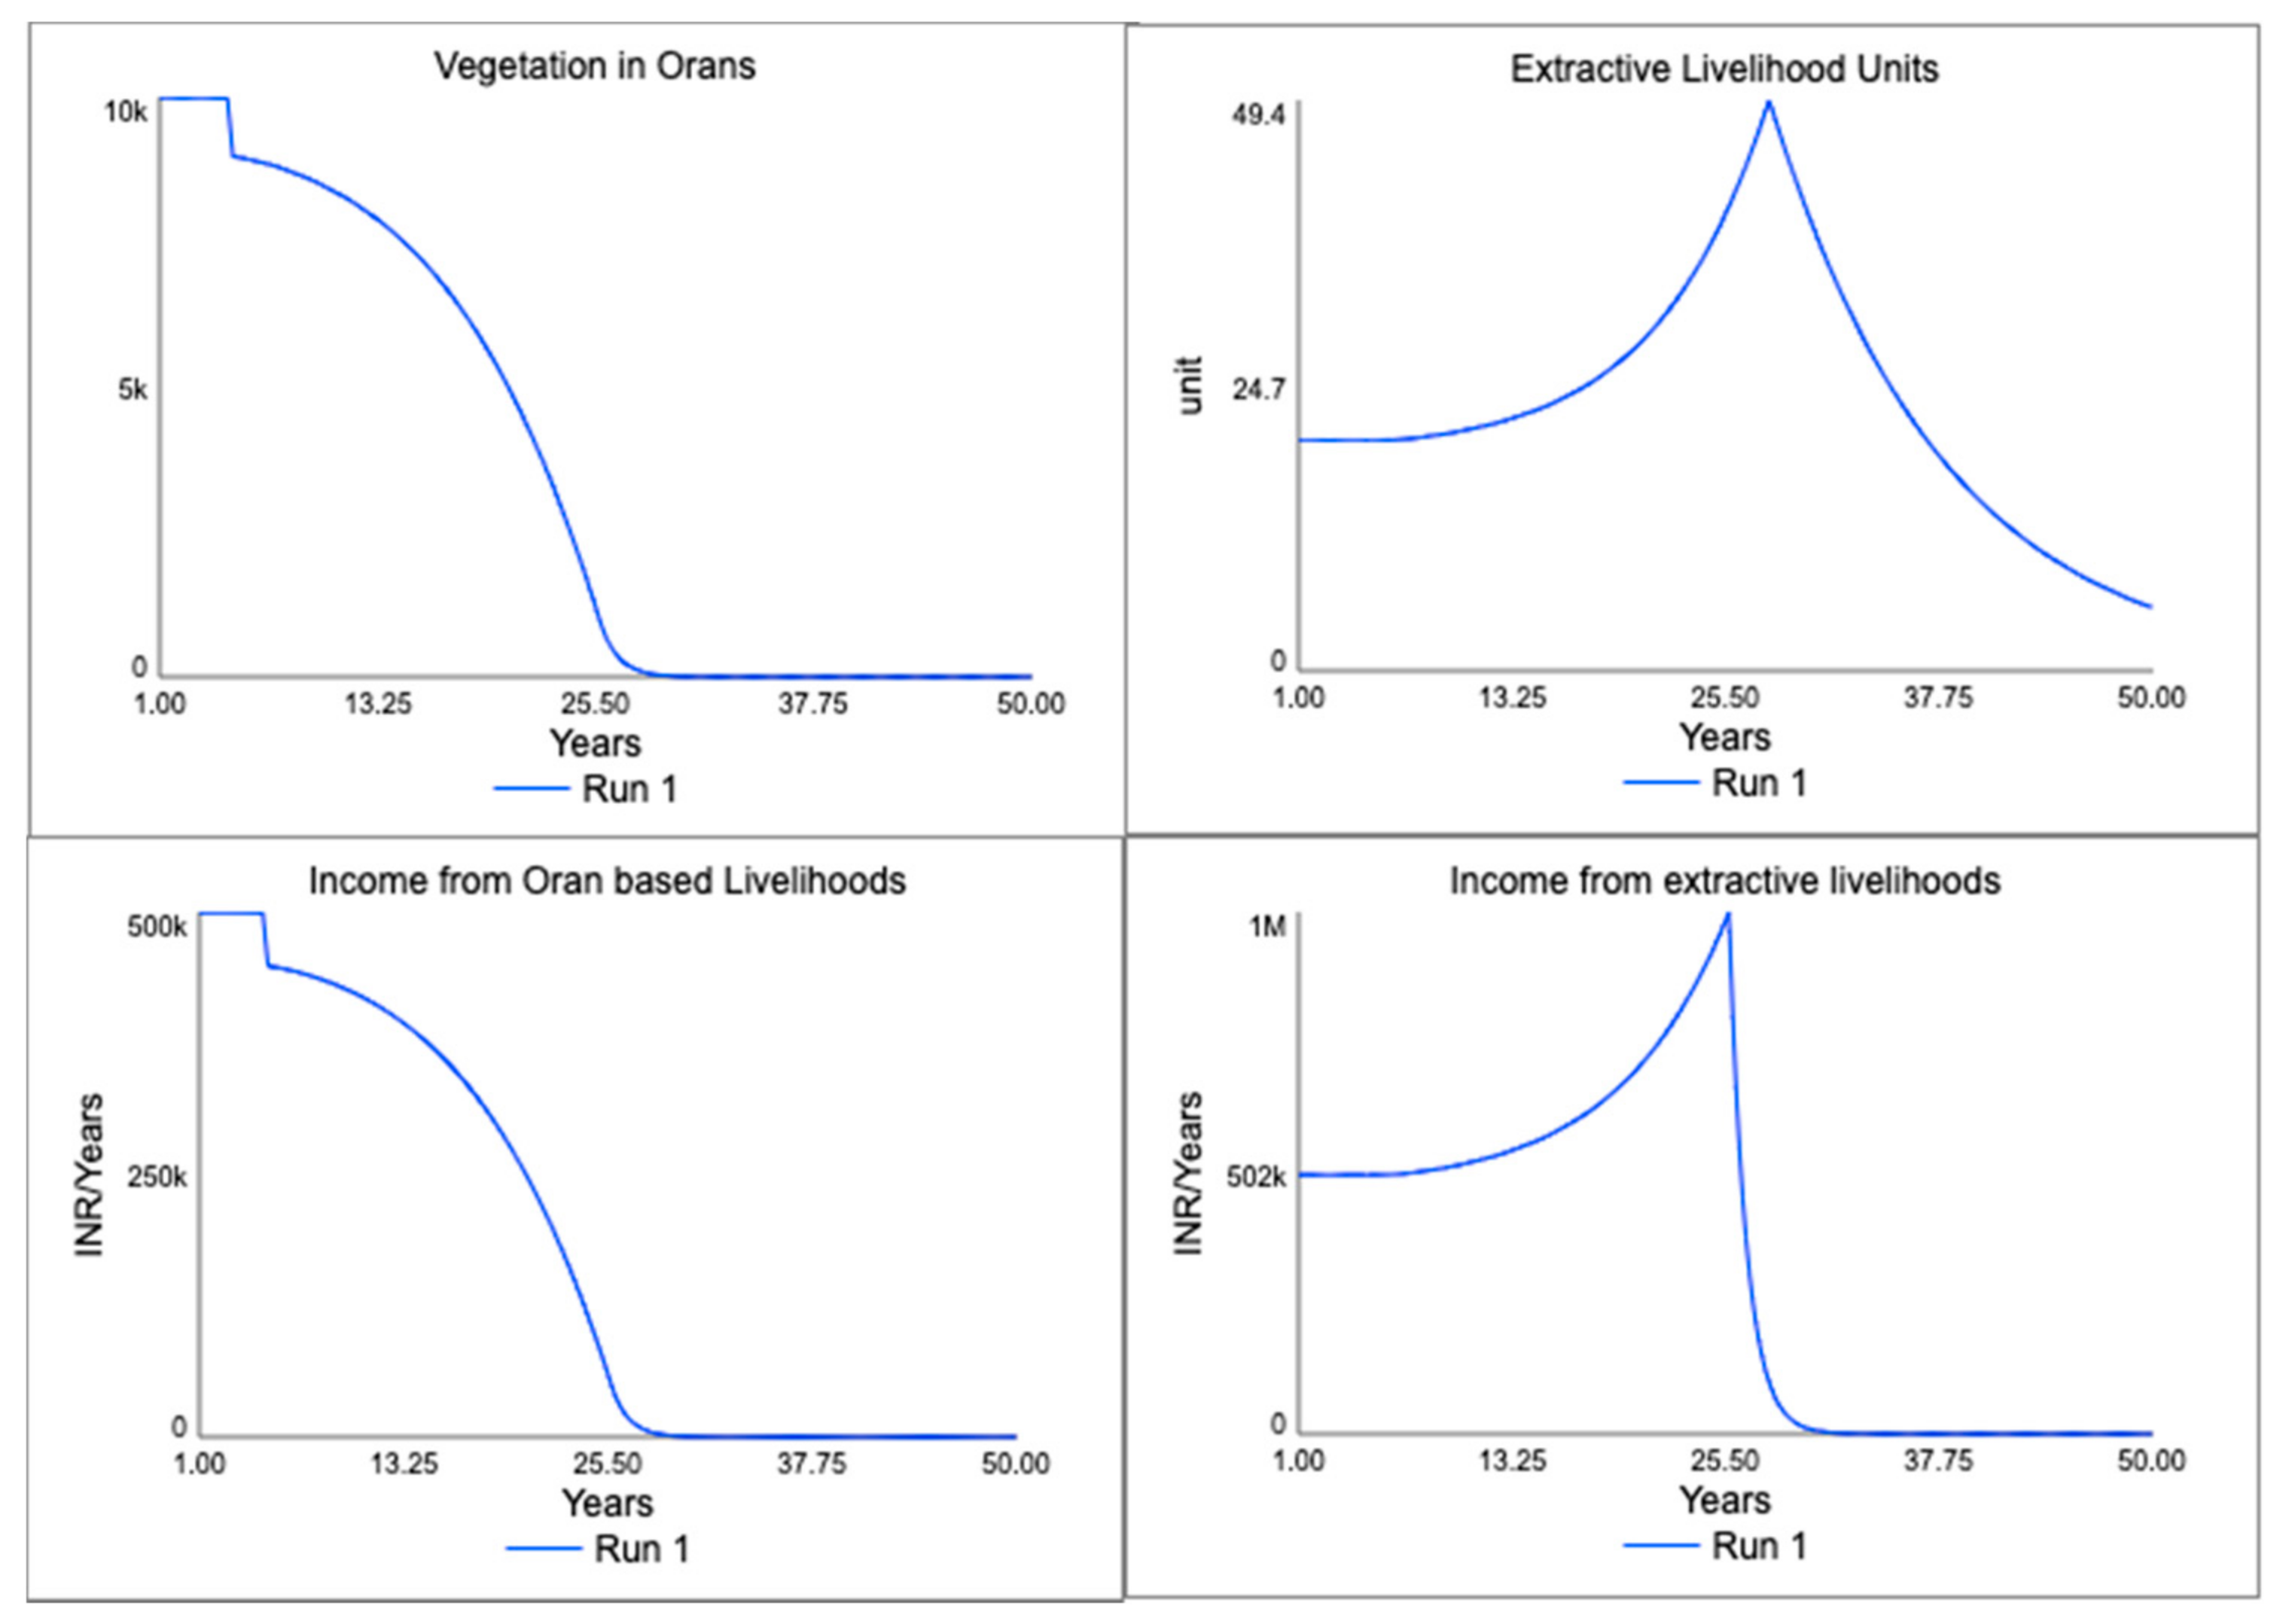
4.6.1. Run 1: Base Run

As mentioned above, since the model was calibrated so as to reach equilibrium, all the graphs below in Figure 12 begin in equilibrium. Then, a one-time settlement/encroachment event brings down the vegetation (5 years post the run start) and this triggers the model’s endogenous dynamics. This was done to mimic the real-life case on the ground at some places where Orans are depleting because of encroachment/settlements. This then reduces the ecosystem service provisioning of Orans, bringing down the income from Orans. The runs are shown in Figure 12.
As can be seen, while the model begins in equilibrium, the change in dynamics implies that Oran-based livelihoods begin to decline over time and extractive livelihoods begin to grow as Orans begin to decline. As per the success-to-the-successful archetype discussed earlier, the reinforcing loops R1, R2 and R3 start to play out and a significant shift in livelihoods is evident over time—as the Orans deplete, the Oran-based livelihoods provide fewer and fewer returns, also resulting in people (especially new generations) not seeing any motivation to pursue conservation and the extractive livelihoods growing exponentially for many years. However, when the Orans are depleted beyond the level at which they can provide resources, the extractive units also undergo a contraction. Furthermore, as is evident from the income graphs, both the forms of income—from Orans and from industries—suffer a collapse. This is because, ultimately, both the livelihoods are dependent on the Orans (albeit in different ways), and the level of the ultimate resource, the Orans, depleting, implies an ultimate reduction in both livelihoods.
Although this is just a concept model and does not depict any specific case, many Orans are currently facing a plight such as seen here, although the situation may not have reached the domain of collapse yet. It may still be in the early-to-mid stages, where extractive livelihoods are growing and the Orans are depleting [25].

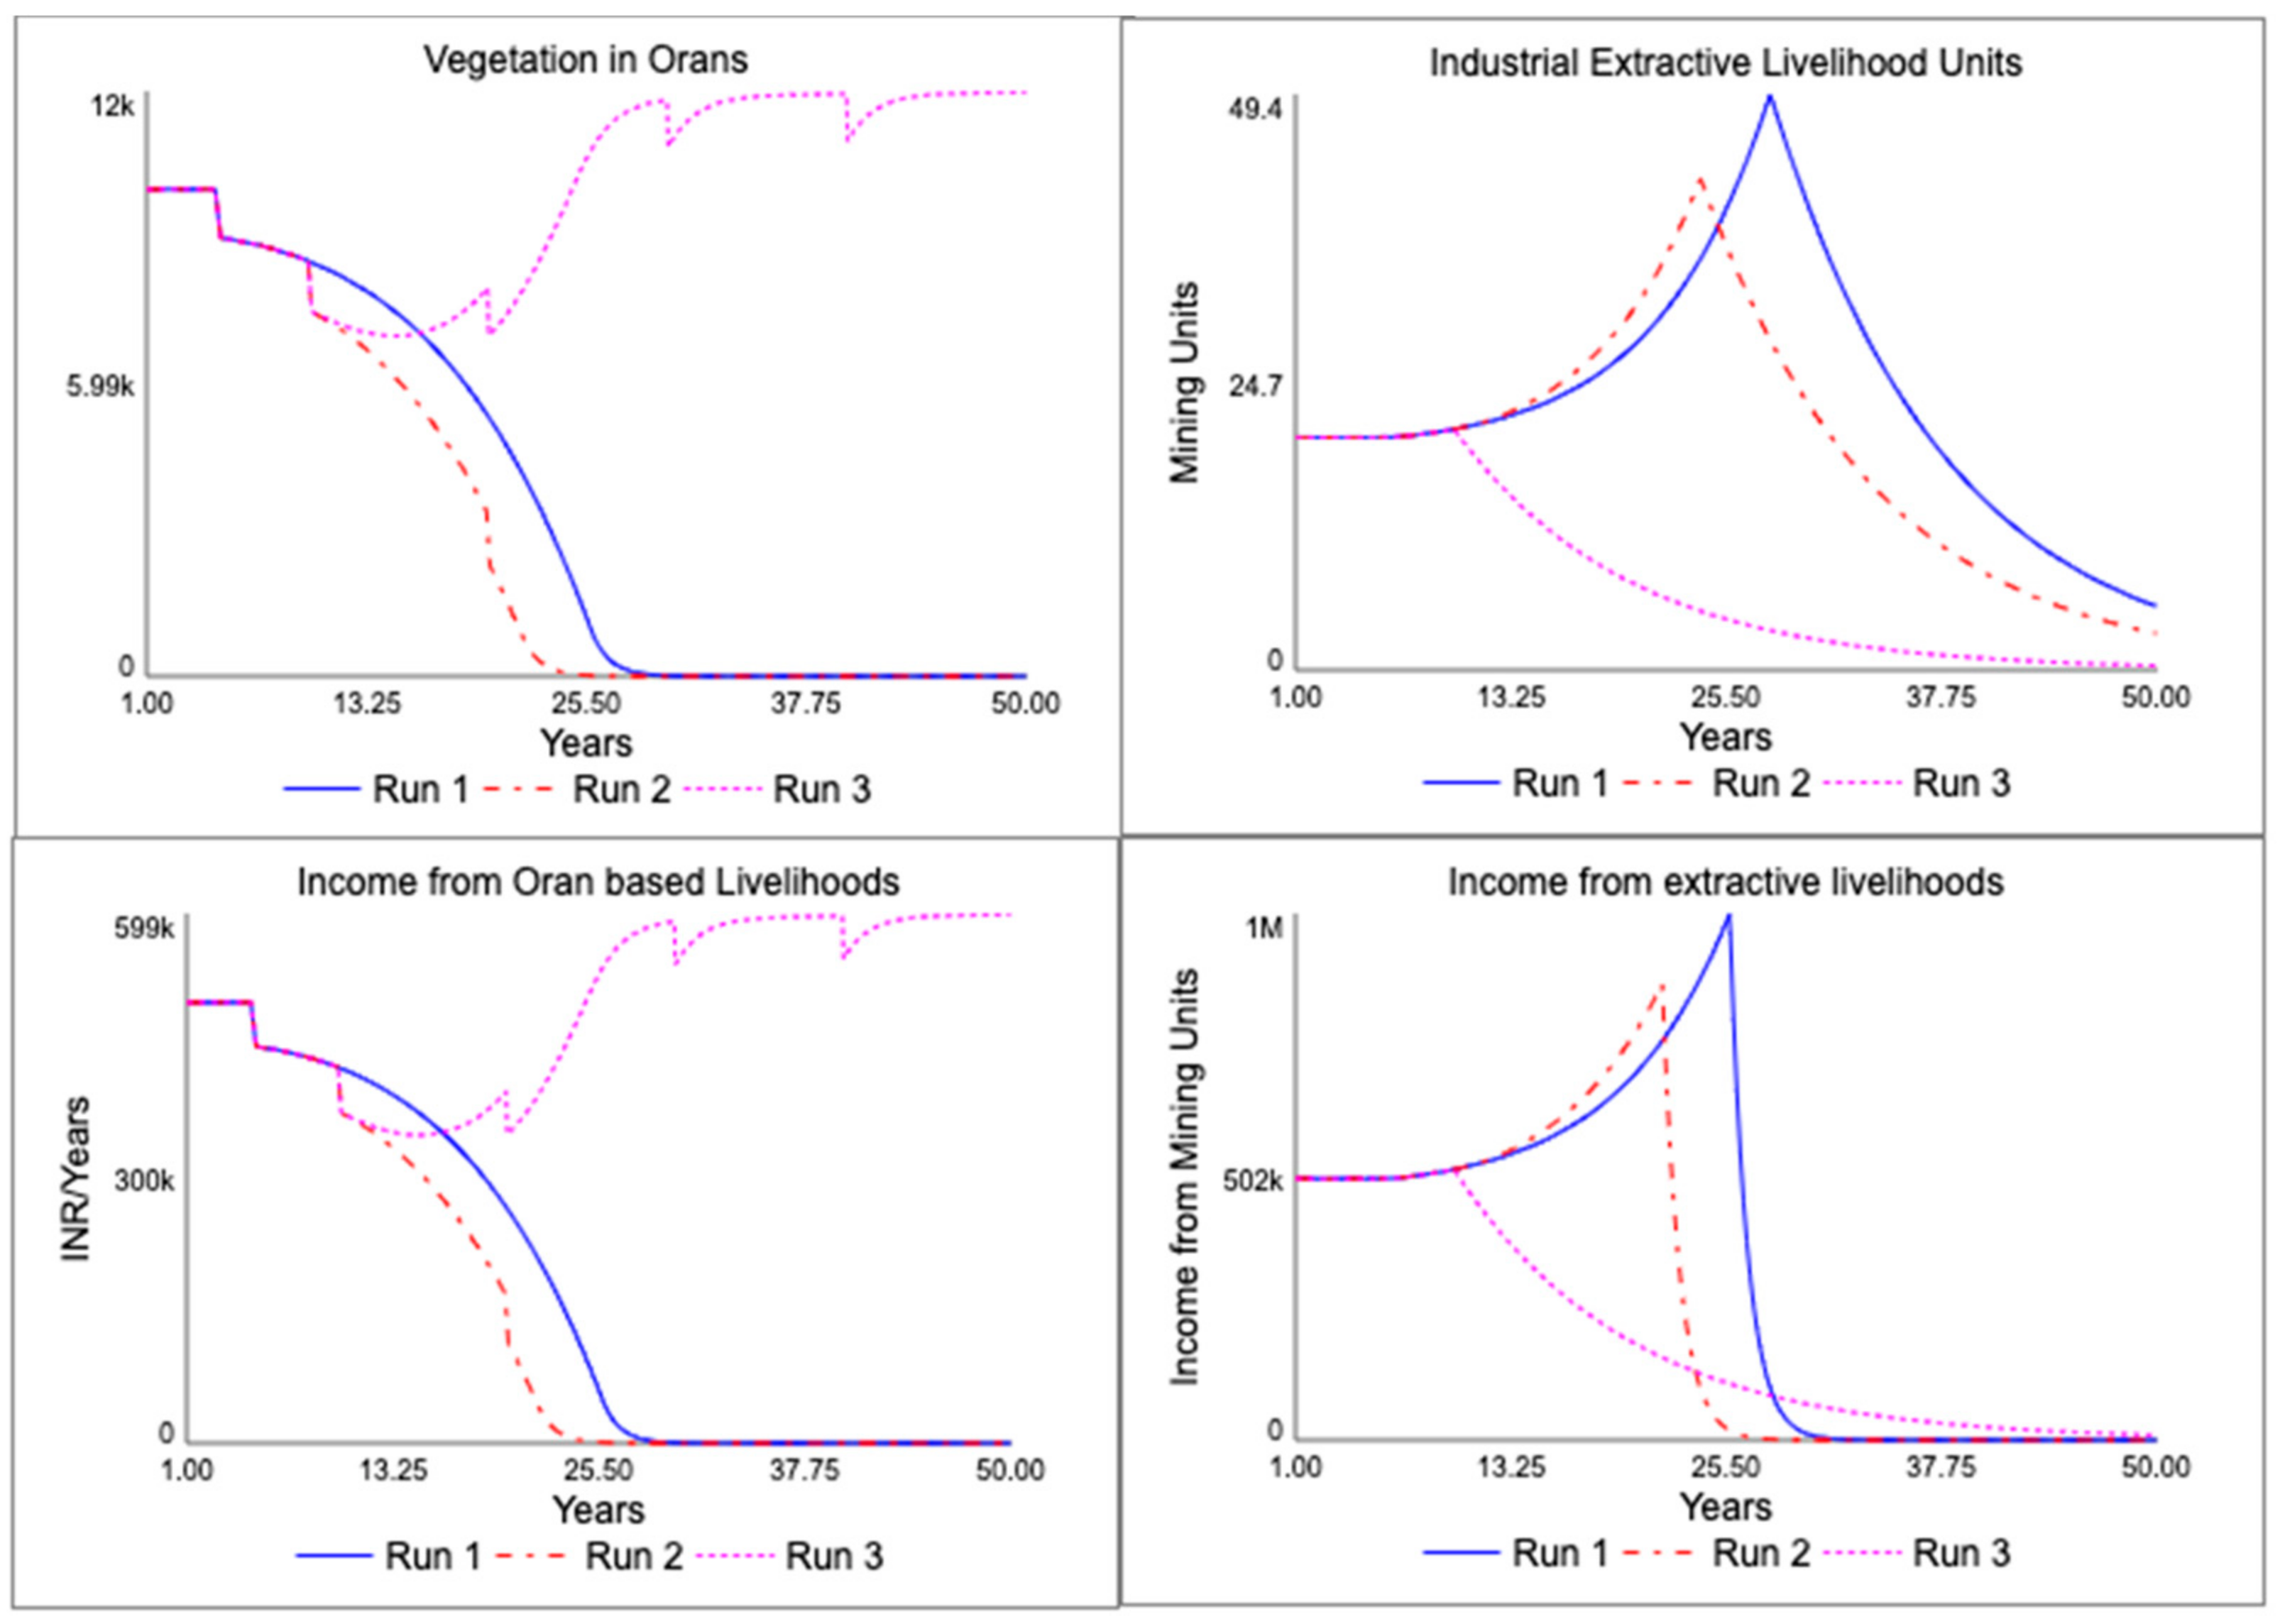
4.6.2. Run 2: Climate Extreme Impacts

What-if scenario: Climate extreme events (such as flash floods or extreme droughts) occur every 10 years and impact the Orans by depleting a significant portion of the vegetation at once.
In this scenario, the system described above also sees the impact of climatic events every 10 years—where an extreme climatic event denudes the Oran of a large part of its vegetation. In this case, the depletion of Orans (and growth of extractive units) is already underway when the climate event strikes first and, as can be seen from Figure 13 (run 2), it implies that a large loss in vegetation happens at once. As Orans deplete, the impacts on Oran-based livelihoods are more evidently and immediately felt (as explained earlier), and people move away from Oran-based livelihoods and towards extractive livelihoods (R2) while not engaging in conservation either (R1). This is further exacerbated by subsequent extremes. What this means, is that the extractive livelihoods actually grow faster than before, as seen in Figure 13. What this also means, is that the depletion of the Orans also takes place earlier, resulting in the collapse being advanced in time. This is the case of climate and non-climate stressors on Orans coupling together, as mentioned earlier in the text. It also shows maladaptation, as mentioned earlier: people respond to the deteriorating environment (due to climate change) by taking actions (moving towards extractive forms of livelihoods) which further deplete the environment in order to cope. The base case is also shown for comparison (run 1).

4.6.3. Run 3: Proactive Adaptation

What-if scenario: People are proactive in collectively realizing the value of Orans and engage in their conservation and rejuvenation.
In this scenario, the events described in scenario 2 play out; however, people collectively realize the unique value of Oran-based livelihoods being non-extractive, resulting in conservation of Orans and ultimately being more sustainable and more resilient to the impact of climate change, as they result in conservation of the resource base. In this scenario, this realization sets in when people see that their Orans have depleted below a threshold (set at 80% of initial value) and decide to stop new extractive units from entering. This could be imagined as being effectuated either through some form of community-based governance, utilizing local governance institutions, or through legislations protecting the Orans or some such means. This may be seen to be a form of proactive adaptation to the anticipated impacts of climate change.
In this case, shown in Figure 14 (run 3), what we see is that vegetation in Orans is able to revive even after the first climate event and also after each subsequent event, and income from Orans rises towards its maximum value. The conservation loop R3 also picks up strength once the ratio of incomes tilts in its favor (after the extractive units phase out). Furthermore, the vegetation and Oran-based livelihoods are able to return to the maximum values (carrying capacity) after each subsequent shock, showing a degree of resilience. The extractive units close over time (no new units entering) and income from that source decreases. We see that the system tends to move towards a long-term steady state with maintenance of a dynamic equilibrium of vegetation and income from Orans. The previous two runs are also shown for comparison (run 1 and run 2).

4.6.4. Run 4: Delayed Response

What-if scenario: People are reactive and thus late to collectively realize the value of Orans and engage in its conservation and rejuvenation. They respond after Orans have been depleted to a greater extent.
In this scenario, the people do not arrive at a consensus about the importance of conserving Orans early on, as in the previous scenario, but only later when the Orans are at 60% depletion. In this case, as seen in Figure 15 (run 4), the Orans are unable to revive to the level seen earlier. In this case, the Oran-based livelihoods are depleted too far before the change, and people in the system are earning far more from extractive livelihoods by that time so that, even with closing gates to new extractive units, people still continue to gain more income from the existing extractive units, and this reduces the effectiveness of the policy. There is greater inertia in the system, due to the dependency on extractive livelihoods, that has developed over time, and thus the motivation to conserve Orans (governed by the ratio of incomes) is still not at the level seen in scenario 3, and the regeneration efforts are unable to pick up to a large extent. Although the value of the threshold below which the system will show this behavior rather than the previous one will vary depending on actual information and data from Oran to Oran and, more generally, one renewable resource to another, this scenario highlights the importance of timely action, thresholds, collective action and consensus building.

4.6.5. Overall Findings from the Simulation Runs

The findings from the runs are summarized below:
  • There could be more than one pathway for depletion of Orans:
    • Loss of income from Oran-based livelihoods weakening the livelihood–conservation loop and shifting the dominance towards extractive, unit-based livelihoods;
    • Increase in income from extractive, unit-based livelihoods strengthening and shifting the dominance towards extractive, unit-based livelihoods;
    • Climate events that could lead to reduction in income from Oran-based livelihoods (faster), weakening the livelihood loop and shifting the dominance towards extractive, unit-based livelihoods;
  • Maladaptation and resource degradation: Climate impacts can provide fertile ground for exploitative livelihoods and practices in the form of coping (maladaptation), and the likelihood of maladaptation is high in case of weakened/degraded resource systems;
  • Sustainable livelihoods and climate resilience: Strengthening sustainable livelihoods which conserve their resource base over time could be an important form of proactive adaptation (EbA) to climate change;
  • Importance of timely action and proactive adaptation: The importance of consensus building and timely action in face of climate change is highlighted by the difference in the outcomes seen between scenario 3 and 4;
  • Boundaries of models and of mental models: The key driver of decision making in the model is income and income-based attractiveness, while other social and ecological values are not considered. If these factors are taken into account, then it could add elasticity or resilience to the shift in loop dominance. This also raises a discussion point regarding conservation. Orans have been conserved for two reasons, historically—livelihoods as well as the love, respect and/or fear of god (Orans being a form of sacred grove/space). Thus, the runs can be interpreted to hint at the importance of non-monetary incentives to preserve Orans (which are more difficult to challenge by external exploitative drivers). This is ultimately a question of what is included and excluded in the model boundary and in the boundary of mental models of people.
Overall, through this discussion we have demonstrated how a concept model can be built from a feedback map and how carrying out simulation policy experiments can yield interesting and important insights into the nature of the system. We have shown how, while not claiming to be empirical, the concept model is able to recreate patterns seen in the real world, such as the base run showing accelerating collapse based on the underlying structure of the system, as captured by the feedback maps. We have also shown how the impacts of possible climate change-induced climate extremes can be simulated and understood better through the model. Furthermore, we have shown possible scenarios of how responses to climate extremes might pan out and how different the outcomes could be, based on the nature of response and the speed with which decisive action is taken (or not). A concept model based on feedback maps made along with people who have a good understanding of the system can thus be a powerful means of exploring future scenarios and thinking about pathways towards systemic change.

5. Conclusions

Enhancing climate actions requires three things:
  • Improved awareness about the climate linkages of our own actions;
  • Identifying ways of countering maladaptation and enhancing proactive adaptation and mitigation;
  • Collaborative networks for leveraging collective capacities.
These steps require social, technological, economic and ecological resources. No one resource is a silver bullet or is ‘the’ leverage point. It calls for a sharing of learning, ideas and methods that can help us know our own impacts on climate and then reflect on them together. Given that the entire social–ecological system is impacted even if an intervention is only done in one part of the system, we need to endogenize climate into our way of living and working and break the artificial boundaries created between development, environment and climate. This can happen only when the interlinkages between them are understood and taken into consideration during the decision-making processes and intervention design.
As demonstrated, systems thinking can be a helpful tool for articulating these interlinkages in an explicitly clear manner and provide an opportunity to people to enhance their climate action. Additionally, small system dynamics models which help to test, refine and iterate policy decisions and theories-in-use are essential to complete the loop and provide the essential ‘closed-loop learning’ needed to tackle climate change, as mentioned in the introduction section. Going forward, participants from such workshops should be exposed to the additional insights that these simulation models provide. Further development of these models can provide operational guidelines and pathways on how to enhance climate action which go beyond just identifying climate adjacencies.
This work has potentially useful implications and insights for academics as well as practitioners working on climate change or development-related projects. Academics working on social–ecological systems and climate change may find that this work demonstrates a way of making sense of causal narratives around these topics and deriving insights from them through systems thinking. Furthermore, the act of developing concept models from feedback maps and testing the validity and contingencies insights given by the feedback maps may also be of interest. As mentioned earlier, it fills a gap in the literature by being the first such effort focused on applying participatory systems thinking to document climate adjacencies of non-climate-focused projects. Practitioners might find this way of eliciting and understanding information useful and complementary to traditional approaches, as it helps synthesize various socio-political, economic and ecological threads seen in real-world systems. The act of developing such models with people can be a useful way to engage with communities and policymakers in a joint dialogue on possible shared futures and how they might be shaped. Furthermore, this work highlights how climate and development must not be seen as separate or conflicting goals and that non-climate-focused projects can have strong climate adjacencies. The two should thus be seen as related goals, and pathways that enhance both in conjunction should be sought.

Supplementary Materials

The following are available online at https://www.mdpi.com/article/10.3390/systems9040083/s1, The concept model STELLA file and a document containing brief documentation of model equations, parameter values and the mitigation/adaptation matrices used in the participatory workshop are attached.

Author Contributions

K.S. and M.M. contributed equally. All authors have read and agreed to the published version of the manuscript.

Funding

This research was funded by Rohini Nilekani Philanthropies.

Data Availability Statement

Not applicable.

Acknowledgments

The authors would like to thank all the organizations with which the case studies on identifying climate adjacency were carried out. These are Sahjeevan and the Centre for Pastoralism, Kalpavriksh, KRAPAVIS and the Nature Conservation Foundation (NCF). However, the analysis and interpretation presented in the paper is solely of the authors.

Conflicts of Interest

The authors declare no conflict of interest.

References

  1. IPCC. Summary for Policymakers. In Climate Change 2021: The Physical Science Basis. Contribution of Working Group I to the Sixth Assessment Report of the Intergovernmental Panel on Climate Change; Masson-Delmotte, V., Zhai, P., Pirani, A., Connors, S.L., Péan, C., Berger, S., Caud, N., Chen, Y., Goldfarb, L., Gomis, M.I., et al., Eds.; IPCC: Geneva, Switzerland, 2021; Available online: https://www.ipcc.ch/report/ar6/wg1/downloads/report/IPCC_AR6_WGI_SPM_final.pdf (accessed on 15 November 2021).
  2. IPCC; Fischlin, A.; Midgley, G.F.; Price, J.T.; Leemans, R.; Gopal, B.; Turley, C.; Rounsevell, M.D.A.; Dube, O.P.; Tarazona, J.; et al. 2007a: Ecosystems, their properties, goods, and services. Climate Change 2007: Impacts, Adaptation and Vulnerability. In Contribution of Working Group II to the Fourth Assessment Report of the Intergovernmental Panel on Climate Change; Parry, M.L., Canziani, O.F., Palutikof, J.P., van der Linden, P.J., Hanson, C.E., Eds.; IPCC: Geneva, Switzerland, 2007; pp. 211–272. [Google Scholar]
  3. IPCC; Adger, W.N.; Agrawala, S.; Mirza, M.M.Q.; Conde, C.; O’Brien, K.; Pulhin, J.; Pulwarty, R.; Smit, B.; Takahashi, K. 2007b: Assessment of adaptation practices, options, constraints and capacity. Climate Change 2007: Impacts, Adaptation and Vulnerability. In Contribution of Working Group II to the Fourth Assessment Report of the Intergovernmental Panel on Climate Change; Parry, M.L., Canziani, O.F., Palutikof, J.P., van der Linden, P.J., Hanson, C.E., Eds.; IPCC: Geneva, Switzerland, 2007; pp. 717–743. [Google Scholar]
  4. IPCC. Climate Change: The IPCC 1990 and 1992 Assessments. Policymaker Summary of Working Group III. Intergovernmental Panel on Climate Change IPCC. Printed in Canada. 1992. Available online: https://www.ipcc.ch/report/climate-change-the-ipcc-1990-and-1992-assessments/ (accessed on 15 November 2021).
  5. UNFCCC. Available online: https://unfccc.int/topics/adaptation-and-resilience/the-big-picture/what-do-adaptation-to-climate-change-and-climate-resilience-mean (accessed on 30 August 2021).
  6. Rooney-Varga, J.N.; Sterman, J.D.; Fracassi, E.; Franck, T.; Kapmeier, F.; Kurker, V.; Johnston, E.; Jones, A.P.; Rath, K. Combining role-play with interactive simulation to motivate informed climate action: Evidence from the World Climate simulation. PLoS ONE 2018, 13, e0202877. [Google Scholar] [CrossRef] [PubMed]
  7. The Royal Town Planning Institute. Place-Based Approaches to Climate Change. 2021. Available online: https://www.rtpi.org.uk/research/2021/march/place-based-approaches-to-climate-change/ (accessed on 15 November 2021).
  8. Sterman, J.D.; Fiddaman, T.; Franck, T.; Jones, A.; McCauley, S.; Rice, P.; Sawin, E.; Siegel, L. Management Flight Simulators to Support Climate Negotiations. Environ. Model. Softw. 2013, 44, 122–135. [Google Scholar] [CrossRef]
  9. Langsdale, S.M.; Beall, A.; Carmichael, J.; Cohen, S.J.; Forster, C.B.; Neale, T. Exploring the Implications of Climate Change on Water Resources through Participatory Modeling: Case Study of the Okanagan Basin, British Columbia. J. Water Resour. Plan. Manag. 2009, 135, 373–381. [Google Scholar] [CrossRef]
  10. DESTA Research LLP. Banni in a Time of Change: Interactive Simulations for Systemic Engagement; DESTA Research LLP: New Delhi, India, 2021; Available online: https://www.desta.co.in/wp-content/uploads/2021/07/Brief-on-Banni-App-1.pdf (accessed on 15 November 2021).
  11. Carnohan, S.A.; Clifford-Holmes, J.K.; Retief, H.; McKnight, U.S.; Pollard, S. Climate change adaptation in rural South Africa: Using stakeholder narratives to build system dynamics models in data-scarce environments. J. Simul. 2021, 15, 5–22. [Google Scholar] [CrossRef]
  12. Mathur, M.; Sharma, K. Identifying Climate Adjacency: Key Findings from Four Case Studies and a Synthesis, Report by DESTA Research & Rohini Nilekani Philanthropies, India, January 2021. Available online: https://rohininilekani.org/identifying-climate-adjacency-key-findings-from-four-case-studies-and-a-synthesis/ (accessed on 15 November 2021).
  13. Sterman, J. Business Dynamics: Systems Thinking and Modeling for a Complex World; Sterman, J.D., Ed.; McGraw-Hill Higher Education: New York, NY, USA, 2000; ISBN 0-07-231135-5. [Google Scholar]
  14. Ford, A. Modeling the Environment, 2nd ed.; Island Press: Washington, DC, USA, 2010. [Google Scholar]
  15. Bharwada, C.; Mahajan, V. Let it be Banni: Understanding and Sustaining Pastoral Livelihoods of Banni. In CESS Monograph; CESS: Hyderabad, India, 2012. [Google Scholar]
  16. Overseas Development Institute. Pastoralism and Climate Change: Synthesis Paper. 2009. Available online: https://cdn.odi.org/media/documents/4317.pdf (accessed on 15 November 2021).
  17. Rahman, A.P. Swimming Camels, Mangrove Islands of Kutch Face mounting Challenges. Mongabay. 2019. Available online: https://india.mongabay.com/2019/01/swimming-camels-mangrove-islands-of-kutch-face-mounting-challenges/ (accessed on 15 November 2021).
  18. Agarwal, M. NGT Comes to the Aid of Kharai Camels and Mangroves in Kachchh. Mongabay. Available online: https://india.mongabay.com/2019/09/ngt-comes-to-the-aid-of-kharai-camels-and-mangroves-in-kachchh/ (accessed on 15 November 2021).
  19. Kibria, G. Mangrove Forests-Its Role in Livelihoods, Carbon Sinks and Disaster Mitigation. 2013. Available online: https://www.researchgate.net/publication/261178318_Mangrove_Forests-_Its_Role_in_Livelihoods_Carbon_Sinks_and_Disaster_Mitigation?channel=doi&linkId=004635337e178644a8000000&showFulltext=true (accessed on 15 November 2021).
  20. Chapman, S. Mangroves Protect Coastlines, Store Carbon–And Are Expanding with Climate Change. The Conversation. Available online: https://theconversation.com/mangroves-protect-coastlines-store-carbon-and-are-expanding-with-climate-change-81445 (accessed on 15 November 2021).
  21. Systems Archetypes I: Diagnosing Systemic Issues and Designing High-Leverage Interventions by Daniel H. Kim. The Systems Thinker. Available online: https://thesystemsthinker.com/wp-content/uploads/2016/03/Systems-Archetypes-I-TRSA01_pk.pdf (accessed on 15 November 2021).
  22. Chhingani, A.K. History of Common Property Resources in the Thar Desert. MGS University, Bikaner. 2020. Available online: https://mgsubikaner.ac.in/wp-content/uploads/2020/10/Common-Property-Resources-in-the-Thar-Desert.pdf (accessed on 15 November 2021).
  23. Gadi, B.R. Oran: A Traditional System for Conservation of biodiversity in the Thar Desert. Int. Educ. Res. J. 2016, 2, 34–35. [Google Scholar]
  24. Singh, A.; Bahl, R. Oran Land Issues: A Livelihood Concern for Pastoralists in Rajasthan (31 December 2006). Available online: https://ssrn.com/abstract=981506 (accessed on 15 November 2021).
  25. Singh, A. ‘Oran’ Sustainable Livelihood & Biodiversity Conservation System in Rajasthan. KRAPAVIS. Available online: https://www.google.com/url?sa=t&rct=j&q=&esrc=s&source=web&cd=&ved=2ahUKEwjngvTNnd3yAhUijOYKHUwOC5gQFnoECAIQAQ&url=https%3A%2F%2Fwww.globalgiving.org%2Fpfil%2F1116%2Fprojdoc.doc&usg=AOvVaw21B8-UHMlyFSf8spJSX_e- (accessed on 15 November 2021).
  26. Krishna, N. Orans of Rajasthan. Heritage Online. Available online: http://www.heritageonline.in/natural-heritage-discussion-3/ (accessed on 15 November 2021).
  27. Colls, A.; Ash, N.; Ikkala, N. Ecosystem-Based Adaptation: A Natural Response to Climate Change; IUCN: Gland, Switzerland, 2009; p. 16. [Google Scholar]
  28. Osuri, A.M.; Gopal, A.; Shankar Raman, T.R.; Defries, R.; Cook-Patton, S.C.; Naeem, S. Greater stability of carbon capture in species-rich natural forests compared to species-poor plantations. Environ. Res. Lett. 2019, 15, 034011. Available online: https://iopscience.iop.org/article/10.1088/1748-9326/ab5f75 (accessed on 15 November 2021).
  29. Richardson, G.P. Problems with causal-loop diagrams. Syst. Dyn. Rev. 1986, 2, 158–170. [Google Scholar] [CrossRef]
  30. Richardson, G.P. Problems with causal-loop diagrams revisited. Syst. Dyn. Rev. 1997, 13, 247–252. [Google Scholar] [CrossRef]
  31. Fiddaman, T. Meta SD, Loopy. 2017. Available online: https://metasd.com/2017/03/loopy/ (accessed on 15 November 2021).
  32. Saeed, K. Representing feedback in a computable stock/flow model. In Proceedings of the International System Dynamics Conference, Chicago, IL, USA, 25–29 July 2021. [Google Scholar]
  33. Fiddaman, T. Meta SD, The Ambiguity of Causal Loop Diagrams and Archetypes. 2017. Available online: https://metasd.com/2017/04/the-ambiguity-of-causal-loop-diagrams-and-archetypes/ (accessed on 15 November 2021).
  34. Chichakly, K.J.; (Isee Systems Inc., Lebanon, NH, USA). Personal Communication at International System Dynamics Conference, 2021.
  35. Ghaffarzadegan, N.; Lyneis, J.; Richardson, G.P. How Small System Dynamics Models Can Help the Public Policy Process. Syst. Dyn. Rev. 2010, 27, 22–44. [Google Scholar] [CrossRef] [Green Version]
  36. Homer, J. How to Right-Size Your Model. 2019. Available online: https://systemdynamics.org/how-to-right-size-your-model/ (accessed on 31 August 2021).
  37. Repenning, N.P. Selling system dynamics to (other) social scientists. Syst. Dyn. Rev. 2003, 19, 303–327. [Google Scholar] [CrossRef]
  38. Kim, D. Success to the Successful: Self-Fulfilling Prophecies. The Systems Thinker. Available online: https://thesystemsthinker.com/success-to-the-successful-self-fulfilling-prophecies/ (accessed on 15 November 2021).
1
Where the community, either collectively or individually, or any other agency uses ecosystem services for their living and/or livelihood in a manner that does not conserve the ecosystem’s ability to continue to provide such services.
2
Where the community, either collectively or individually, or any other agency uses local ecosystem services for their living and/or livelihood in a manner that conserves the ecosystem’s ability to continue to provide such services, also referred to as ‘nature-based solutions’.
Figure 1. Process contextualized through the iceberg model. Credit for iceberg image: https://donellameadows.org/systems-thinking-resources/ (accessed on 12 November 2021).
Systems 09 00083 g001
Figure 2. Impact of dairy on sedentarization of pastoralists in Banni grasslands.
Systems 09 00083 g002
Figure 3. Linkages between mangroves, camels, livelihoods and climate.
Systems 09 00083 g003
Figure 4. Adaptation–mitigation linkages in context of plantations.
Systems 09 00083 g004
Figure 5. Escalation in the conservation discourse.
Systems 09 00083 g005
Figure 6. Livelihood–conservation loop in Orans—EbA.
Systems 09 00083 g006
Figure 7. Maladaptation in Orans.
Systems 09 00083 g007
Figure 8. Agriculture-Driven Maladaptation.
Systems 09 00083 g008
Figure 9. Wildlife–community coexistence.
Systems 09 00083 g009
Figure 10. Different livelihoods in Orans—EbA and maladaptation.
Systems 09 00083 g010
Figure 11. Stock-flow diagram of concept model showing key feedback loops.
Systems 09 00083 g011
Figure 12. Base case.
Systems 09 00083 g012
Figure 13. Impact of Climate Extremes and Maladaptation.
Systems 09 00083 g013
Figure 14. Proactive Adaptation.
Systems 09 00083 g014
Figure 15. Reactive, delayed response.
Systems 09 00083 g015
Publisher’s Note: MDPI stays neutral with regard to jurisdictional claims in published maps and institutional affiliations.

