Article

Scenario Modeling of Sustainable Development of Energy Supply in the Arctic

1
Educational Research Center for Digital Technologies, Saint Petersburg Mining University, 2 21st Line, 199106 Saint Petersburg, Russia
2
Department of Economics, Organization and Management, Saint Petersburg Mining University, 2 21st Line, 199106 Saint Petersburg, Russia
3
Department of Electrical Engineering, Saint Petersburg Mining University, 2 21st Line, 199106 Saint Petersburg, Russia
4
Department of Environmental Geology, Saint Petersburg Mining University, 2 21st Line, 199106 Saint Petersburg, Russia
*
Author to whom correspondence should be addressed.
Resources 2021, 10(12), 124; https://doi.org/10.3390/resources10120124
Submission received: 28 October 2021 / Revised: 30 November 2021 / Accepted: 2 December 2021 / Published: 7 December 2021
(This article belongs to the Special Issue Resource Provision of the Sustainable Development under Global Shocks)

Abstract

:
The 21st century is characterized not only by large-scale transformations but also by the speed with which they occur. Transformations—political, economic, social, technological, environmental, and legal-in synergy have always been a catalyst for reactions in society. The field of energy supply, like many others, is extremely susceptible to the external influence of such factors. To a large extent, this applies to remote (especially from the position of energy supply) regions. The authors outline an approach to justifying the development of the Arctic energy infrastructure through an analysis of the demand for the amount of energy consumed and energy sources, taking into account global trends. The methodology is based on scenario modeling of technological demand. It is based on a study of the specific needs of consumers, available technologies, and identified risks. The paper proposes development scenarios and presents a model that takes them into account. Modeling results show that in all scenarios, up to 50% of the energy balance in 2035 will take gas, but the role of carbon-free energy sources will increase. The mathematical model allowed forecasting the demand for energy types by certain types of consumers, which makes it possible to determine the vector of development and stimulation of certain types of resources for energy production in the Arctic. The model enables considering not only the growth but also the decline in demand for certain types of consumers under different scenarios. In addition, authors’ forecasts, through further modernization of the energy sector in the Arctic region, can contribute to the creation of prerequisites that will be stimulating and profitable for the growth of investment in sustainable energy sources to supply consumers. The scientific significance of the work lies in the application of a consistent hybrid modeling approach to forecasting demand for energy resources in the Arctic region. The results of the study are useful in drafting a scenario of regional development, taking into account the Sustainable Development Goals, as well as identifying areas of technology and energy infrastructure stimulation.

1. Introduction

A combination of external factors (political, economic, social, technological, environmental, and legal) has led to the emergence and consequently the aggravation of global challenges [1,2,3,4]. Among them are over-population and urbanization, decentralization of the world, environmental and climatic changes, increasing consumption of energy and resources. Delay in addressing these global challenges undermines the sustainability and security of the development of all mankind. Both for Russia and the whole world, the Arctic can become an answer to these challenges [5,6].
Quite a lot of research is directed towards the Arctic, this region and its features have always attracted the scientific community, much attention is paid to the social component. Recently, the region has attracted even more attention due to climate change and new opportunities, both predictable and unpredictable [7].
The Arctic zone has potential as a resource base of hydrocarbon, which is about 13 billion tons of oil and 86 trillion m3 of gas. Their development is both a driver of economic sector progress and a lifeline for the implementation of the energy transition [7]. The value of the region is supported by the status of the guarantor of national security of the country and the cultural significance of the indigenous peoples of the North [6]. Mistakes made in the development of the potential of the Arctic can turn into both an ecological catastrophe and an economic foul—the cost of wrong decisions is several times higher [8,9]. Therefore, our study develops and complements the forecasting made earlier in order to reduce the risks of making decisions on development and focus on the resources, levers, and incentives for the necessary development.
According to the analysis of scientific works in the field of forecasting quality demand due to the growth of specific consumers, it was revealed that research is aimed at obtaining energy in certain conditions and in the short term. Many researchers resort to statistical and machine learning methods. In [10], the mixed integer programming method is used, which allows determining the state and power level of all generators to maximize the profit of the gas company. In [11], a support vector machine-based simulation is applied to predict solar and wind energy resources. The study [12] proposes a typical-load-profile-supported convolutional neural network for predicting plant-level electrical load. In [13], the forecast for natural gas consumption is based on a decomposition method by combining three different components: a trend-driven time series, a seasonal component based on a linear loop model, and a transit component to estimate daily fluctuations using explanatory variables.
In the field of research devoted directly to forecasting the growth of the Arctic region and demand in the Arctic, a small amount of work has been identified. Thus, in [14], the application of statistical models and neural networks to predict energy demand for two settlements was studied. Of course, in connection with the environmental agenda, attention is paid to renewable energy sources. In work [15], using econometric modeling, the potential impact of renewable sources in the Arctic on the sustainability of the region is estimated.
Thus, no potential models have been identified that could carry out strategic forecasting according to the risks and allow allocating a relevant set of resources in accordance with consumers. In connection with the goals of achieving carbon neutrality, the demand for hydrocarbons as a source of electricity is not predicted. Demand response activities are geared towards optimizing load schedules and lowering costs but do not take into account customer characteristics and do not take a long-term perspective. In the works on forecasting the growth of demand for electricity, the regional potential is not considered in terms of the development of tourism, science, the provision of medical services, and others.
Our proposed research is based on the growth of consumers, taking into account their qualitative characteristics, taking into account the opinions of experts, taking into account the analysis of interrelationships, and building the growth of demand for power, energy, and types of energy as a single structure. This will enable early preparation of energy infrastructure and long-term assessment of the dynamics of carbon footprint and climate change while maintaining the region’s environmental sustainability and energy supply.
The study not only proposes a forecast of energy demand in various scenario conditions but also reveals the structure of this demand on the part of the consumer and the types of energy that will ensure sustainable energy supply in the Arctic.
The complex approach in the estimation of the needs of consumers of energy will allow to level gradually the naturally arising risks. It is necessary to create a solid foundation to ensure the development of resources, despite the specifics of the region. The basis for this should be infrastructure with a new logic of functioning, interaction, and sustainable development within the framework of the growing digitalization and transition to Industry 4.0.
Given the exhaustion of the continental resource base and taking into account the potential of the Arctic zone in terms of reserves, enhanced by the creation of transport and logistics hubs and the military-political aspect, the exploration, and development of the Arctic zone become a strategically important and economically beneficial step [16,17]. Hence, it is necessary to ensure the development of promising areas, maintain and modernize the existing, often outdated infrastructure, and create comfortable conditions for people to live in.
An indispensable condition for the development of the region is a reliable uninterrupted power supply to the territories, following global trends and sustainability requirements [18]. The progress in energy supply in the AZRF is determined by the global level of energy development, where a significant impact is made by the ongoing energy transition and digital transformation of energy. This is reflected in the 5D concept, which reveals the direction of current trends and tendencies and on the basis of which the analysis of current ways of possible development is carried out in Figure 1.
Digitalization changes the work of the energy system; there is a new understanding of the use of electricity, power generation, and supply, the functioning of consumers and systems for the production, transporting, distribution, and storage of energy.
Decarbonization is related to climate change and primary fuel supply, electrification, and energy conservation and brings economic, environmental as well as social benefits.
Decentralization is related to changing the growth logic of energy systems and the distribution of energy consumption trends toward a larger number of small energy and economic nodes, which stimulates innovations from energy storage to intelligent data-based control systems.
Dependence is about the increasing information and technological dependence of production, transportation, and use of different types of energy on each other [19]. Integration of electricity, gas, water, heat, cold, and collaboration with all participants of the fuel and energy complex [20].
Decrease indicated a trend to reduce consumption not only of energy but also of all kinds of resources and materials, reduction of waste, and their increasing involvement in recycling [21]. This trend is facilitated by a qualitative change in consumer behavior and new production technologies that allow customizing products [22].
In its turn, each trend corresponds to a certain set of technological tendencies in the energy supply. Considering the current tendencies in energy supply, a certain set of necessary energy resources for regional development is formed [23,24]. Thus, it is possible to estimate the need for energy resources for this or that investment project. Given the need for sustainable development of the Arctic region [25], the development of technologies in the field of renewable energy and the achievement of carbon neutrality is a priority. However, to reduce the share of traditional hydrocarbon raw materials, it is necessary to properly plan the development of energy demand and its environmental friendliness in the short term until 2035 [26].

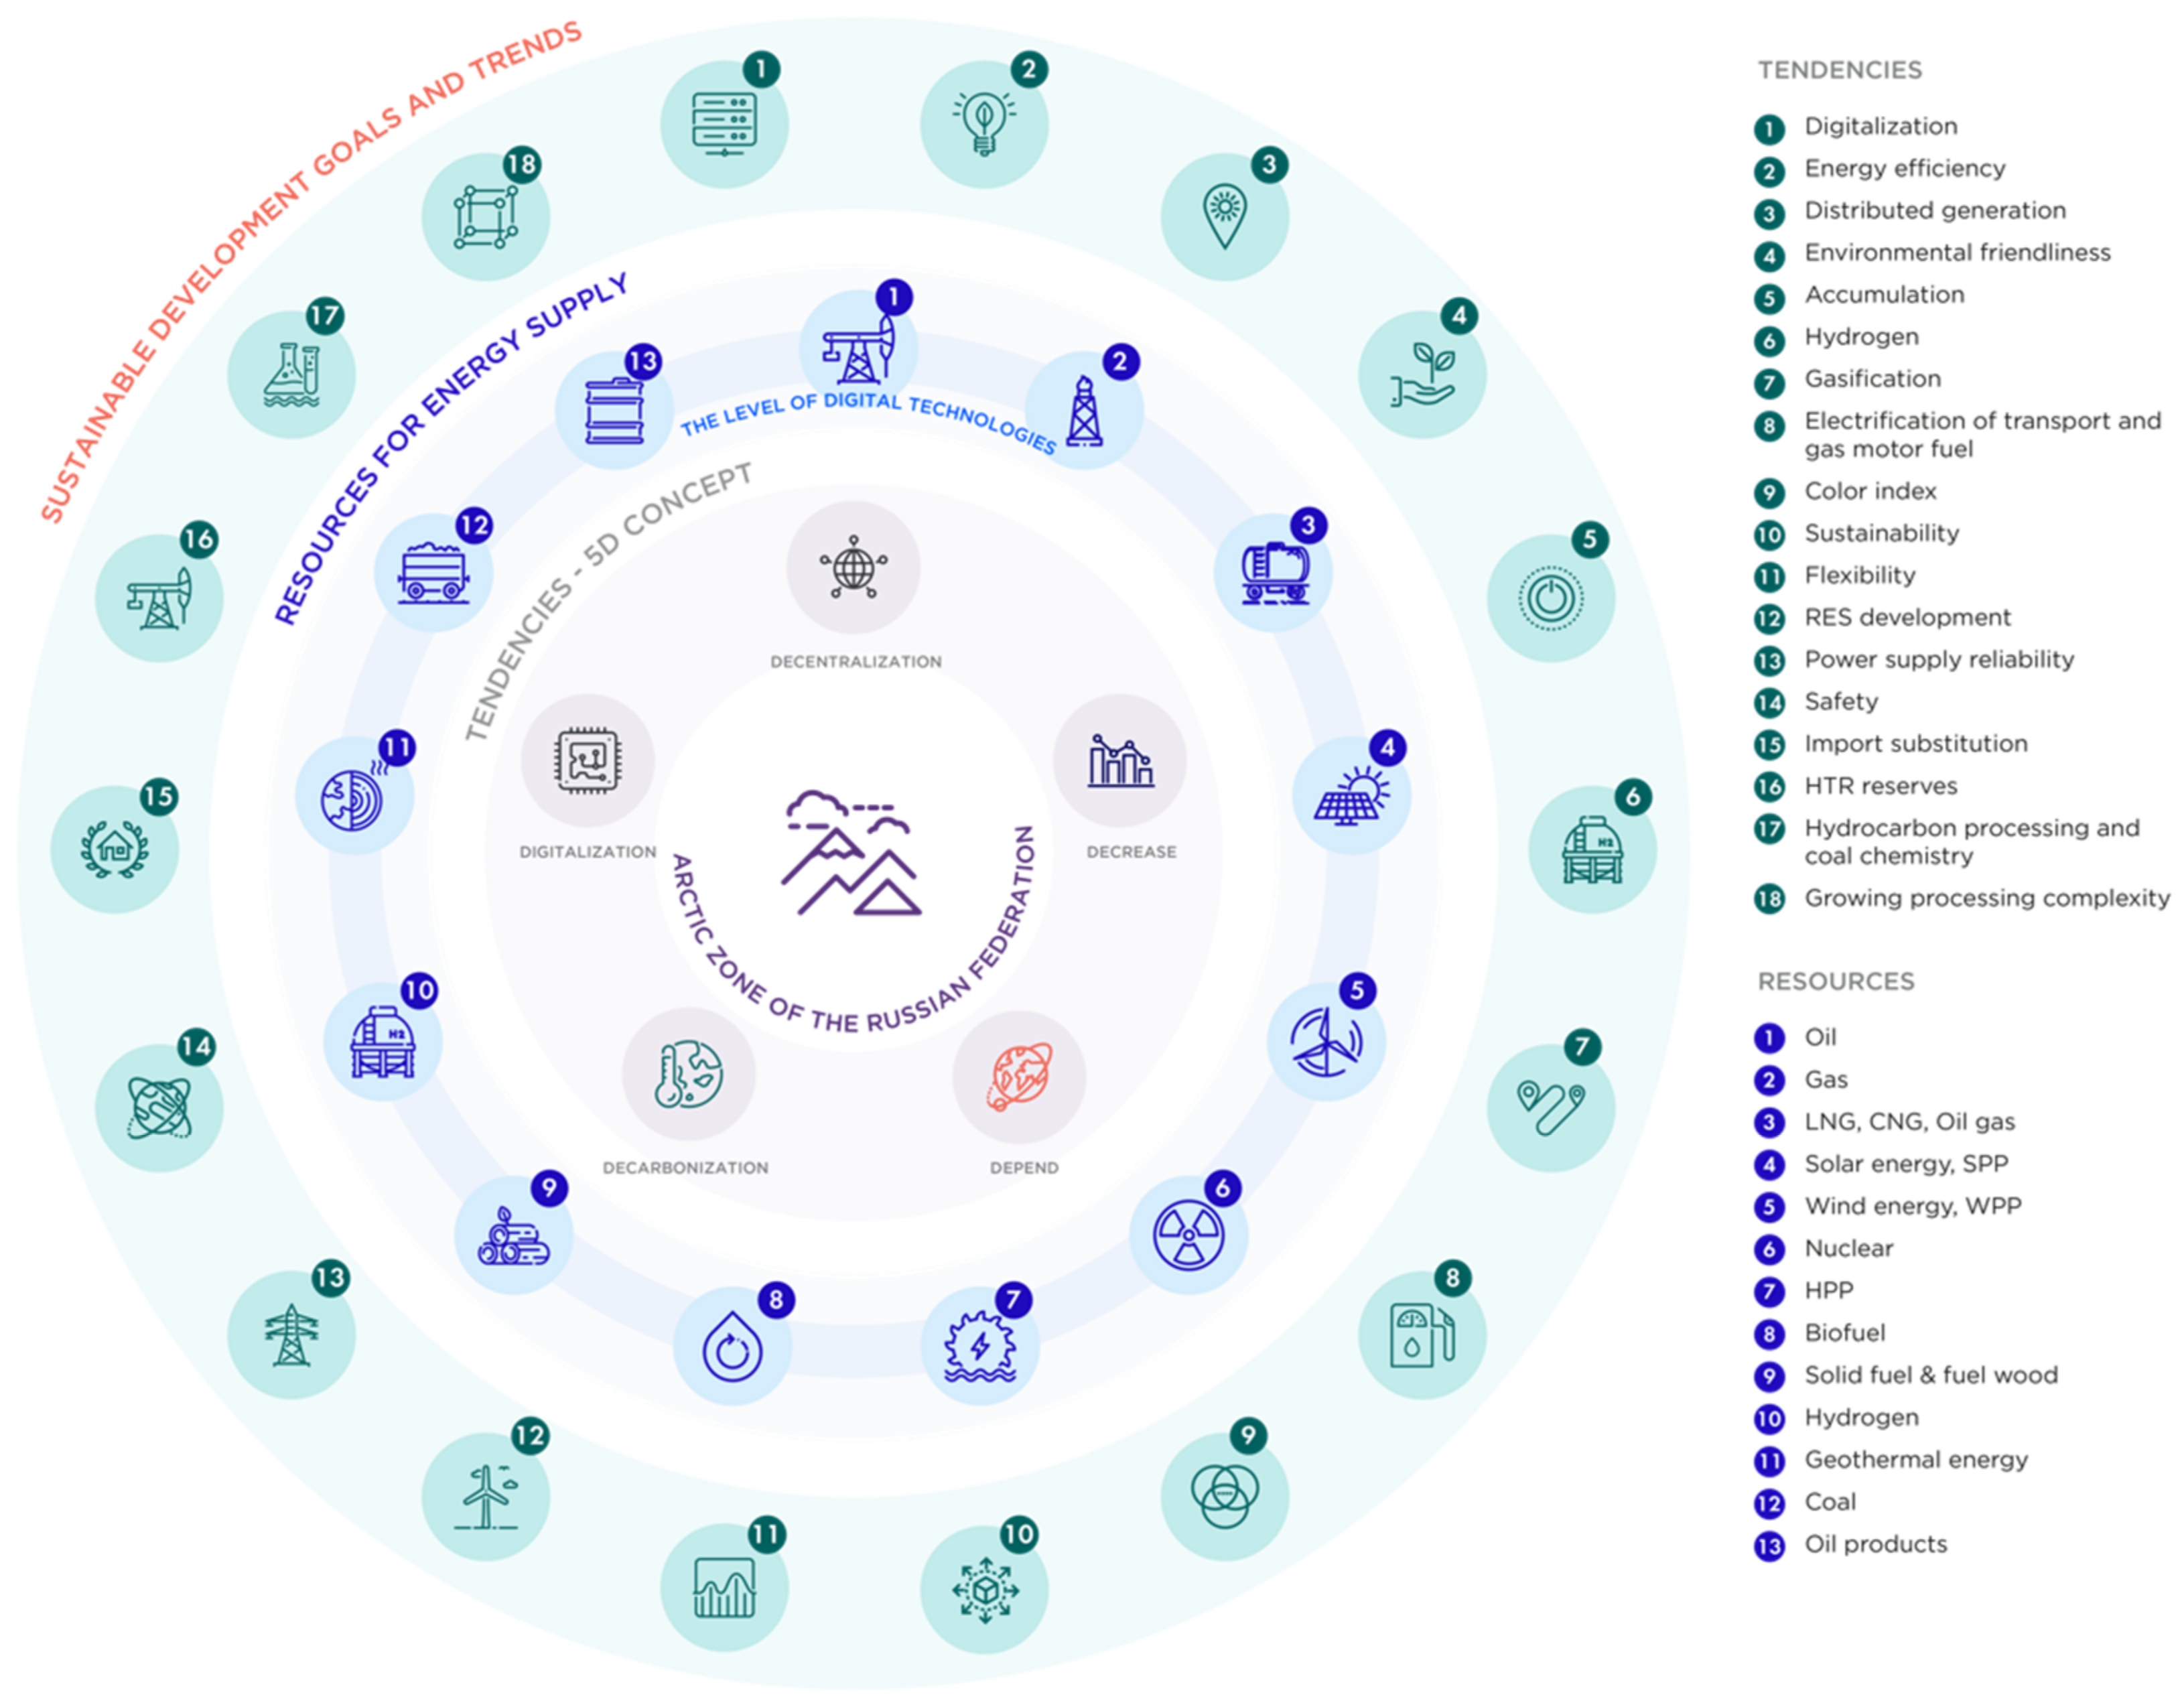
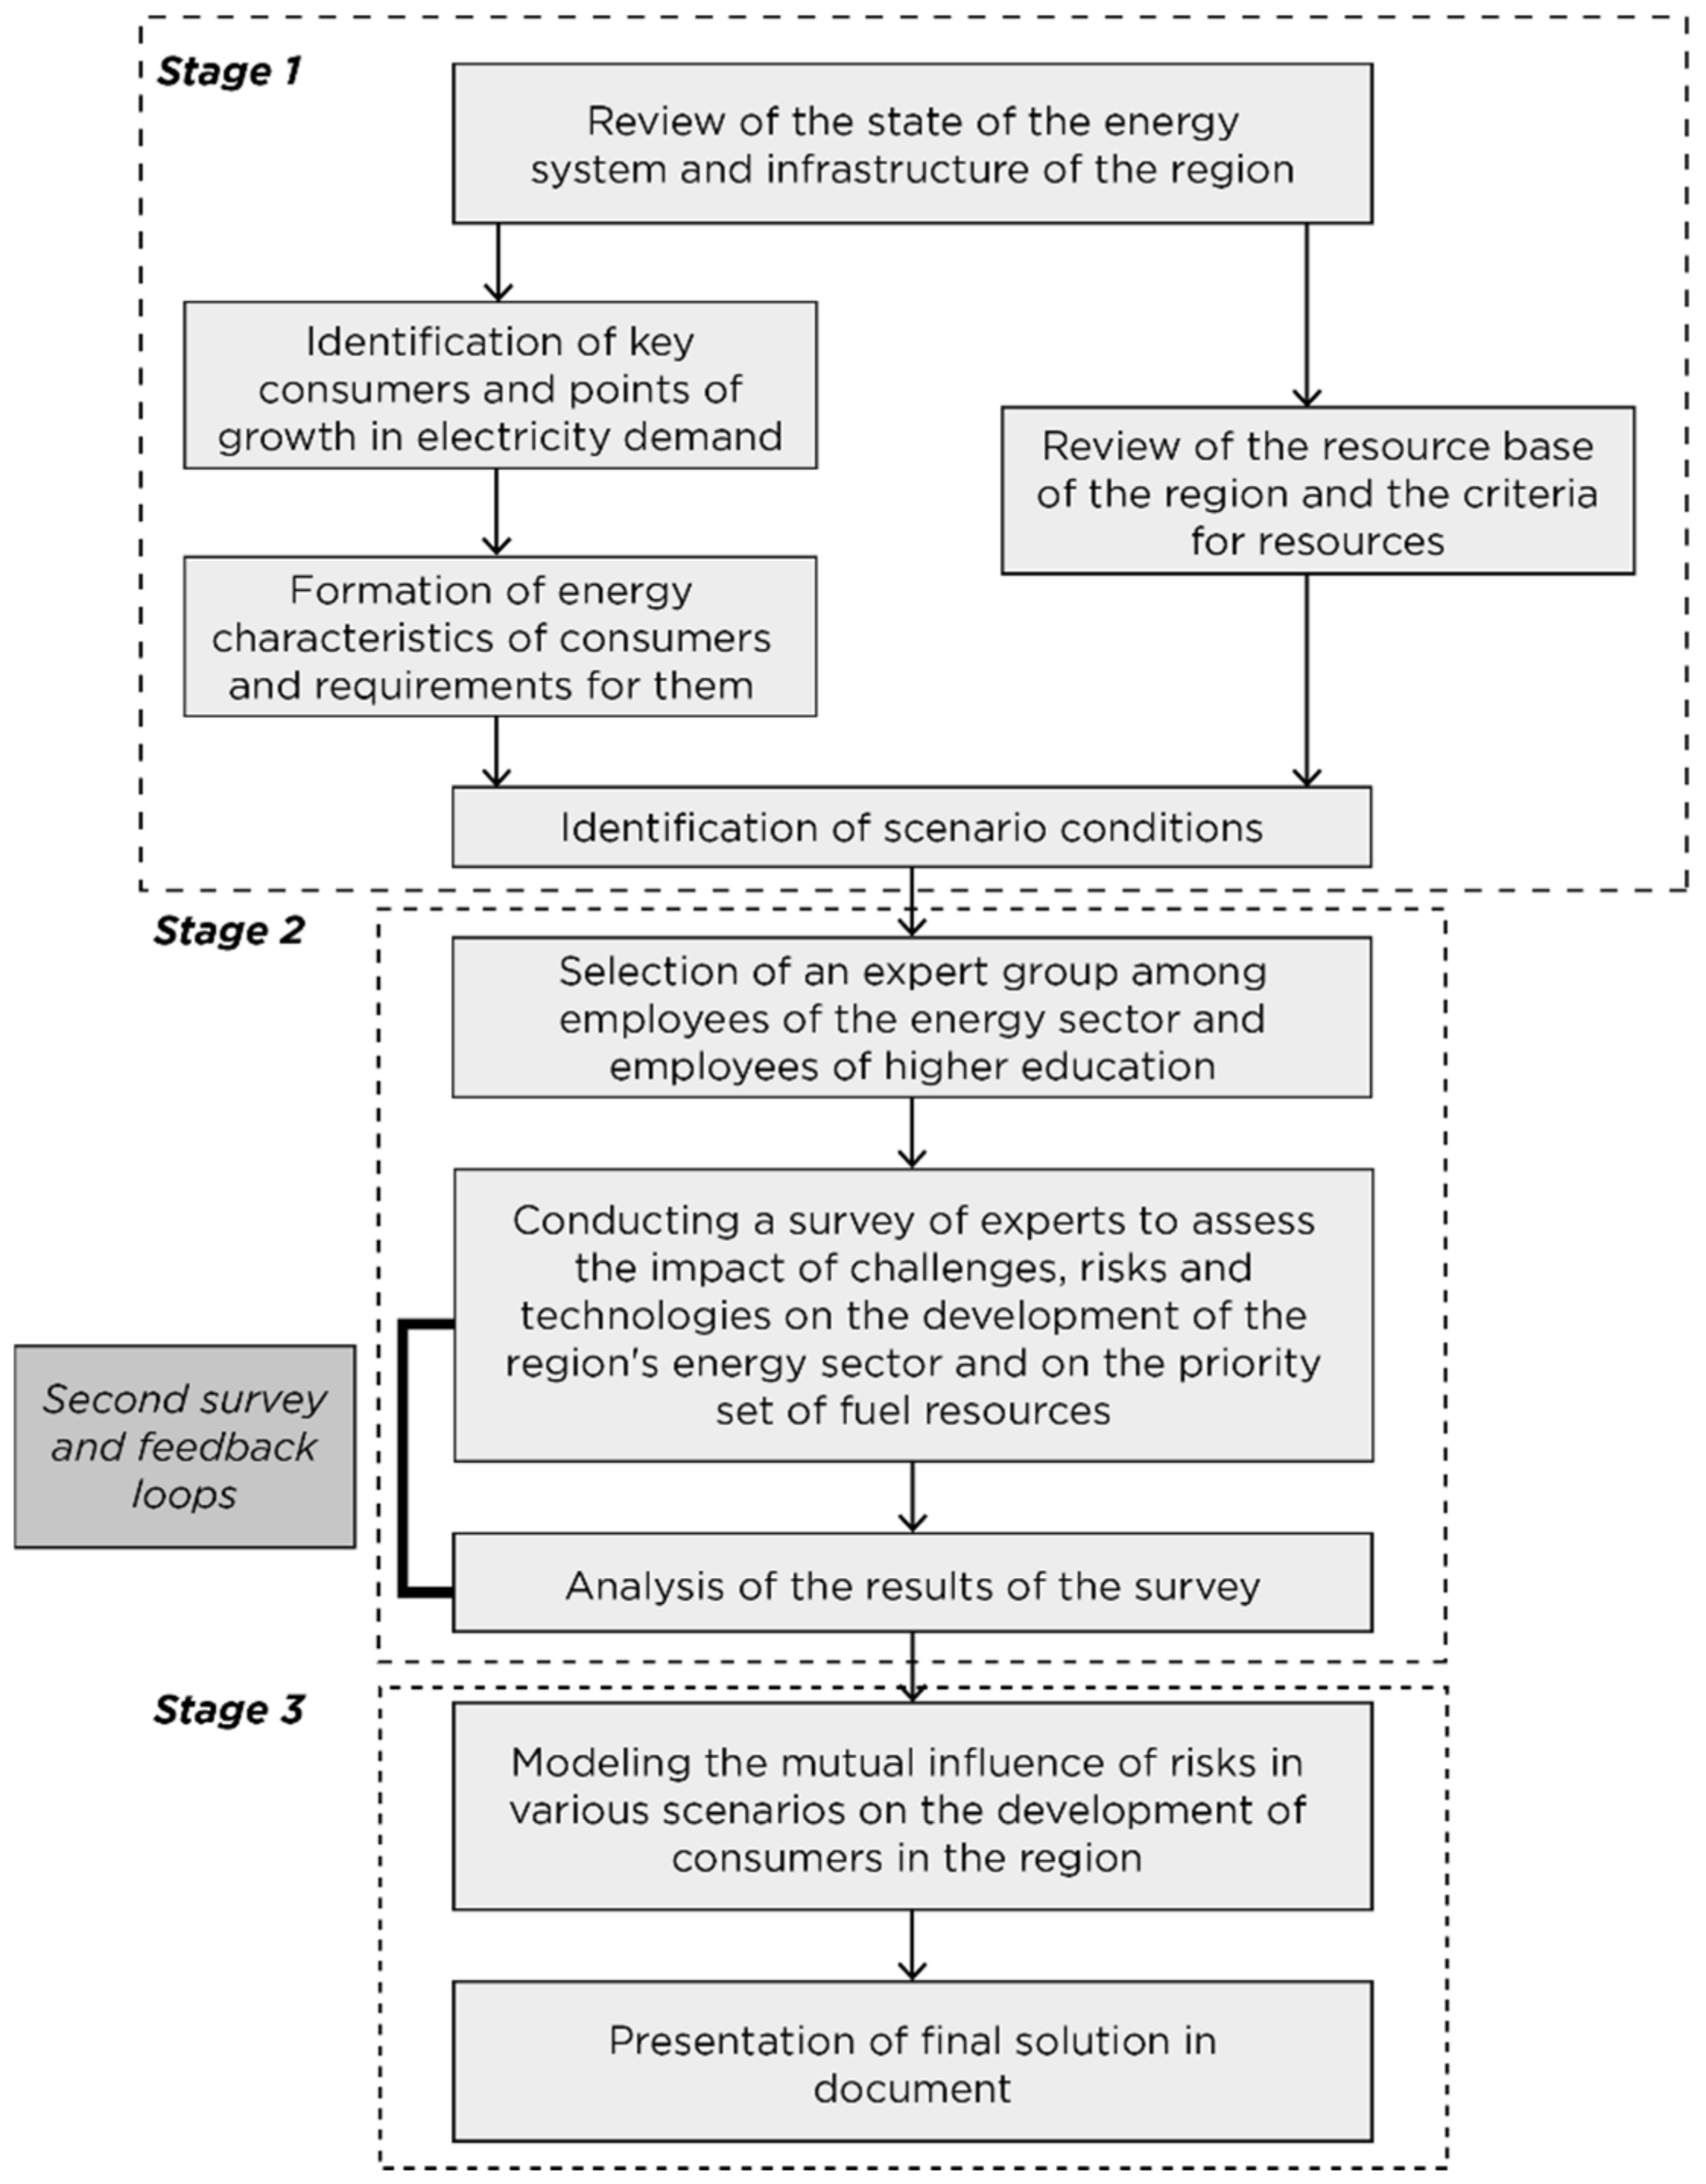
2. Materials and Methods

The model proposed in the article is based on the Delphi method. The Delphi method is designed to assess the aggregate expert opinion on complex problems, potential consequences and the effectiveness of the use of cost measures. The structured opinion of a group of experts in comparison with the opinion of one specialist is a tool for further and more accurate forecasting [18,19,27,28,29].
Following the basic structure of Delphi, the authors developed a questionnaire, the passage of which was allocated 1.5 weeks for 60 experts: employees of companies and universities of the mineral and fuel and energy complexes. The purpose of the survey was to determine the priority set of fuel resources for individual consumers, taking into account the political, economic, social, technological, environmental, and legal risks of using each resource. Risks were assessed on a nine-point scale, where 1 is the minimum risk impact; 9—the maximum impact of risk. Also in modeling, the influence of external factors was considered on the basis of scenario forecasting [18,30,31]. Given that many works noted the importance of risk assessment in the scenario forecasting based on expert evaluations, in our scenarios, we necessarily considered:
  • Technologies and lines of their development of primary interest;
  • Analysis of the current state and prospects for the development of the energy sector in the Arctic;
  • Comprehensive analysis of global factors affecting the development of consumers [32,33];
  • Consideration in modeling expert assessments based on the results of a survey of pro-field experts.
The study was divided into three stages, which are shown in Figure 2. The research methodology includes the following stages: first, a review of the region—the current state of the energy system and energy infrastructure, a study of the resource base, the fuel and energy balance, and related problems, including climatic. Then the study is divided into technological modeling of demand and scenario modeling. In the technological section, the list of key consumers is determined, and current and future centers of energy loads are highlighted. Based on an analysis of trends and tendencies, requirements are derived for each type of consumer, in terms of reliability category, required installed capacity, mobility, seasonality, and carbon footprint. Similarly, an assessment of possible resources by technical and economic criteria and CO2 emissions is carried out. Scenario modeling generates scenarios according to the conditions of which and the results of a survey among experts the demand for energy consumption will change, as well as the probability of meeting the demand for different types of resources.

2.1. Analysis of the Development Potential of the Arctic

The Russian Arctic (AZRF) is a geographical area within the Russian Federation, located above the Arctic Circle. It includes Murmansk and Arkhangelsk Regions, the Komi Republic and Yakutia, Krasnoyarsk Territory, Nenets, Chukotka, Yamalo-Nenets Autonomous Districts, Belomorsk, Kemsk, and Lo-Ukhsk districts of Karelia, as well as lands and islands located in the Arctic Ocean and some uluses of Yakutia [34].
The study identified the following types of prospective consumers for the territory of the Arctic—they are also referenced points and points of growth (consumer agglomerations), on which the further development of the territory will be built:
  • Military bases;
  • Hydrocarbon deposits and rare-earth metal deposits;
  • Settlements (single-industry towns);
  • Scientific research bases;
  • Logistic clusters, hubs;
  • Medical bases;
  • Agricultural complexes;
  • Tourist bases;
  • Data centers (DPCs).
The study analyzes the development potential of all of these types of consumers, but in the final version of the work, the authors formulate conclusions only on some of them.
Hydrocarbon deposits and rare-earth metals. The scales of the Arctic resource potential are estimated as follows: about 70% of the total unexplored gas reserves in the Arctic are managed by the Russian Federation [35]; in the Arctic regions of the country, there are strategic and rare-earth metals—about 10% of the world reserves of nickel, 19% of the platinum group metals (PGM), 10% of titanium, over 3% of zinc, cobalt, gold, and silver; the largest coal and diamond deposits [36]. It is worth noting that 70% of the Arctic oil resources are concentrated in the shelf areas, and most of the explored fields are difficult to extract. Moreover, it is estimated that up to 25% of hydrocarbon reserves lie under the ocean strata on the Lomonosov Ridge [37].
Currently, coal and oil products have a significant advantage in the energy balance of the mainland Arctic, which negatively affects the fragile ecosystem of the region [38]. An essential role in reducing the negative impact and increasing the added value of the product will be played by such technologies as Clean Coal and the introduction of digital tools throughout the supply chain. Gas and gas-condensate potential can occupy a niche of gas-chemical production and ensure the production and export of liquefied natural gas (LNG) and hydrogen, which will not only make up for export losses due to the accelerating decline in demand for oil but also provide new investment and return flows [39].
Single-industry towns. The development of the Arctic’s natural potential first of all requires a huge number of qualified specialists, but the actual living conditions [40] lead to a migration outflow of population. The difference in the socio-economic situation is due to the high diversification of the economy of single-industry towns and dependence on enterprises and is emphasized by the division of towns in the Arctic zone into categories [16,41,42,43].
Logistics clusters. One of the most important vectors of the development of the transport industry of the Russian Federation in the Arctic region is the establishment of permanent communication along the Northern Sea Route (NSR) [44], which requires the development of mainland infrastructure [45]. The Arctic zone is also characterized by a well-developed railway network; at present, there is the financing of the Northern Latitudinal Railway (NSR), Northern Latitudinal Railway-2, and Belkomur projects. The estimated traffic volume along the Northern Movement is 23.9 million tons of various cargoes per year [46]. The aviation infrastructure of the Arctic zone is currently represented by more than 160 airports and airfields.
The places of intersection of air, rail, and water hubs are the so-called transport hubs. In the complex development and development of the Arctic zone, they acquire enormous importance due to the tendency of formation of agglomerations near such clusters, transport accessibility, and available infrastructure. The work identified the following hubs: the currently existing ones (5) in Murmansk, Arkhangelsk, Sabetta, Vladivostok, Dudinka and the ones to be built (3) in Ust-Luga, Tiksi, Korsakov.

2.2. Energy Characteristics of Energy Consumers in the Arctic

Given the resource potential of the Arctic in the conditions of the gradual depletion of the continental base, the creation of transport and logistics hubs capable of giving a new impetus to the development of world trade, as well as the military and political aspect, the development and exploitation of the Arctic zone acquire a new strategic and economic momentum [47].
The development of the Arctic is a sequential and multistage process. It is necessary to ensure the development of promising areas, the maintenance and modernization of the existing infrastructure and the creation of comfortable living conditions for the population [48]. The remoteness from the main industrial centers of the country creates the need to build a large network of railways and roads: first, to maintain a high level of mining, and second, to supply the Arctic regions [49,50].
An indispensable condition for the development of the region is a reliable uninterrupted energy supply to existing and prospective consumers following global trends and requirements. Arctic states face a number of common problems in this area, among which are remoteness from central energy networks, the use of expensive diesel fuel for energy generation, the high level of tariffs for energy services, as well as the specifics of the life of small indigenous peoples. Arctic conditions require the development of affordable, reliable, and easy-to-operate technologies that can supply energy to remote areas under icing conditions, high humidity, and critically low temperatures, using environmentally friendly energy carriers.
As a result of research, the following characteristics of consumers have been revealed: the peculiarity of power supply of military bases—the necessity of independence from each other, energy sources working independently according to the special group of the first category of reliability and uninterruptibility of electric receivers. The power supply of military bases does not have to take into account its environmental and economic efficiency. In the structure of generating capacities of single-industry towns, there are a large number of boiler and diesel-generator sources. Low efficiency of heat and power networks and their significant wear and tear is observed. The Arctic region has great potential in the use of non-conventional renewable energy sources [51]. Wind energy has the greatest potential in the Murmansk region and can be used to create Power-to-X systems [52]. Power-to-X technology is a solution to the problem of the interconnection of energy sectors [53]. Steam-gas turbine units (SGU) are often used for distributed generation to obtain electric and thermal energy due to their high efficiency. The technology of converting electricity into heat (in this case Power-to-Heat) using heat pumps or heating rods is an innovative environmentally friendly way of heating buildings and even providing industrial enterprises with process heat. In the Arkhangelsk region, there is an active development of the industry of environmentally priority fuel-liquefied natural gas. The creation of an efficient support system for the development of small-scale power engineering, disclosure of floating nuclear power plants, and the increase of local resources efficiency will become the starting point of socio-economic development of North-West Russia. At present, scientific stations are mainly equipped with diesel power plants. For onshore research stations, the energy characteristics vary depending on the activity of use and the focus of research. It is perspective to use biofuel as a resource for the energy supply of agricultural complexes, which is received as a result of the cultivation of certain crops or animals’ vital activity. In its turn, the transition to the use of biofuels will take a long time, so at the first stages, it is advisable to use wind-diesel installations, which are already in operation in the Murmansk Region [54]. The energy supply of data processing centers is characterized by reliability and uninterrupted operation. Most of the energy is consumed for cooling and operation of the equipment located in data centers. Currently, most data centers are powered by diesel generators, while large IT companies follow the trends and use renewable energy sources [55].

2.3. Requirements for Energy Consumers

For each of the allocated types of consumers, the requirements for energy supply were formed. For the convenience of perception, analysis, and application in the mathematical model, the selected requirements are summarized in Table 1.
The transition to qualitative characteristics is due to the task of implicitly comparing the requirements of consumers and the criteria for energy sources: we resorted to this method so that it would be easier for experts to compare the resource and the consumer and assess the weight coefficients of their connection. In addition, due to a large variation in the installed capacity, we decided to assign such parameters as “capacity” qualitative characteristics. If you have close values of the installed capacity of the compared consumers, it may be more convenient for you to go to quantitative characteristics. Each of the qualitative characteristics presented by the authors is inherent for a certain primary resource. The method with their use emphasizes the influence of characteristics on the choice of consumers due to their specific’s requirements for primary resources. The use of this connection when analyzing the compatibility of a resource with a consumer’s requirement distinguishes our method from others.

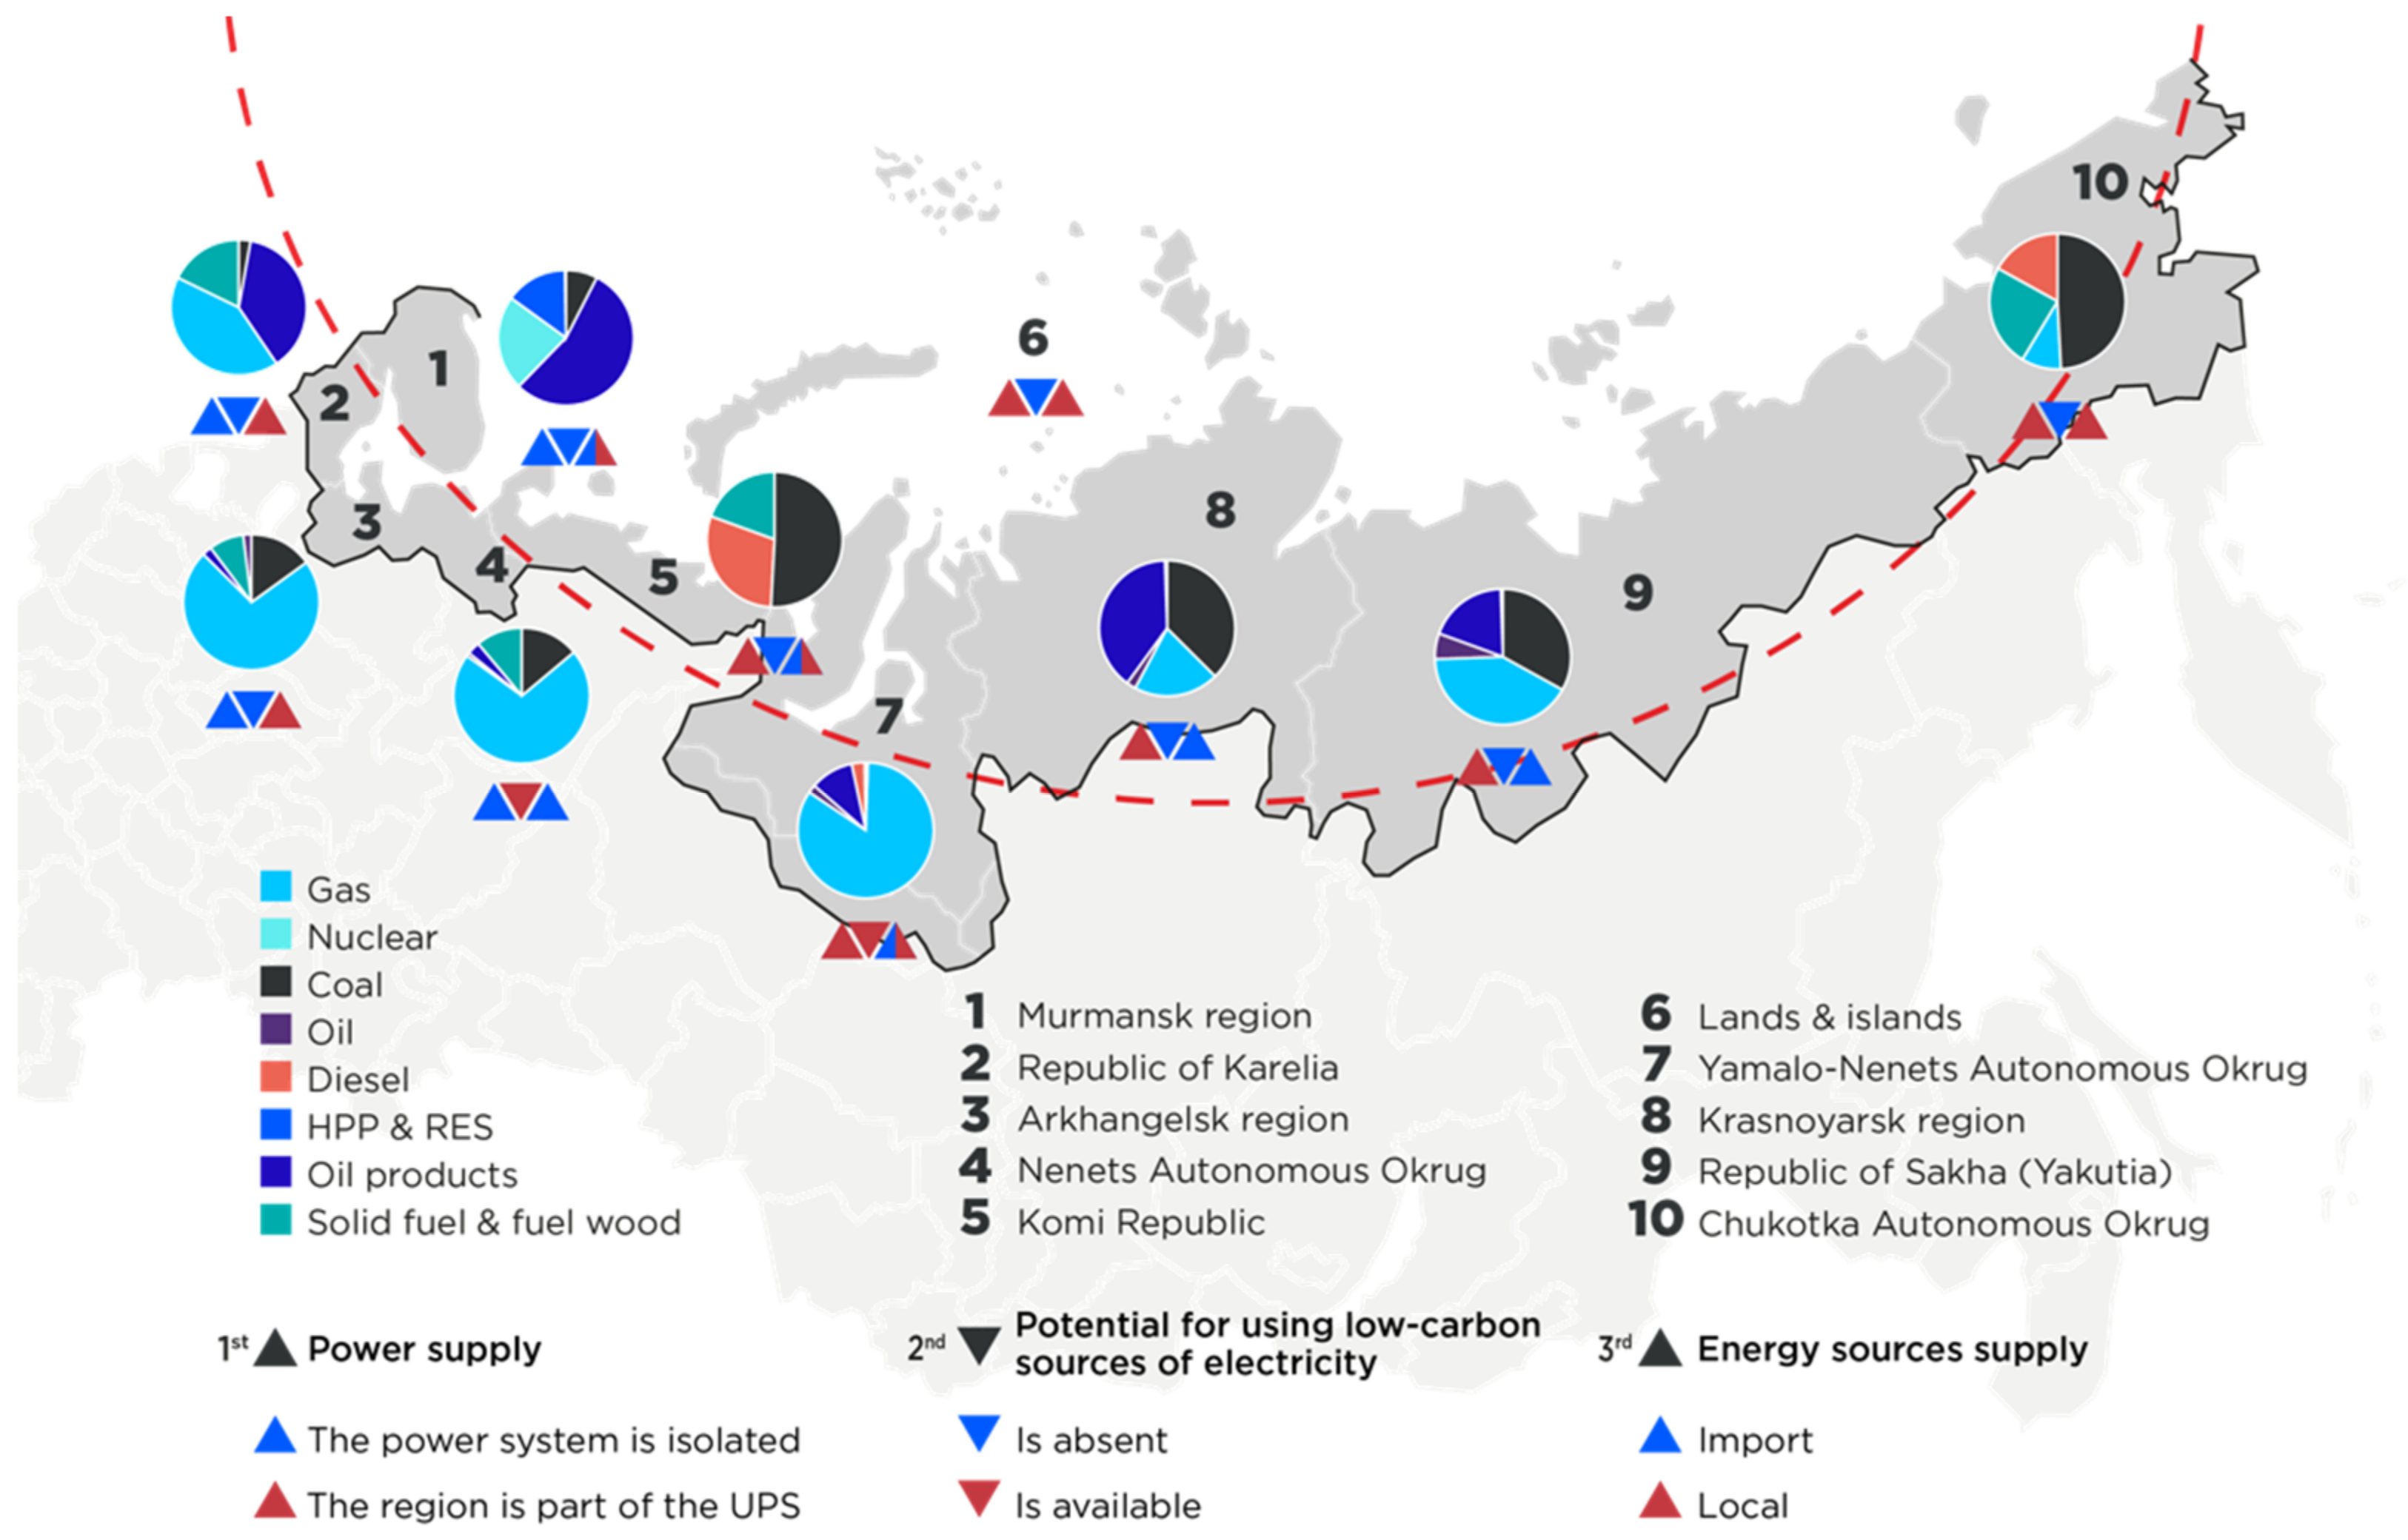
2.4. Resources for Power Supply to Consumers

The main energy resources in all regions of the Arctic zone are fossil resources: natural gas, coal, diesel, fuel oil, gasoline, kerosene, associated petroleum gas (APG), coke, peat, and oil shale. The leading positions in the structure of the fuel and energy balance (FEB) of the Russian Arctic are taken by such resources as natural gas, coal, and oil products.
Natural gas. The priority in the use of this resource is given to the western regions of the Arctic zone (Yamal-Nenets Autonomous Okrug, Komi Republic, Arkhangelsk Oblast, Republic of Karelia, and Murmansk Oblast), where the infrastructure of local and main gas pipeline networks is developed. The YNAO and the Komi Republic are gas suppliers for the other western regions mentioned above. The Taimyr-Turukhan zone (Krasnoyarsk Krai) is the “greenest” of all the zones, with 60% of installed capacity coming from gas and the remaining 40% from water flow energy.
Coal. This resource is widespread in those Arctic regions where there is direct extraction, for example, in Chukotka AD. In other regions of the Arctic zone, coal is usually transported.
Oil products. Fuel oil and diesel oil are delivered to the territory of the Arctic in full. In the structure of fuel and energy mix of the Murmansk Region and the Republic of Karelia, they account for a significant part.
Nuclear fuel plays a significant role in the energy supply of the Murmansk Region and Chukotka AD. Further development of nuclear power in the Arctic is promising due to floating nuclear power plants. The energy of water streams is used in the energy balance of the Murmansk Region, and the Republic of Karelia has potential for the development of hydroelectric power. Associated petroleum gas is used in the energy regions where oil production takes place. In areas with a predominance of the woodworking industry, wood and municipal solid waste are used. Now, renewable energy sources do not make a significant contribution to the fuel and energy mix of Arctic consumers.
It is necessary to note the important role of LNG in the resource market. Considering the resource potential of the Eastern Arctic, that is, gold, tin, copper deposits, remote from fuel bases, it is necessary to have a resource that allows increasing the necessary capacities under requirements of carbon footprint reduction. Taking into account the course on the gasification of the Arctic region and development of the main transport route—the NSR, LNG has the prospects to take the leading position in the nearest decade not only on the external resource market but also on the domestic one.
Hydrogen is a potential resource, which in 2035–2050, with the development of appropriate technologies and the accumulation of sufficient experience in its use, could take significant positions.
Criteria for resources. All resources that are consumed in the region or are perspective from the point of view of use for energy supply are summarized in Table 2. They are evaluated by criteria, among which are economic and environmental: the capital cost of building a generation unit based on the selected resource (CAPEX), the average present value of electricity over the life cycle of the resource (LCOE), the net present value of building and operating a generation unit for the resource (NPV), as well as emissions, expressed in the equivalent of CO2. Economic indicators are one of the most important assessed parameters of electrical engineering complexes, as a rule, they act as optimization criteria [58]. Quantitative indicators by criteria are given, which reflect in point expression the minimum (1 point) and maximum (5 points) level for the selected criterion.
All fuel resources (except for solid fuel and resources) at the stage of realization require considerable capital costs but getting energy from them entails consequences for the biosphere, which are caused by a different set of processes and the nature of their appearance. Thus, obtaining the end product from wind, solar, water, and land energy is less destructive to the environment in terms of disturbances and pollution due to the lack of transport processes and resource extraction [59]. Renewable energy sources are used locally and are not “transportable”.
Hydrocarbons and coal are the most capacious fuels in terms of the number of processes and require a well-developed transportation infrastructure. Hydrogen fuel is a possible alternative to fossil fuels, which is worth considering as a source of clean energy and a means of storing it for Arctic consumers while developing technologies for the production, storage, transportation, and consumption of hydrogen. In its turn, natural gas has great potential in terms of exportable resources to the EU and APR countries due to the development of LNG production technologies.
We should also note the possibility of risks of LNG supply reduction to other countries through the use of hydrogen energy, the development of which generally helps to reduce the global dependence on gas. Petroleum products are ubiquitous and widely used fuels for all types of consumers.
Nuclear energy is also applicable to many consumers, is environmentally friendly due to minimal CO2 emissions, and is convenient in terms of the long-term use of nuclear fuel, which is imported from other regions of Russia.
Using estimates for petroleum products as an example: CO2 emissions for 2020 in the world amounted to more than 12 billion tons, or 30% of the total amount of emissions, respectively, the authors assigned a maximum rating of 5 points [60]. The LCOE for diesel installations varies according to specifications and fuel prices. On average, the LCOE will hover around $50/MWh for small installations, while for solar panels, it will be over $150/MWh, so an average rating of 3 was given [61,62]. CAPEX for oil fields continues to grow due to growing concerns about ESG and pressure on investors [63,64].
As a result of the analysis of review and analytical articles, a list of major global technological trends and related technologies was identified [65,66,67,68,69,70]. The existence of each trend is confirmed by examples of Russian and foreign company cases.
Against the background of global goals to reduce the carbon footprint of most industries, companies are striving to implement RESs and renewable energy, combining them with traditional sources under the control of IT technologies. Storage of produced energy is a no less urgent issue, which is solved by companies at the level of technology in the struggle for primacy in the creation of new storages [71]. Digitalization, implementation of microgrids, and active-adaptive networks are a number of additional technological trends caused by the global agenda.
At the moment, Hevel is building an autonomous hybrid power plant with a total capacity of 2.5 MW in the village of Tura. Hywind Scotland wind farm, built jointly by Equinor and Masdar, is operating in the Scottish waters. The total capacity of all wind turbines is 30 MW, the capacity factor is 50%. The development of hydrogen energy and transport should be singled out in the cases of RESs and RES companies: Airbus hydrogen gas turbines, Alstom hydrogen fuel cells [72]. For 6 years, Rubin Central Design Bureau has been preparing the Aisberg project, which includes the development of underwater production complexes of northern fields. The work includes the development of specialized drilling rigs, production stations, process control, and energy-saving equipment.
ROSATOM has developed a number of small nuclear power plants (SNPPs) designed for service in remote areas of the Arctic. Among them, there are transportable complexes, as well as complexes designed for offshore operation, so power units from 1 to >100 MW are represented [73]. The harsh conditions of the Arctic, in general, promote the development of autonomous technologies, as well as remote control technologies. Even today, there are a large number of Russian and foreign projects in the field of unmanned technologies, flying and underwater vehicles for remote control for transport, construction, research, and oil and gas industry needs. The Russian Helicopters Holding Company has developed the VRT-300 multifunctional unmanned helicopter for the Arctic and NSR development, capable of cargo transportation, environmental monitoring, search and rescue operations, as well as equipment and road infrastructure diagnostics. Kalashnikov Concern, Lazurite Central Design Bureau, and others are also engaged in the design of drones.

2.5. Scenario Development

The methodological approach in the study is based on several forecasting scenarios, which are broken down into a sequence of time intervals of 2020–2025; 2025–2030; 2030–2035. Planning or scenario analysis is a consolidated and structured process of creating future opportunities that have socio-economic, environmental, and technological implications.
Scenario planning was based on an analysis of the Arctic’s external environment, followed by the identification of the main factors affecting consumer development, electricity demand, and capacity. As a result of the analysis of the external environment, a list of macro-environmental factors that have the greatest influence on the development of consumers in the Arctic in the period under consideration was compiled.
Based on the brainstorming method, the most significant factors were identified and optimized using cause-effect diagrams. This resulted in the selection of the most significant and independent factors. The brainstorming method has established itself as an effective way to generate creative and effective ideas when solving outstanding and complex problems that require the involvement of specialists from different specialties. The method is widely known and applicable, including in solving scientific and engineering problems [74,75,76]. The research work presented in this article implies a comprehensive study and the involvement of specialists and young scientists from different areas of the fuel and energy complex and MSC, which makes it necessary to organize work, including by the brainstorming method. Based on this method, the most significant factors were identified and optimized using cause-effect diagrams.
During the forecasting phase, several variants of different scenario outcomes were generated. The purpose of combining the most significant factors was to establish the interdependence between the predicted outcomes of the factors under consideration and to write scenarios.
The scenarios (Table 3) combine a variety of factors. For example, such as global economic growth, political factors, environmental issues, and technological development, that illustrate the relationship between the main driving forces. Scenario driving forces include various types of factors, some of them, such as the COVID-19 pandemic, arise spontaneously. Others represent sustained trends, such as Digitalization, Decarbonization, Decentralization, Dependence, and Decrease. Today’s policies of companies and governments take into account the need to achieve sustainable development goals. Thus, the SDGs are also becoming one of the most important drivers for scenario planning.
Survey design methodology and results of the survey. To form scenarios for the development of electricity and energy supply of the Arctic consumers, a survey was conducted on the basis of expert evaluations. A poll was developed to get expert data to forecast Arctic energy development and the priority set of fuel resources for three time intervals: 2020–2025, 2025–2030, 2030–2035, taking into account the political, economic, social, technological, environmental and legal risks of each resource’s use in the Arctic zone. The risks were assessed on a nine-point scale, where 1 is the minimum impact of risk; 9 is the maximum impact of risk. An expert assessment was made of the development of types of consumers and demand for energy resources.
Each region in the Arctic zone is characterized by its own set of fuel resources, which at the moment is conditioned by the presence of hydrocarbon or coal deposits and developed transport infrastructure of resources.
Since hydrocarbons and coal occupy priority positions in the structure of the region’s fuel and energy balance, it was decided to divide the Arctic zone into three groups following the affiliation of hydrocarbons (gas, oil, and oil products) and coal to these territories:
  • Regions where fossil resources are predominantly “imported”, that is, the Murmansk Region, the Republic of Karelia, the Arkhangelsk Region, and the Komi Republic.
  • Regions where fossil resources are “local”, that is, are extracted in the regions in question—Republic of Karelia, Yamalo-Nenets AD.
  • Regions where fossil resources are both “local” and “imported”—“mixed”, that is, Krasnoyarsk Krai, Yakutia, and Chukotka AO.
Figure 3 presents a map of the fuel and energy balance of the Arctic region.
The time frame for the survey was 1 month. The expert group was selected from various structures, scientific and social schools. During this time, 64 people took part in the survey: employees of 5 educational institutions, employees of 5 companies of mineral complex, employees of 7 companies of the fuel and energy complex.
Thus, the forecasting of the energy sector development is based on a survey of a large number of professional workers and teachers of specialized institutions, close to the subject. As a result of this research, key consumers and the most sought-after resources for energy supply were identified.
A complex step-by-step work was carried out: from assessment of the current situation in the energy sector of the Arctic to the choice of research method, the concept of questionnaire and experts, data analysis, and its use for forecasting in various scenarios.
Figure 4 shows a generalized methodology of building a mathematical model of scenario forecasting.
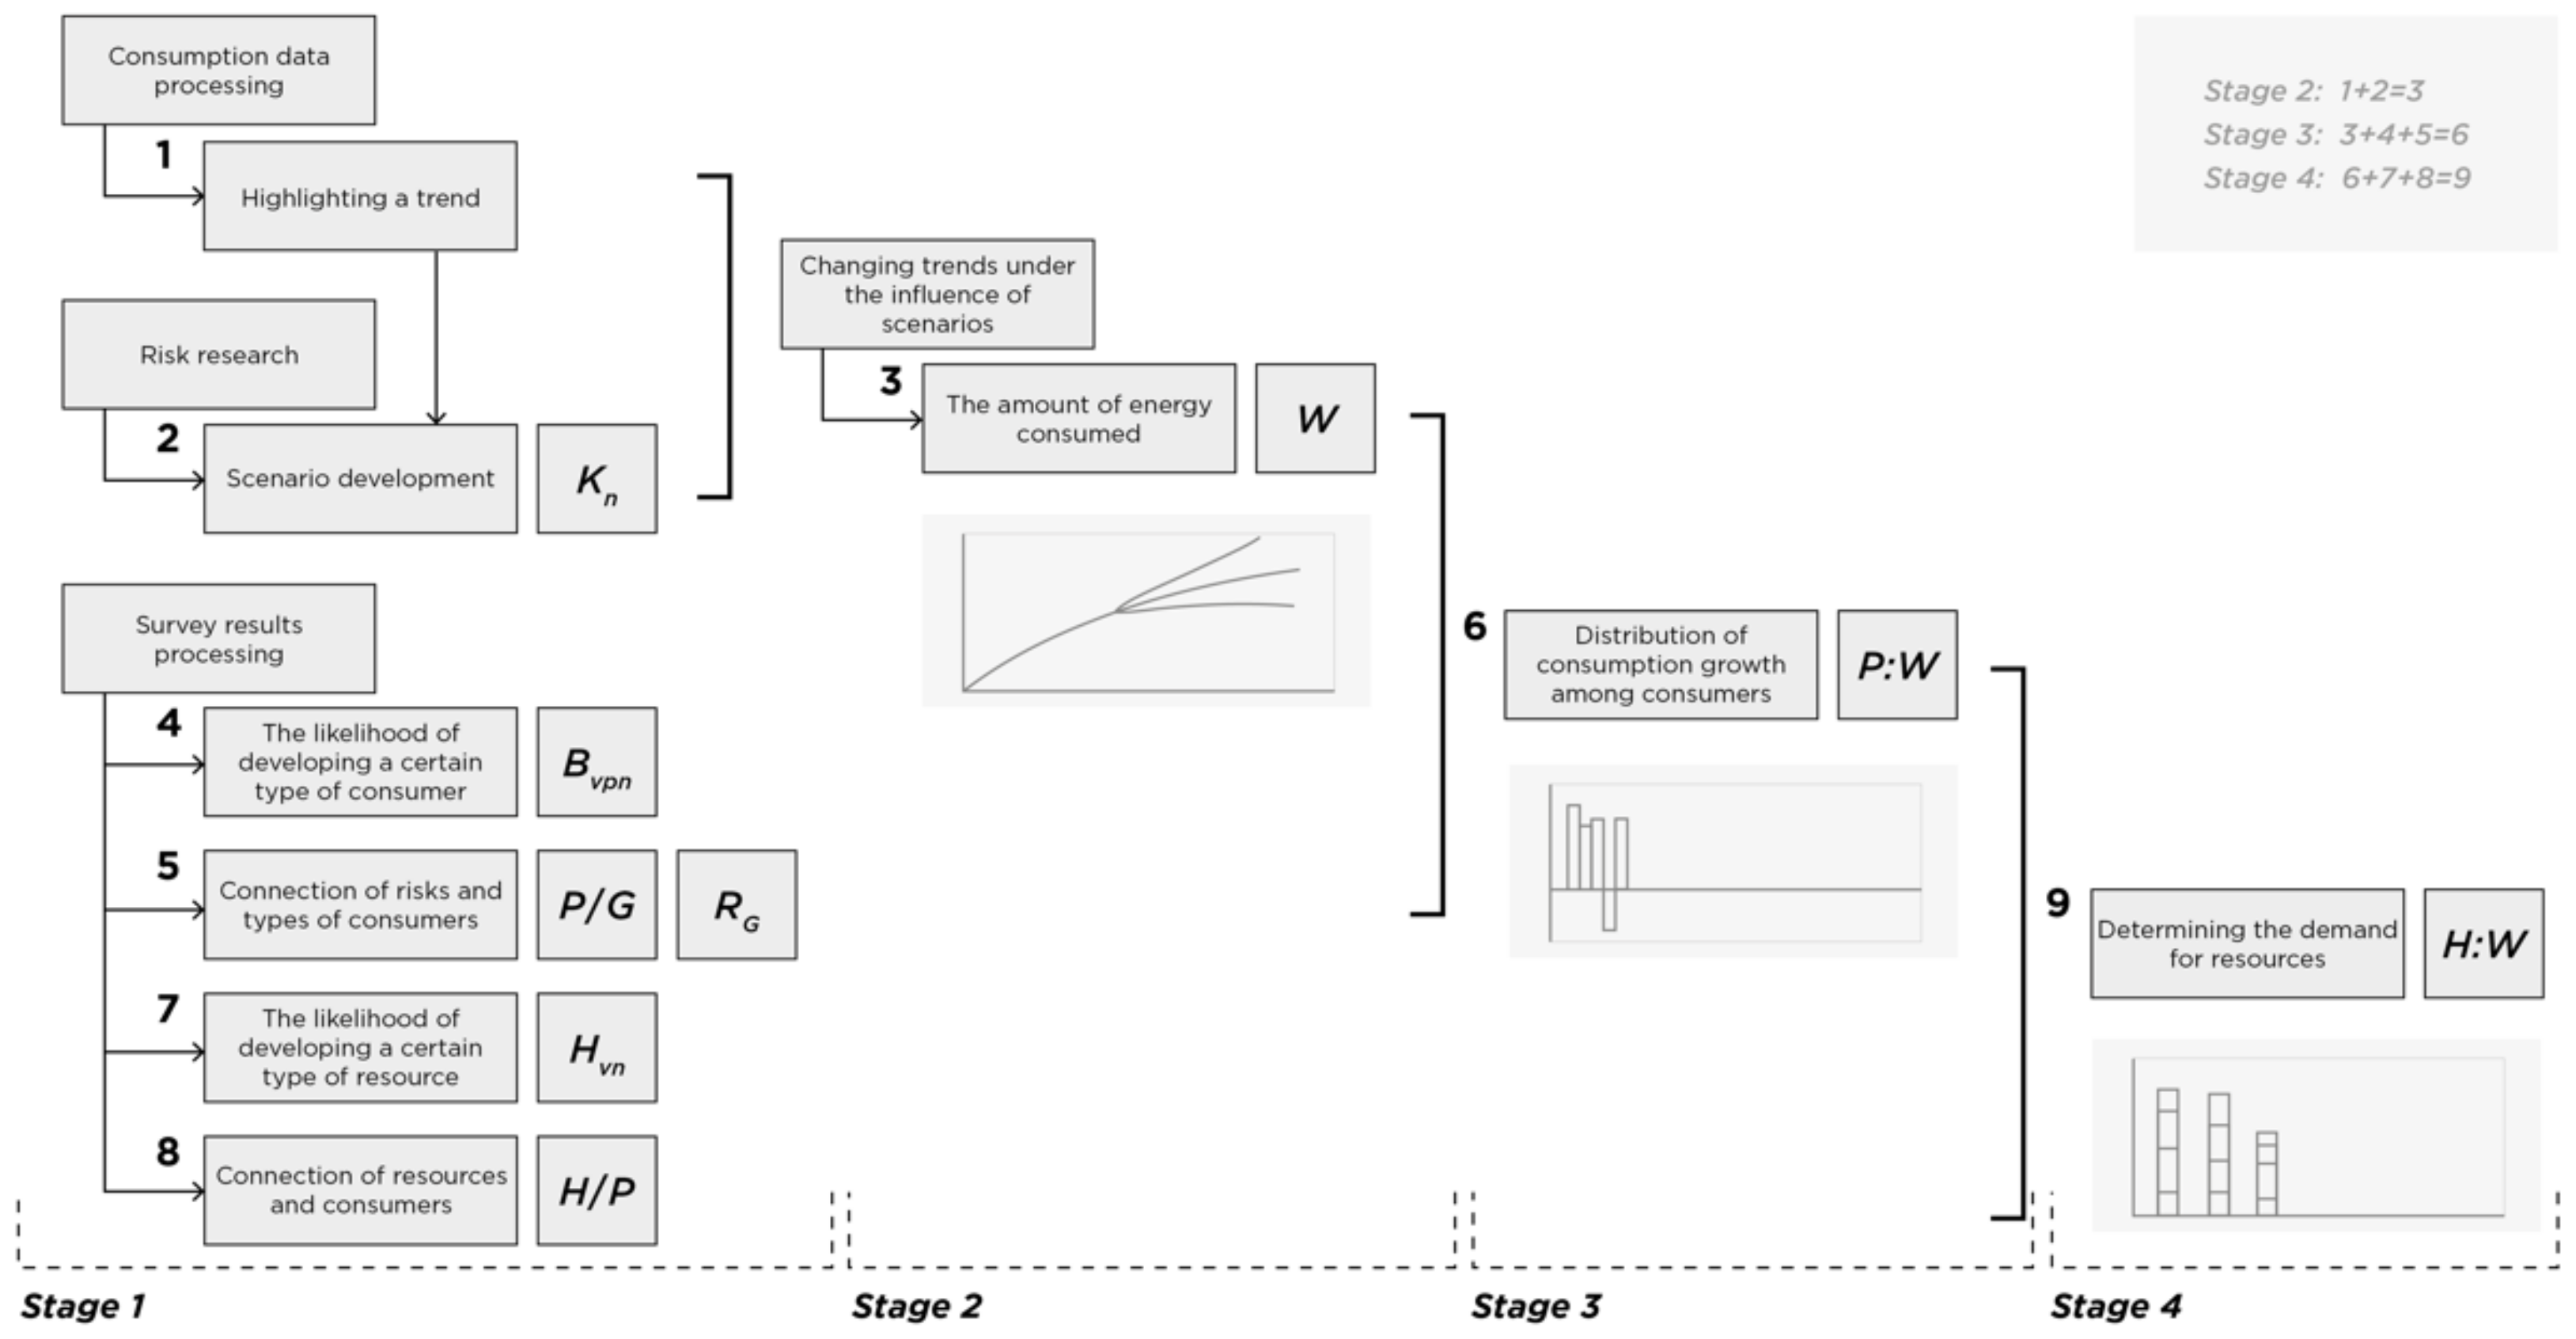
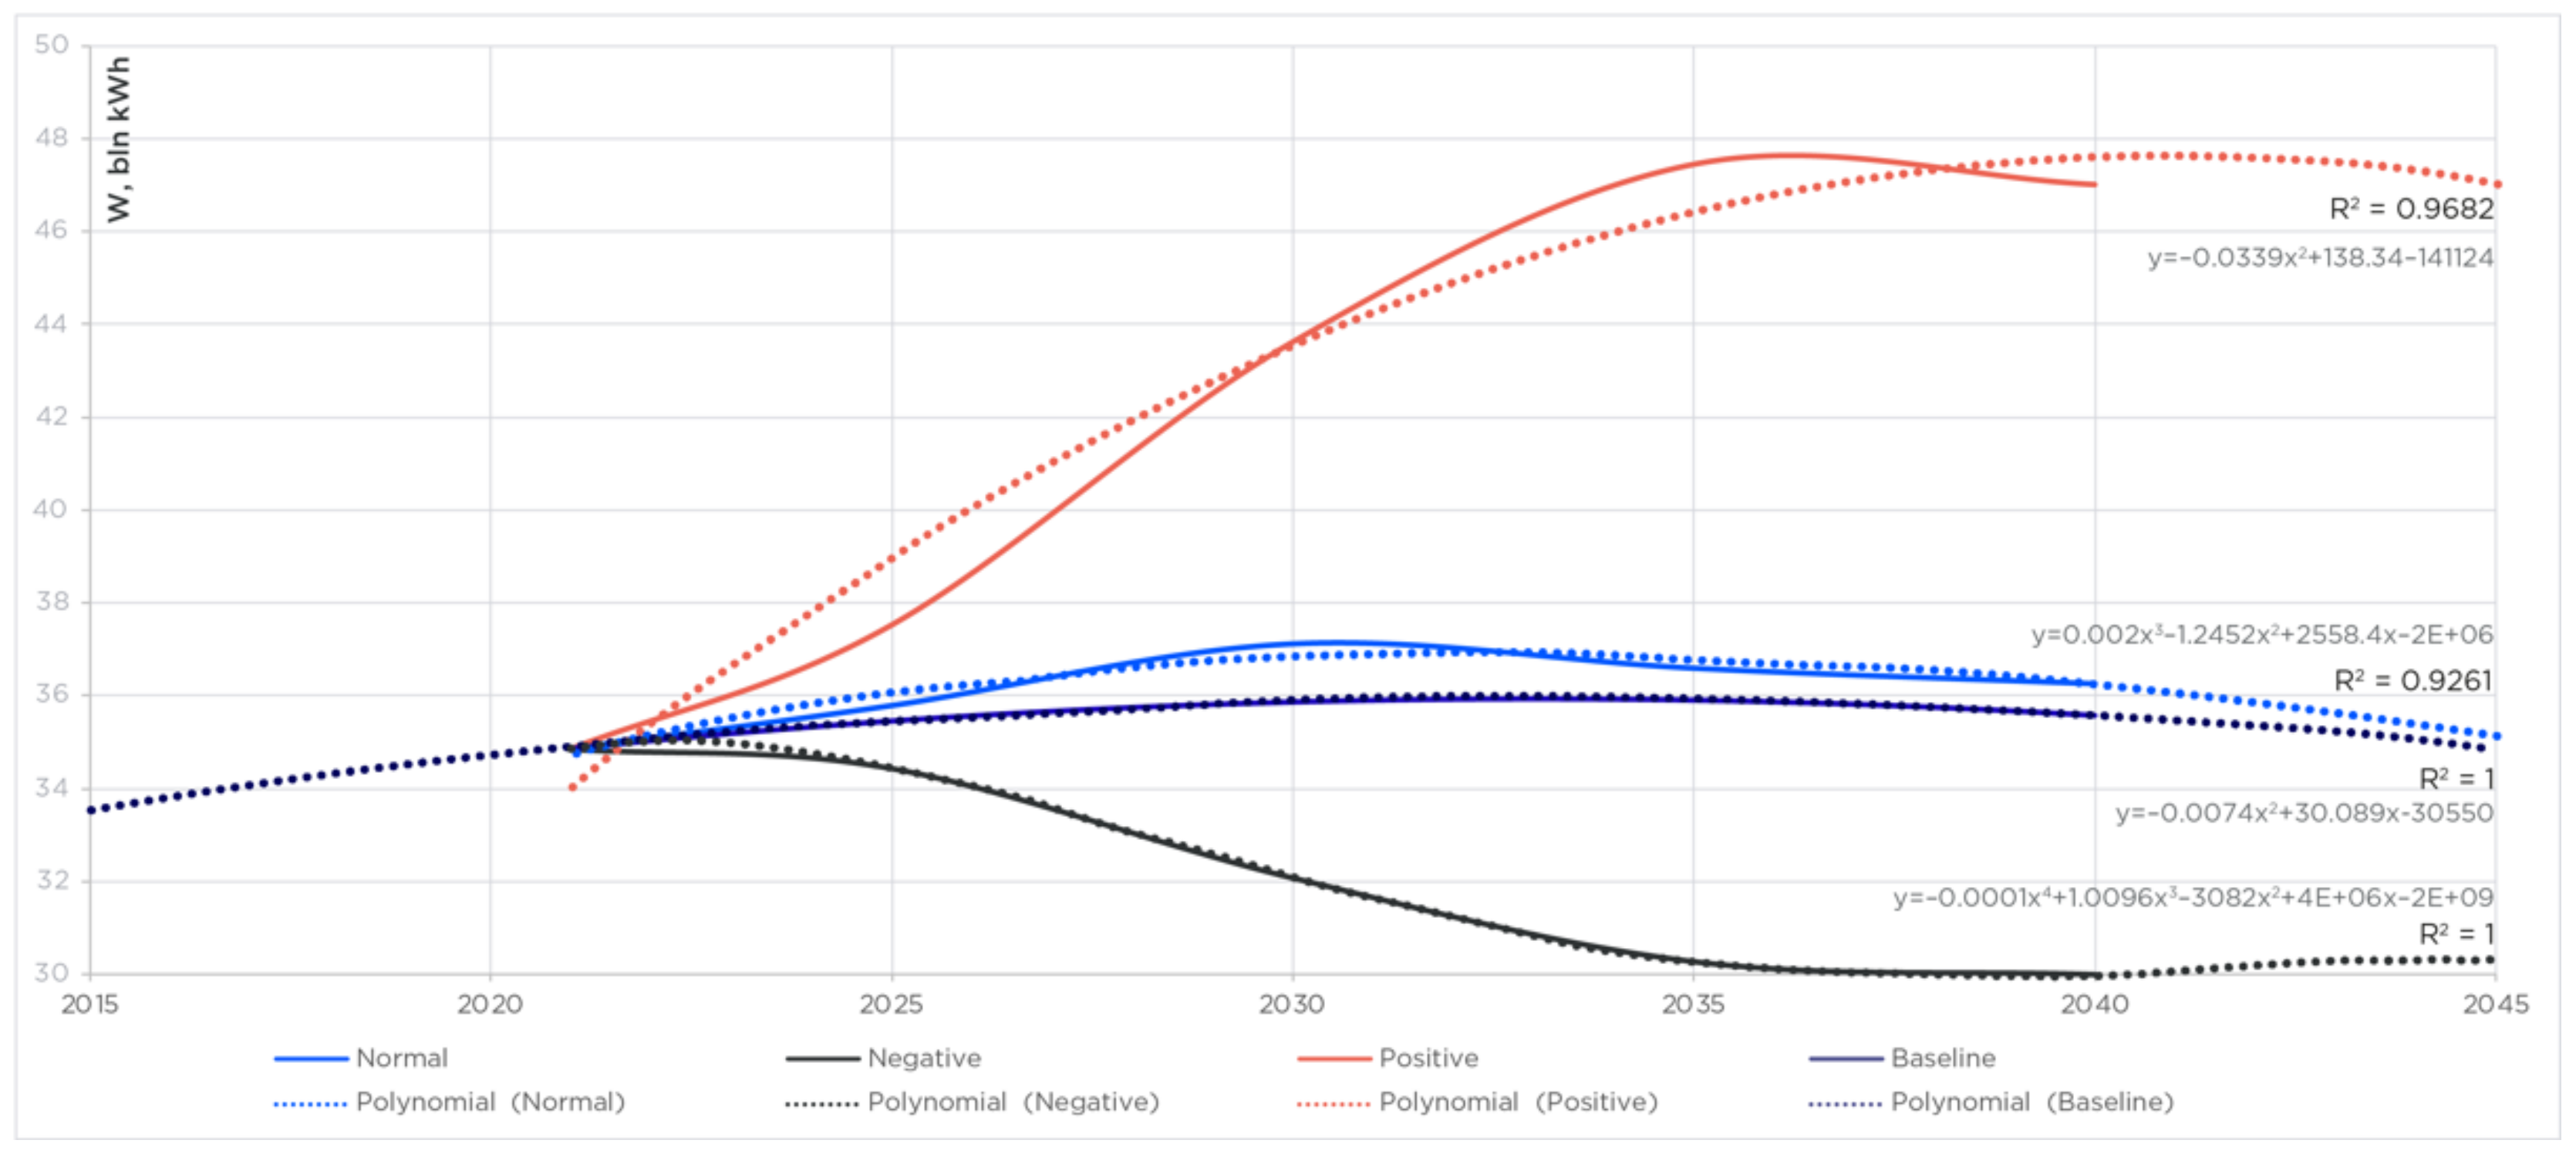
  • Step 1: Calculation of the generalized risk impact factor Kn for each of the formed scenarios, based on the risk analysis and identified consumption trends from the processing of data on electricity consumption for the period 2010–2020;
  • Step 2: Calculation of the cumulative impact of risk on the development of Arctic consumers. Calculation of energy consumption W in three scenarios at different time ranges based on an assessment of the impact of global challenges on consumption trends;
  • Step 3: Calculation of energy consumption and distribution by types of consumers based on the calculation of the basic vector of the probability of development of a certain type of consumer Bvpn and the results of the calculation of the total weight coefficients of the connection between risks and types of arctic consumers RG;
  • Step 4: Calculation of the distribution of demand for resources between types of consumers based on the calculation of the basic vector of the probability of an increase in demand for resources Hvpn and the matrix of the relationship of weight coefficients of consumers with resources.

2.6. Mathematical Model of Scenario Forecasting

To formalize and establish the numerical values of the mutual influence of risks in different scenarios on the development of Arctic consumers, the interaction matrices compiled by the research participants were used [79]. The application of the method of interaction matrices makes it possible to identify the degree of mutual influence of the factors of the considered set and predict their behavior in the future. After analyzing and processing the results of the survey of the expert group, the risks were arranged on the plane (Figure 5) in accordance with the following axes:
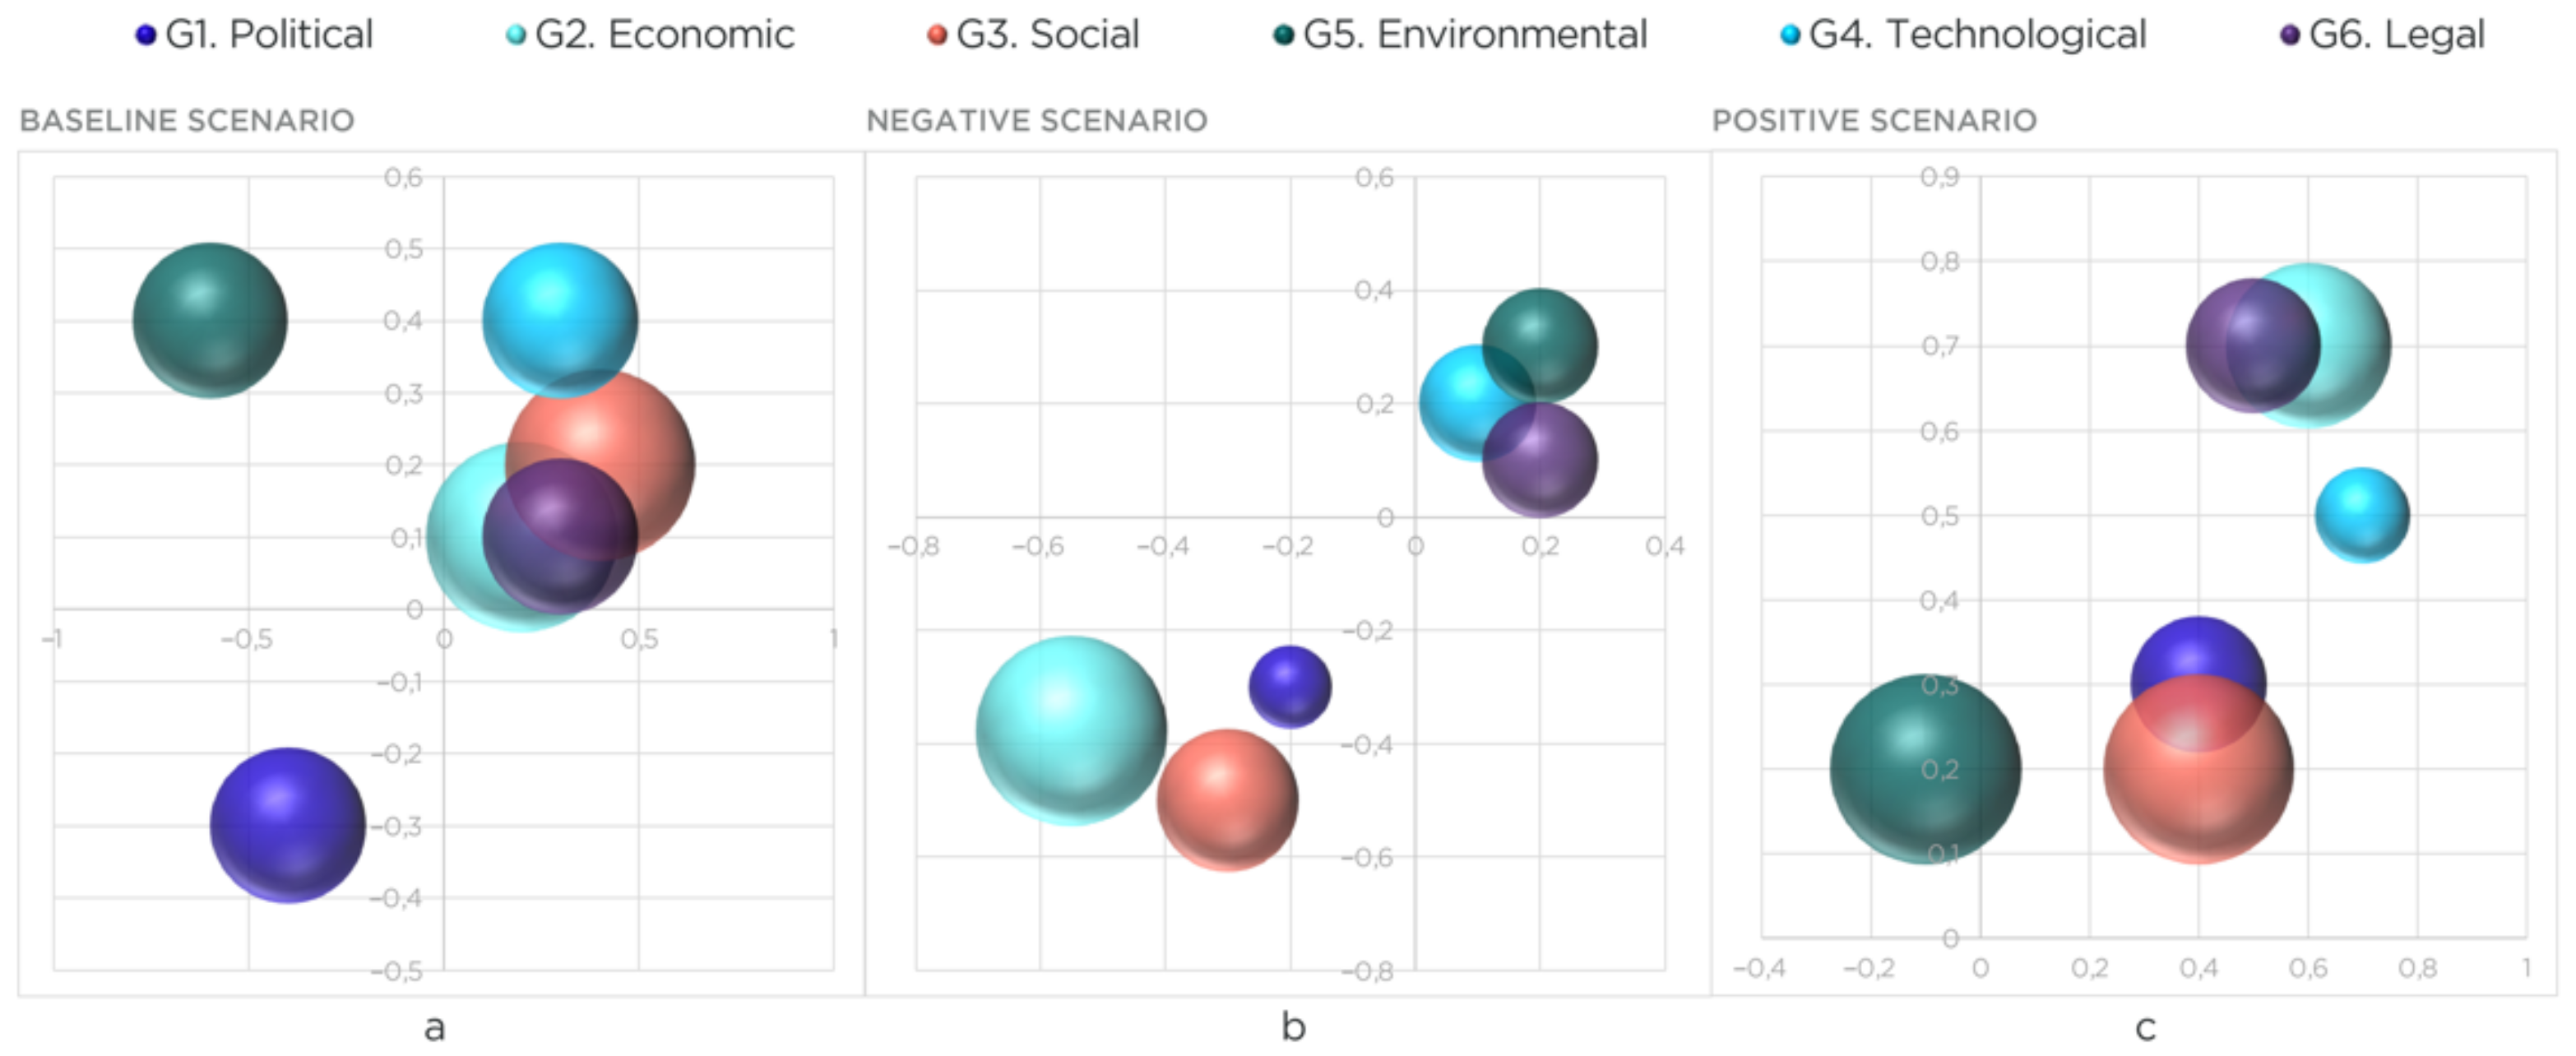
  • Ks is the axis of ordinates, the strength of the influence of risks on the development of arctic consumers; it takes values from −1 to 1 (strength decreases/increases);
  • Kd is the abscissa axis, the influence of risks on the rate of change in the number of consumers; it takes values from −1 to 1 (inhibits/accelerates);
  • S characterizes the size of the bubbles, which reflects the significance of the respective risk for the growth of energy consumption in the Arctic; takes values from 0 to 1.
Risk assessment varies depending on the scenario. The brainstorming session analyzed how risks would manifest themselves in negative, neutral, and positive scenarios.
It is important to note that we propose a methodology and demonstrate approaches to its implementation. When implementing the methodology in the future, the results will depend on the expert group; in this case, the forecast will be adjusted not in terms of the methods used, but in terms of expert opinion. The team of authors allows such a dependence, since the study is devoted to strategic planning, and it is necessary to use the knowledge of experts. The scenario conditions proposed by the authors are based on the study of risks and their impact, as well as on the assumptions of the development of certain risks for the worse or for the better, which is described in Table 3. The assessment and application of this approach were based on the literature, but specific assessments in the works are always different since they are formed on the basis of various scenarios. We propose a specific sequence of actions that allows for a more comprehensive assessment of future needs and the development of their sustainable provision.
It is also worth emphasizing that the matrix is dynamic; over time, it is possible to reassess the risks, since they are not static in nature, but undergo changes over the entire time interval considered in the study.
Based on the data of the interaction matrix, each group of risks (political, economic, social, technological, environmental, legal risks) is presented in the form of a generalized impact factor Kn, which is derived from the Formula (1):
K n = K S + K d S 2
Based on these interaction matrices, each of the scenarios can be represented in the form of a generalized influence coefficient Kn.
Based on the results of the analysis and calculations for each of the scenarios, the final generalized impact factor (total) can be found, which determines the final degree of significance of the three indicators of each risk group for the development of Arctic consumers and, consequently, the growth of energy consumption and demand for the construction of energy sources and energy infrastructure.
The results of calculations of the generalized coefficients of influence of risk groups and scenarios are presented in Table 4 and Figure 5.

2.6.1. Forecast Development of Consumer Types

The next stage of the study is to assess the impact of global challenges on the development of different types of consumers in the Arctic in order to further forecast the demand for energy by different consumers, taking into account the mutual influence of global challenges.
A total of nine types of consumers P1–P9 were identified (Table 5).
Based on the survey, the influence of risk groups on the development of consumers for different time ranges was determined. At the same time, the processing of questions about the impact of risks at different time intervals was carried out. Coefficients take values from 0 to 1 in increments of 0.01. Taking into account the ranges, three effects were identified: 0.3 characterizes a weak effect; the range 0.3–0.6 corresponds to the medium effect conditions; 0.61 is in the context of a strong effect. It should be noted that these values were averaged for all experts, excluding observations with incomplete information about the main types of consumers. Thus, we obtained weighting coefficients, which allow assessing the degree of risk impact on the development of energy consumers (Table 6).
Further, the total weighting coefficients of the relationship between risks and types of Arctic consumers were summarized in Table 7.
Based on the final weight coefficients of the connection between risks and types of consumers, the forecast of energy demand for consumers at different time ranges is determined.
The value of the base vector of the probability of development of a certain type of consumers, obtained from a survey of experts, is used. This vector is normalized internally by Formula (2):
B v p n = B v p i i = 1 n B p i · 100
where Bvpi is the basic vector of the probability of development of the consumer species; Bvpn is the internal normalization of the basic vector of the probability of development of the consumer species.
The final forecast of energy demand growth for certain consumer types by years, taking into account scenarios, is calculated by Formula (3):
W i y n = W f t · ( 1 ± K n · R G j ) · B v p n i 100
where Wf(t) is the allocated trend of electricity consumption for the period preceding the forecast one. The available data on the consumption of the period from 2010 to 2020 on the territory of the Arctic were taken as the basis.
Table 8 shows the results of calculations of energy demand up to 2025. For other time intervals, similar calculations were made.
On the basis of the expression, which takes into account the energy consumption change on the time interval and the normalized total risk influence, the distribution of the energy consumption increase (decrease) by consumer types was obtained.
Thus, at this stage, the prognosticated development of consumer types and the associated scenario change in energy consumption are justified.

2.6.2. Forecast for Resource Use Development

For the scenario study, the main resource types were considered: fuel oil, gas, coal, LNG and compressed natural gas (CNG), nuclear, nontraditional, and renewable energy sources, associated petroleum gas, and hydrogen H1–H9 (Table 9).
The energy requirements (Table 1) of consumers determine the strength of the connection with the types of resources based on their criteria (Table 2). The table of weight coefficients is compiled based on the results of processing the experts’ evaluation of the connection. According to the results of the analysis and comparison of consumers’ requirements and characteristics of resource types, the connection matrix is compiled (Table 10). The highest value indicates a more appropriate choice and compliance with the resource to provide the given type of consumers, taking into account the fullest satisfaction of requirements. The coefficients take values from 0 to 1 in increments of 0.001 and, with this in mind, range as 0.001–0.3, a weak relationship; 0.301–0.6, a medium degree relationship; 0.601–1, a strong relationship.
As a result of a survey of experts, it was proposed to put the strength of influence and the direction of the influence of risks on the development of bases, then the assessment was averaged and entered into the appropriate cell. The expert assessments in the questionnaire were processed in the standard way adopted for this approach [79].
Changes in demand for certain types of consumers in the Arctic will determine changes in the demand for energy resources. For this purpose, based on the table of weight coefficients of connection between consumers and resources, the forecast of energy demand from a certain type of resource was determined.
Forecasting the increase in demand for energy resources (4) was carried out taking into account the basic vector of the probability of an increase in demand for resources (Hvi) and its internal normalization (Hvn). This vector was obtained on the basis of survey data. Then we modeled the connection matrix of electricity consumers and resources in the form of normalized vector (Lvn), which corrects the forecast of demand for certain types of resources and reflects the competitive distribution as a result of the scenario conditions but does not change the value of total demand.
H i = Δ W i y n f t · H v i n · L v i n · 100 i = 1 n H v i n · L v i n
where ΔWiynf(t)—changes in energy consumption, taking into account the scenario conditions in the allocated time range.
Table 11 shows the results of the calculations of scenario forecasting of an increase or decrease in demand for resources in the time interval 2020–2025. Similar calculations were conducted for other time intervals.

3. Results and Discussion

Figure 6 presents the results of the forecast of energy consumption by the Arctic consumers based on the scenario conditions and risks, where three scenarios of development of electricity consumption and the process of change in the fuel and energy balance in the Arctic for the period from 2021 to 2035 are considered.
The R2 value—the coefficient of determination is the difference between the unit and the proportion of unexplained variance. This coefficient is applicable to determine the degree of correspondence between one random variable and many others. R2 can be calculated automatically using, for example, standard MS Excel tools, as was done by the authors of the article.
The results of the calculated determination coefficients prove that the obtained mathematical model for predicting energy consumption using the developed hybrid method corresponds to the data from [80] sufficiently and does not contradict them. Relying on the available data on energy consumption by consumers in the Arctic, made it possible to carry out the initial iterations of the model tuning. In turn, this made it possible to impose on the collected database the influence of risks migrating over time.
Figure 7 shows the results for the distribution of the projected increase in energy consumption by type of consumers, which takes into account the energy consumption change on the time interval and the normalized total risk influence. The results indicate that the increase in electricity will be mainly due to data processing centers, hydrocarbon deposits and logistics clusters in neutral and positive scenarios. The growth will peak in the 2030s. Following the same scenarios there will be a degeneration of settlements based on industry. During the period under consideration, from 2021 to 2035, the volume of energy consumption will change mainly due to an increase or decrease in the demand for gas depending on the scenario variant of the Arctic zone development. The high potential of gas use is due to the large reserves of this resource in the Arctic and the developed infrastructure of gas pipelines in its territory. Thus, natural gas will occupy a leading position in the structure of the Arctic fuel and energy balance.
Accepting the positive development scenario as the best in terms of sustainability, a rather high contribution to the increase of energy consumption will be made by unconventional energy sources, such as atomic and hydrogen energy. The use of nuclear energy in the Arctic has proven its validity and effectiveness in the case of small and floating nuclear power plants. The results of the prognosis point to the development of hydrogen fuel as a new perspective energy source, which is planned to be produced based on the Kola NPP in the Murmansk Region and Yakutia, as well as on pilot sites in the Yamal-Nenets Autonomous District; and to start supplying LNG in nuclear tankers to remote Arctic areas. If the scenario is positive, there will be an increase in demand for LNG use, although this increase will not have a significant impact on the fuel and energy balance of the Arctic. Following the trend of decarbonization, the development of RESs will continue, but the increase in these resources is not comparable in volume with other resources under consideration, so it is not reflected in the simulation results. The largest increase in energy consumption will be achieved in 2030 due to gas, which is due to the planned gasification of the regions. The share of petroleum products will decrease and become equal to the share of hydrogen fuel. Such diversification of the resource mix will allow not to disturb the sensitive ecosystem of the Arctic and ensure an innovative breakthrough in Russia’s energy industry, as well as the country’s competitiveness in the market of clean fuels.
The model allowed taking into account not only the growth but also the decline of certain types of consumers under different scenarios. There is a noticeable increase in energy consumption of data centers, which is due to the emergence of new strategic and economic facilities, which will appear by 2025–2030 (supply of the NSR, SSH, military bases, research bases). Similarly, the demand for hydrocarbon deposits will increase, as the Arctic has a large potential of natural resources, which are already being exploited, and the development and emergence of technologies specialized for the Arctic conditions will have a high demand for energy consumption. Investment in the NSR, SSH, and the development of ports, railways, and highways will also be an impetus to increase the energy consumption of logistics clusters in the Arctic. The model clearly shows a drop in energy demand in single-industry towns. This can be explained by their low attractiveness to their current state and the prospect of attracting residents to live in these cities permanently is not observed. Consequently, we can conclude that mono-cities with the existing infrastructure and economy are a dead end, and in the Arctic, such development of territories is ineffective. Figure 8 shows the results of scenario forecasting of an increase or decrease in demand for resources at the corresponding time intervals.
The results showed that demand for hydrogen will increase over time due to loyalty and investment in hydrogen by large companies, as well as the emergence of infrastructure and research centers adapted to hydrogen fuel. Also, demand for gas, APG, LNG, and CNG will increase as LNG and CNG transportation campaigns will continue to roll out. The emergence of small NPPs and the prospect and approval by the Russian government of floating NPPs will be a step toward the growing demand for nuclear power in the Arctic. Demand for petroleum products will decrease due to the risks of spills leading to large fines, sanctions, and restrictions, which reduces the competitiveness of these fuels (fuel oil, diesel) compared to others. In the next 5–10 years, coal will still be in demand as a fuel for the Arctic, but gradually the demand for its use will start to fall.
Thus, scenario modeling of the impact of risks due to global challenges on the development of consumers in the Arctic, and the assessment of changes in demand for energy resources will allow tracing the mutual influence of risks, taking into account the scenario conditions on energy supply technology. This, in its turn, makes it possible to identify, through resources, the key technologies necessary for energy supply to Arctic consumers, taking into account all efficiency requirements while reducing the negative impact on the environmental situation in the region to achieve the goals of sustainable development.

4. Conclusions

Energy supply to consumers must be built on the principles of reliability, availability, and flexibility. Our research follows these principles and focuses on the consumer, considering his characteristics and needs. Energy supply also depends on the availability of resources, and our study answers this question using the potential of the region under consideration. The process of energy supply in the Arctic region should be considered as a single interconnected structure, where different types of consumers and energy sources are codependent. We have proposed a strategic planning approach based on the classification and analysis of the above variables, considering the opinion of experts, and scenario modeling of factors. The application of the relationship between consumer characteristics and the criteria for resources distinguishes our method from others. We understand that authors may encounter some limitations when repeating this technique. The risk groups identified in this study are applicable to the designated growth zones of the Russian Arctic. However, the technique is universal, which makes it possible to apply it in other studies, where their own risk groups and an expert group will be distinguished according to the specific request of the authors. Among the limitations, it is also worth highlighting that this approach does not consider the limitations caused by the infrastructure necessary to create conditions for the supply of energy with one or another resource in certain regions. The exact location of the growth in needs is also currently not determined by this method, which does not allow creating the necessary incentives for development at the regional level.
We would also like to emphasize that the study has great potential for development, among a number of urgent tasks for future work, the following can be distinguished: presentation of factor analysis of risks, which will allow us to assess the dynamics of changes in risks over time, as well as to highlight the group of the most significant risks and their relationship with each other; solution of the optimization problem: regional optimal distribution of resources with the least carbon dioxide emissions and financial investments. In addition, research on limiting the use of various resources, especially hydrogen, is promising.

Author Contributions

Conceptualization, A.B. and Y.M.; methodology, and Y.M.; validation, A.K.; formal analysis, A.B. and Y.M.; investigation, A.S. and A.K.; writing-original draft preparation, A.B., A.K. and Y.M.; writing—review and editing, Y.Z. and P.T.; visualization, A.B. and Y.Z.; supervision, data curation P.T.; project administration, Y.Z. All authors have read and agreed to the published version of the manuscript.

Funding

The research was carried out with the financial support of the grant by the President of the Russian Federation for the state support of leading scientific schools of the Russian Federation, the number of the project NSh-2692.2020.5 “Modelling of ecological-balanced and economically sustainable development of hydrocarbon resources of the Arctic”.

Conflicts of Interest

The authors declare no conflict of interest.

References

  1. Cherepovitsyn, A.; Rutenko, E.; Solovyova, V. Sustainable Development of Oil and Gas Resources: A System of Environmental, Socio-Economic, and Innovation Indicators. J. Mar. Sci. Eng. 2021, 9, 1307. [Google Scholar] [CrossRef]
  2. Tcvetkov, P. Climate Policy Imbalance in the Energy Sector: Time to Focus on the Value of CO2 Utilization. Energies 2021, 14, 411. [Google Scholar] [CrossRef]
  3. Delakhova, A.M.; Grigoriev, E.P. Analysis of peculiarities of the food supply of the population of the northern regions. Vector Econ. 2021, 11, 244–248. [Google Scholar]
  4. President of Russia. Decree of the President of the Russian Federation of October 26, 2020. “Strategy of Development of the Arctic Zone of the Russian Federation and Ensuring National Security for the Period Up to 2035”. Available online: http://www.kremlin.ru/acts/bank/45972 (accessed on 18 October 2021).
  5. NAVY. Northern Fleet. Operational-Strategic Association of the Russian Navy. Available online: https://flot.com/nowadays/structure/north/ (accessed on 18 October 2021).
  6. TASS. ROSATOM Plans to Start Producing Hydrogen at Kola NPP in 2023. Available online: https://rosatom.ru/journalist/smi-about-industry/rosenergoatom-planiruet-v-2023-godunachat-proizvodstvo-vodoroda-na-kolskoy-aes/ (accessed on 18 October 2021).
  7. Chan, F.T.; Stanislawczyk, K.; Sneekes, A.C.; Dvoretsky, A.; Gollasch, S.; Minchin, D.; David, M.; Jelmert, A.; Albretsen, J.; Bailey, S.A. Climate change opens new frontiers for marine species in the arctic: Current trends and future invasion risks. Glob. Chang. Biol. 2019, 25, 25–38. [Google Scholar] [CrossRef] [PubMed]
  8. Tolvanen, A.; Eilu, P.; Juutinen, A.; Kangas, K.; Kivinen, M.; Markovaara-Koivisto, M.; Naskali, A.; Salokannel, V.; Tuulentie, S.; Similä, J. Mining in the arctic environment—A review from ecological, socioeconomic and legal perspectives. J. Environ. Manag. 2019, 233, 832–844. [Google Scholar] [CrossRef]
  9. Treharne, R.; Bjerke, J.W.; Tømmervik, H.; Stendardi, L.; Phoenix, G.K. Arctic browning: Impacts of extreme climatic events on heathland ecosystem CO2 fluxes. Glob. Chang. Biol. 2019, 25, 489–503. [Google Scholar] [CrossRef] [Green Version]
  10. Abahussain, M.M.; Christie, R.D. Optimal scheduling of a natural gas processing facility with Price-based Demand Response. In Proceedings of the 2013 IEEE Power & Energy Society General Meeting, Vancouver, BC, Canada, 21–25 July 2013. [Google Scholar] [CrossRef]
  11. Zendehboudi, A.; Baseer, M.; Saidur, R. Application of support vector machine models for forecasting solar and wind energy resources: A review. J. Clean. Prod. 2018, 199, 272–285. [Google Scholar] [CrossRef]
  12. Walser, T.; Sauer, A. Typical load profile-supported convolutional neural network for short-term load forecasting in the industrial sector. Energy AI 2021, 5, 100104. [Google Scholar] [CrossRef]
  13. Sánchez-Úbeda, E.F.; Berzosa, A. Modeling and forecasting industrial end-use natural gas consumption. Energy Econ. 2007, 29, 710–742. [Google Scholar] [CrossRef]
  14. Foldvik Eikeland, O.; Bianchi, F.M.; Apostoleris, H.; Hansen, M.; Chiou, Y.-C.; Chiesa, M. Predicting Energy Demand in Semi-Remote Arctic Locations. Energies 2021, 14, 798. [Google Scholar] [CrossRef]
  15. Brazovskaia, V.; Gutman, S.; Zaytsev, A. Potential Impact of Renewable Energy on the Sustainable Development of Russian Arctic Territories. Energies 2021, 14, 3691. [Google Scholar] [CrossRef]
  16. Selina, V.S.; Skufyina, T.P.; Bashmakova, E.P.; Toropushina, E.E. North and the Arctic in the new paradigm of world development: Current problems, trends, prospects. In Scientific and Analytical Report; KCN RAS: Apatity, Russia, 2016; p. 420. [Google Scholar]
  17. Official Information Portal of the Republic of Sakha (Yakutia). Decree of the Head of the Republic of Sakha (Yakutia) “On the Strategy of Social and Economic Development of the Arctic Zone of the Republic of Sakha (Yakutia) for the Period Up to 2035” of August 14, 2020 y. №1377. Available online: https://www.sakha.gov.ru/news/front/view/id/3204989 (accessed on 19 October 2021).
  18. Zhukovskiy, Y.L.; Batuyeva, D.E.; Buldysko, A.D.; Gil, B.; Starshaia, V.V. Fossil Energy in the Framework of Sustainable Development: Analysis of Prospects and Development of Forecast Scenarios. Energies 2021, 14, 5268. [Google Scholar] [CrossRef]
  19. National Research Council. Hidden Costs of Energy: Unpriced Consequences of Energy Production and Use; The National Academies Press: Washington, DC, USA, 2020. [Google Scholar] [CrossRef]
  20. Van der Roest, E.; Snip, L.; Fens, T.; van Wijk, A. Introducing Power-to-H3: Combining renewable electricity with heat, water and hydrogen production, and storage in a neighborhood. Appl. Energy 2020, 257, 114024. [Google Scholar] [CrossRef]
  21. Olkuski, T.; Suwała, W.; Wyrwa, A.; Zyśk, J.; Tora, B. Primary energy consumption in selected EU Countries compared to global trends. Open Chem. 2021, 19, 503–510. [Google Scholar] [CrossRef]
  22. IEA. Material Efficiency in Clean Energy Transitions. 2019. Available online: https://iea.blob.core.windows.net/assets/52cb5782-b6ed-4757-809f-928fd6c3384d/Material_Efficiency_in_Clean_Energy_Transitions.pdf (accessed on 20 October 2021).
  23. Tcvetkov, P. Small-scale LNG projects: Theoretical framework for interaction between stakeholders. Energy Rep. 2022, 8 (Suppl. 1), 928–933. [Google Scholar] [CrossRef]
  24. Dvoynikov, M.; Buslaev, G.; Kunshin, A.; Sidorov, D.; Kraslawski, A.; Budovskaya, M. New Concepts of Hydrogen Pro-duction and Storage in Arctic Region. Resources 2021, 10, 3. [Google Scholar] [CrossRef]
  25. Cherepovitsyn, A.; Evseyeva, O. Parameters of Sustainable Development: Case of Arctic Liquefied Natural Gas Projects. Resources 2021, 10, 1. [Google Scholar] [CrossRef]
  26. Litvinenko, V. The Role of Hydrocarbons in the Global Energy Agenda: The Focus on Liquefied Natural Gas. Resources 2020, 9, 59. [Google Scholar] [CrossRef]
  27. Worku, G.; Teferi, E.; Bantider, A.; Dile, Y.T. Prioritization of watershed management scenarios under climate change in the Jemma sub-basin of the Upper Blue Nile Basin, Ethiopia. J. Hydrol. Reg. Stud. 2020, 31, 100714. [Google Scholar] [CrossRef]
  28. Jefferson, M. Scenario planning: Evidence to counter ‘Black box’ claims. Technol. Forecast. Soc. Chang. 2020, 158, 120156. [Google Scholar] [CrossRef]
  29. Megan, M.G.; George, W. Delphi Method. Wiley StatsRef Stat. Ref. Online 2016, 1–6. [Google Scholar] [CrossRef]
  30. Linzenich, A.; Zaunbrecher, B.; Ziefle, M. “Risky transitions?” Risk perceptions, public concerns, and energy infrastructure in Germany. Energy Res. Soc. Sci. 2020, 68, 101554. [Google Scholar] [CrossRef]
  31. Shove, E. Time to rethink energy research. Nat. Energy 2020, 6, 118–120. [Google Scholar] [CrossRef]
  32. Chen, K.; Ren, Z.; Mu, S.; Sun, T.; Mu, R. Integrating the delphi survey into scenario planning for China’s renewable energy development strategy towards 2030. Technol. Forecast. Soc. Chang. 2020, 158, 120157. [Google Scholar] [CrossRef]
  33. Jones, A.W. Perceived barriers and policy solutions in clean energy infrastructure investment. J. Clean. Prod. 2015, 104, 297–304. [Google Scholar] [CrossRef] [Green Version]
  34. Cherepovitsyn, A.E.; Lipina, S.A.; Evseeva, O.O. Innovative approach to the development of mineral and raw material potential of the Arctic zone of Russia. Notes Min. Inst. 2018, 232, 438–444. [Google Scholar] [CrossRef]
  35. Filatova, I.; Nikolaichuk, L.; Zakaev, D.; Ilin, I. Public-private partnership as a tool of sustainable development in the oil-refining sector: Russian case. Sustainability 2021, 13, 5153. [Google Scholar] [CrossRef]
  36. Volkov, A.V.; Bortnikov, N.S.; Lobanov, K.V.; Galyamov, A.L.; Chicherov, M.V. Deposits of strategic metals of the Arctic region. In Proceedings of the Fersman Scientific Session of the Institute of the KSC RAS 2019, Apatity, Russia, 7–10 April 2019; Volume 16, pp. 80–84. [Google Scholar] [CrossRef]
  37. Nikishin, A.M.; Petrov, E.I.; Cloetingh, S. Arctic Ocean Mega Project: Paper 3—Mesozoic to Cenozoic geological evolution. Earth-Sci. Rev. 2021, 217, 103034. [Google Scholar] [CrossRef]
  38. Litvinenko, V.S.; Dvoynikov, M.V.; Trushko, V.L. Elaboration of a conceptual solution for the development of the Arctic shelf from seasonally flooded coastal areas. Int. J. Min. Sci. Technol. 2021, 1. [Google Scholar] [CrossRef]
  39. Fedoseyev, S.V.; Tsvetkov, P.S. Key factors in public perception of carbon dioxide capture and disposal projects. Proc. Min. Inst. 2019, 237, 361–368. [Google Scholar] [CrossRef]
  40. GoArctic. The Arctic of Megaprojects: What’s Changing in the Regions. Available online: https://goarctic.ru/society/arktika-megaproektov-chto-menyaetsya-v-regionakh/ (accessed on 20 October 2021).
  41. Chelnokova, I. The Arctic. Northern contradictions. Kommersant 2020, 224, 25. [Google Scholar]
  42. Institute for Applied Political Solutions. Analytical Report “Single-Industry” Towns in the Arctic Zone of the Russian Federation: Problems and Opportunities for Development”. Available online: http://www.arcticandnorth.ru/Encyclopedia_Arctic/monogoroda_AZRF.pdf (accessed on 19 October 2021).
  43. Ranking of Sustainable Development of the Regions of the Russian Arctic. Available online: https://www.econ.msu.ru/sys/raw.php?o=73806&p=attachment (accessed on 19 October 2021).
  44. Khramchikhin, A.A. Military and political situation in the Arctic and possible prospects for its development. Vestnik MSTU 2014, 3, 606–615. [Google Scholar]
  45. Government of Russia. Decree of the Government of Russian Federation from 24.05.2021 № 1338-p “On Equipping the Arctic Aviation Units of EMERCOM of Russia with Aviation Equipment”. Available online: http://government.ru/news/42301/ (accessed on 20 October 2021).
  46. Ministry of the Russian Federation for the Development of the Far East and the Arctic. Development of Distributed Geo- Nergy in FEFD and Arctic: The Profile Committee of the State Duma Supported the Proposals of FERC. Available online: https://minvr.gov.ru/press-center/news/32116/ (accessed on 18 October 2021).
  47. Young, R.O. Arctic Futures–Future Arctics? Sustainability 2021, 13, 9420. [Google Scholar] [CrossRef]
  48. Chanysheva, A.; Kopp, P.; Romasheva, N.; Nikulina, A. Migration Attractiveness as a Factor in the Development of the Russian Arctic Mineral Resource Potential. Resources 2021, 10, 65. [Google Scholar] [CrossRef]
  49. Carayannis, E.G.; Ilinova, A.; Cherepovitsyn, A. The Future of Energy and the Case of the Arctic Offshore: The Role of Strategic Management. J. Mar. Sci. Eng. 2021, 9, 134. [Google Scholar] [CrossRef]
  50. Chanyasheva, A.; Ilinova, A. The Future of Russian Arctic Oil and Gas Projects: Problems of Assessing the Prospects. J. Mar. Sci. Eng. 2021, 9, 528. [Google Scholar] [CrossRef]
  51. Corell, R.; Kim, J.D.; Kim, Y.H.; Moe, A.; VanderZwaag, D.L.; Young, O.R. (Eds.) Arctic Resource Development: Economics and Politics. In The Arctic in World Affairs: A North-Pacific Dialogue on Global-Arctic Interactions; Korea Maritime Institute: Busan, Korea; East-West Center KMI and EWC: Honolulu, HI, USA, 2019; pp. 205–224. [Google Scholar]
  52. Sterner, M.; Specht, M. Power-to-Gas and Power-to-X—The History and Results of Developing a New Storage Concept. Energies 2021, 14, 6594. [Google Scholar] [CrossRef]
  53. Gurieff, N. Power-to-X Renewable Resource Ecosystems. Sustainability 2020, 12, 8554. [Google Scholar] [CrossRef]
  54. Roscongress. Healthcare in the Arctic: Results of Two Years and New Goals. Available online: https://roscongress.org/news/zdravoohranenie-arktiki-itogi-dvuh-let-i-novye-tseli/ (accessed on 18 October 2021).
  55. Roscongress. Arctic Tourism in Russia Has a Chance. Available online: https://roscongress.org/materials/u-arkticheskogo-turizma-v-rossii-poyavilsya-shans (accessed on 17 October 2021).
  56. Sychev, Y.A.; Zimin, R.Y. Improving the quality of electricity in the power supply systems of the mineral resource complex with hybrid filter-compensating devices. J. Min. Inst. 2021, 247, 132–140. [Google Scholar] [CrossRef]
  57. Lavrenko, S.A.; Shishljannikov, D.I. Performance evaluation of heading-and-winning machines in the conditions of potash mines. Appl. Sci. 2021, 8, 3444. [Google Scholar] [CrossRef]
  58. Al-falahi Monaaf, D.A.; Jayasinghe, S.D.G.; Enshaei, H. A review on recent size optimization methodologies for standalone solar and wind hybrid renewable energy system. Energy Convers. Manag. 2017, 43, 252–274. [Google Scholar] [CrossRef]
  59. Turysheva, A.; Voytyuk, I.; Guerra, D. Estimation of Electricity Generation by an Electro-Technical Complex with Pho-toelectric Panels Using Statistical Methods. Symmetry 2021, 13, 1278. [Google Scholar] [CrossRef]
  60. Our World in Data. CO2 Emissions by Fuel. Available online: https://ourworldindata.org/emissions-by-fuel (accessed on 20 October 2021).
  61. EIA. Levelized Costs of New Generation Resources in the Annual Energy Outlook 2021. Available online: https://www.eia.gov/outlooks/aeo/pdf/electricity_generation.pdf (accessed on 20 October 2021).
  62. IEA. Projected Costs of Generating Electricity. Available online: https://www.oecd-nea.org/upload/docs/application/pdf/2020-12/egc-2020_2020-12-09_18-26-46_781.pdf (accessed on 20 October 2021).
  63. Bloomberg. Cost of Capital Spikes for Fossil-Fuel Producers. Available online: https://www.bloomberg.com/news/articles/2021-11-09/cost-of-capital-widens-for-fossil-fuel-producers-green-insight (accessed on 21 October 2021).
  64. IEA. The Oil and Gas Industry in Energy Transitions. Available online: https://www.iea.org/reports/the-oil-and-gas-industry-in-energy-transitions (accessed on 23 October 2021).
  65. IEA. Energy Technology Perspectives. Available online: https://iea.blob.core.windows.net/assets/7f8aed40-89af-4348-be19-c8a67df0b9ea/Energy_Technology_Perspectives_2020_PDF.pdf (accessed on 20 October 2021).
  66. Phebe, A.O.; Samuel, A.S. A review of renewable energy sources, sustainability issues and climate change mitigation. Co-Gent Eng. 2016, 3, 1–14. [Google Scholar] [CrossRef]
  67. Gartner. Emerging Technology Roadmap for Large Enterprises 2020–2022. Available online: https://emtemp.gcom.cloud/ngw/globalassets/en/information-technology/documents/benchmarks/emerging-tech-roadmap-le-2020-2022.pdf (accessed on 19 October 2021).
  68. McKinsey Digital. The Top Trends in Tech. Available online: https://www.mckinsey.com/business-functions/mckinsey-digital/our-insights/the-top-trends-in-tech (accessed on 20 October 2021).
  69. BloombergNEF. New Energy Outlook 2021. Available online: https://about.bnef.com/blog/getting-on-track-for-net-zero-by-2050-will-require-rapid-scaling-of-investment-in-the-energy-transition-over-the-next-ten-years/ (accessed on 20 October 2021).
  70. Gartner. Top Strategic Technology Trends for 2021. Available online: https://emtemp.gcom.cloud/ngw/globalassets/en/information-technology/documents/insights/top-tech-trends-ebook-2021.pdf (accessed on 20 October 2021).
  71. Hannan, M.A.; Al-Shetwi, A.Q.; Begum, R.A.; Ker, P.J.; Rahman, S.A.; Mansor, M.; Mia, M.S.; Muttaqi, K.M.; Dong, Z.Y. Impact assessment of battery energy storage systems towards achieving sustainable development goals. J. Energy Storage 2021, 42, 103040. [Google Scholar] [CrossRef]
  72. Hannan, M.A.; Faisal, M.; Ker, P.J.; Begum, R.A.; Dong, Z.Y.; Zhang, C. Review of optimal methods and algorithms for sizing energy storage systems to achieve decarbonization in microgrid applications. Renew. Sustain. Energy Rev. 2020, 131, 110022. [Google Scholar] [CrossRef]
  73. Tung, K.-K.; Zhou, J. Using data to attribute episodes of warming and cooling in instrumental records. Proc. Natl. Acad. Sci. USA 2012, 110, 2058–2063. [Google Scholar] [CrossRef] [PubMed] [Green Version]
  74. Kohn, N.W.; Smith, S.M. Collaborative fixation: Effects of others’ ideas on brainstorming. Appl. Cogn. Psychol. 2010, 25, 359–371. [Google Scholar] [CrossRef]
  75. Anthony, J.; Gibson, A. Sustainability in Engineering Design; Academic Press: Waltham, MA, USA, 2014. [Google Scholar]
  76. Al-Samarraie, H.; Hurmuzan, S. A review of brainstorming techniques in higher education. Think. Ski. Creat. 2018, 27, 78–91. [Google Scholar] [CrossRef]
  77. Vasilyeva, N.V.; Boikov, A.V.; Erokhina, O.O.; Trifonov, A.Y. Automated digitization of radial charts. J. Min. Inst. 2021, 247, 82–87. [Google Scholar] [CrossRef]
  78. Koteleva, N.; Buslaev, G.; Valnev, V.; Kunshin, A. Augmented Reality System and Maintenance of Oil Pumps. Int. J. Eng. 2020, 33, 1620–1628. [Google Scholar] [CrossRef]
  79. Shabalov, M.Y.; Zhukovskiy, Y.L.; Buldysko, A.D.; Gil, B.; Starshaia, V.V. The influence of technological changes in en-ergy efficiency on the infrastructure deterioration in the energy sector. Energy Rep. 2021, 7, 2664–2680. [Google Scholar] [CrossRef]
  80. Rosstat. Available online: https://rosstat.gov.ru (accessed on 20 October 2021).
Figure 1. Linking the Sustainable Development Goals, technological trends and tendencies, and the resources under consideration for energy supply in the Russian Arctic.
Resources 10 00124 g001
Figure 2. Research Methodology.
Resources 10 00124 g002
Figure 3. Structure of the fuel and energy balance of the Arctic region.
Resources 10 00124 g003
Figure 4. Methodology for constructing a mathematical model of scenario forecasting.
Resources 10 00124 g004
Figure 5. Results of PESTEL-risk analysis under different scenarios:(a) neutral scenario with K = 0.095; (b) negative scenario with K = 0.21; (c) positive scenario with K = 0.585.
Resources 10 00124 g005
Figure 6. Forecast of energy consumption by Arctic consumers, billion kW·h.
Resources 10 00124 g006
Figure 7. Distribution of the projected increase in energy consumption by type of consumers.
Resources 10 00124 g007
Figure 8. Results of resource demand forecasting.
Resources 10 00124 g008
Table 1. Requirements for consumers.
Type of ConsumerReliability CategoryRequired Installed CapacityCarbon FootprintMobilitySeasonality, m
Logistics hubsFirstLargeRegulations on reduction (international market)Stationary0–12
Sanitary unit
Hospital
Second
First special
Small
Small
Voluntary agreementsMobile
Stationary
0–12
12
Scientific basesSecondSmallRegulation on reductionVariable mobility0–12
Agricultural complexesFirst (second)MediumVoluntary agreementsStationary0–12
Military basesFirst specialLarge/MediumNo requirement for reductionsStationary/mobile12
DPCsFirst specialLargeVoluntary agreementsStationary/mobile12
Single-industry townsThirdMediumRegulation on reductionStationary12
Mining and oil & gas enterprisesDepends on the raw material. First, first special, second [56,57]LargeRegulation on reductionStationary/mobile12
Tourist basesThirdSmallRegulation on reductionVariable mobility0–4
Table 2. Criteria for resources.
ResourceCriteria
CAPEXCO2LCOENPV
Fuel oil4512
Gas5325
Coal4533
LNG and CNG5224
Nuclear5245
ARES4234
Associated petroleum gas4434
Diesel4533
Hydrogen5234
Table 3. Description of scenarios.
Title 1202520302035
Negative scenario
“Cold Menace”
1. Virus development and mutation—not being able to financially overcome the vaccine race;
2. Reduction of energy consumption by 5% annually;
3. Oil price of $50–60/barrel;
4. A set of measures to support new fields at the level of 20% profit tax and 15% mineral extraction tax;
5. Lack of transparent regulation and certainty in the FEC and MRC;
6. Lack of international investment in Arctic development projects.
1. Reduction of the industry of offline culture and public events;
2. Minimum consumption of energy and services;
3. High volatility of prices for energy resources—lack of investments in projects to develop new fields;
4. Oil price $40–55/barrel;
5. Lack of possibility to enter foreign markets due to sanctions pressure;
6. World trade declines by 3–5% annually.
1. The energy poverty of the countries;
2. Lack of any investments in energy infrastructure, and their subsequent outflow;
3. Growing risks of man-made accidents and lack of funds to eliminate natural disasters;
4. Oil price 40–50 USD/bbl;
5. Increase in social tensions;
6. Low level of innovation, education, and culture.
Neutral scenario“Northern Outcast”1. Containment of coronavirus infection without significant quarantine restrictions;
2. Electricity consumption increases by 40%;
3. Energy intensity of GDP does not change, specific consumption per capita grows by 1%;
4. Export restrictions—instability of mineral and energy supplies;
5. Stabilization of energy consumption at the same level, without regard to environmental and climatic situation;
6. Increase in global energy by 1–3% annually.
1. The lack of the former level of international trade in resources due to the import substitution race;
2. Inability to fix the carbon footprint;
3. Taking and holding leadership positions in creating international transport and logistics systems, and developing and using the Arctic is impossible;
4. Maximum oil price—$55–65/barrel;
5. Carbon footprint of energy resources is not a reference point for the energy supply of consumers;
6. Emergence of conflicts over resource shortages due to climate change;
7. Military build-up.
1. The development of territories is carried out at the expense of orientation on the domestic market;
2. The growth of investment in research and development is up to 8%;
3. Threat of development of Arctic territories because of cataclysms, caused by global warming;
4. Set of measures to support new mines at the level of 10% income tax and 10% mineral extraction tax.
Positive scenario
“Energy Awakens”
1. Leveling the negative consequences of the crisis and quarantine measures;
2. Restoring the disrupted supply chain of energy, materials, and goods;
3. Sustainable development of the FEC and MRC in the Arctic on the basis of digital technologies [77,78];
4. Oil price—$70+/barrel in all scenarios;
5. Renewal of fixed assets in the energy sector and network infrastructure;
6. Growth of global trade by 3–5% annually;
7. Set of support measures at the level of 0–3% profit tax and 4–5% mineral extraction tax.
1. Formation and development of ecologically and socially oriented points of growth;
2. Growth of demand for new technologies and equipment in the Arctic;
3. Infrastructural and legislative opportunities for small and medium businesses to locate in the AZRF;
4. Transparency and openness to internal and external consumer markets through digital technology;
5. Scientific and technological breakthrough at the global level through digital integration of stakeholders;
6. Emergence of a window of opportunity for companies supplying technologies;
7. Increase of R&D investments up to 20% relative to 2021 due to appearance of venture capital.
1. Coordinated development of the Arctic through international planning, funding, and regulatory frameworks;
2. Digital transformation in the management of the life cycle of energy and mineral resources in the Arctic;
3. The emergence of digital industries, smart factories, and high-tech spaces that operate through platform solutions;
4. Sustainability and reliability of energy supply to the Arctic consumers through new approaches to resource supply to consumers;
5. Innovative rebirth of the Arctic FEC and MRC into a high-tech and efficient infrastructure, providing quantitative and qualitative growth of the Russian economy.
Table 4. Values of generalized coefficients of influence Kn.
Risk GroupKn (Neutral Scenario)Kn (Negative Scenario)Kn (Positive Scenario)
G1. Political−0.07−0.0250.07
G2. Economic0.045−0.250.195
G3. Social0.09−0.120.12
G4. Technological0.070.030.06
G5. Environmental−0.080.050.02
G6. Legal0.040.030.12
Total0.095−0.2850.585
Table 5. Symbolic designation of Arctic consumers.
Type of CustomerP
Military basesP1
Hydrocarbon depositsP2
Settlements (single-industry towns)P3
Scientific research basesP4
Logistics clustersP5
Medical basesP6
Agricultural complexesP7
Tourist centersP8
Data Processing Centers (DPCs)P9
Table 6. Impact of risks in consumer development in 2020–2025.
Type of CustomerPG1G2G3G4G5G6Cumulative Impact of Risk RYi
Military basesP10.3−0.20.070.10.01−0.020.0433
Hydrocarbon depositsP2−0.280.170.110.14−0.40.11−0.043
Settlements (single-industry towns)P30.01−0.32−0.210.12−0.40.04−0.127
Scientific research basesP40.050.180.040.030.20.090.098
Logistics clustersP5−0.30.12−0.10.2−0.080.30.023
Medical basesP60.070.16−0.30.01−0.10.06−0.016
Agricultural complexesP70.060.150.110.07−0.220.050.036
Tourist centersP8−0.40.10.080.04−0.060.04−0.033
Data Processing Centers (DPCs)P90.310.150.250.2−0.350.120.113
Total 0.094
Table 7. Total weighting coefficients of the relationship between risks and types of Arctic consumers.
G1–G6 (2020–2025)G1–G6 (2025–2030)G1–G6 (2030–2035)G1–G6 (2035+)
RGj0.0940.1010.370.55
Table 8. Forecast of energy consumption by type of consumer by 2025.
Type of CustomerPBasic Vector of Probability Based on the SurveyNeutral Scenario (2020–2025),
Billion kW·h
Negative Scenario (2020–2025)
Billion kW·h
Positive Scenario (2020–2025)
Billion kW·h
Military basesP10.7606065.0411476514.8495071955.288262977
Hydrocarbon depositsP20.9121216.0453594075.8155435956.341700847
Settlements (single-industry towns)P30.6939394.5992918284.4244486284.824747533
Scientific research basesP40.6575764.3582849834.1926037174.571926615
Logistics clustersP50.6909094.5792095814.4051298134.803680861
Medical basesP60.4757583.1532308773.0333600363.307801171
Agricultural complexesP70.4090912.7113750532.608301472.844285727
Tourist centersP80.3424242.269519232.1832429032.380770283
Data Processing Centers (DPCs)P90.4575763.0327241412.9174343933.181387236
Total 35.7901427537.12047936.59403675
Table 9. Symbolic designation of resources.
Type of ResourceH
Fuel oilH1
GasH2
CoalH3
LNG and CNGH4
NuclearH5
ARESH6
APGH7
DieselH8
HydrogenH9
Table 10. Matrix of connection of weight coefficients of consumers with resources.
H/PP1P2P3P4P5P6P7P8P9
H10.860.50.550.570.10.30.10.10.1
H20.80.940.870.650.870.670.670.770.64
H30.860.760.560.450.580.340.220.10.1
H40.890.30.670.340.560.340.780.820.34
H50.670.920.450.340.870.320.450.340.89
H60.760.560.780.880.450.670.780.890.68
H70.30.80.50.40.760.450.650.430.78
H80.890.320.450.540.230.340.210.20.12
H90.780.560.670.450.670.560.780.670.9
Table 11. Results of calculations of scenario forecasting of demand for resources by 2025.
Type of ResourceHHv Base Probability Vector Based on the SurveyHvn Internal Normalization of Basic Probability VectorLvn Normalization with Connection to Consumer TypesNeutral Scenario
(2020–2025),
Billion kW·h
Negative Scenario
(2020–2025),
Billion kW·h
Positive Scenario
(2020–2025),
Billion kW·h
Fuel oilH10.76060614.08537.0385133.1559581223.0371602923.309144796
GasH20.91212116.8911315.227988.188137997.8799168478.585581042
CoalH30.69393912.850728.7870743.5946447623.4593337163.769124795
LNG and CNGH40.65757612.1773311.155384.3243478584.1615690394.534246863
NuclearH50.69090912.7946111.620194.7328677174.554711234.962595818
ARESH60.4757588.81033314.276234.0039629353.8532441714.198310814
APGH70.4090917.57575911.221782.7062762122.6044054882.83763583
DieselH80.3424246.3411857.3041171.474423941.4189230881.545990828
HydrogenH90.4575768.4736313.368753.6061554643.4704111283.781194214
Total100%100%35.78677534.43967537.523825
Publisher’s Note: MDPI stays neutral with regard to jurisdictional claims in published maps and institutional affiliations.

