Article

Interlinkages between Government Resources Management, Environmental Support, and Good Public Governance. Advanced Insights from the European Union

by
Gratiela Georgiana Noja
1,
Mirela Cristea
2,*,
Eleftherios Thalassinos
3,4 and
Marta Kadłubek
5
1
Department of Marketing and International Economic Relations, Faculty of Economics and Business Administration, West University of Timisoara, 16 Pestalozzi Street, 300115 Timisoara, Romania
2
Department of Finance, Banking and Economic Analysis, Faculty of Economics and Business Administration, University of Craiova, 13 A I Cuza Street, 200585 Craiova, Romania
3
Faculty of Maritime and Industrial Studies, University of Piraeus, 185-33 Piraeus, Greece
4
Faculty of Economics, Management and Accountancy, University of Malta, 2080 Msida, Malta
5
Department of Logistics and International Management, Faculty of Management, Czestochowa University of Technology, Al. Armii Krajowej 19 B, 42-200 Czestochowa, Poland
*
Author to whom correspondence should be addressed.
Resources 2021, 10(5), 41; https://doi.org/10.3390/resources10050041
Submission received: 25 March 2021 / Revised: 21 April 2021 / Accepted: 28 April 2021 / Published: 30 April 2021

Abstract

:
Good governance requires efficiency and effectiveness in public sector management, a sound legal framework, enhanced coordination, credibility, and transparency of the actions that support financial stability. Connecting these actions, there are significant interlinkages between government spending management and economic development. The research conducted within this paper is set to assess the overall relationships within general government spending management, with a keen focus on government support for environmental protection and good public governance at the European Union (EU) level. The study investigates the cumulative effects of good public governance dimensions on economic welfare and poverty lessening. The dataset covers the period 1995–2017, and the methodological credentials are based on the structural equation modelling technique. The main results indicate that not only does government expenditure (including environmental support) shape good public governance, but the enhancements in good governance dimensions also have important spillovers on government spending regarding significant bidirectional connections. As for the overall implications, the estimations show that only general government expenditure has induced welfare increases, while environmental support does not generate the same positive effects. Ultimately, the all-embracing impact of considered governance dimensions is beneficial, leading to a downsizing of poverty within the EU.

1. Introduction

The concept of “governance”, as introduced by the World Bank [1], illustrates how the government manages to accomplish its actions within society to support economic and social development. Furthermore, “good governance” emphasizes “a set of principles and conditional prerequisites for countries to strengthen the functional capacity of the public bodies” [1] (p. 2), and also the well-grounded and reliable actions deployed by the government to enhance sustainable economic growth. Given the differences between countries regarding the wider areas of government quality [2,3], diverse strands of thoughts have demonstrated the importance of good public governance, rational public expenditure, efficient allotment of public financial resources, and targeted measures for increased economic welfare. These credentials are even more important nowadays in the management of the global public health crisis brought about by the Covid-19 pandemic and associated economic risks. In terms of research, it is essential to develop accurate measurement instruments of good public governance and solid empirical evidence that can be used to strengthen knowledge in this scientific field and to deploy tailored strategies in the public sector. A keen significance of the research performed across time led to building up specific composite indicators to measure public governance dimensions, “namely, the practices and activities of public authorities conducted by their institutions” [4] (p. 6).
With reference to good governance dimensions, there are several examples of their allotment, as follows: (i) the World Bank classification [5] of six dimensions, comprised of the Worldwide Governance Indicators (WGIs), namely, “Voice and Accountability, Political Stability and Absence of Violence/Terrorism, Government Effectiveness, Regulatory Quality, Rule of Law, and Control of Corruption” [6] (p. 6); (ii) the United Nations [7] (p. 1) grouping of eight dimensions: “participation, rule of law, transparency, responsiveness, consensus orientation, equity, effectiveness and efficiency, and accountability and strategic vision”; (iii) the Overseas Development Institute [8], which also groups the good governance components into six dimensions: “participation, fairness, decency, accountability, transparency, and efficiency”, named World Governance Assessment (WGA). Among these dimensions and measurement proxies, the WGIs have received great recognition.
Governance support implies the general government expenditure (spending) and government resources denoted by public financial allocation, which, according to the “Classification of the functions of government (COFOG)”, “COFOG I level”, includes the following main categories: “general public services; defense; public order and safety; economic affairs; environmental protection; housing and community affairs; health; recreation, culture and religion; education; and social protection” [9] (p. 37). A specific category of expenditure that holds an important place among the sustainable development goals (SDGs) [10] is represented by environmental protection, which, according to COFOG, covers the following components: “waste management; water management; pollution abatement; protection of biodiversity and landscape; R&D environmental protection; and environmental protection not elsewhere classified (n.e.c.)” [9] (p. 37).
Furthermore, across time, several studies have deepened the contributions on the relation between the WGIs and economic development (e.g., [11,12,13,14]), using different methodology, with significant results on these interlinkages. It is unanimously accepted that good governance embodies the cornerstone for ensuring economic development and poverty lessening (e.g., [15,16,17]). At the European level, investigations are made for specific groups of countries, such as Central and Eastern European (CEE) countries [13], Western Balkans states [18], or the entire European Union (EU) region [12]. However, to the best of our knowledge, none of them have considered/included the environmental protection support in relation to good governance and economic development.
Within this frame of references and different to the existing literature, this research is set to appraise the interlinkages (direct, both unidirectional, and bidirectional) between general government spending management, with a keen focus on government support for environmental protection, upon good public governance, on the one hand, and their cumulative effects (direct, indirect, total) on economic and social development (grasped by Gross Domestic Product (GDP) per capita increases and poverty lessening, as the main social indicator) on the other hand, at the level of the EU-28 Member States (MS). The analyzed period is 1995–2017. The research methodology searches for distinct Structural Equation Modelling (SEM) techniques to assess three research hypotheses in order to examine if: (i) there are significant direct effects of the general government spending and, respectively, of government spending on environmental protection, upon the good public governance; (ii) there are significant interrelations between general government spending and, respectively, government spending on environmental protection, and good public governance; and (iii) there are, overall (direct, indirect, total), significant (positive) effects of the public administration dimensions upon economic and social development (focusing on rising GDP and poverty lessening).
The study heightens the existing literature and contributes to the discussion with new integrative research and additional empirical evidence on the interplay between government spending management and government effectiveness, namely, the decisive role of public administration financial contributions, focusing on environmental protection expenditure, for good public governance, as well as for economic development and poverty lessening.
After a cursory presentation of the relevance of this topical subject of the concept of good governance, its widely used measurement units, the connections with government spending management, and the economic and social development, as appraised in the introduction, the remainder of this paper is organized as follows. Section 2 enhances the relevant findings in the literature related to the interplay between government spending management and good public governance, on the one hand, and the connection with economic and social development, on the other hand. Section 3 advances the data and methodology applied, based on specific patterns laid down on each of the three working hypotheses addressed. Section 4 encloses the results attained for the research directions, with substantial discussions. Section 5 brings to the fore the conclusive notes, followed by additional information in Appendix A, which show the empirical results.

2. Brief Literature Review

2.1. Public Government Spending Management and Good Governance: Interplay, Measurement

According to the World Bank [1], good governance requires efficiency and effectiveness in public sector management, enhanced accountability, a solid legal framework (the rule of law and participation), and transparency of information. Based on that, the literature asserts that public administration and governance have significant economic consequences, particularly if there is a lack of responsibility in managing public resources and sound measures targeted to maintain the balance between spending revenues and saving funds for the future [19,20,21]. Hence, these credentials have played a significant role in sharpening the economic and financial crisis of 2008–2010 [15,22,23] and the Eurozone crisis [15,24] and are increasingly important nowadays in the management of the global public health risks brought by the Covid-19 pandemic and associated forecasted economic crisis. These underpinnings entail the keen need for well-managed public administration expenditure in association with good governance.
Among the well-recognized dimensions of good governance [6,7,8], the composite indicators advanced by the World Bank for an accurate assessment of the six wide dimensions of government quality, namely, the WGIs [6], are the most used (being configured since 1996), but also criticized by some authors (e.g., [25]). WGIs are determined as ranks (scores), enclosed between the values of −2.5 to 2.5, the upper values being consonant with “better governance” [26]. Their computation revealed that the WGIs have been enrolled as a significant comparative basis within cross-country investigations, with meaningful results in estimating the differences between the governance dimensions [6,15]. Previous criticisms addressed [25] (p. 142) were based on the arguments of the data enclosed within the WGIs, namely, the fact that they “are based on perceptions, not actual data”. In response, Kaufmann et al. [6] (p. 3) argued that “the WGI permit meaningful cross-country comparisons and monitoring progress over time”. The WGIs critics recommended the necessity “to complement cross-country indicators with more detailed and objective data” [25] (p. 142).
The WGIs dimensions express the following perceptions [5]: “the extent to which a country’s citizens are able to participate in selecting their government, as well as freedom of expression, freedom of association, and a free media”, for Voice and Accountability; “the likelihood of political instability and/or politically motivated violence, including terrorism”, for Political Stability and Absence of Violence/Terrorism; “the quality of public services, the quality of the civil service and the degree of its independence from political pressures, the quality of policy formulation and implementation, and the credibility of the government’s commitment to such policies”, for Government Effectiveness; “the ability of the government to formulate and implement sound policies and regulations that permit and promote private sector development”, for Regulatory Quality; “the extent to which agents have confidence in and abide by the rules of society, and in particular the quality of contract enforcement, property rights, the police, and the courts, besides the likelihood of crime and violence”, for the Rule of Law component; and “the extent to which public power is exercised for private gain, including both petty and grand forms of corruption, as well as “capture” of the state by elites and private interests”, for Control of Corruption.
From a different perspective, Charron et al. [27] mapped the regions across the EU MS according to government quality by building the European Quality of Government Index (EQI), based on a survey applied in 2013. Thus, regions with the highest quality of government actions were in Denmark, the Netherlands, and Sweden, and the lowest in Romania, Italy, and Bulgaria.
Bogere and Mukaaru [15] stated that appraising public government expenditure for good governance leads to the ascertainment of the mutual linkages between the allocation of government spending management among various actors (political persons and public institutions) and good governance, in both directions. Additionally, it is important to identify the weaknesses in this synergy by measuring good governance through its impact on spending reassessment of public administrations.
Because WGIs are greatly influenced by general government expenditure, there are findings [28] (p. 26) attesting that “other than voice and accountability and regulatory quality coordinates, all WGI variables are highly significant and positively associated with the government expenditure”. Moreover, control of corruption is essential for raising environmental protection results by decreasing pollution [28,29]. Furthermore, Welsch [29] (p. 663) recommends that developing countries “improve both their economic and environmental performance by reducing corruption”.

2.2. Public Governance Management and Sustainable Socio-Economic Development

The analysis of causality relations addressed between public administration/good governance (as measured by the WGIs) and economic development are often comprised of studies and their findings, as revealed in the relevant literature. For example, Law et al. [11] assessed the bidirectional causality between the WGIs and economic development by applying the Granger causality test, and concluded that the WGIs enhance welfare in developed countries, while in the developing ones, this implication is reversed, namely, economic development strengthens good public governance.
Along the same lines, Law and Azman-Saini [30] have obtained robust results that attest positive implications of good governance upon financial development, particularly in the banking field. Other authors [14,31] appreciated that, when governance and development are assessed, a significant factor that needs to be taken into account is the level of democracy. In this configuration, the results show that, for Asian countries, “governance is typically higher in dictatorships than in countries that are partially democratized (electoral democracies)” [14] (p. 220). Still, once the democracy reaches a specific level, it further supports good governance. Hence, the implications of good public governance, measured by the WGIs, upon economic development, are straight-forward (one-way) for the so called “free” countries, such as South Korea and Taiwan, compared with those with limited or no democracy. Even more so, another factor that shapes the role of governance for sustainable economic development is the income level [31]. Therefore, WGIs become useful instruments for policy makers in their forecast of further economic development.
Among the six components of WGIs, Bilan et al. [12] assigned significant direct implications of the “Rule of Law” and “Regulatory Quality” upon the institutional quality of the social sector, with spillover positive effects onto economic development. Pere [18] (p. 38) analyzed the bidirectional impact among the WGIs and economic growth in the western Balkan countries for the period 1996–2012, and concluded that only a few dimensions of WGIs have affected the welfare; namely, “political stability, absence of violence, and the strengthening of law enforcement”.
Public government support management and good governance enhance socio-economic development and poverty reduction [4,15,16,17]. By investing in infrastructure and education as the main government targets, productivity can significantly increase, with a direct impact on poverty reduction [16]. Noja et al. [4] (pp. 14–15) have evidenced that, across the EU MS, there are three main dimensions of the WGIs that induce favorable implications upon the economic welfare, namely, “perceptions of people in deciding on their government, and the freedom of expression, association, and media” (Voice and Accountability), “the perceptions of having confidence in the rules of law” (Rule of law), and “the perceptions of the quality of public services” (Government Effectiveness).
Concerning corruption, there are positive implications upon economic development because it prevails on avoiding bureaucratic practices, hence increasing labor productivity [32,33], as well as negative effects by downsizing the quality of investments financed through “bad projects” by the banks [34] (p. 907), with cascade effects on economic development.
For CEE countries, “public sector quality induces growth only when it is accompanied by a small government size” [13] (p. 1612). The explanation for this relies on the fact that a large government body in developing countries decreases productivity.
In countries with high economic development but with low good governance, there is also weak environmental protection, meaning that “environmental damages of economic growth could be minimized by improving the different dimensions of the governance” [35] (p. 1101). Among the WGIs, five have strong effects on environmental protection related to economic growth for developing Asian countries, namely: “strengthening the government institutions, the rule of law, ensuring transparency, confirming the people participation and access to environmental information” [35] (pp. 1111–1112), with compelling factors to handle the environment issues. Enhancing public governance quality induces positive effects on environmental credentials for African regions as well [36].
Therefore, by reviewing the literature, several theoretical and practical guidelines are being outlined: between the public administration support and good governance dimensions there are strong interdependencies; the most used indicators to account for good governance dimensions are the WGIs; public administration and governance are also influenced by cultural characteristics, democracy, and income levels; there are strong connections between government expenditure, good governance and economic development, and poverty reduction; not all the dimensions of the WGIs have the same impact (positive or negative) upon economic development and poverty; and environmental support represents a central point in assessing the relationship between good governance-sustainable economic development-poverty reduction.

3. Data and Methodology

3.1. Data

Based on the main results and evidence encountered in the scientific literature, we have configured the dataset to enclose both public administration dimensions and socio-economic indicators, as follows:
  • governance indicators: “Total general government expenditure (% of GDP) (Gen_GOV_exp)”; “Expenditure of general government on environmental protection (% of GDP) (Env_GOV_exp)”; “Control of corruption (rank between −2.5 and 2.5) (COR_ctrl)”; “Government effectiveness (rank between −2.5 and 2.5) (GOV_effect)”; “Political stability and absence of violence/terrorism (rank between −2.5 and 2.5) (POL_stab)”; “Regulatory quality (rank between −2.5 and 2.5) (REG_quality)”; “Rule of law (rank between −2.5 and 2.5) (Rule_law)”; “Voice and accountability (rank between −2.5 and 2.5) (Voice_acc)”;
  • economic and social indicators: “GDP per capita (constant 2010 USD) (GDP_cap)”; “People at risk of poverty or social exclusion (% of population) (POV)”.
The data were extracted for the 1995–2017 period for all EU-28 MS, from Eurostat [37] (namely, general government expenditure and expenditure of general government on environmental protection), OECD [38] (for GDP per capita), and the World Bank-WGI [5] (for WGIs variables). Good public governance (GPG) is captured as a latent variable resulting from the six public administration dimensions/proxies (WGIs: “Control of corruption, Government effectiveness, Political stability and absence of violence/terrorism, Regulatory quality, Rule of law, Voice and accountability”) [5]. We selected these indicators, measured in standard normal units, to design the GPG based on Kaufmann et al. [26], who indicated that perceptions-based governance data sources tend to be more desirable than data observations because they “reflect the views on governance of survey respondents worldwide”, through the democratic participation of citizens, hence being closer to the GPG notion and “permitting meaningful cross-country and over-time comparisons” [26] (p. 2). Perception data have particular value in the measurement of governance because (i) “agents base their actions on their perceptions, impression, and views”, (ii) “in many areas of governance, there are few alternatives to relying on perceptions data”, (iii) “even when objective or fact-based data are available, often such data may capture the de jure notion of laws ‘on the books’, which often differs substantially from the de facto reality that exists ‘on the ground’” [26] (p. 18).
Descriptive statistics are detailed in Table 1.
The dimensions of good public governance across the EU in 2017 are graphically represented in Figure 1. The highest degree of government effectiveness (Figure 1b), associated with a strong corruption control (Figure 1a) and sound regulatory quality (Figure 1d) are significantly demonstrated by the Nordic Sates (Denmark, Finland, Sweden), Germany, the United Kingdom (UK), Netherlands, Austria, and France. These countries also register a high degree of voice and accountability (Figure 1f), citizens being able to participate in selecting their government, benefiting from freedom of expression, freedom of association, and a free media. At the opposite end of the spectrum, however, the EU MS in CEE, and also Italy and Spain, registered some of the lowest performances in terms of public governance, with a low level of government effectiveness (Figure 1b), scarce rule of law (Figure 1e), and faded regulatory quality (Figure 1d) and voice and accountability (Figure 1f). Political stability (Figure 1c), on the other hand, tends to be steadier in Hungary, Slovenia, the Slovak Republic, and Lithuania than in other EU countries such as France and the UK.
Considering the strong degree of positive correlation of the six composite measures of governance (WGIs) across EU countries, the adequacy of the WGIs in the assessment of GPG resides in the fact that these indicators “are based on several hundred variables obtained from 31 different data sources, capturing governance perceptions as reported by survey respondents, nongovernmental organizations, commercial business information providers, and public sector organizations worldwide” [26] (p. 2). The WGIs therefore capture the fundamental meanings of governance as “the traditions and institutions by which authority in a country is exercised” and include three main areas of interest regrading GPG, namely, “(a) the process by which governments are selected, monitored and replaced; (b) the capacity of the government to effectively formulate and implement sound policies; and (c) the respect of citizens and the state for the institutions that govern economic and social interactions among them” [26] (p. 4).
If we consider the dimensions related to general government spending (Figure 2a), the situation tends to remain unchanged as regards the differences between the old EU-15 MS and new EU-13 MS. There are notable government allocations in EU-15 countries (particularly in Sweden, Finland, Denmark, France, Belgium, Italy, and Austria) and relatively low government expenditures in EU-13 (especially in the Baltic States, Romania, and Bulgaria). Along the same lines, government financial efforts dedicated to protect the environment (Figure 2b) are extremely keen in most EU countries, except for the Nordic States (that rely on a very good environmental protection system), but also in Poland, Lithuania, Hungary, and Austria.
In this framework, there is an urgent need to reinforce and assess the connections between public spending management and good public governance, both general and in relation to environmental protection, by strengthening the literature with additional empirical evidence and new policy interventions.

3.2. Methodology

Because the literature highlights that the WGIs are greatly influenced by the general government expenditure [28], this research assesses how strong that connection is (direct, unilateral, and bilateral), focusing on environmental protection support as an important component of sustainability, but also the overall interlinkages among government expenditures, good governance, and economic and social development [15,16,17,35,39,40].
The working hypotheses (H), designed to accomplish the general objective, are the following:
Hypothesis 1 (H1).
There are significant direct effects of general government spending and, respectively, of government spending on environmental protection, upon good public governance.
Hypothesis 2 (H2).
There are significant interrelations between general government spending and, respectively, government spending on the environmental protection and good public governance.
Hypothesis 3 (H3).
There are overall (direct, indirect, total) significant (positive) effects of public administration dimensions upon economic and social development (focusing on rising GDP and poverty lessening).
For a proper comparison, the indicators enclosed in the dataset have been subject to the logarithm procedure in the initial stage of the research.
Further, the research methodology was configured and consists of several Structural/Simultaneous Equation Models (SEM) for each above-stated hypothesis. SEM models aim to assess the direct, indirect, and total interlinkages between government spending, good public governance credentials, and economic and social development. SEM models are configured through the general system of Equation (1) [41].
{ b 11 y 2 t + . . . . + b 1 m y m t + c 11 x 1 t + + c 1 n x n t = ε 1 t b 21 y 2 t + . . . . + b 2 m y m t + c 21 x 1 t + + c 2 n x n t = ε 2 t . . . . . . . . . . . . b m 1 y m t + . . . . + b m m y m t + c m 1 x n t + + c m n x n t = ε m t
where: “t is the number of observed time periods, bij represents the yij endogenous variable’s parameters, cij are the xij exogenous variable’s parameters, i = 1, …, m, j = 1, …, n; ε comprises the error term (residuals)” [41] (p. 115).
The models are designed from a dual presumption, namely both the bidirectional interplay between general and environmental public expenditures and good public governance, as well as the direct influence of government spending on good public governance, and further on economic welfare and poverty reduction. Good public governance (GPG) is captured as a latent variable resulting from the six WGI indicators (measured variables).
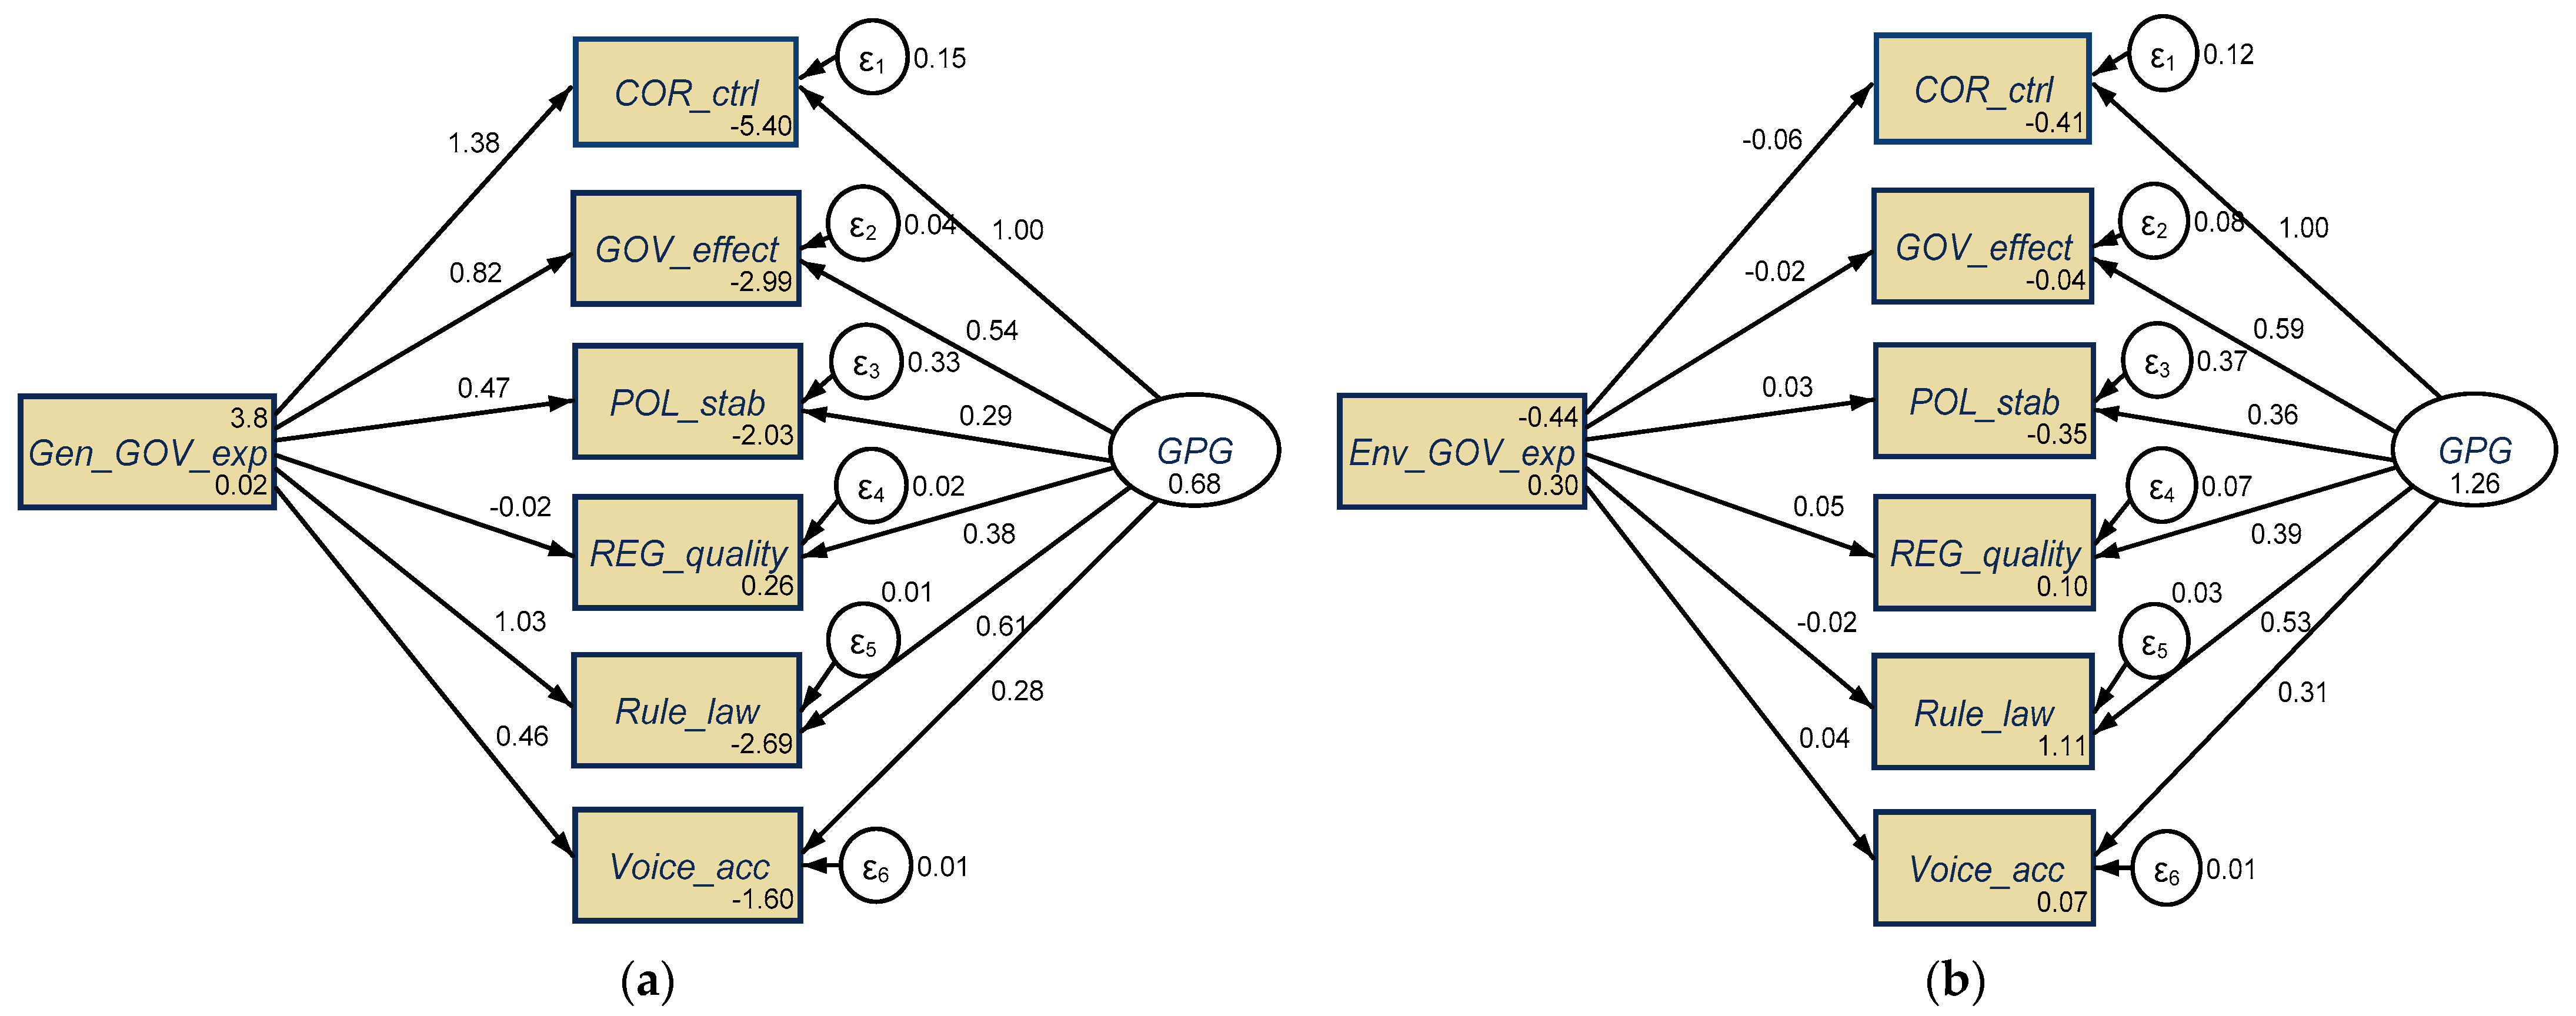
For the first hypothesis, H1: There are significant direct effects of general government spending and, respectively, of government spending on environmental protection, upon good public governance, we have developed the following SEM models (Figure 3).
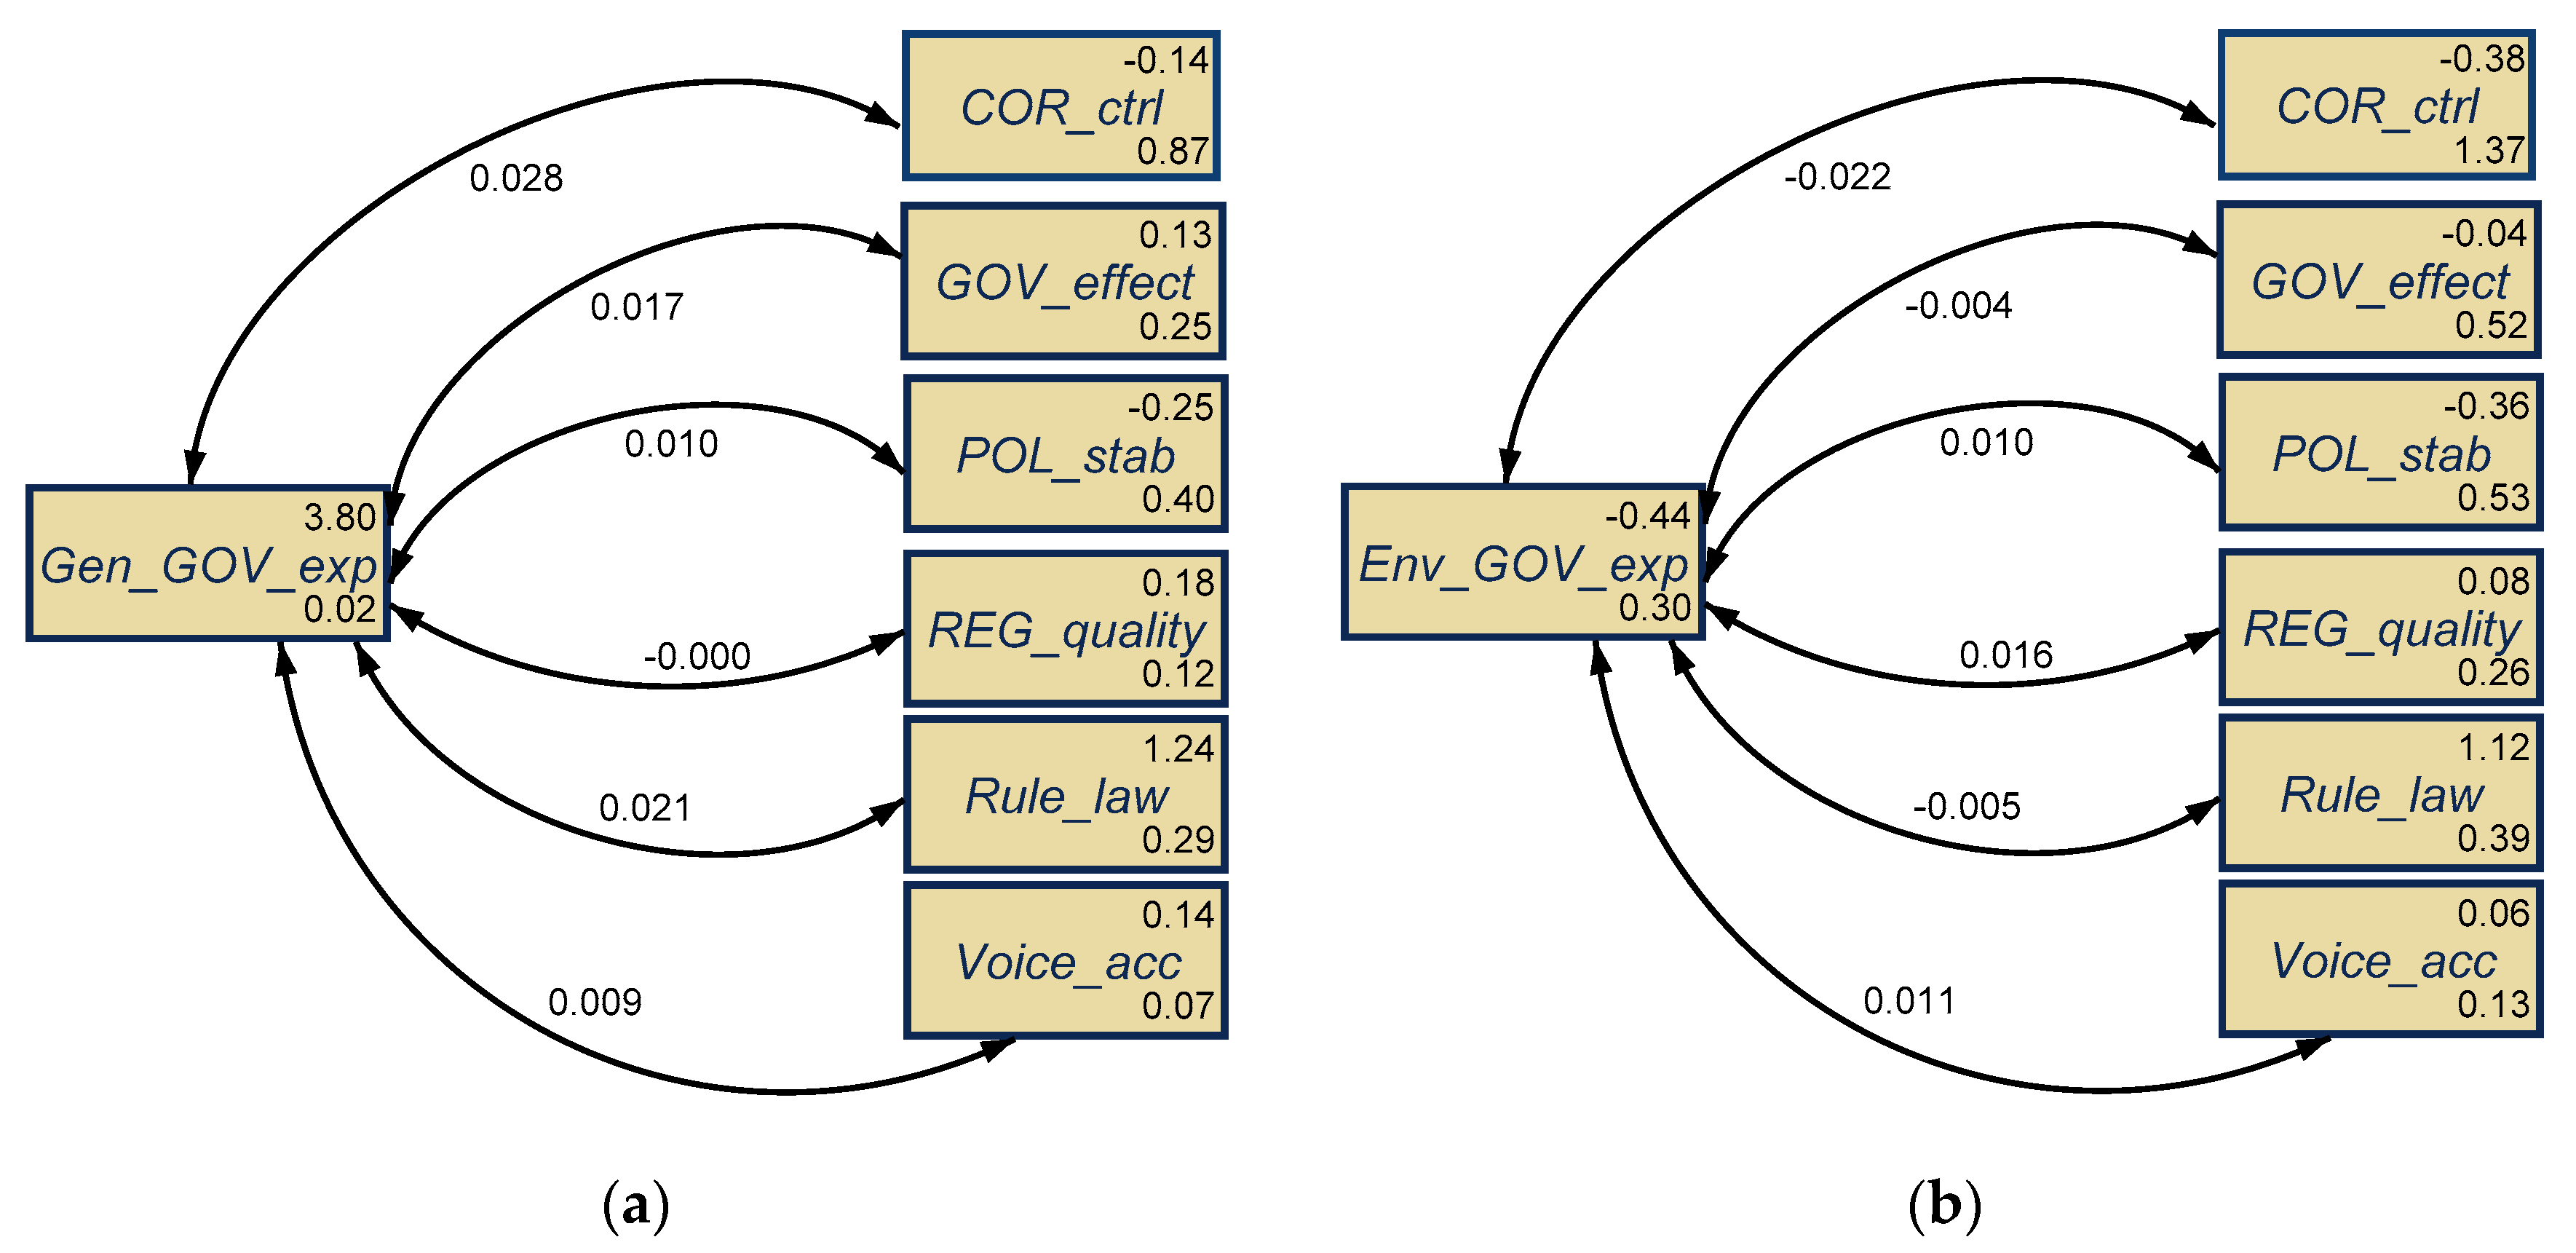
To verify the second hypothesis, H2: There are significant interrelations between general government spending and, respectively, government spending on environmental protection and good public governance, we have designed the following two SEM models, as shown in Figure 4.
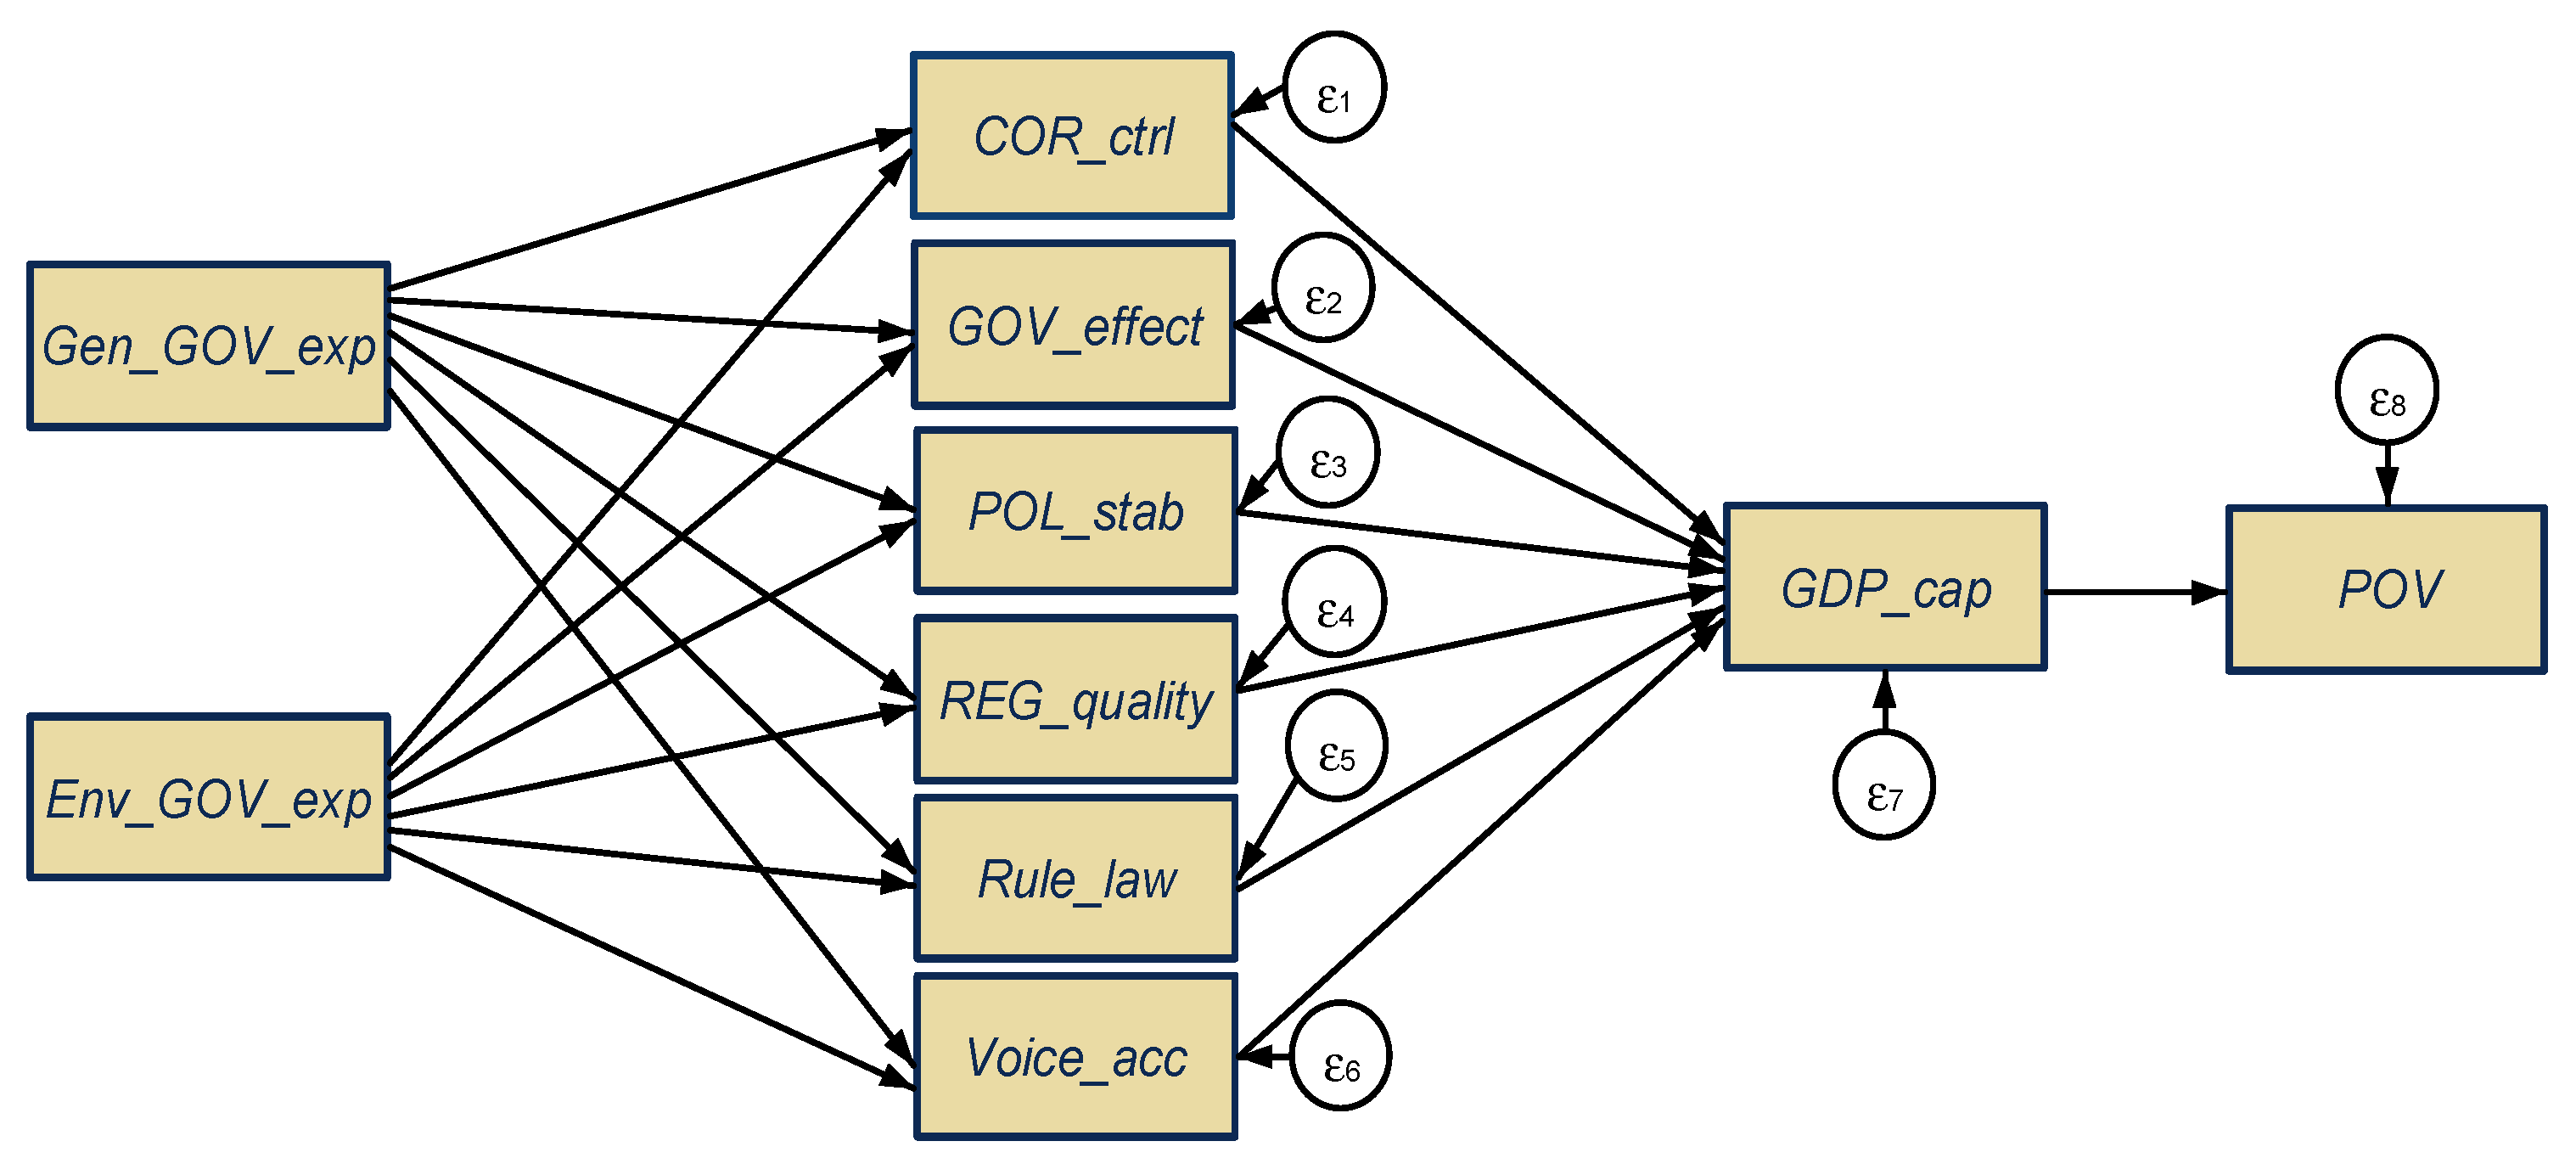
As regards the third hypothesis (H3): There are overall (direct, indirect, total) significant (positive) effects of the public administration dimensions upon economic and social development (focusing on rising GDP and poverty lessening), we have designed another SEM model, as shown in Figure 5.

4. Results and Discussions

SEM models processed to test the first hypothesis, to examine whether and to what extent government spending (both general and the share dedicated to protecting the environment) affects good public governance (GPG), were estimated using the Maximum Likelihood function (MLE) in Stata 16. The results are presented in Figure 6 and in Appendix A, Table A1.
For the first set of results, initiated from the significance at 1% LR-chi square statistic (96.88), other goodness of fit tests were further applied, along with Wald tests for each equation and Alpha Cronbach calculations for scale reliability. The significant RMSEA (0.145), the high value (close to 1) of CFI (0.973), and TLI (0.937), along with a valid SRMR (0.018) cover the issues highlighted by the LR statistic and, therefore, it can be concluded that the model fits well and suits the data with the assertion that the hypothesis is best captured by the fitted model. Similarly, the high value of CD (coefficient of determination, which acts like an R2 for the whole model) (0.984) indicates a good fit, indicating that over 90% of the variation in good public governance can be explained by the general government support (spending). Moreover, the significant Chi squares associated with the Wald tests for the equations and a high value of Cronbach’s Alpha (0.8641) strengthen scale reliability and model good fit.
The estimations (Figure 6a) highlight that an increase in general government spending generates significant increases in all public governance dimensions, thus leading to good public governance (GPG) at the level of EU MS. The direct influence is very strong and induces additional government effectiveness (GOV_effect, positive coefficient of 0.82, extremely significant at the 0.1% threshold), decisive improvements in corruption control (COR_ctrl, positive coefficient of 1.4, highly statistically significant at the 0.1% threshold), and political stability (POL_stab, positive coefficient of 0.47, statistically significant at the 5% threshold), along with essential refinement of agent confidence in the rules of society, and in particular the quality of contract enforcement and property rights (Rule_law, positive coefficient of 1, extremely significant from a statistical point of view at 0.1%). Another positive aspect of general government expenditures increases is the improvement of citizens’ perceptions and abilities to get involved in elections of their government, as well as liberty of assertion, affiliation, and an independent media (Voice_acc, positive coefficient of 0.46, highly statistically significant at 0.1%). On the other hand, there are also negative effects induced on regulatory quality, because an upward trend in general government expenditures slightly reduces the government’s capacity to conceive and enforce reliable policies and regulations that afford and enhance private sector development across the EU (REG_quality, negative coefficient of 0.02, yet statistically insignificant). The results are in line with those obtained by Shonchoy (2010) for REG_quality (as negative impacts), GOV_effect, COR_ctrl, POL_stab, and Rule_law (as positive effects), and are the opposite for Voice_acc. All of these credentials are further linked with good public governance (latent variable, GPG), which relies on the six WGI dimensions, all the associated estimated coefficients being positive and highly statistically significant at the 0.1% threshold.
When the increases in government expenditures dedicated to environmental protection (Figure 6b) have been considered as a measure of sustainable development, one could observe that positive impacts in terms of public administration outcomes are induced only on political stability (POL_stab, positive coefficient of 0.03, with a lower degree of statistical significance), regulatory quality (REG_quality, positive coefficient of 0.05, statistically significant at 10% range), and voice and accountability (Voice_acc, positive coefficient of 0.04, with a lower degree of statistical significance). These results are the opposite of those found by Shonchoy [28] and Welsch [29], who proved that enhancement in environmental support and results will cause a downturn in control of corruption. However, the overall impact on good public governance is favorable, as attested by the positive coefficients associated with the latent variable GPG (highly significant from a statistical point of view at the 0.1% threshold).
Thus, it can be attested that the first hypothesis, H1: There are significant direct effects of general government spending and, respectively, of government spending on environmental protection, upon good public governance, is fulfilled.
In terms of the second hypothesis, if and to what extent are there significant bidirectional interrelations between general government spending, government spending on environmental protection, and good public governance, the SEM models deployed were estimated through the MLE procedure, and the results are presented in Figure 7 and in Appendix A, Table A2.
For the second set of results, an RMSEA of 0 was obtained (also through its upper and lower bounds) and the CFI and TLI were equal to 1, and there was an SRMR of 0, which corresponds to a perfect fit of the models. CD values and Wald test results are not reported here because there are no endogenous variables. Moreover, the high value of Cronbach’s Alpha (0.8641) strengthen scale reliability and the models’ good fit. Thus, an economic interpretation can be placed on the results obtained. The estimations demonstrate that there are significant positive bidirectional influences between general government spending (Figure 7a) and each of the good governance credentials (positive estimated coefficients, highly statistically significant), except for the REG_quality, where the relationship is the opposite. It can be attested that these implications are similar to those obtained for unidirectional impacts (Figure 6a), and with those obtained by Shonchoy (2010). When government expenditure dedicated to environmental protection (Figure 7b) were considered in relation to the good governance dimensions, a strong positive bidirectional influence with POL_stab, REG_quality, and Voice_acc was seen, while in the case of the other three dimensions of public administration (COR_ctrl, GOV_effect, Rule_law), the relationship is the opposite. Overall, these results are in line with those obtained for the unidirectional implications of public spending upon good governance indicators. Hence, not only does government spending impact good public governance (mainly government effectiveness), but the improvements in good governance credentials also have important spillovers on government financial allocations.
Thus, there is evidence to attest that the second hypothesis, H2: There are significant interrelations between general government spending and, respectively, government spending on the environmental protection and the good public governance, is partially fulfilled across the EU countries.
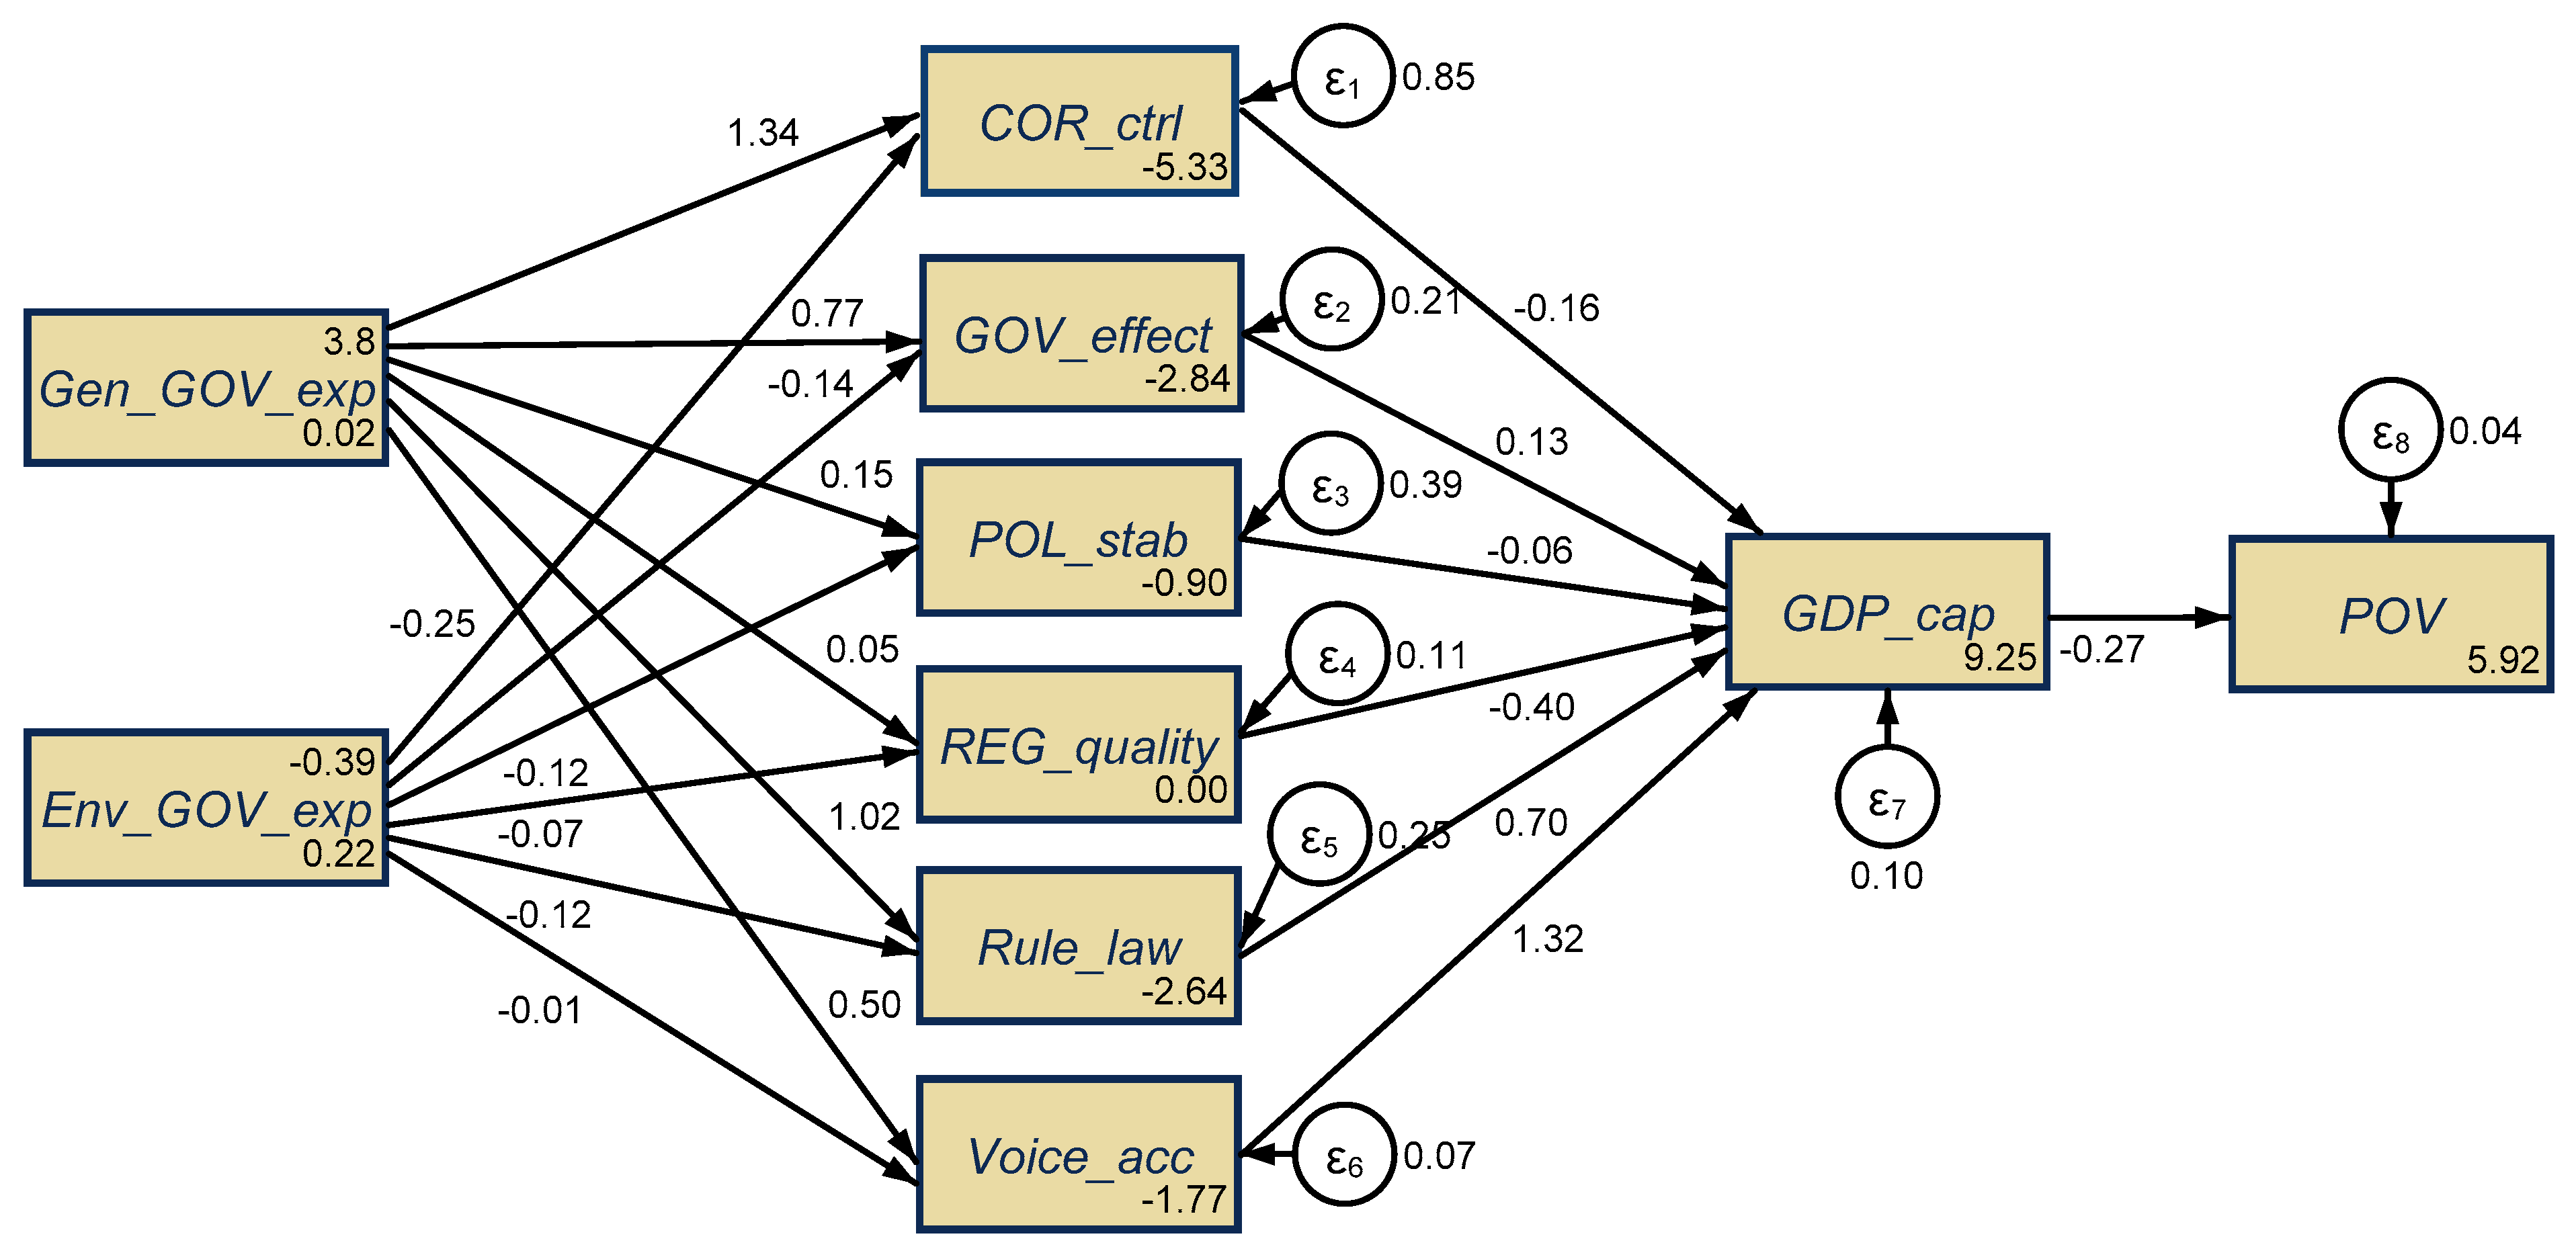
Further, a new SEM model was designed that better captures the role of good public governance and environment protection in supporting economic development and citizens’ welfare. Hence, for the third hypothesis, if and to what extent there are overall (direct, indirect, total) significant (positive) effects of public administration dimensions upon economic and social development (rising GDP and poverty lessening), the SEM model was estimated through the MLE procedure (with and without missing values), and the results are presented in Figure 8 and in Appendix A, Table A3.
For the third set of results, the significant Chi squares associated with the Wald tests for the equations and a high value of Cronbach’s Alpha (0.8650) strengthen the scale’s reliability and the model’s good fit. However, the significance at the 1% LR-chi square statistic (2390) and the lower values of CFI (0.221) and TLI (0.370), point out a few limitations on the model’s overall good fit. Hence, an increased attention is further payed to interpreting the results.
The integrative estimations gathered through this final SEM regarding the impact of public administration features on economic growth disclosed unfavorable effects in the case of the following governance’s dimensions: the perceptions on public authorities’ involvement for private interest, embracing various kinds of corruption (COR_CTRL) (the estimated coefficient is negative, −0.16, extremely statistically significant at the 0.1% threshold); the perceptions on government’s capacity to conceive and enforce reliable policies and regulations that afford and enhance private sector development (REG_quality) (the estimated coefficient is negative, −0.4, highly statistically significant at the 0.1% threshold)—these imply similar findings to those obtained by Noja et al. [4], when the effects of the good public governance dimensions (WGI) were estimated on GDP per capita and poverty (without indirect impacts of government expenditures), and opposite to those achieved by Bilan et al. [12], who assigned significant direct implications for “Regulatory Quality” upon institutional quality of the social sector, further having positive effects on economic development; the political stability perceptions (POL_stab) (the estimated coefficient is negative, −0.06, statistically significant at the 5% level), being reversed with those obtained by Pere [18] for countries from the western Balkans. Favorable implications on economic development (GDP per capita) were led by the following WGI dimensions: citizens’ perceptions and abilities to get involved in electing their government, as well as liberty of assertion, affiliation and media (Voice_acc) (the estimated coefficient is positive, 1.32, highly statistically significant at the 0.1% threshold); and the awareness of having reliance in the rules of law (Rule_law) (the estimated coefficient is positive, 0.7, highly statistically significant at the 0.1% threshold), being also attested by Bilan et al. [12] and Noja et al. [4]. Nevertheless, the estimated coefficient associated with the perceptions of the value of public services and the trustworthiness of government’s engagement in public policies (GOV_effect) is not statistically significant, yet it is positive, thus outlining several premises for its enforcement in the near future.
As regards the impact of total general government expenditures (Gen_GOV_exp) and the component of government contribution for environmental protection (Env_GOV_exp) on good governance credentials with a further impact on economic development, we could observe that only general government expenditures have had an aggregated positive impact on GDP per capita at the level of EU-28. These results complement the research of Noja et al. [4], who attested that, in the case of direct interplays upon GDP per capita, both general government spending and environmental support have positively impacted the economic welfare. The environmental financial allocations tend to induce a downturn in good governance dimensions (negative estimated coefficients, although with a lower degree of statistical significance), being opposite to those obtained by Gil et al. [35] and Gholipour and Farzanegan [36], who proved that enhancement of governance quality induces positive effects upon environmental results for African regions.
Notwithstanding, at the level of the EU-28 countries, common outputs of all included public governance dimensions upon economic growth have positive overflow effects, echoed by a significant lessening of the poverty risk (the estimated coefficient is negative, −0.27, extremely statistically significant at the 0.1% threshold), as Noja et al. [4], Bogere and Mukaaru [15], Fan et al. [16], and Kauffmann et al. [17] also substantiated.
Thus, it can be attested that the third hypothesis, H3: There are overall (direct, indirect, total) significant (positive) effects of the public administration dimensions upon economic and social development (focusing on rising GDP and poverty lessening), is fulfilled.

5. Concluding Remarks

The advances suggested by this research show the decisive importance of public administration overheads (government spending) and good public governance for sustainable economic development at the EU level. This endeavor complements previous contributions on such a topical subject with new evidence regarding the implications of good governance for economic growth and poverty lessening. A special focus throughout the research was given to public spending on environmental protection, given the highly rated position of these coordinates within the SDGs targets [10]. The methodological approach consisted of applying a new integrative procedure, Structural Equation Modelling (SEM), to assess the interlinkages (direct, both unidirectional and bidirectional) between general government spending, with a keen focus on government contribution for environmental protection as an essential coordinate of sustainability, upon good public governance, on the one hand, and their cumulative effects (direct, indirect, total) on economic and social growth (shown by poverty as the main social indicator) on the other hand.
The main findings at the level of the EU MS revealed that an increase in general government spending generates significant improvements in all six public governance dimensions (except for regulatory quality, because an upward trend in general government expenditure that slightly reduces a government’s capacity to conceive and enforce reliable policies and regulations that afford and enhance the private sector heighten across the EU). As regards government expenditure dedicated to environmental protection, favorable impacts in terms of public administration outcomes are induced only in respect of political stability, regulatory quality, and voice and accountability. These result demonstrate that increased public financial efforts dedicated to protecting the natural environment positively shape people’s perceptions regarding the importance of public support for protecting the environment, as well as the perceptions on the government’s ability to develop sound environmental policies. Nevertheless, the overall unidirectional impact of general government expenditures and environmental support on good public governance (GPG) is beneficial (H1).
Concerning the interplay between general government spending and each of the good governance credentials (H2), the results are similar to those obtained for unidirectional implications of public spending upon good governance credentials (H1). Accordingly, not only does government spending shape good public governance, but the enhancements in good governance dimensions also have important spillovers on general and environmental government financial efforts.
As for as overall (direct, indirect, total) interlinkages of government spending and good governance dimensions upon economic development (H3), only three dimensions have induced favorable impacts, namely, a government’s engagement in public policies, the awareness of having reliance in the rules of law, and the citizens’ perceptions and abilities to get involved in electing their government, as well as liberty of assertion, affiliation, and media. Overall, across the two types of government spending considered in this research, only the general expenses have led to welfare increases, while the environmental support does not generate the same brace effects. Nevertheless, the overall implications finally lead to a downsizing of poverty at the EU level.
Because improving governance is the key to promoting and ensuring sustainable economic growth for countries at all stages of development, the econometric analysis supports a series of policies/guidelines that could be considered by the policy makers and public institution leaders within the EU, namely: (i) bolster commitment in conducting public affairs, responsibility in managing public resources, and sound measures targeted to maintain the balance between spending revenues and saving funds for the future; (ii) amplified coordination and credibility/transparency of the actions that support financial stability, along with citizen’s positive perceptions of public authorities because this endeavor has shown that agents’ and citizens’ participation and perceptions are beneficial to strengthening good public governance; (iii) on previous lines, enhancing the role of stakeholders at local, regional, national, and international levels and allowing them to effectively contribute to the decision-making process; (iv) further, leveraged cooperation between all actors involved in designing and implementing the public policies and providing public services to citizens, particularly in the case of environmental protection, which is one of the uppermost credentials in supporting sustainable economic development [42,43]; (v) enhanced accountability in the public sector because the estimations have proved that there is a strong positive bidirectional link between public spending and the voice and accountability dimension of good public governance, with further positive spillovers into economic welfare (increases in GDP per capita and decreases in the poverty risk).
The main limitations of this research consist of various criticism addressed to the WGIs [25,44]. Another issue that needs to be considered is the heterogeneity of the EU MS, which requires additional work to capture tailored guidelines on the relationship between government spending management and government effectiveness at a national and regional level. Hence, future research will be focused on distinctive panels of EU countries, grouped based on a demographic variable (population) and will focus on more indicators from the social side, including education. Future research may also investigate the influence of cultural characteristics on good governance and its features by using cultural dimensions as key variables.

Author Contributions

Conceptualization, G.G.N., M.C., E.T. and M.K.; methodology, G.G.N.; software, G.G.N.; validation, G.G.N., M.C., E.T. and M.K.; formal analysis, G.G.N.; investigation, G.G.N. and M.C.; resources, G.G.N.; data curation, G.G.N.; writing—original draft preparation, G.G.N. and M.C.; writing—review and editing, G.G.N. and M.C.; visualization, G.G.N., M.C., E.T. and M.K.; supervision, E.T. All authors have read and agreed to the published version of the manuscript.

Funding

This research received no external funding.

Institutional Review Board Statement

Not applicable.

Informed Consent Statement

Not applicable.

Data Availability Statement

The dataset can be provided by the authors upon request.

Conflicts of Interest

The authors declare no conflict of interest.

Appendix A

Table A1. Results of SEM models deployed at the level of EU-28 to test the first working hypothesis H1.
Variables(1)(2)
Gen_GOV_exp → GPGEnv_GOV_exp → GPG
log_COR_ctrl
log_Env_GOV_exp −0.0560
(0.101)
log_Gen_GOV_exp1.383 ***
(0.294)
GPG1
(.)
1
(.)
_cons−5.403 ***
(1.121)
−0.411 ***
(0.0667)
log_GOV_effec
log_Env_GOV_exp −0.0160
(0.0624)
log_Gen_GOV_exp0.820 ***
(0.156)
GPG0.537 ***
(0.0162)
0.594 ***
(0.0174)
_cons−2.992 ***
(0.594)
−0.0442
(0.0408)
log_POL_stab
log_Env_GOV_exp 0.0278
(0.0627)
log_Gen_GOV_exp0.467 *
(0.202)
GPG0.288 ***
(0.0335)
0.359 ***
(0.0260)
_cons−2.027 **
(0.768)
−0.348 ***
(0.0420)
log_REG_quality_est
log_Env_GOV_exp 0.0511
(0.0434)
log_Gen_GOV_exp−0.0185
(0.113)
GPG0.382 ***
(0.0120)
0.389 ***
(0.0136)
_cons0.255
(0.428)
0.100 ***
(0.0286)
Log_Rule_law
log_Env_GOV_exp −0.0163
(0.0526)
log_Gen_GOV_exp1.034 ***
(0.166)
GPG0.611 ***
(0.0150)
0.532 ***
(0.0145)
_cons−2.690 ***
(0.631)
1.111 ***
(0.0349)
log_Voice_acc
log_Env_GOV_exp 0.0355
(0.0311)
log_Gen_GOV_exp0.459 ***
(0.0833)
GPG0.281 ***
(0.00894)
0.308 ***
(0.00824)
_cons−1.602 ***
(0.317)
0.0748 ***
(0.0206)
var(e.log_COR_ctrl)
_cons0.151 ***
(0.0113)
0.123 ***
(0.0111)
var(e.log_GOV_effec)
_cons0.0378 ***
(0.00282)
0.0772 ***
(0.00599)
var(e.log_POL_stab)
_cons0.335 ***
(0.0220)
0.374 ***
(0.0237)
var(e.log_REG_quality)
_cons0.0222 ***
(0.00163)
0.0687 ***
(0.00473)
var(e.log_Rule_law)
_cons0.0100 ***
(0.00167)
0.0316 ***
(0.00321)
var(e.log_Voice_acc)
_cons0.0129 ***
(0.000971)
0.0147 ***
(0.00123)
var(GPG)
_cons0.681 ***
(0.0538)
1.262 ***
(0.0959)
mean(log_Env_GOV_exp)
_cons −0.445 ***
(0.0218)
var(log_Env_GOV_exp)
_cons 0.300 ***
(0.0169)
N467638
Note: Standard errors in parentheses; * p < 0.05, ** p < 0.01, *** p < 0.001. Source: Authors’ own research in Stata 16.
Table A2. Results of SEM models deployed at the level of EU-28 to test the second working hypothesis H2.
Variables(1)(2)
Gen_GOV_expEnv_GOV_exp
mean(log_COR_ctrl)
_cons−0.143 ***
(0.0432)
−0.381 ***
(0.0518)
mean(log_GOV_effect)
_cons0.128 ***
(0.0230)
−0.0355
(0.0315)
mean(log_POL_stab)
_cons−0.250 ***
(0.0291)
−0.358 ***
(0.0321)
mean(log_REG_quality)
_cons0.185 ***
(0.0161)
0.0771 ***
(0.0222)
mean(log_Rule_law)
_cons1.240 ***
(0.0247)
1.118 ***
(0.0271)
mean(log_Voice_acc)
_cons0.144 ***
(0.0123)
0.0591 ***
(0.0159)
mean(log_Gen_GOV_exp)
_cons3.803 ***
(0.00663)
var(log_COR_ctrl)
_cons0.871 ***
(0.0570)
1.368 ***
(0.0982)
var(log_GOV_effect)
_cons0.248 ***
(0.0162)
0.520 ***
(0.0339)
var(log_POL_stab)
_cons0.396 ***
(0.0259)
0.533 ***
(0.0334)
var(log_REG_quality)
_cons0.122 ***
(0.00795)
0.261 ***
(0.0163)
var(log_Rule_law)
_cons0.286 ***
(0.0187)
0.389 ***
(0.0238)
var(log_Voice_acc)
_cons0.0709 ***
(0.00464)
0.135 ***
(0.00830)
var(log_Gen_GOV_exp)
_cons0.0205 ***
(0.00134)
cov(log_COR_ctrl,log_GOV_effect)
_cons0.395 ***
(0.0282)
0.747 ***
(0.0537)
cov(log_COR_ctrl,log_POL_stab)
_cons0.185 ***
(0.0285)
0.415 ***
(0.0438)
cov(log_COR_ctrl,log_REG_quality)
_cons0.252 ***
(0.0191)
0.471 ***
(0.0360)
cov(log_COR_ctrl,log_Rule_law)
_cons0.444 ***
(0.0309)
0.668 ***
(0.0445)
cov(log_COR_ctrl,log_Voice_account)
_cons0.211 ***
(0.0151)
0.385 ***
(0.0266)
cov(log_COR_ctrl,log_Gen_GOV_exp)
_cons0.0284 ***
(0.00633)
cov(log_GOV_effect,log_POL_stab)
_cons0.123 ***
(0.0156)
0.277 ***
(0.0268)
cov(log_GOV_effect,log_REG_quality)
_cons0.135 ***
(0.0102)
0.295 ***
(0.0217)
cov(log_GOV_effect,log_Rule_law)
_cons0.242 ***
(0.0167)
0.399 ***
(0.0264)
cov(log_GOV_effect,log_Voice_account)
_cons0.107 ***
(0.00788)
0.226 ***
(0.0155)
cov(log_GOV_effect,log_Gen_GOV_exp)
_cons0.0169 ***
(0.00339)
cov(log_POL_stab,log_REG_quality)
_cons0.0668 ***
(0.0106)
0.153 ***
(0.0182)
cov(log_POL_stab,log_Rule_law)
_cons0.131 ***
(0.0167)
0.238 ***
(0.0227)
cov(log_POL_stab,log_Voice_account)
_cons0.0620 ***
(0.00827)
0.148 ***
(0.0135)
cov(log_POL_stab,log_Gen_GOV_exp)
_cons0.00960 *
(0.00420)
cov(log_REG_quality,log_Rule_law)
_cons0.159 ***
(0.0113)
0.260 ***
(0.0179)
cov(log_REG_quality,log_Voice_account)
_cons0.0765 ***
(0.00557)
0.155 ***
(0.0106)
cov(log_REG_quality,log_Gen_GOV_exp)
_cons−0.000380
(0.00231)
cov(log_Rule_law,log_Voice_account)
_cons0.126 ***
(0.00879)
0.206 ***
(0.0134)
cov(log_Rule_law,log_Gen_GOV_exp)
_cons0.0212 ***
(0.00368)
cov(log_Voice_acc,log_Gen_GOV_exp)
_cons0.00943 ***
(0.00182)
mean(log_Env_GOV_exp)
_cons −0.445 ***
(0.0218)
var(log_Env_GOV_exp)
_cons 0.300 ***
(0.0169)
cov(log_COR_ctrl,log_Env_GOV_exp)
_cons −0.0218
(0.0301)
cov(log_GOV_effect,log_Env_GOV_exp)
_cons −0.00435
(0.0187)
cov(log_POL_stab,log_Env_GOV_exp)
_cons 0.0101
(0.0187)
cov(log_REG_quality,log_Env_GOV_exp)
_cons 0.0155
(0.0130)
cov(log_Rule_law,log_Env_GOV_exp)
_cons −0.00494
(0.0158)
cov(log_Voice_acc,log_Env_GOV_exp)
_cons 0.0106
(0.00935)
N467638
Note: Standard errors in parentheses; * p < 0.05, *** p < 0.001. Source: Authors’ own research in Stata 16.
Table A3. Results of SEM models deployed at the level of EU-28 to test the third working hypothesis H3.
Variables(1)
Total (Effects on GDP_cap and POV)
log_COR_ctrl
log_Env_GOV_exp−0.247 *
(0.109)
log_Gen_GOV_exp1.336 ***
(0.360)
_cons−5.331 ***
(1.366)
log_GDP_cap
log_COR_ctrl−0.158 ***
(0.0442)
log_GOV_effec0.132
(0.0925)
log_POL_stab−0.0629 *
(0.0308)
log_REG_quality−0.400 ***
(0.107)
log_Rule_law0.698 ***
(0.113)
log_Voice_account1.316 ***
(0.148)
_cons9.251 ***
(0.131)
log_GOV_effec
log_Env_GOV_exp−0.141 **
(0.0539)
log_Gen_GOV_exp0.770 ***
(0.178)
_cons−2.844 ***
(0.676)
log_POL_stab
log_Env_GOV_exp−0.118
(0.0735)
log_Gen_GOV_exp0.150
(0.243)
_cons−0.901
(0.922)
log_REG_quality
log_Env_GOV_exp−0.0702
(0.0398)
log_Gen_GOV_exp0.0457
(0.131)
_cons0.00142
(0.499)
Log_Rule_law
log_Env_GOV_exp−0.118 *
(0.0594)
log_Gen_GOV_exp1.016 ***
(0.196)
_cons−2.645 ***
(0.745)
log_Voice_account
log_Env_GOV_exp−0.00618
(0.0307)
log_Gen_GOV_exp0.503 ***
(0.101)
_cons−1.771 ***
(0.385)
log_POV
log_GDP_cap−0.274 ***
(0.0188)
_cons5.921 ***
(0.194)
var(e.log_COR_ctrl)
_cons0.848 ***
(0.0656)
var(e.log_GDP_cap)
_cons0.100 ***
(0.00775)
var(e.log_GOV_effec)
_cons0.208 ***
(0.0161)
var(e.log_POL_stab)
_cons0.386 ***
(0.0299)
var(e.log_REG_quality)
_cons0.113 ***
(0.00874)
var(e.log_Rule_law)
_cons0.252 ***
(0.0195)
var(e.log_Voice_account)
_cons0.0674 ***
(0.00521)
var(e.log_POV)
_cons0.0409 ***
(0.00316)
N334
Note: Standard errors in parentheses; * p < 0.05, ** p < 0.01, *** p < 0.001. Source: Authors’ own research in Stata 16.

References

  1. The World Bank. Governance and Development; The World Bank: Washington, DC, USA, 1992. [Google Scholar]
  2. Houngbo, P.T.; Coleman, H.L.S.; Zweekhorst, M.; De Cock Buning, T.; Medenou, D.; Bunders, J.F.G. A model for good governance of healthcare technology management in the public sector: Learning from evidence-informed policy development and implementation in Benin. PLoS ONE 2017, 12, e0168842. [Google Scholar] [CrossRef] [Green Version]
  3. Lu, J.; Zhao, J. How does government funding affect nonprofits’ program spending? Evidence from international development organizations. Public Adm. Dev. 2019, 39, 69–77. [Google Scholar] [CrossRef]
  4. Noja, G.G.; Cristea, M.; Sirghi, N.; Hategan, C.-D.; D’Anselmi, P. Promoting good public governance and environmental support for sustainable economic development. Int. J. Environ. Res. 2019, 16, 4940. [Google Scholar] [CrossRef] [Green Version]
  5. The World Bank. Worldwide Governance Indicators (WGI) 2019. Available online: http://info.worldbank.org/governance/wgi/ (accessed on 22 November 2020).
  6. Kaufmann, D.; Kraay, A.; Mastruzzi, M. Governance Matters VIII: Aggregate and Individual Governance Indicators, 1996–2008 (29 June 2009). World Bank Policy Research Working Paper No. 4978. Available online: https://ssrn.com/abstract=1424591 (accessed on 22 January 2021).
  7. United Nations. What Is Good Governance? Economic and Social Commission for Asia and the Pacific 2009. Available online: https://www.unescap.org/sites/default/files/good-governance.pdf (accessed on 22 November 2020).
  8. Overseas Development Institute (ODI). Mapping Political Context: World Governance Assessment 2009. Available online: https://www.odi.org/publications/5531-mapping-political-context-world-governance-assessment (accessed on 24 November 2020).
  9. European Union. Manual on Sources and Methods for the Compilation of COFOG Statistics. Classification of the Functions of Government (COFOG); Publications Office of the European Union: Luxembourg, 2019. [Google Scholar] [CrossRef]
  10. United Nations. Transforming the World: The 2030 Agenda for Sustainable Development. 2015. Available online: https://sustainabledevelopment.un.org (accessed on 24 January 2021).
  11. Law, S.H.; Lim, T.C.; Ismail, N.W. Institutions and economic development: A Granger causality analysis of panel data evidence. Econ. Syst. 2013, 37, 610–624. [Google Scholar] [CrossRef]
  12. Bilan, Y.; Vasilyeva, T.; Lyeonov, S.; Bagmet, K. Institutional complementarity for social and economic development. Bus. Theory Pract. 2019, 20, 103–115. [Google Scholar] [CrossRef] [Green Version]
  13. Masca, S.-G.; Nistor, S.; Vaidean, V.L. Do government arrangements matter for CEE countries’ growth? A two-piece puzzle perspective. Appl. Econ. Lett. 2019, 26, 1612–1626. [Google Scholar] [CrossRef]
  14. Tarverdi, Y.; Saha, S.; Campbell, N. Governance, democracy and development. Econ. Anal. Policy 2019, 63, 220–233. [Google Scholar] [CrossRef]
  15. Bogere, G.; Mukaaru, J.A. Assessing Public Expenditure Governance: A Conceptual and Analytical Framework. ACODE Policy Research Paper 2016, 74. Available online: https://www.acode-u.org/uploadedFiles/PRS74.pdf (accessed on 22 January 2021).
  16. Fan, S.; Hazell, P.; Thorat, S. Government spending, growth and poverty in rural India. Am. J. Agric. Econ. 2000, 82, 1038–1051. [Google Scholar] [CrossRef]
  17. Kauffmann, D.; Recanatini, F.; Biletsky, S. Assessing Governance: Diagnostic Tools and Applied Methods for Capacity Building and Action Learning; The World Bank: Washington, DC, USA, 2002. [Google Scholar]
  18. Pere, E. Impact of good governance in the economic development of Western Balkan countries. Eur. J. Gov. Econ. 2015, 4, 25–45. [Google Scholar] [CrossRef] [Green Version]
  19. Bovaird, T.; Loeffler, E. Public Management and Governance; Routledge: London, UK, 2015. [Google Scholar]
  20. Turner, M.; Hulme, D.; McCourt, W. Governance, Management and Development. Making the State Work; Polgrave: London, UK, 2015. [Google Scholar]
  21. Tihanyi, L.; Graffin, S.; George, G. Rethinking governance in management research. Acad. Manag. J. 2014, 57, 1535–1543. [Google Scholar] [CrossRef]
  22. Srakar, A.; Vecco, M.; Tóth, Á. The tale of the cuts and raises: Public budgets for culture in the European countries during the financial crisis. Hacienda Pública Esp. 2017, 221, 83–109. [Google Scholar] [CrossRef]
  23. Stiglitz, J.E. Freefall: America, Free Markets, and the Sinking of the World Economy; WW Norton & Company: New York, NY, USA, 2010. [Google Scholar]
  24. Young, B. Economic Governance in the Eurozone: A New Dawn. Econ. Sociol. Eur. Electron. Newsl. 2011, 12, 11–16. Available online: http://hdl.handle.net/10419/155966 (accessed on 2 March 2021).
  25. Apaza, C.R. Measuring governance and corruption through the worldwide governance indicators: Critiques, responses, and ongoing scholarly discussion. PS Polit. Sci. Polit. 2009, 42, 139–143. [Google Scholar] [CrossRef]
  26. Kaufman, D.; Kraay, A.; Mastruzzi, M. The Worldwide Governance Indicators: Methodology and Analytical Issues. The World Bank Development Research Group Macroeconomics and Growth Team, World Bank Policy Research Working Paper 2010, No. 5430. Available online: https://ssrn.com/abstract=1682130 (accessed on 4 March 2021).
  27. Charron, N.; Lapuente, V.; Rothstein, B. Mapping the quality of government in Europe. In An Analysis at the National and Regional Level within the EU Member States; Swedish Institute for European Policy Studies (SIEPS): Stockholm, Sweden, 2018; Available online: http://www.sieps.se/globalassets/publikationer/2018/sieps-2018_2-web.pdf (accessed on 4 March 2021).
  28. Shonchoy, A. What is Happening with the Government Expenditure of Developing Countries–A Panel Data Study. In Proceedings of the German Development Economics Conference, Hannover, Germany, 18–19 June 2010. [Google Scholar]
  29. Welsch, H. Corruption, growth, and the environment: A cross-country analysis. Environ. Dev. Econ. 2004, 9, 663–693. [Google Scholar] [CrossRef] [Green Version]
  30. Law, S.H.; Azman-Saini, W.N.W. Institutional quality, governance, and financial development. Econ. Gov. 2012, 13, 217–236. [Google Scholar] [CrossRef] [Green Version]
  31. Huang, C.J. Governance and economic growth: Evidence of ten Asian countries. World Academy of Science, Engineering and Technology. Int. J. Soc. Behav. Educ. Econ. Bus. Ind. Eng. 2015, 9, 2071–2075. [Google Scholar] [CrossRef]
  32. Acemoglu, D.; Verdier, T. Property rights, corruption and the allocation of talent: A general equilibrium approach. Econ. J. 1998, 108, 1381–1403. [Google Scholar] [CrossRef] [Green Version]
  33. Vasileiou, E. Corruption, Political Stability and Public Finance: What the Data Say about the European Monetary Union’s Countries? A Note, 2015 (10 November 2015). Available online: https://ssrn.com/abstract=2688822 (accessed on 22 February 2021). [CrossRef]
  34. Park, J. Corruption, soundness of the banking sector, and economic growth: A cross-country study. J. Int. Money Financ. 2012, 31, 907–929. [Google Scholar] [CrossRef]
  35. Gil, A.R.; Vishwanathan, K.K.; Hassan, S. Effects of Governance on the Environmental Kuznets Curve (EKC) in South and South East Asian Countries. Pak. J. Soc. Sci. 2019, 39, 1101–1114. [Google Scholar]
  36. Gholipour, H.F.; Farzanegan, M.R. Institutions and the effectiveness of expenditures on environmental protection: Evidence from Middle Eastern countries. Const. Political Econ. 2018, 29, 20–39. [Google Scholar] [CrossRef]
  37. European Commission. Eurostat Database. Available online: https://ec.europa.eu/eurostat/data/database (accessed on 22 November 2020).
  38. OECD. OECD Databases. Available online: https://data.oecd.org/ (accessed on 22 November 2020).
  39. Provan, K.G.; Kenis, P. Modes of Network Governance: Structure, Management, and Effectiveness. J. Public Adm. Res. Theory. 2008, 18, 229–252. [Google Scholar] [CrossRef] [Green Version]
  40. Amsler, L.B. Collaborative Governance: Integrating Management, Politics, and Low. Public Adm. Rev. 2016, 76, 700–711. [Google Scholar] [CrossRef]
  41. Cristea, M.; Noja, G.G. European agriculture under immigration effects: New empirical evidence. Agric. Econ. Czech. 2019, 65, 112–122. [Google Scholar] [CrossRef] [Green Version]
  42. Shpak, N.; Kuzmin, O.; Melnyk, O.; Ruda, M.; Sroka, W. Implementation of a circular economy in Ukraine: The context of European integration. Resources 2020, 9, 96. [Google Scholar] [CrossRef]
  43. Tulaeva, S.A.; Tysiachniouk, M.S.; Henry, L.A.; Horowitz, L.S. Globalizing extraction and indigenous rights in the Russian Arctic: The enduring role of the state in natural resource governance. Resources 2019, 8, 179. [Google Scholar] [CrossRef] [Green Version]
  44. Gisselquist, R.M. Developing and evaluating governance indexes: 10 questions. Policy Stud. 2014, 35, 513–531. [Google Scholar] [CrossRef] [Green Version]
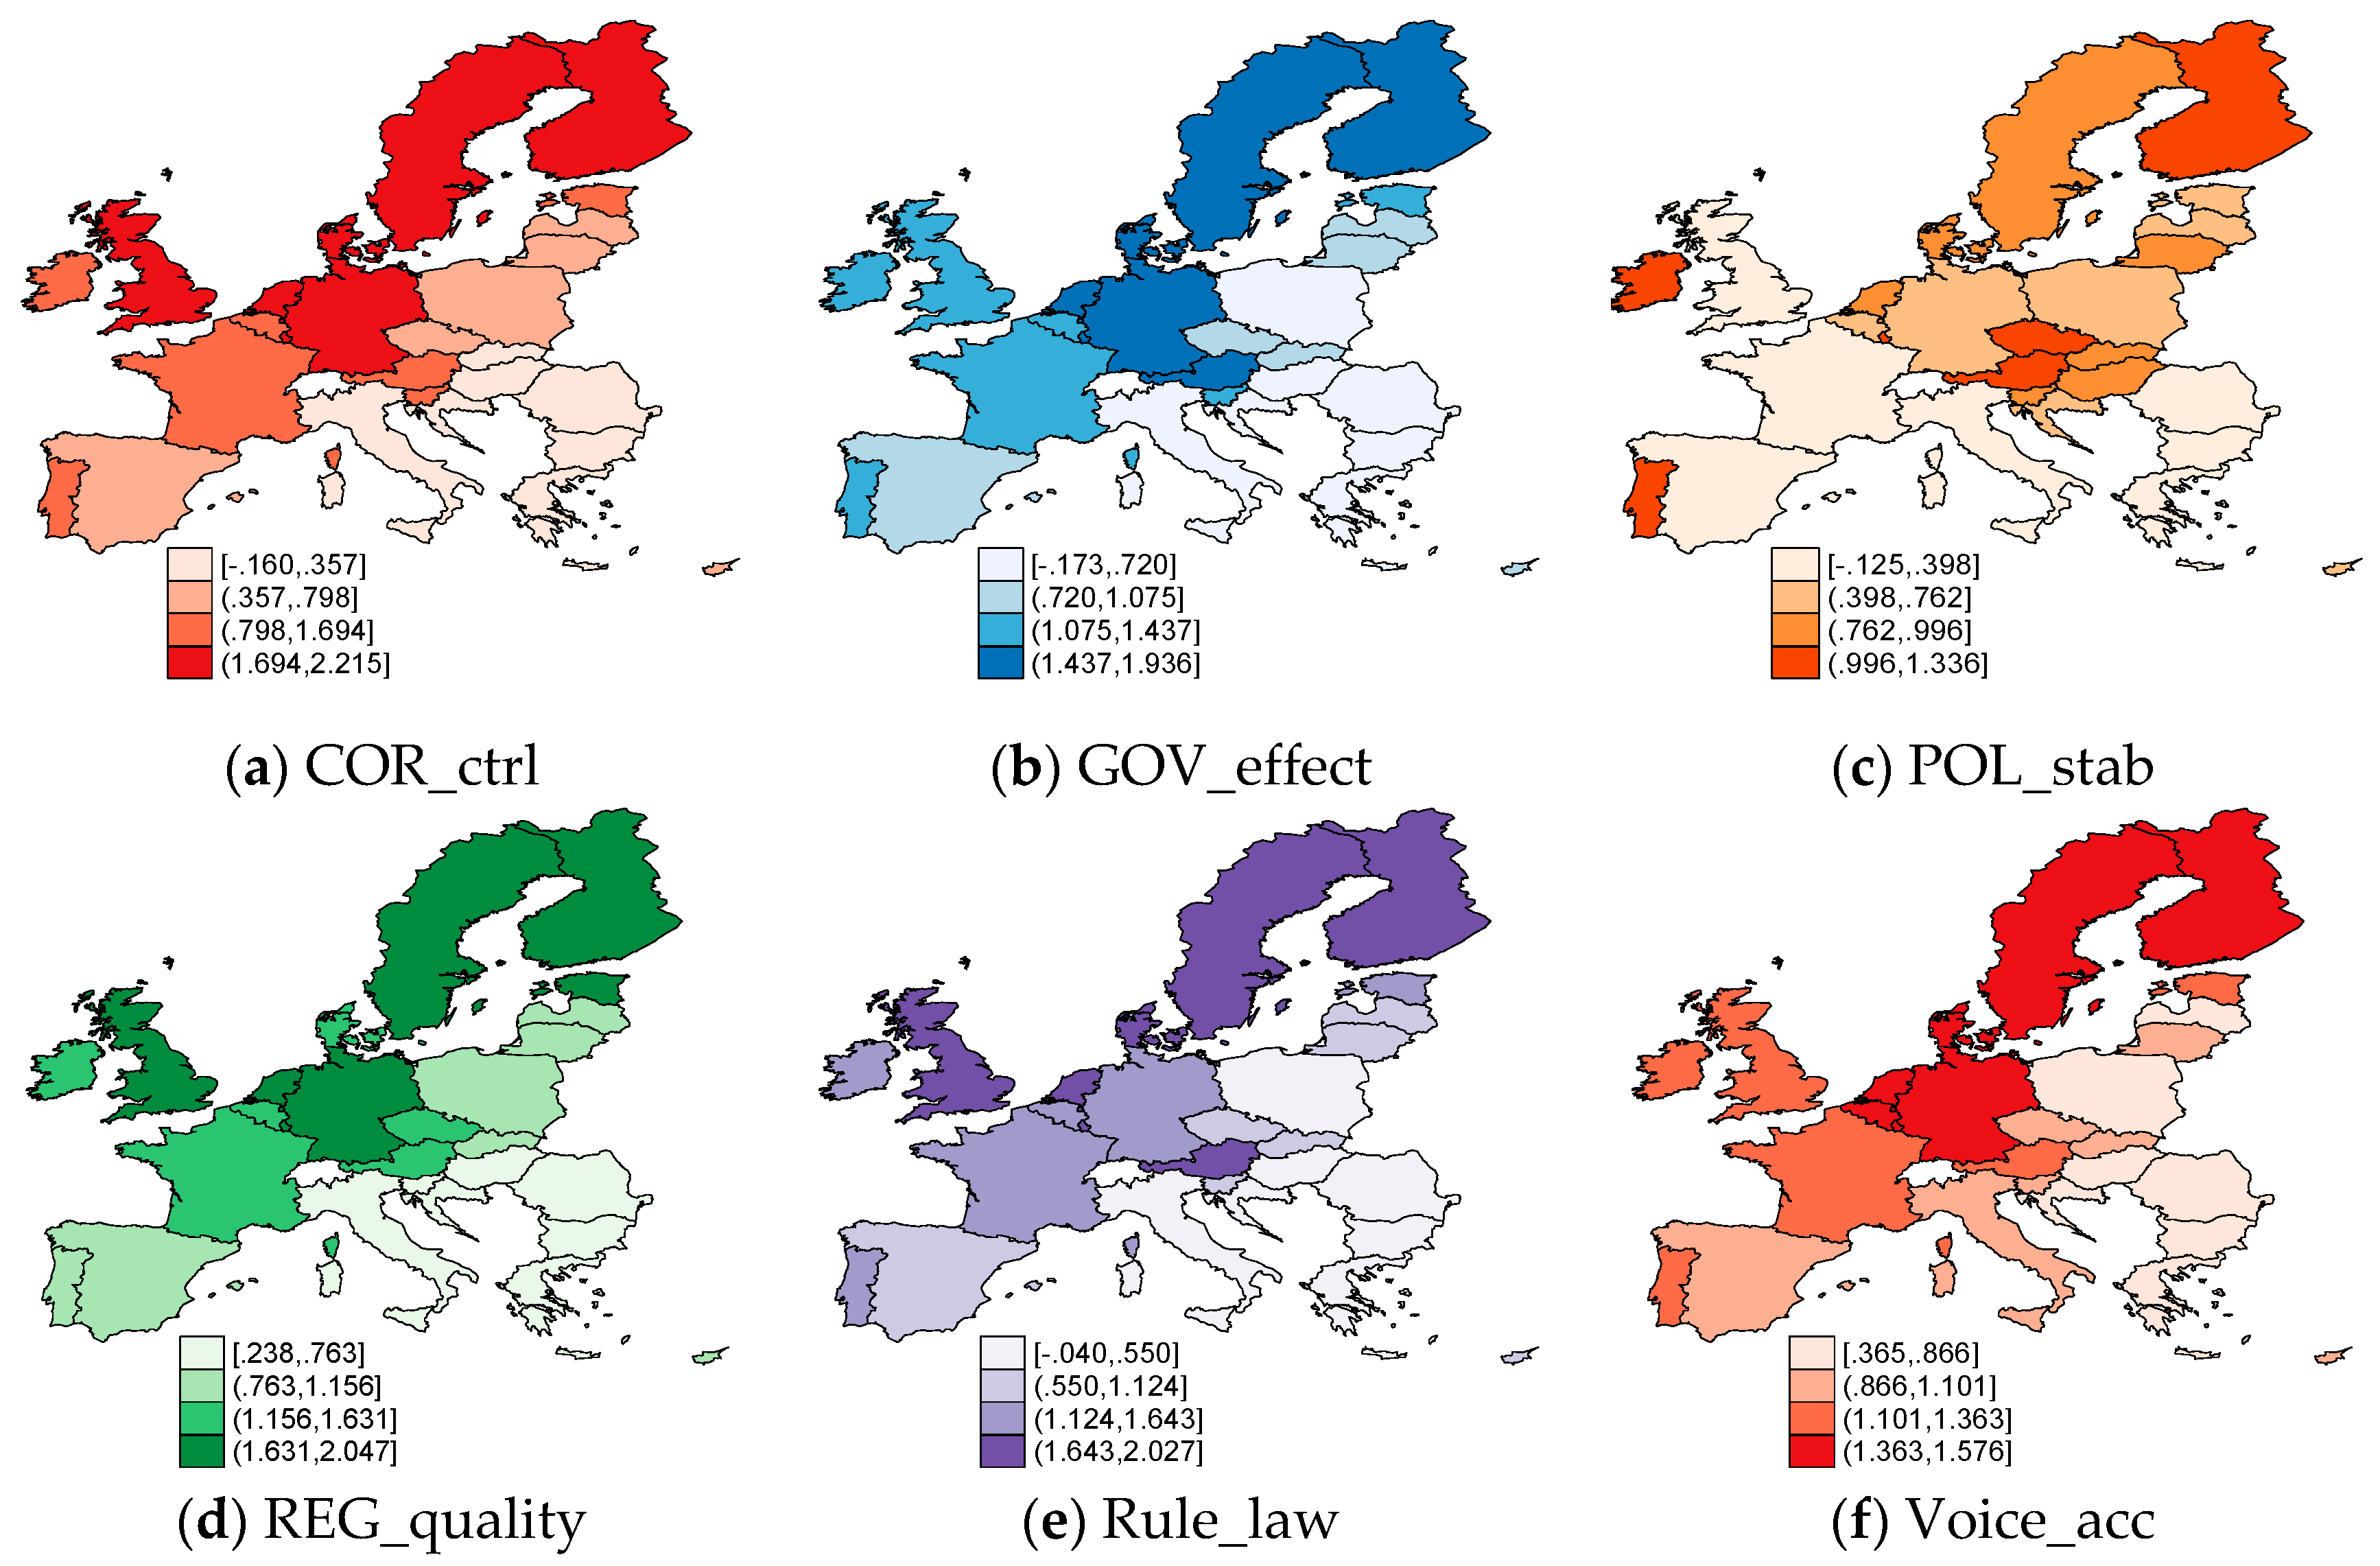
Figure 1. Good governance dimensions in the EU-28 countries, 2017: (a) corruption control; (b) government effectiveness; (c) political stability; (d) regulatory quality; (e) rule of law; (f) voice and accountability. Source: Own process in Stata 16.
Resources 10 00041 g001
Figure 2. General government spending (Gen_GOV_exp) (a) and government spending on environmental protection (Env_GOV_exp) (b), EU-28, 2017. Source: Own process in Stata 16.
Resources 10 00041 g002
Figure 3. SEM models deployed to assess the first working hypothesis (H1) related to the direct significant implications of general government spending (a) and government spending on environmental protection dimensions (b) upon good public governance. Source: Own contribution in Stata 16.
Resources 10 00041 g003
Figure 4. SEM deployed to assess the bidirectional interrelations between general government spending (a) and government spending on environmental protection (b) and good public governance (H1). Source: Own research in Stata 16.
Resources 10 00041 g004
Figure 5. SEM model deployed to assess the overall effects of public administration dimensions upon economic and social development (H2). Source: Authors’ research in Stata 16.
Resources 10 00041 g005
Figure 6. Results of the SEM models deployed for the EU-28 countries in order to test H1, general government spending (a) and government spending on environmental protection (b), 1995–2017. Source: Authors’ research in Stata 16.
Resources 10 00041 g006
Figure 7. Results of the SEM in order to test H1, general government spending (a) and government spending on environmental protection (b), 1995–2017, EU-28 countries. Source: Authors’ research in Stata 16.
Resources 10 00041 g007
Figure 8. Results of the SEM models deployed in order to test H2, 1995–2017, for the EU-28 countries. Source: Authors’ research in Stata 16.
Resources 10 00041 g008
Table 1. Descriptive statistics, EU-28, 1995–2017.
VariablesNMeanStandard DeviationMinimumMaximum
COR_ctrl5321.0400.799−0.6152.470
GOV_effect5321.1400.620−0.5692.354
POL_stab5320.8000.429−0.4741.760
REG_quality5321.1860.455−0.1842.098
Rule_law5321.1170.624−0.6342.100
Voice_acc5321.1220.343−0.2921.801
Gen_GOV_exp63444.7576.71626.30065.000
Env_GOV_exp6340.7240.350−0.3001.900
GDP_cap64429,976.13019,970.2803781.904110,001.100
POV37824.5408.07212.20061.300
N total644
Source: Authors’ own process in Stata 16.
Publisher’s Note: MDPI stays neutral with regard to jurisdictional claims in published maps and institutional affiliations.