Article

A Predictive Model for Cropland Transformation at the Regional Level: A Case Study of the Belgorod Oblast, European Russia

by
Zhanna A. Buryak
1,
Olesya I. Grigoreva
2 and
Artyom V. Gusarov
3,*
1
Federal and Regional Centre for Aerospace and Ground Monitoring of Objects and Natural Resources, Belgorod State National Research University, Pobedy Str. 85, 308015 Belgorod, Russia
2
Centre for Validation and Verification of Carbon Units, Belgorod State National Research University, Pobedy Str. 85, 308015 Belgorod, Russia
3
Institute of Geology and Petroleum Technologies, Kazan Federal University, Kremlyovskaya Str. 18, 420008 Kazan, Russia
*
Author to whom correspondence should be addressed.
Resources 2023, 12(11), 127; https://doi.org/10.3390/resources12110127
Submission received: 7 September 2023 / Revised: 23 October 2023 / Accepted: 25 October 2023 / Published: 30 October 2023

Abstract

:
The problem of choosing the type of land use is now more relevant than ever. Against the backdrop of the growth of urbanized territories, the challenge is to preserve cropland, maintain the quality of soil resources, and find a balance between competing land uses. Forecasting and modeling changes in the area of cropland is a sought-after area of research against the backdrop of a growing shortage of fertile land and a threat to food security. In this study, on the example of one of the agriculturally most developed administrative regions of Russia (Belgorod Oblast), an approach to statistical modeling of agricultural land areas over the past 30 years is shown. Two approaches were used: statistical modeling of the dynamics of the total area of the study region’s cropland depending on the balance of other types of land and spatial interaction modeling of cropland in a key area. For the study region, administrative districts with positive and negative cropland dynamics were identified; the main types of land were revealed, due to which cropland is withdrawn, and a regression balance model was developed. It was revealed that the implementation of the planned regional programs to expand the development and conservation of meadow lands will reduce cropland by 3.07% or 83.2 thousand ha. On the example of one of the administrative districts with high rates of urbanization, the probability of cropland transformation into other types of land was estimated and a predictive spatial model of land use was developed. According to the forecast, about 6.2 thousand ha of cropland will turn into residential development land, and 2/3 of their area will be concentrated within 6 km from the borders of the regional capital city (Belgorod). The presented approach to forecasting the area of cropland and the threats of its reduction due to the need to replace other types of land is relevant for all agricultural regions and countries with developing urbanization processes.

1. Introduction

Land is one of the components of the natural environment and its unique resource. It combines the functions of the territorial basis of human activity, the source of storage and reproduction of other resources and the main means of production in agriculture and forestry. Land as a means of production is considered a conditionally renewable natural resource, since the soil, which is the basis of its fertility, can reproduce itself, but the period of its formation lasts hundreds and thousands of years. Cropland is the main land use that implements production functions. According to the Food and Agriculture Organization of the United Nations [1], temporary and permanent cultivated crops occupy over 1500 million ha. The overall change in agricultural land area since 2000 is small; however, cultivated land has increased by 24 million ha (1.8%). The increased demand for global food production over the past half century has contributed to agriculture intensification and resulted in the depletion of the natural resources of many agroecosystems. Against the background of the global demand for increased agricultural productivity, there is a global systematic reduction in the area of especially valuable fertile land due to aridity, soil erosion, vegetation decline, soil salinization, and soil organic carbon decline. Among the processes of degradation of agricultural landscapes, the problem of water erosion of soils stands apart, the consequences of which negatively affect the complex state of the entire river-basin territorial structure, from river-basin divides to river–valley thalwegs [2].
According to [3], soil degradation in agricultural landscapes has resulted in nearly 33% of the world’s cropland being lost over the past 40 years. Another threat to the reduction in cultivated land resources is the expansion of urban land. The land taken under the influence of the urban sprawl process can displace all types of agricultural land use and lead to environmental challenges, especially for biodiversity conservation [4].
In many countries, leading in the production of goods and services in the sphere of consumption, the land transformation process is ongoing. That said, abandonment does not necessarily occur in marginal areas, but more in areas where competition between smallholders and large enterprises is strong [5]. Between the countries, an imbalance between the actual provision of cropland and the products received from them for export was revealed. Due to global trade, some countries have acquired the status of “suppliers” of cropland resources [6].
The Russian Federation is one of the largest grain exporters in the world. It occupies one of the leading places on a global scale according to three main indicators: total arable area; plowed (cropland) area; cropland area per capita [7]. However, at the same time, the Russian Federation is among the most vulnerable countries in the world to the various pathways of cropland degradation [8]. The current trend towards a decrease in the area of cropland in the country, combined with a high risk of water erosion of soils [9,10,11], makes the issue of patterns of cause-and-effect relationships between the transformation of land, forecasting scenarios for their development, and creating appropriate models relevant. Such data can be obtained by modeling and predicting land dynamics [12,13].
Different modeling approaches are used in land-use/land-cover change research for the study and prediction of changes in land-use intensification and may be useful in describing the decision-making processes [14,15]. The fundamental problem faced by researchers is that it is difficult to find an efficient model that could include both spatial and temporal factors [16,17]. Such a model of spatial dynamics is of decisive importance for the analysis and modeling of the quantitative composition of lands. In fact, land transformation models can be divided into two groups: statistical description models [18] and spatial transitional models [19,20,21].
In this study, on the example of one of the agriculturally most developed administrative regions of European Russia (the European part of Russia)—the Belgorod Oblast—a model that describes the statistical scenario for the transformation of cropland (including cultivated land under temporary crops and permanent crops) was developed. For the Belgorod (municipal) district of the Belgorod Oblast, which is in the process of active expansion of the city of Belgorod (the capital city of the study region), a spatial forecast for the reduction in cropland was given.

2. Study Area

The Belgorod Oblast (27,123 km2; 1,536,466 inhabitants (2022)) is a typical agricultural administrative region of the Chernozem zone of European Russia, where cropland prevails in the land structure (cultivated land and perennial plantations occupy 60.6% and 1.3%, respectively, according to official data as of 1 January 2022 [22]) (Figure 1). The high agroecological potential of the region and the long-term productivity of agricultural crops indicate that the Belgorod Oblast plays a significant role in ensuring the food security of the country. Over the past 70 years, the structure of land has undergone significant transformations, which are due to changes in the socio-economic vector of land use [23].
The Belgorod Oblast is characterized by the polarization of the socio-economic space relative to regional metropolises and territories controlled by them [24]. The capital city of the Belgorod Oblast, the city of Belgorod (pop. about 330,000 inhabitants), is the largest city in this administrative region. It is the largest regional metropolis around which the urban agglomeration is formed. Subsidizing by the government of the region of private housing construction contributed to the growth of the population of rural areas adjacent to the city, up to 25%. This expansion occurred mainly due to the withdrawal of land from cropland. The combination of intensive plowing in the region with increasing urban anthropogenic pressure caused a sharp deterioration in the hydroecological situation of the urbanized basins of small rivers and resulted in the exhaustion of the self-purification potential of these rivers [25].

3. Materials and Methods

3.1. Data Sources

The chosen approach for modeling cropland in the study region is based on the principle of balance: the model shows what other types of land can change the area of cultivated land. The following categories of land within the boundaries of the Belgorod Oblast were selected: cropland (including cultivated land under temporary and permanent crops), meadows (including hayfields and pastures), forests (the state forest fund and other lands occupied by natural and artificial forests), wetlands, urban and industry area (including industrial enterprises, roads, etc.)—UIA, as well as other lands not used in agriculture. A database was compiled for each of the 21 administrative districts of the Belgorod Oblast in four time slices with an interval of 5–10 years: 1995, 2005, 2015, and 2020. For this, official information from the Department of the Federal Service for State Registration, Cadaster and Cartography for Belgorod Oblast [22], the State Archives of Belgorod Oblast, and reports from the Federal State Statistics Service [26] were used. For comparability of data for administrative districts, the absolute values of land areas were converted into their shares of the area of the corresponding district (in %). Further, for each consecutive pair of time intervals (1995–2005, 2005–2015, and 2015–2020), the difference in the increase in the share of different types of land use was calculated. After eliminating outliers, the final sample was 62 observations.
The spatial structure of cultivated land in the Belgorod district (including the city of Belgorod) was assessed for two time slices and a geodatabase was created. According to the fund cartographic data of the land structure of the early 1990s (1:25,000), a field mask was created. These boundaries were refined using high-resolution satellite images for 2022 (using the Google Earth resource and the regional spatial database center of collective usage, “Centre for Aerospace and Ground Monitoring of Objects and Natural Resources of Belgorod State National Research University”). Using the overlay method of vector masks of fields, the territories withdrawn from cultivated land over the past 30 years were determined. Their current land use was detected using satellite images and open cadastral information [27], which indicates the actual intended use of the land.

3.2. Statistical and Spatial Modeling Methods

3.2.1. Statistical Model of Cultivated Land Area Dynamics

The simulation of cultivated land area dynamics of the Belgorod Oblast was carried out using the STATISTICA.10 (StatSoft, Moscow, Russia) software product. The hypothesis about the normality (symmetry) of the sample distribution was tested using the Kolmogorov–Smirnov and Shapiro–Wilks coefficients. In our example, cases indicating an abnormal distribution were identified, so Spearman’s rank correlation coefficients were used to assess the strength of the relationship.
To determine the set of predictors and the degree of their influence on the result attribute (sign–result) (change in share of cropland), correlation indicators were calculated. Lands with a statistically significant effect on the area under crops (p < 0.05) were selected for the modeling.
The analytical form of the dependence under study is expressed with a regression equation that reflects the main trend of the relationship (dependence) characteristic of the statistical aggregate under study. The modeling was carried out using multiple linear regression analysis methods. The dependence of the change in the area of cropland on other lands was revealed as a function of the following type (trend line):
Y = β0 + β1X1 + ... + βkXk + Ɛ,
where Y is the calculated theoretical value of the result attribute (sign–result); β0, β1, …, βk are regression equation parameters; X1, …, Xk are values of independent variables; Ɛ is a random value. The values of the parameters of the regression equation were calculated with the least squares method.

3.2.2. Spatial Probabilistic Model of an Urbanized Territory

One of the most effective and widely used methods for modeling changes in the Earth’s surface, taking into account the spatial interaction of its components, is the use of a distributed model [18], where each space element (raster model cell) corresponds to the probability of the transition of the current land-use type to another under the influence of independent predictors. This model was implemented for the Belgorod administrative district, where the processes of developing the urban environment and replacing cropland with residential development are actively occurring.
Based on data on the dynamics of the spatial structure of land in the Belgorod Oblast, a spatial-probabilistic model of the transformation of cultivated lands in the study region was developed. The modeling process is presented in Figure 2.
For the forecast, the method of polynomial logistic regression was used. The model parameters were calculated in the STATISTICA.10 (StatSoft, Moscow, Russia) program using a package of non-linear forecasting methods. The model was selected based on the significance of the Chi-square (χ2) test (p < 0.05), the AUC ROC curve, the normality of the distribution of the residuals of the model, and its accuracy (coincidence between predicted and actual values). The result of the model shows the probability (recalculated logit value) of the transition of cropland to the selected type of land for given independent predictors:
P ( Y i = 1 ) = F ( z i ) = 1 1 + e z i = 1 1 + e ( β 0 + β 1 X i ) ,
where P is the probability, F(zi) is the logit function, β0,1 are the model parameters, and X is a predictor (independent variable). The following indicators are considered as independent predictors of the model: the distance from the border of the city of Belgorod (L, km), the distance to the nearest settlement (D, km), the average population (I, thousand people), as well as such terrain parameters as slope (S, degree) and topographic position index (TPI, dimensionless).
The main areas of the former cropland “gravitate” towards the suburbs and are part of the urban agglomeration; therefore, the distance from the city was considered as one of their predictors. For rural areas remote from the city, the dynamics of cultivated land can be affected by the distance to the nearest settlement. These indicators were calculated on the basis of a layer of points of settlements using the Euclid distance method. The average population is presented in raster form using the Spline interpolation method with the Tension option. The terrain parameters were estimated using a digital elevation model (DEM) with a resolution of 30 × 30 m, built based on isolines of topographic maps. For the Belgorod Oblast, geomorphic conditions are one of the limiting factors of crop production [28]. The cultivated land is located on slopes with a steepness of up to 7°, which are dissected by a dense erosional network. Considering the magnitude of the slope, the erosion-control structure of the sown areas of the region is designed. The topographic position index shows the position of a point on a slope and characterizes landform types. It is calculated as a mean deviation: positive values are typical for the hilltop, and negative values are typical for the valley bottom. The absolute value of TPI is calculated as the difference between the elevation of each DEM cell and the average elevation in a given neighborhood around it (2 km for a given study object).
Spatial modeling was performed in ArcGIS 10.5 using toolsets Surface, Neighborhood, Interpolation, Distance, Zonal, and Reclass. Raster layers with a single resolution of 30 × 30 m were created for the predictors of the model. For each polygon of the former cropland, the weighted average values of cells of the predictor rasters were calculated. These data formed the basis of 428 observations for the development of the regression model (200 buildings, 49 dachas (summer houses), 179 meadows). After statistical processing, the model was implemented in a spatial form using the Raster Calculator tool. Based on the input predictor rasters for each cell, the probability of transforming cultivated land into another land type was calculated. For mapping, a probability threshold of P > 0.75 was chosen; isolated outliers over an area less than the minimum for the type of land use in the original sample were eliminated.
The proposed approach to developing a spatial probabilistic model is methodologically close to the cellular automata method [29,30], since the probability in a grid of cells is analyzed. However, our study does not take into account the local effect of neighborhood cells, and there are no mechanisms for setting forecast periods.

4. Results

4.1. Forecasting the Area of Cropland in the Land Fund of the Belgorod Oblast

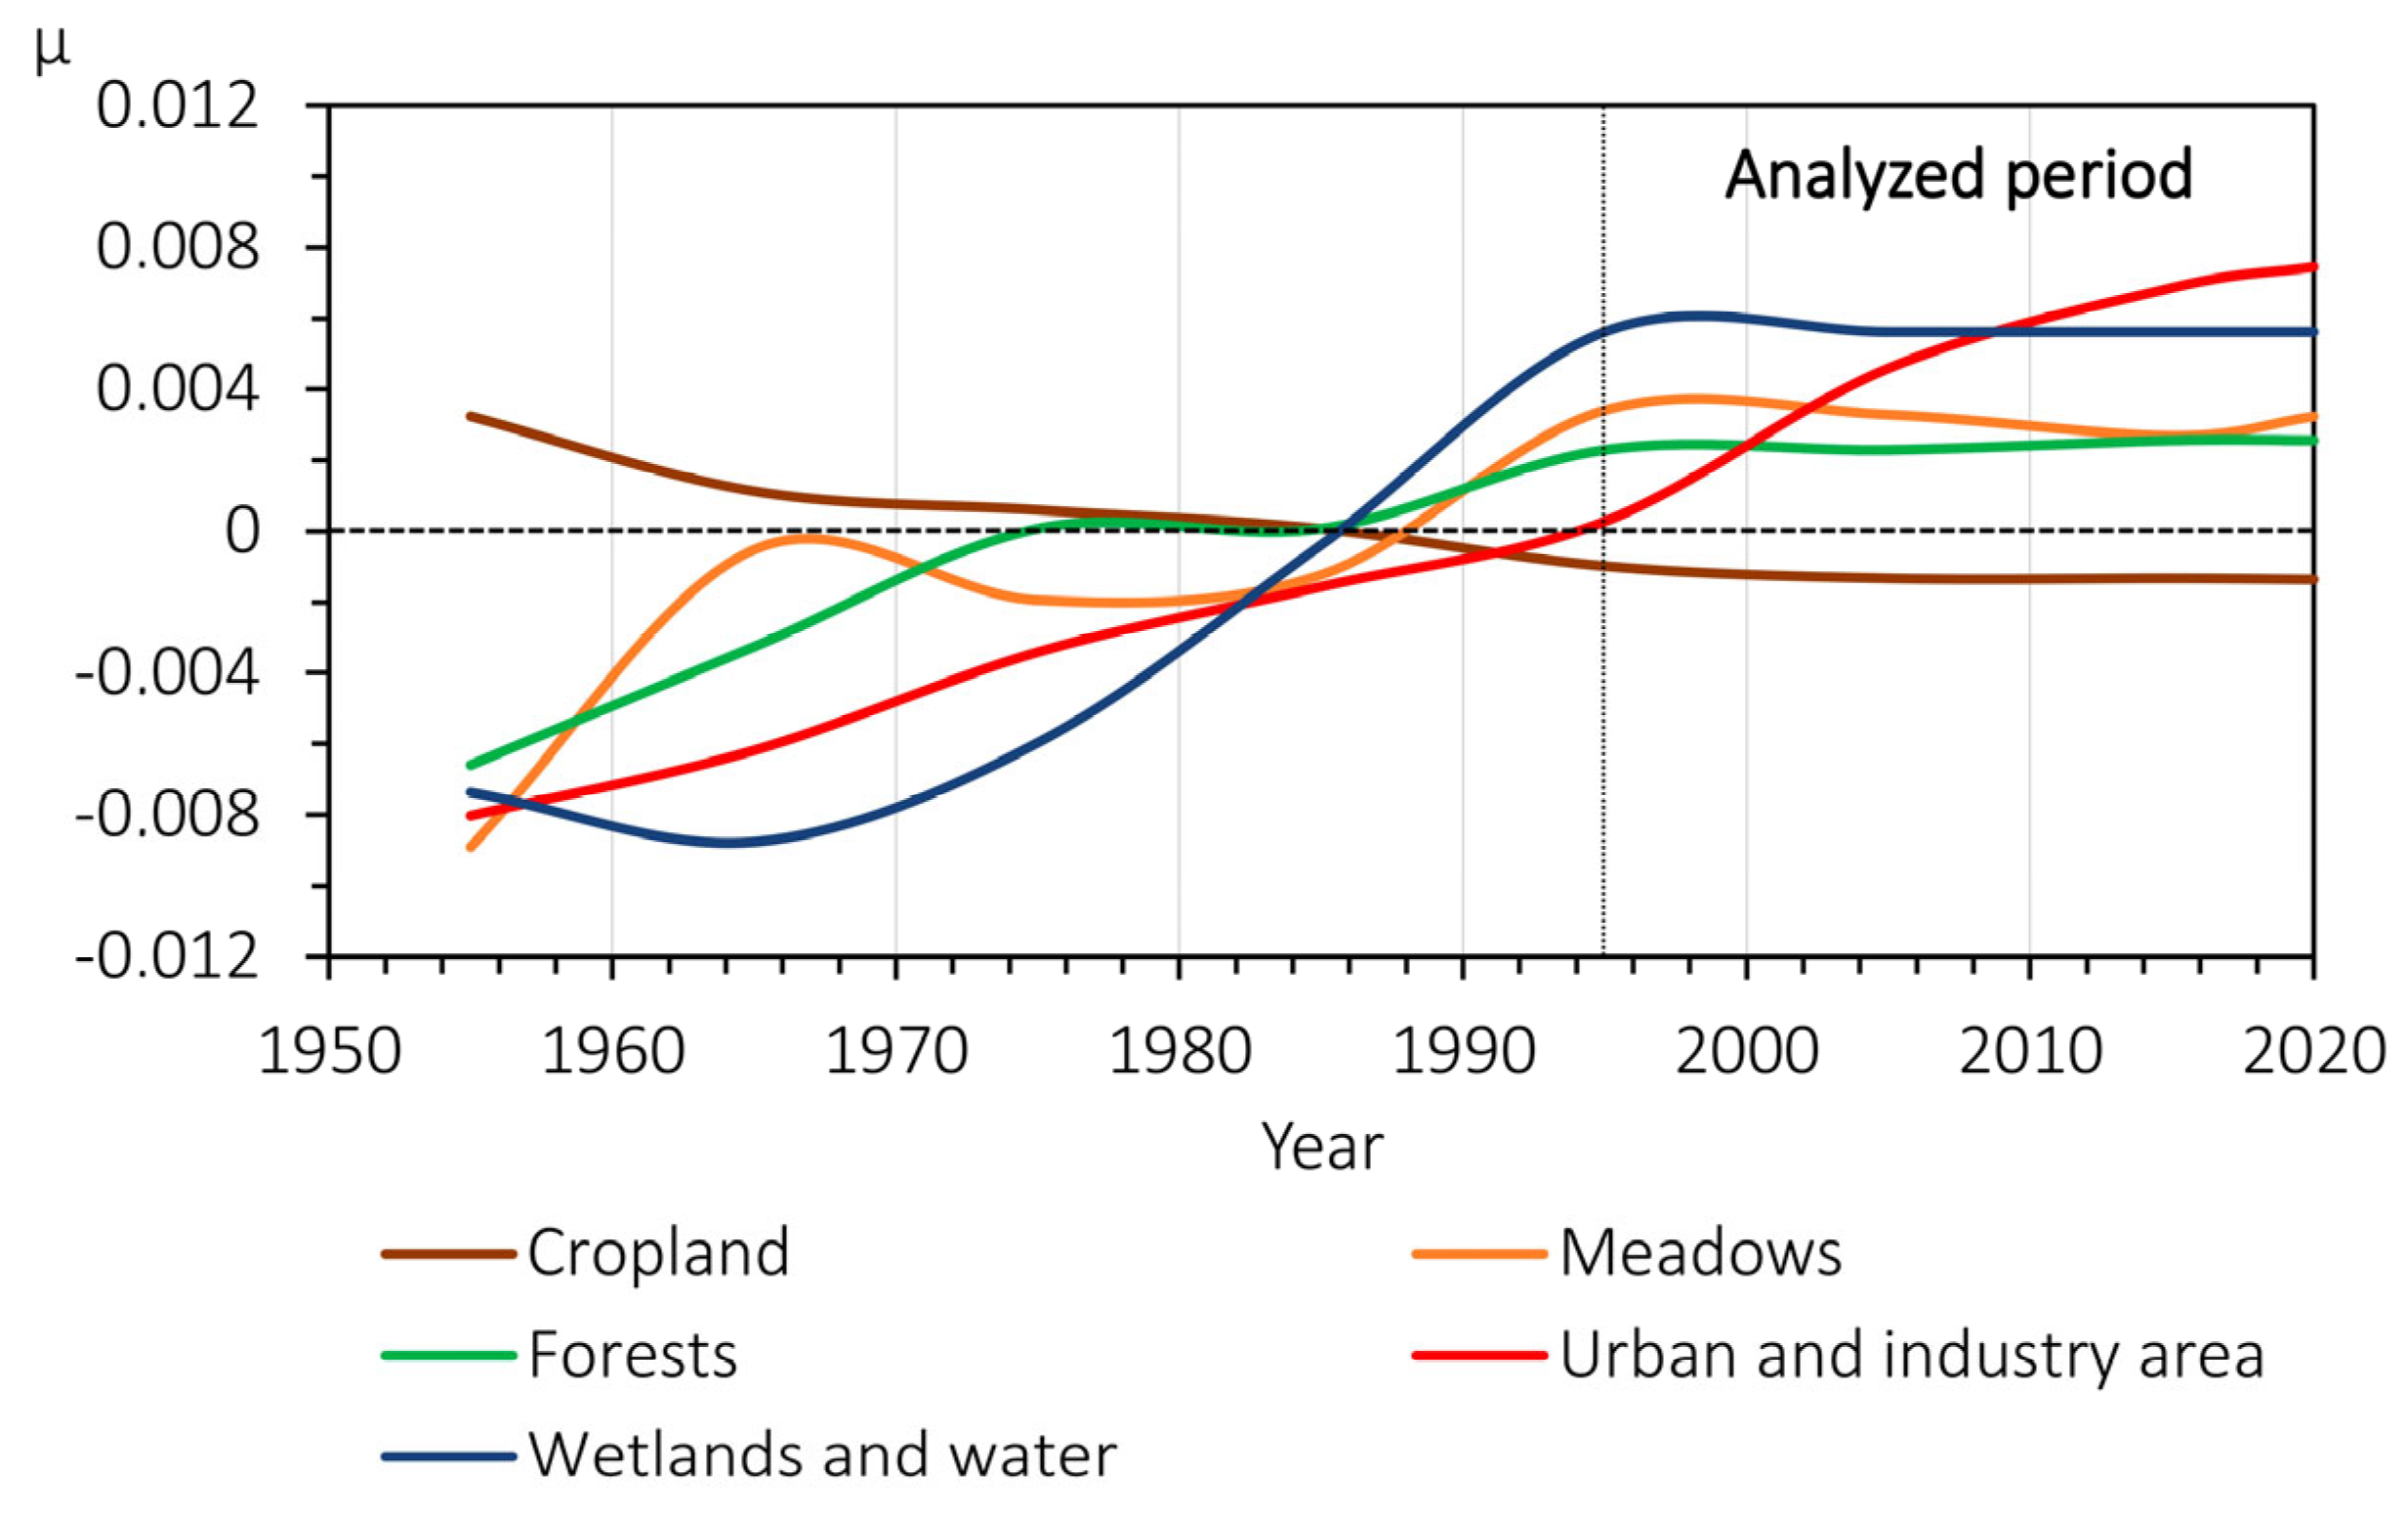
The history of the dynamics of the land fund of the Belgorod Oblast shows periods of active transformation of different types of land [31]. Various functional dependencies of variables were established (Figure 3). According to this figure, the graphical expressions of relationships for the variables “Cropland” and “Urban and industry area” are similar to linear functions, the variable “Wetlands and water” is similar to a power function, and “Meadows” and “Forests” are similar to a sinusoid function. Thus, the disharmonious nature of the change in land area of the study region in 1955–2020 was revealed.
Over the entire period analyzed in Figure 3, the dynamics of changes in the area of cultivated land were negative. Since the mid-1950s, the regional government has chosen a course to combat soil erosion with water on agricultural lands and restore soil fertility. Massive forest reclamation measures were carried out in the region: organization of erosion-control forest strips, afforestation of small dry valleys, and banks of rivers, reservoirs, and lakes. As a result of soil conservation work, the area of cultivated land decreased and the area of forests increased. In 1965, the construction of ponds for irrigation of agricultural land began, and reservoirs were created. As a consequence, the area of natural forage lands decreased due to their transformation into water fund lands (water bodies).
Since the mid-1990s, after the collapse of the Soviet Union and the beginning of the land reform of the Russian Federation, a change in the nature of these curves has been observed for all lands. In most cases, the rate of transformation has slowed down and stabilized, except for building areas. The latter show the most intensive increase since 1995 by 20.9 thousand ha (+19%). The area of cultivated land continued to decline, but much more slowly than before 1995. Over the past 30 years, the cultivated land area of the study region has decreased by 14.3 thousand ha (−0.9%).
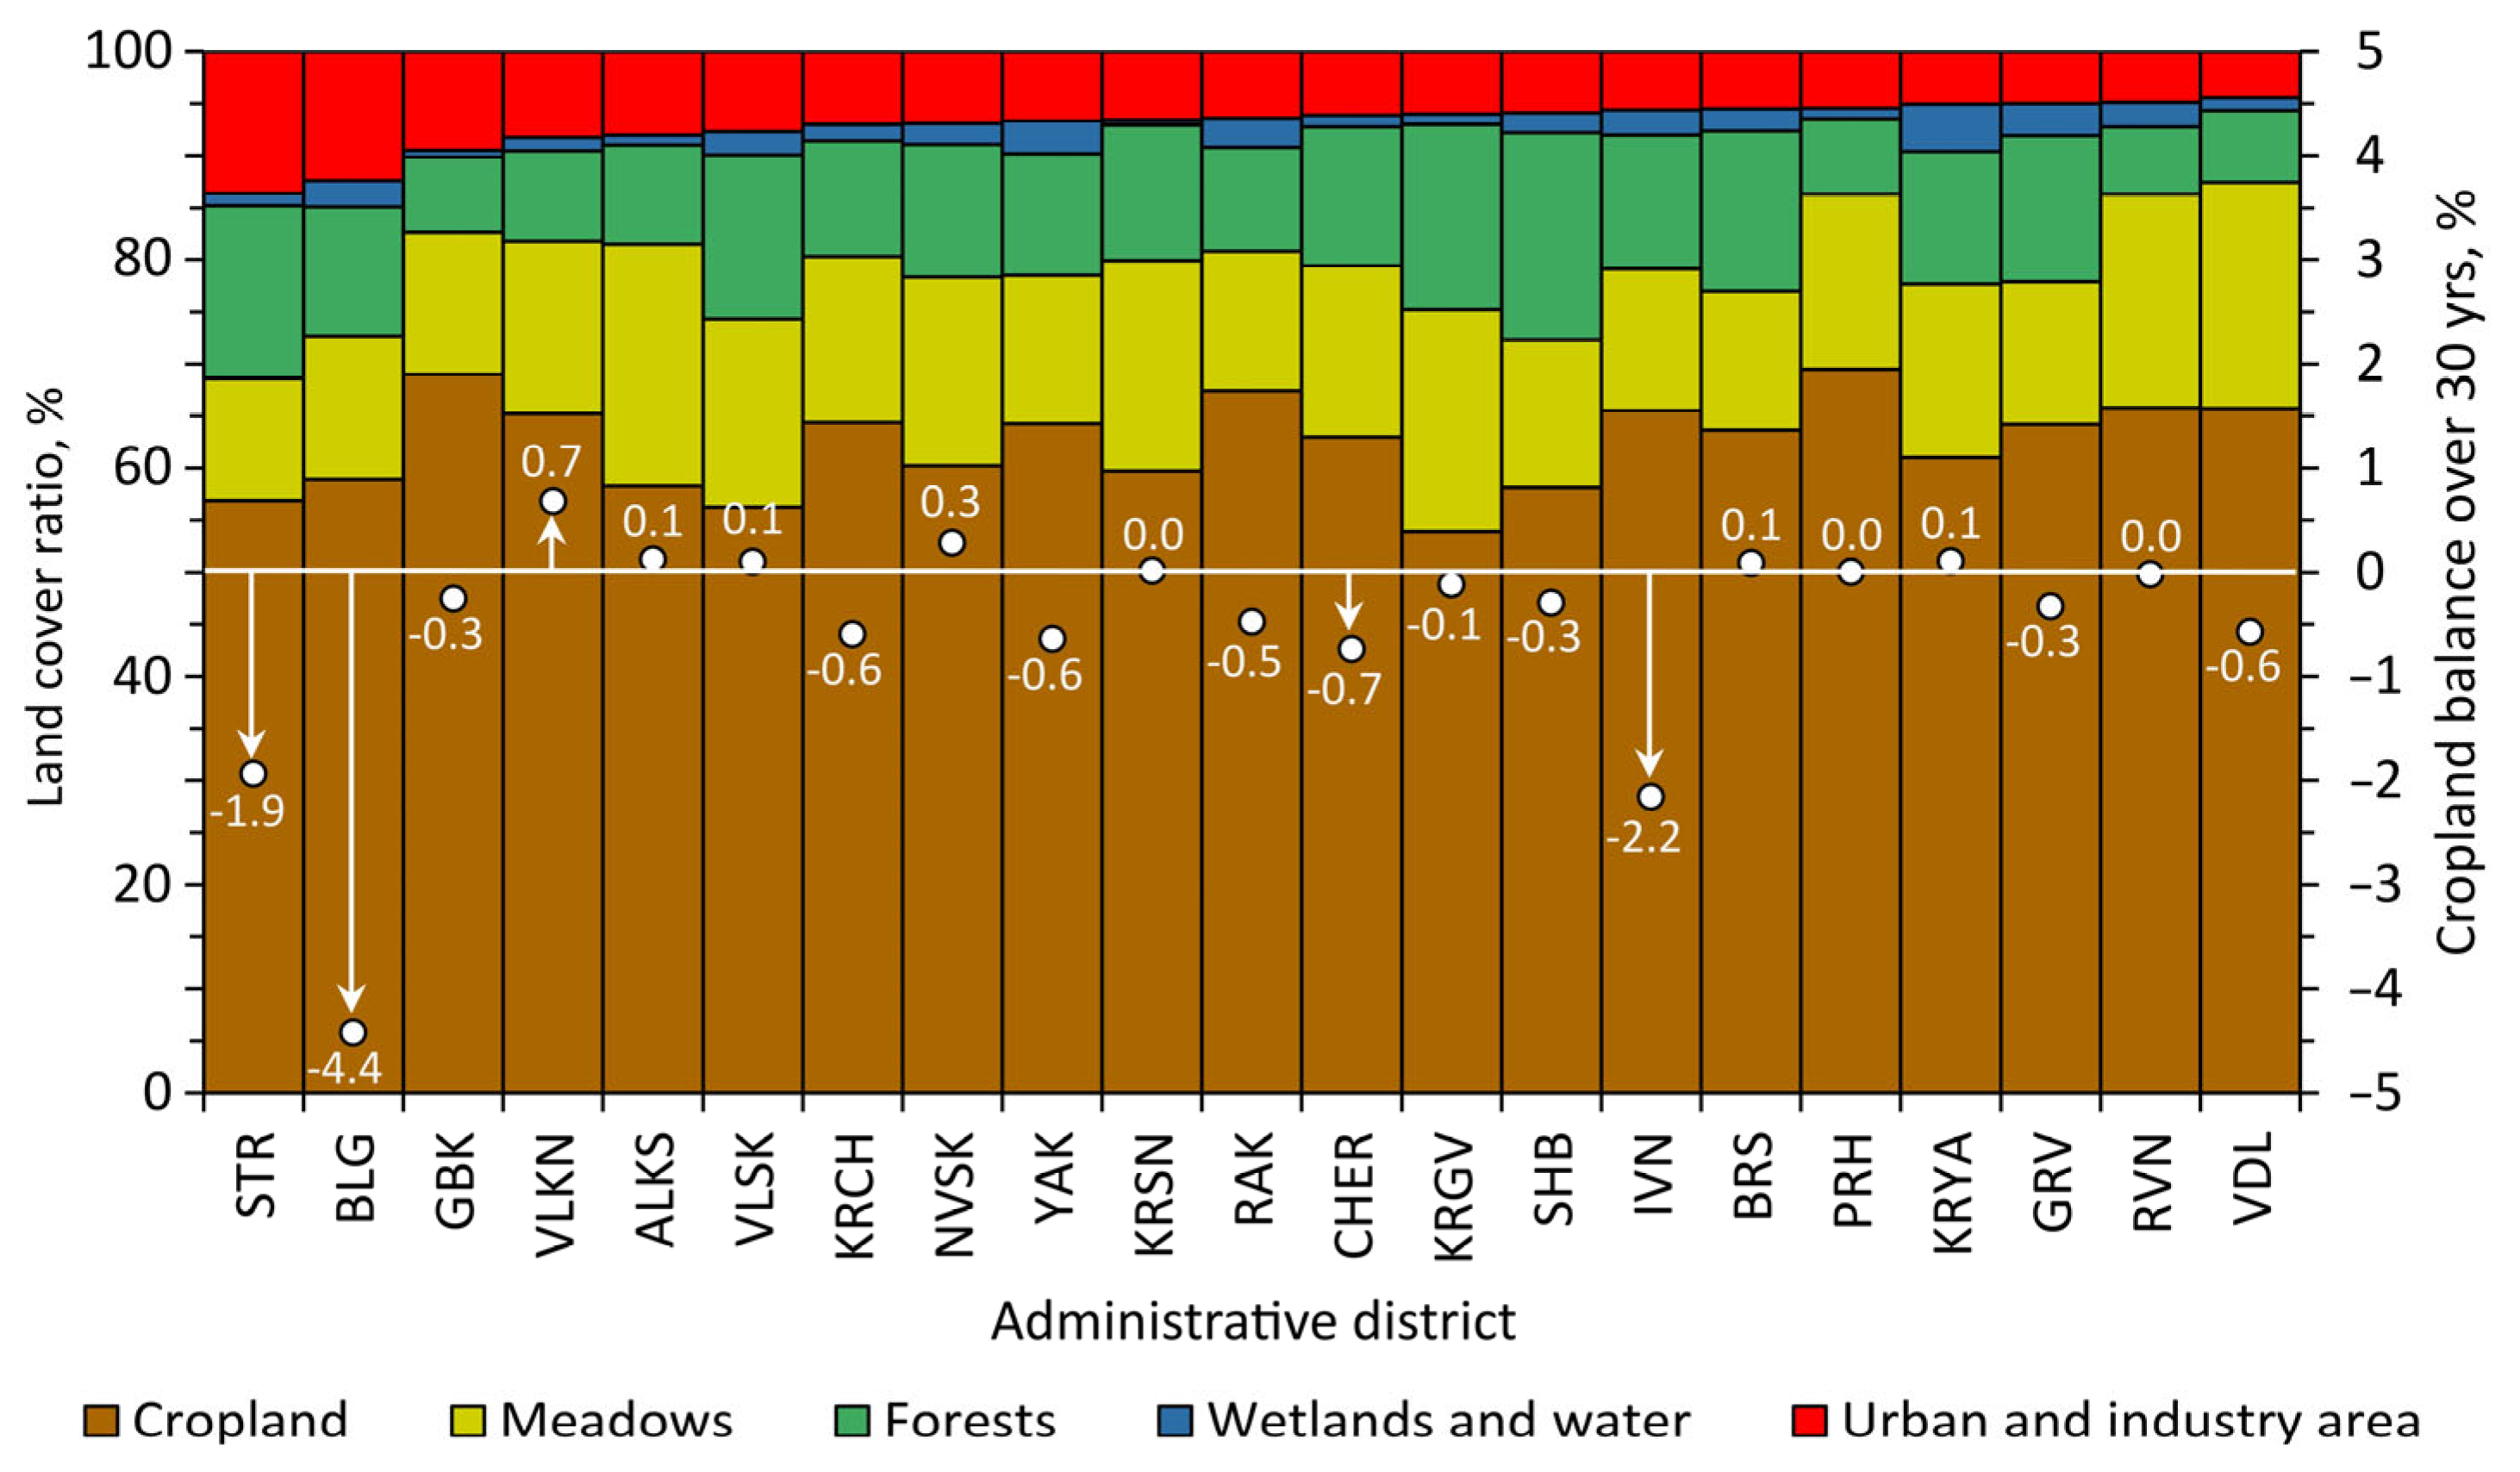
A more detailed consideration of the structure of land at the level of individual administrative districts of the Belgorod Oblast identifies various established types of land use, in which the area of cultivated land has been both decreased (12 districts) and increased (9 districts) since the 1990s (Figure 4). However, the increase in cropland in some districts is not significant (on average, by 0.2%). The reduction in cropland in most cases is less than 0.7%. The exceptions are three districts where the expansion of suburbs is actively underway: the share of cropland has decreased to 4.4%.
The results of Spearman’s correlation analysis of the strength of the relationship between land dynamics and its significance are presented in Table 1.
For cultivated land, all dependencies are inverse, which is consistent with the balance approach to the study of land-use changes. Statistically significant inverse relationships were established for two types of land: weak for meadows (r = −0.39) and medium for UIA (r = −0.63). This allows us to conclude that the changes in the area of cropland occurred at the expense of these two types of land, with the latter factor making a larger contribution.
Thus, based on the correlation analysis, the presence of statistically significant relationships between the mutual transformations of different types of land over time was revealed. On this basis, we obtained the following non-linear regression model of cropland change, depending on UIA and meadows:
Y = −0.056 − 0.798X1 − 0.954X2,
where Y is the change in the share of cropland in the area of the Belgorod Oblast (%); X1 is the change in the proportion of meadows in the area of the Belgorod Oblast (%); X2 is the change in the share of UIA in the area of the Belgorod Oblast (%). The main estimated indicators of the equation, correlation indicators, as well as the results of calculating the parameters of the regression equation and assessing their significance are shown in Table 2.
The multiple correlation coefficient, Multiple R = 0.84, indicates a strong positive relationship. The value of R2 = 0.71 means that 71% of the variation in the area of cropland (Y) depends on the independent variables (X1-k) taken into account in this study. The statistical significance of the equation as a whole was assessed based on the Fisher F-test. In general, the regression equation is statistically significant. Thus, the relationship equation includes precisely those factors that play a decisive role in changing the value of the result attribute (“Cropland”); the change in the area of cropland is statistically related to the change in the area of meadows and UIA. According to the dependence obtained, with an increase in the share of meadows in the land fund of the Belgorod Oblast by 1%, the share of cropland decreases by 0.85%, and with an increase in UIA by 1%, the share of cropland decreases by 1.01%. The difference between the land shares is compensated with the increase/decrease in other types of land use not included in the model.
Let us give an example of forecasting changes in the area of cropland by 2025. According to the State program “Development of agriculture and fish farming in the Belgorod Oblast“, the area of meadows should expand from the current 455 thousand ha (16.77% of the area of the region) to 545 thousand ha (20.08%). At the same time, according to another State program, “Providing affordable and comfortable housing and utilities for residents of Belgorod Oblast”, by 2025, the planned UIA will be 140.5 thousand ha (5.18%), while now it is 130.2 thousand ha (4.80%). By 2025, the growth of meadows relative to the total area of the region will be +3.32% (X1), and UIA will be +0.38% (X2). According to Equation (3), the change in cropland will be
Y2025 = −0.056 − 0.798 × 3.32 − 0.954 × 0.38 = −3.07 (%).
Considering the fulfillment of the indicators of all the State programs, the share of cropland in the structure of the land fund of the Belgorod Oblast will decrease by 3.07%, i.e., 83.2 thousand ha will be withdrawn from agricultural use. The resulting empirical regression model can be applied in practice to predict data on the consequences of the impact of land rotation on their quantitative composition. Since the result is expressed as a change in the share of the area, such a model approach can be applied both for the entire territory of the region and for its individual administrative districts.

4.2. Spatial Model of the Dynamics of Cropland in an Urbanized Area

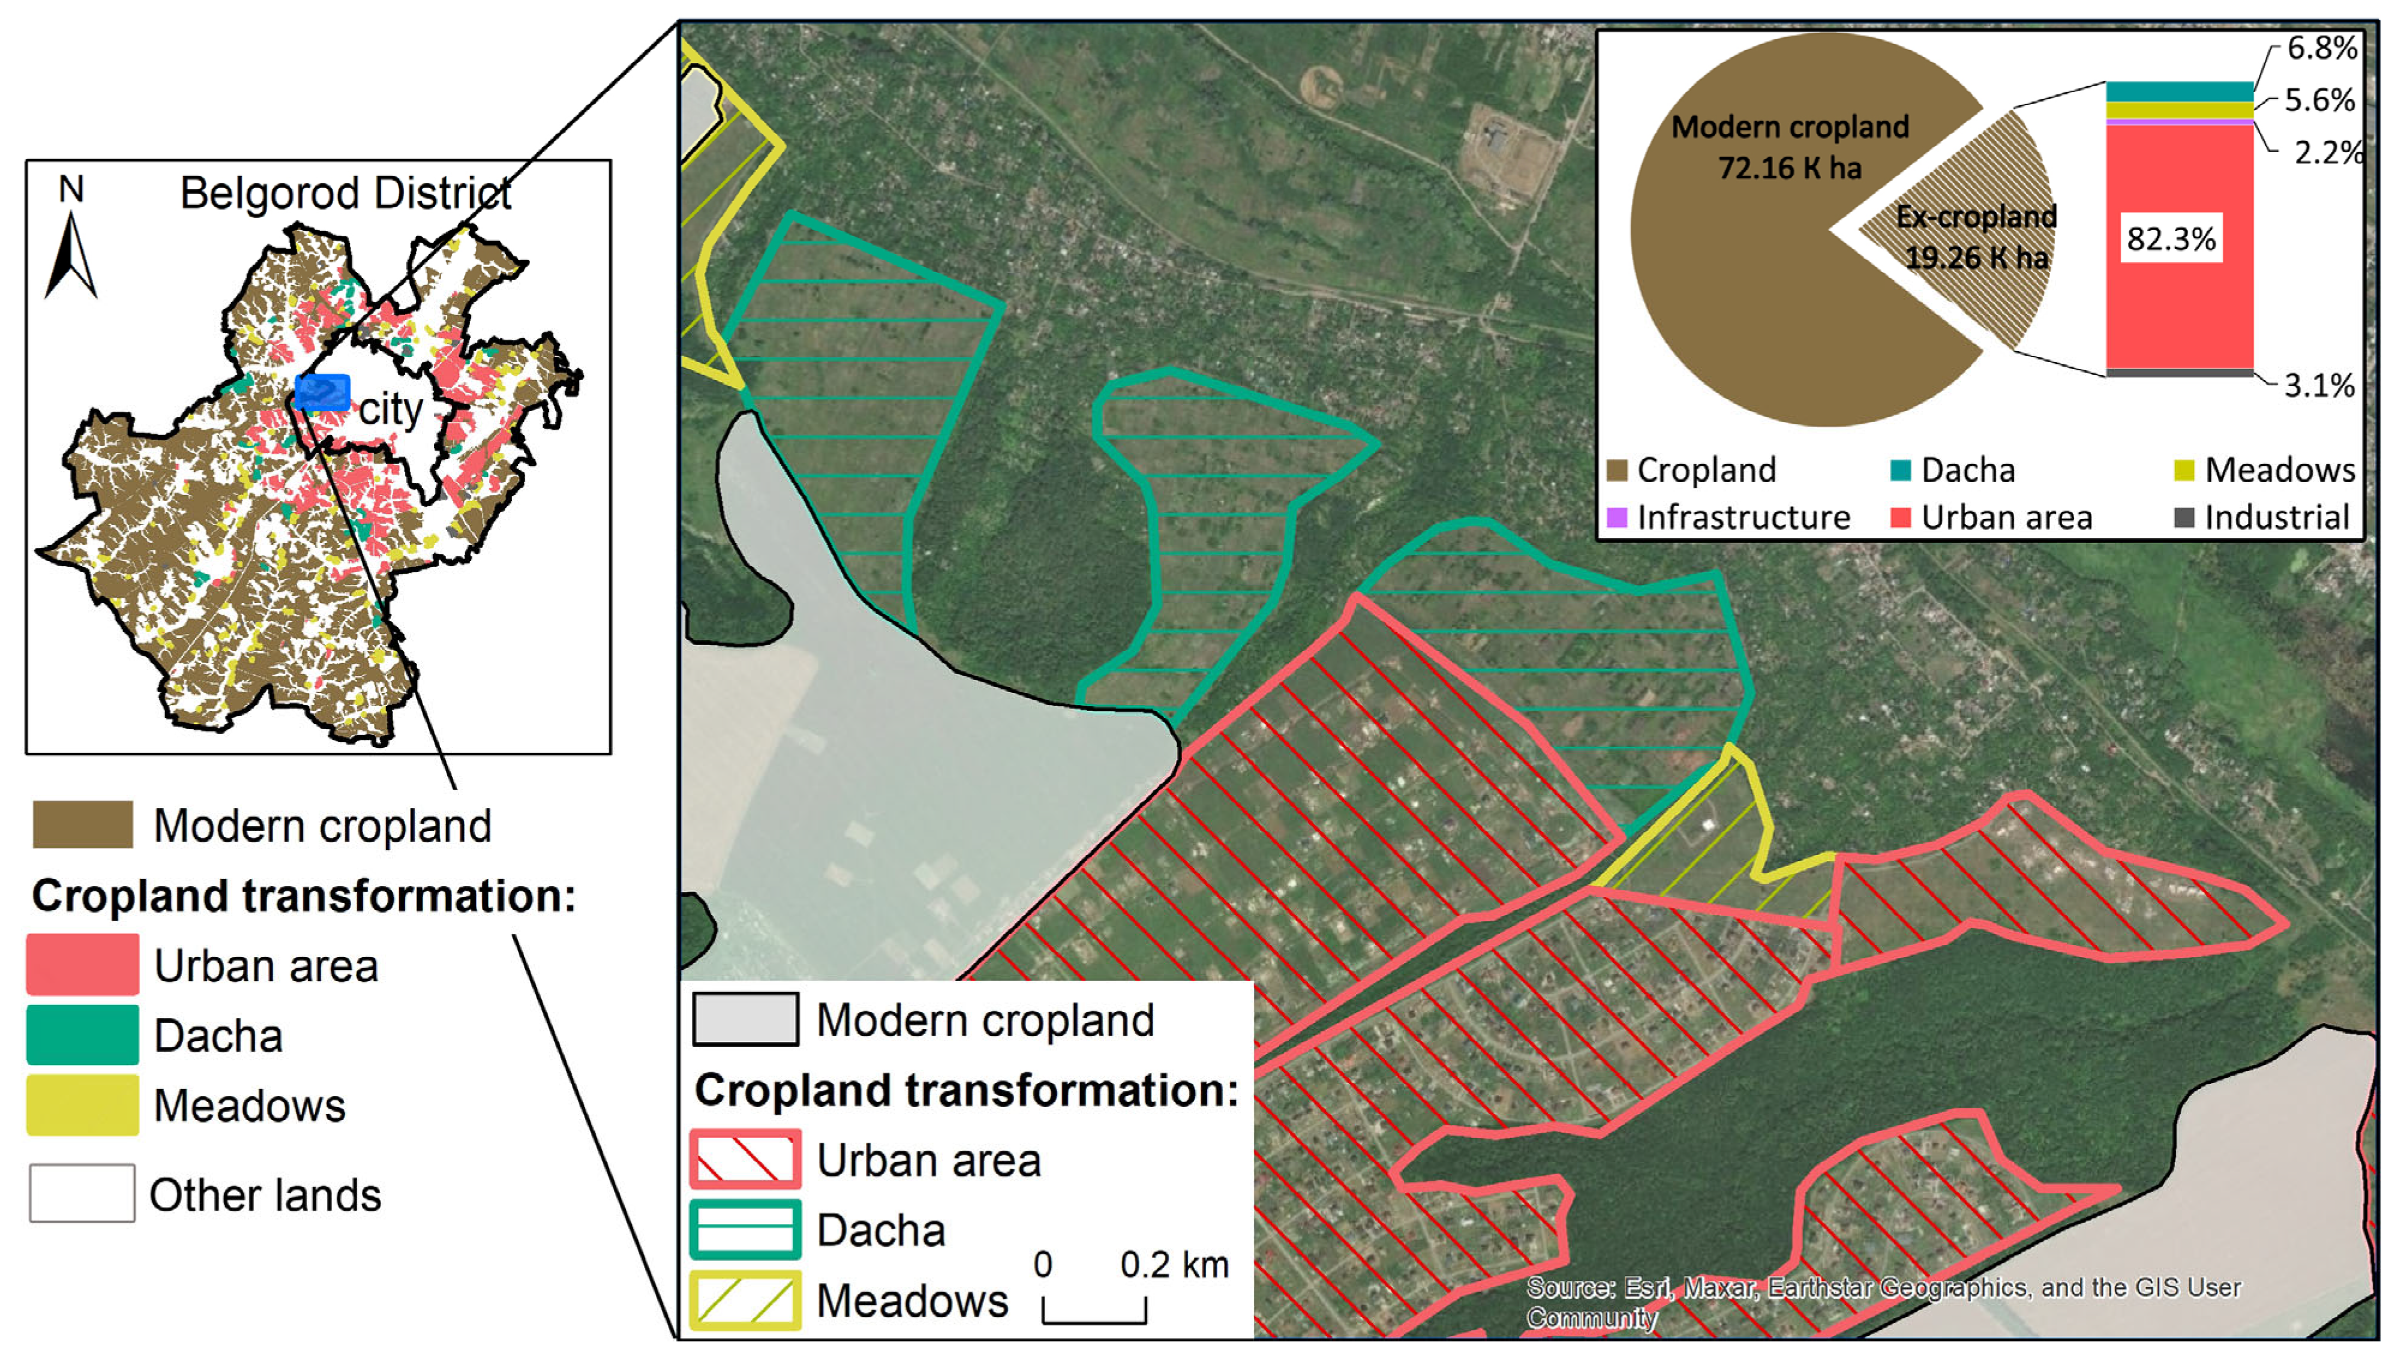
Assessment and forecasting of changes in the spatial structure of arable land were also made within the boundaries of the Belgorod (municipal) district (1474.73 km2; 191,744 inhabitants (2021)), including the city of Belgorod (see Figure 1). Over the past 30 years, in this area, according to official statistics, cropland has decreased by 4.7 thousand ha, which is 28% of the total decrease in cropland in the study region. However, based on the analysis of cartographic sources and satellite images, it was found that during this period cropland decreased by 19.3 thousand ha, which is four times higher than land statistics. The dynamics of cropland in the Belgorod district are shown in Figure 5.
Based on cartographic data of changes in the structure of land in the Belgorod district, it is possible to check the applicability of the model (see Equation (3)) for this area. In the early 1990s, UIA occupied 13.0% of the area of the district (21.2 thousand ha); by 2022, this territory increased to 22.8%. The difference is 9.8%. According to the calculation results, the share of meadows in the district increased by 0.7%. Applying the formula of Equation (3), we obtain a decrease in the share of cropland in the district by 9.9% by 2022, which is 46.2%. According to actual data for 2022, the share of cropland in the area of the district was 44.3%. The difference between the actual and simulated values was 1.9%, which indicates the correctness of the balance regression model and the possibility of its use for the level of the administrative region.
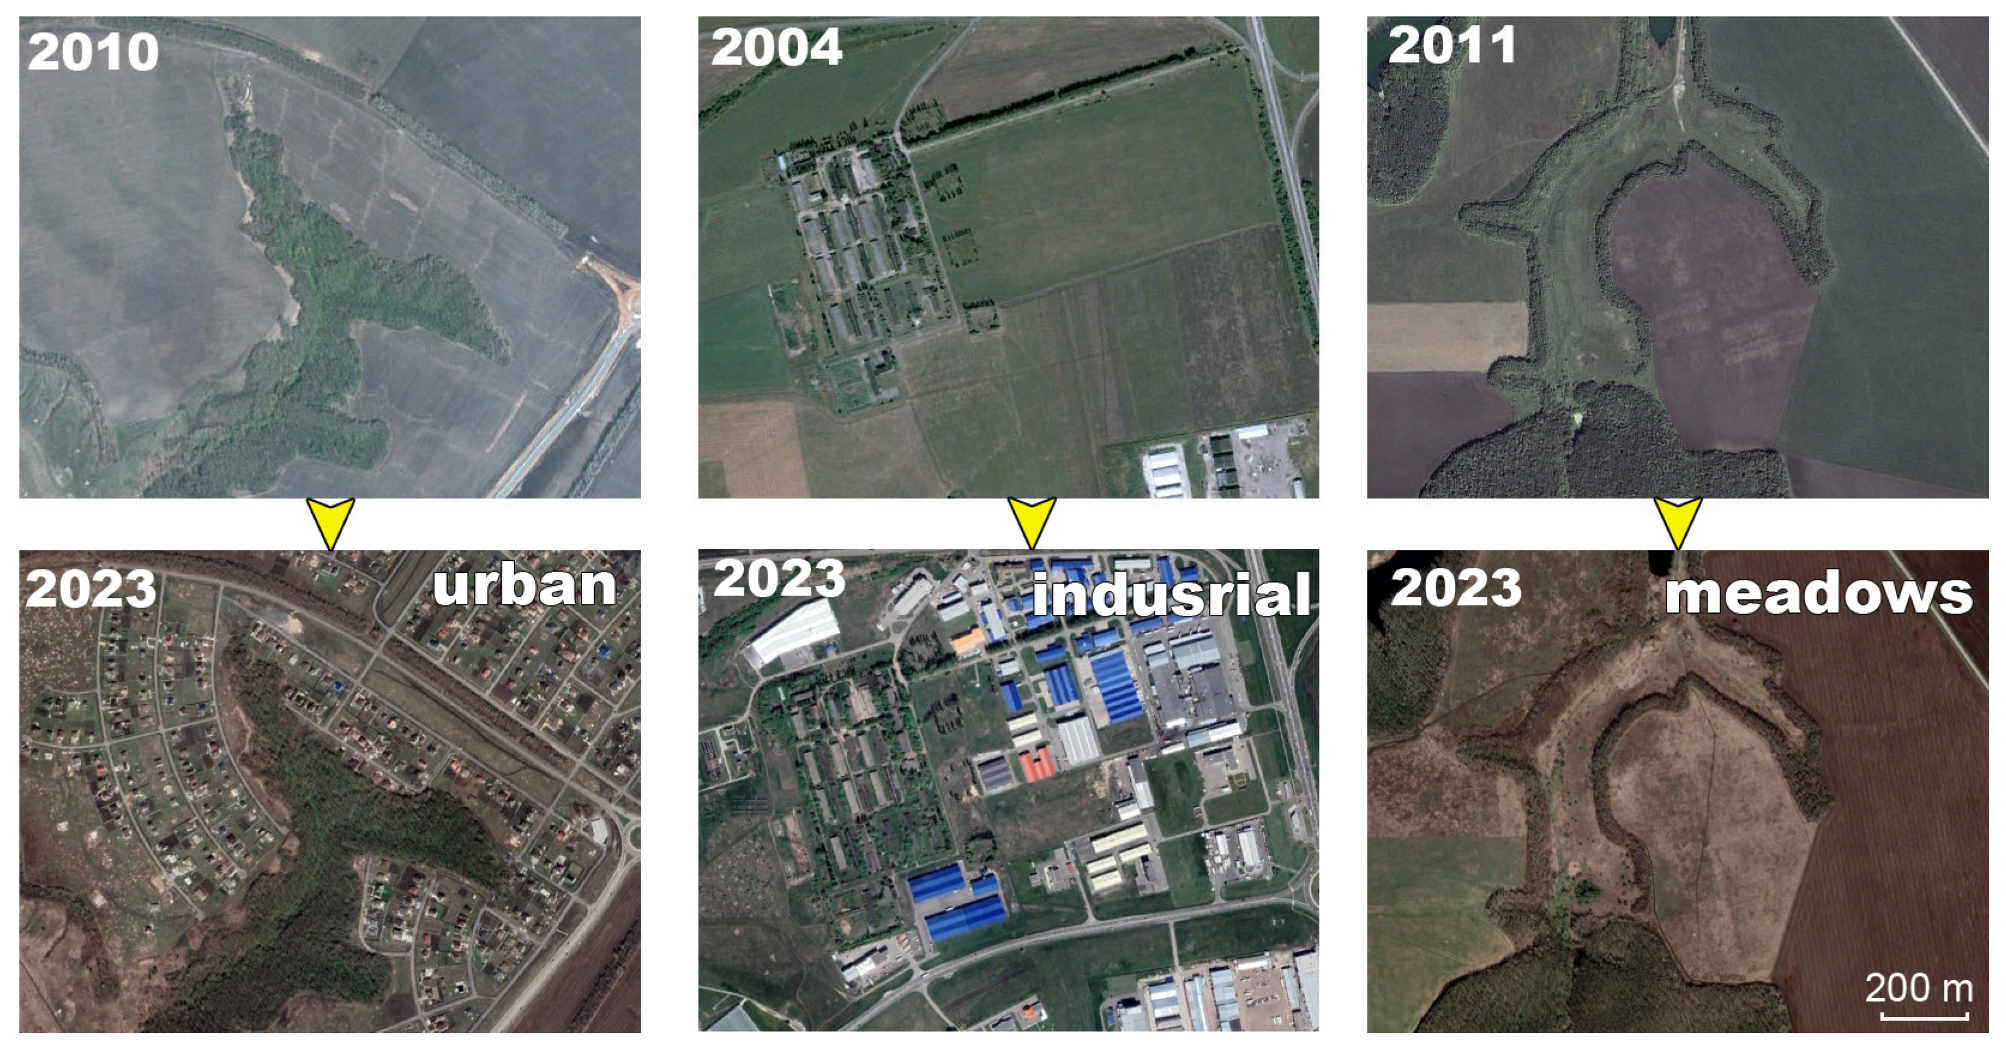
In general, in the Belgorod district, over 30 years, cropland has decreased by 1/5 from the initial state at the beginning of the 1990s. The withdrawn lands were used for three main purposes (Figure 6):
(1)
For the development of urban and suburban areas. Of the total area of reduced cropland, 82% is occupied by land of the private residential sector, 2% by infrastructure land (roads, communications, etc.), and 3% by industrial enterprises (agricultural and manufacturing industries).
(2)
For private horticultural farms. These are the so-called dachas, designed to accommodate private gardens of the population (mainly urban) without permanent residence in these territories. These territories make up 7% of the reduced cropland.
(3)
When converting cropland into meadows. The share of such lands is 6%. Most of these sites are located on slopes that are inconvenient for cultivation, adjacent to the gully and small-dry-valley network, and some of them are actively overgrown with trees and shrubs. Therefore, their re-engagement into plowing at the initiative of land users is unlikely and they can be considered abandoned.
A slight increase in cropland due to the plowing of former meadows was noted. The total area of such territories is 203 ha, which is 0.3% of the area of modern cropland in the district. These isolated cases are an exception to the general trend of agricultural land reduction under the influence of the urbanization process.
For the selected types of land use (UIA, dachas, and meadows), combinations of predictors were selected considering their significance. The predictors were also tested for autocorrelation. As expected, a moderate inverse relationship was found between the distance from the city and the population size (r = −0.63). Therefore, they were not simultaneously involved in the regression equation. After the initial analysis, models with different sets of predictors and the same accuracy were validated on spatial data, which made it possible to select the optimal models (Table 3).
For the type of the land use “Dachas”, despite the statistical significance, the resulting model was rejected, since not a single coincidence of the simulated and actual values was achieved. As a result, two models of land use were investigated: (1) for UIA, and (2) for meadows. The parameters of these models are presented in Table 4.
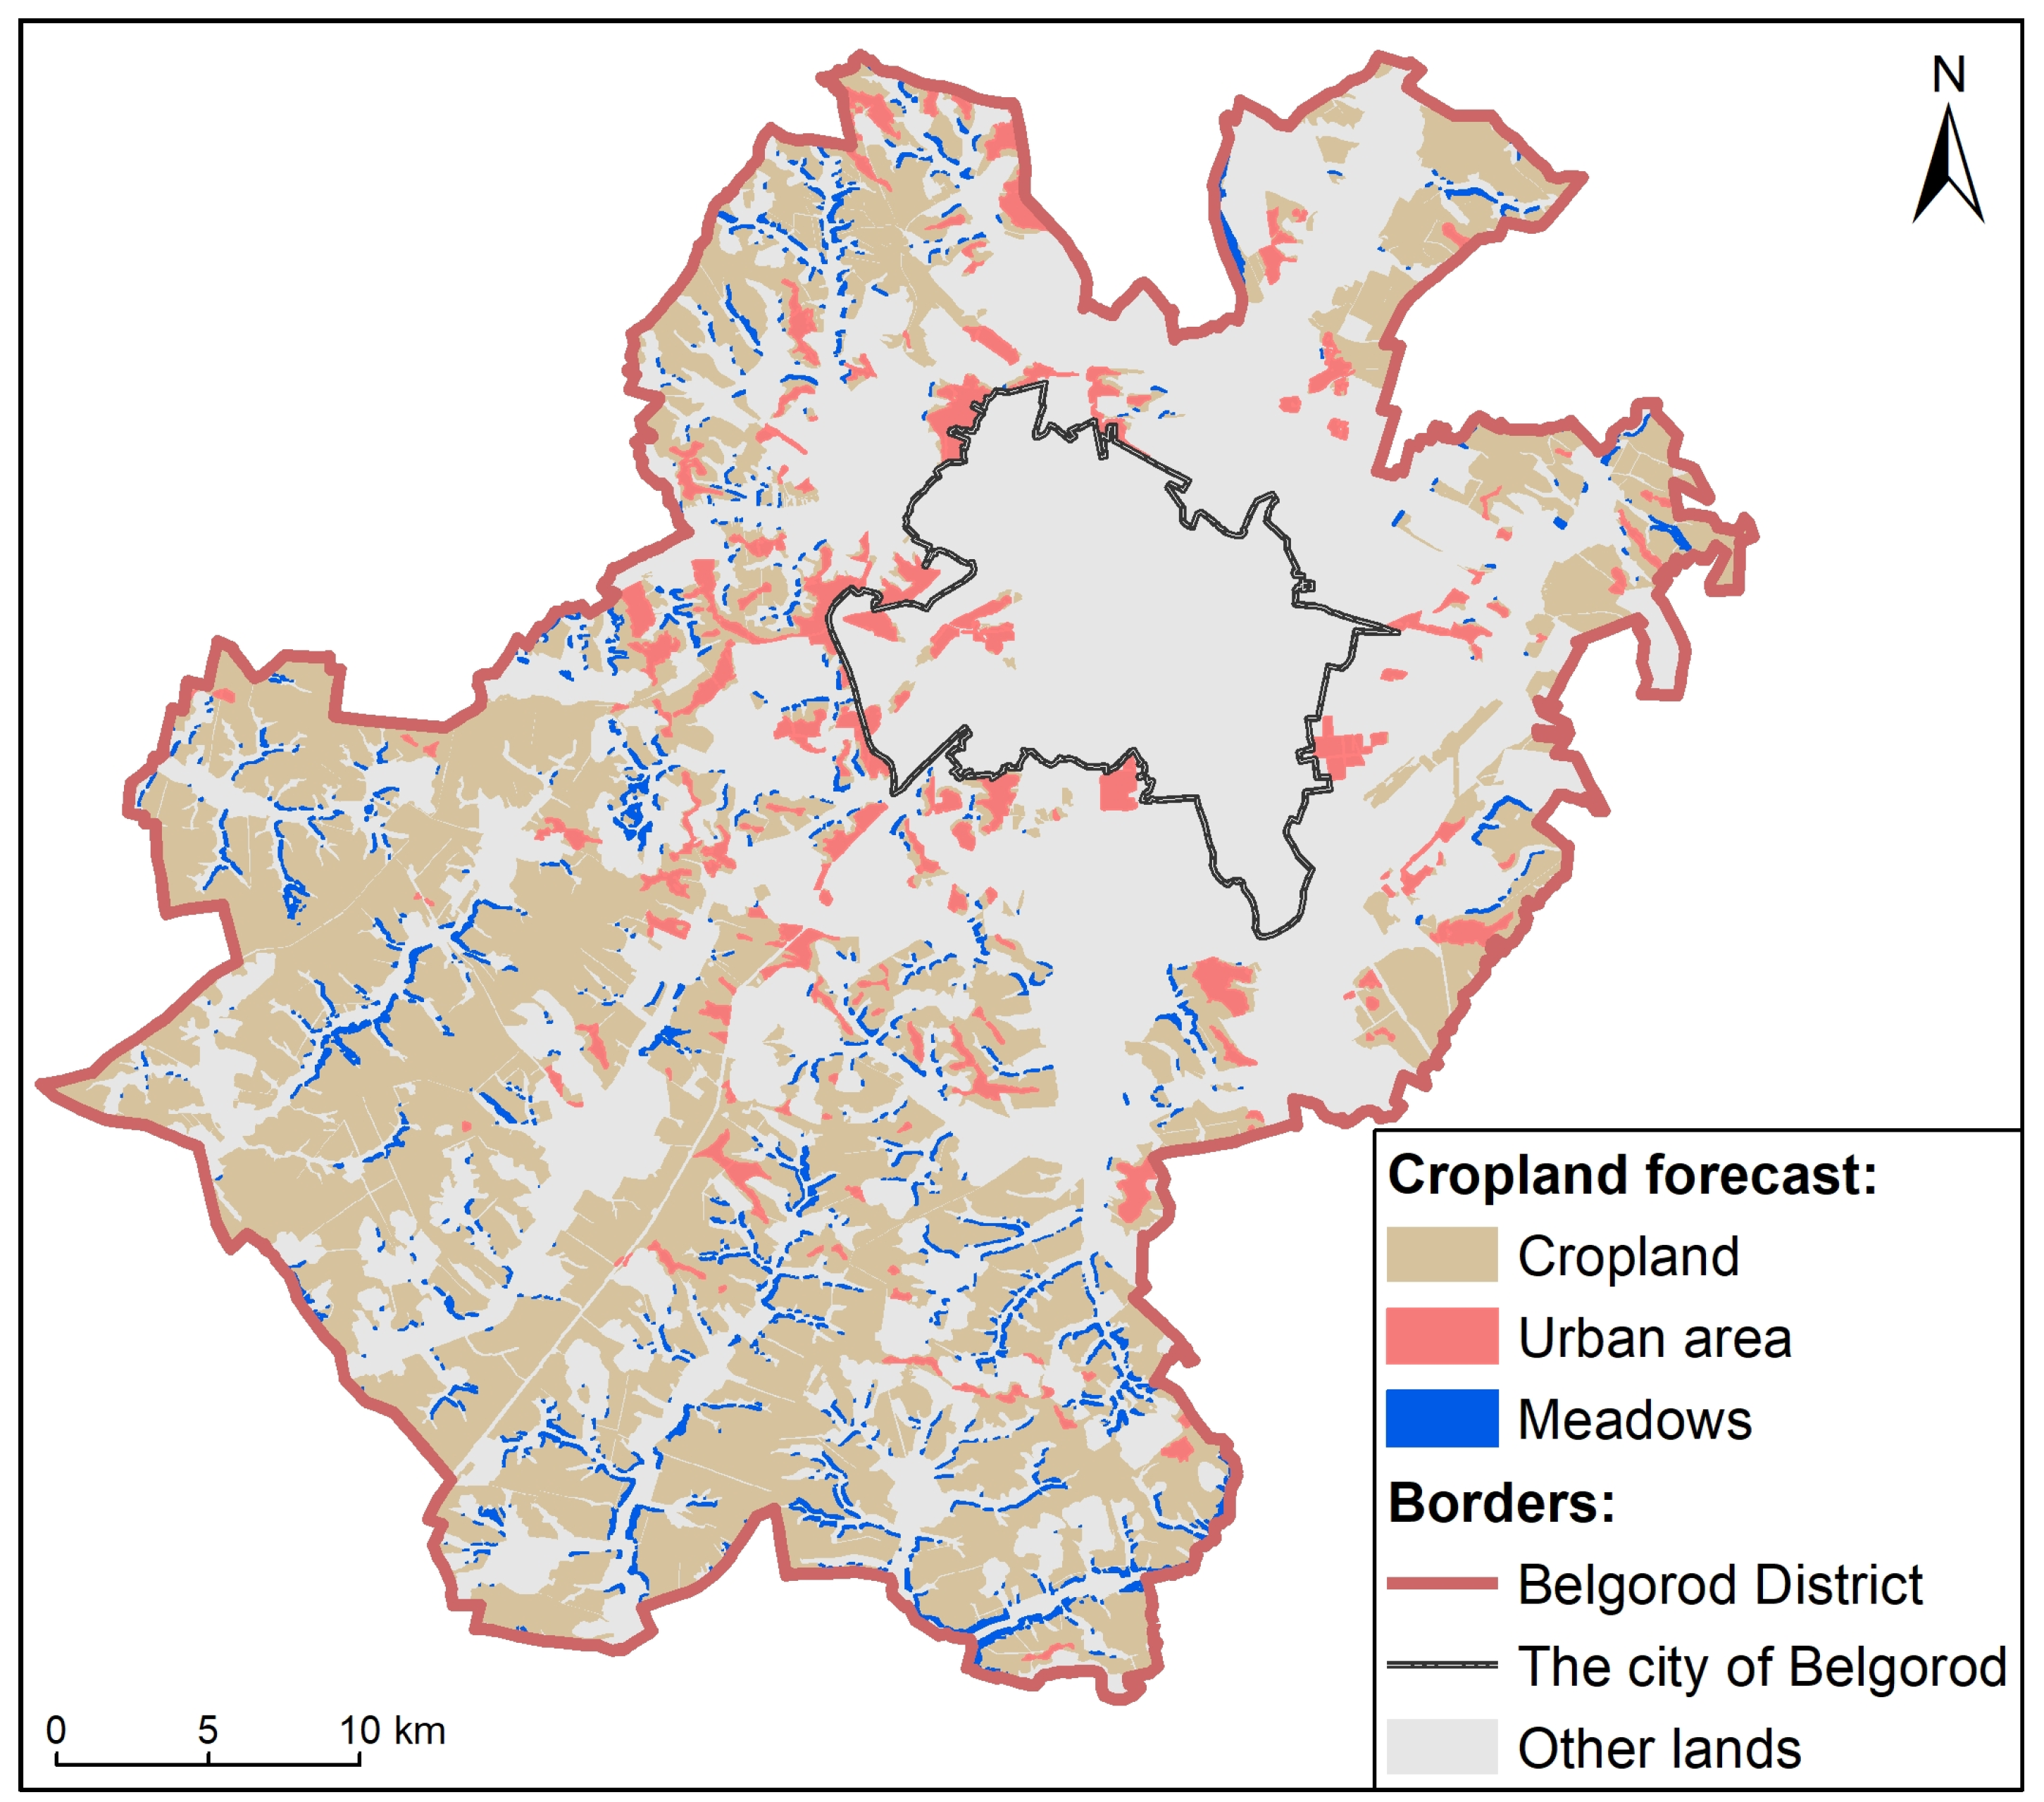
Comparison of the parameters of the models suggests that the transformation of cropland for UIA and for meadows is due to opposite factors. The UIA lands tend more towards gentle surfaces of interfluves and the upper parts of gentle slopes (TPI = 7.3, S = 2.6°); under this type of land use, the most valuable non-eroded soils are transferred, which are located mainly 5 km from the border of the city of Belgorod. Lands under meadows are located in the lower positions of the slope (TPI = −4.7); their steepness is 1.6 times higher than for UIA (S = 4.1°). The amount of abandoned cropland is growing in sparsely populated parts of the district, away from the urban agglomeration. Therefore, the contours of potential UIA and meadows modeled in space do not intersect. A spatial model of the predicted structure of cropland is presented in Figure 7.
If the current trend to reduce the district’s cropland continues, about 6.2 thousand ha will be transferred to UIA, and 2/3 of their area will concentrate within 6 km from the city of Belgorod. The territories of potential transition of cropland to meadows are about 2.9 thousand ha. They are located evenly over the area of the district, but tend to be more towards its periphery. Such territories are confined to the border of cropland and the gully and small-dry-valley network of the district.

5. Discussion

The predicted values of the decrease in the area of cropland in the Belgorod Oblast according to the model of transformation of the land fund are consistent with the overall picture of the dynamics of the area of agricultural land in the country. Since 1990, Russia has been leading in terms of land abandonment among other countries: over 10 years from 1990 to 2000, the area of cultivated land decreased by 31%, which was associated with institutional changes regarding land use [32]. The results of this process were differentiated by landscape–agricultural zones [11,33]: cropland area decreased as much as possible in the southern taiga subzone and was much weaker in the south in the forest-steppe and steppe zones. Since 2004, in European Russia, there has been a stabilization of the total area under crops with a slight increase in some administrative regions [34], which was primarily due to an improvement in the general state of agriculture. However, on a national scale, the area of cropland continues to decline, although at a noticeably slower rate than in the 1990s–2000s.
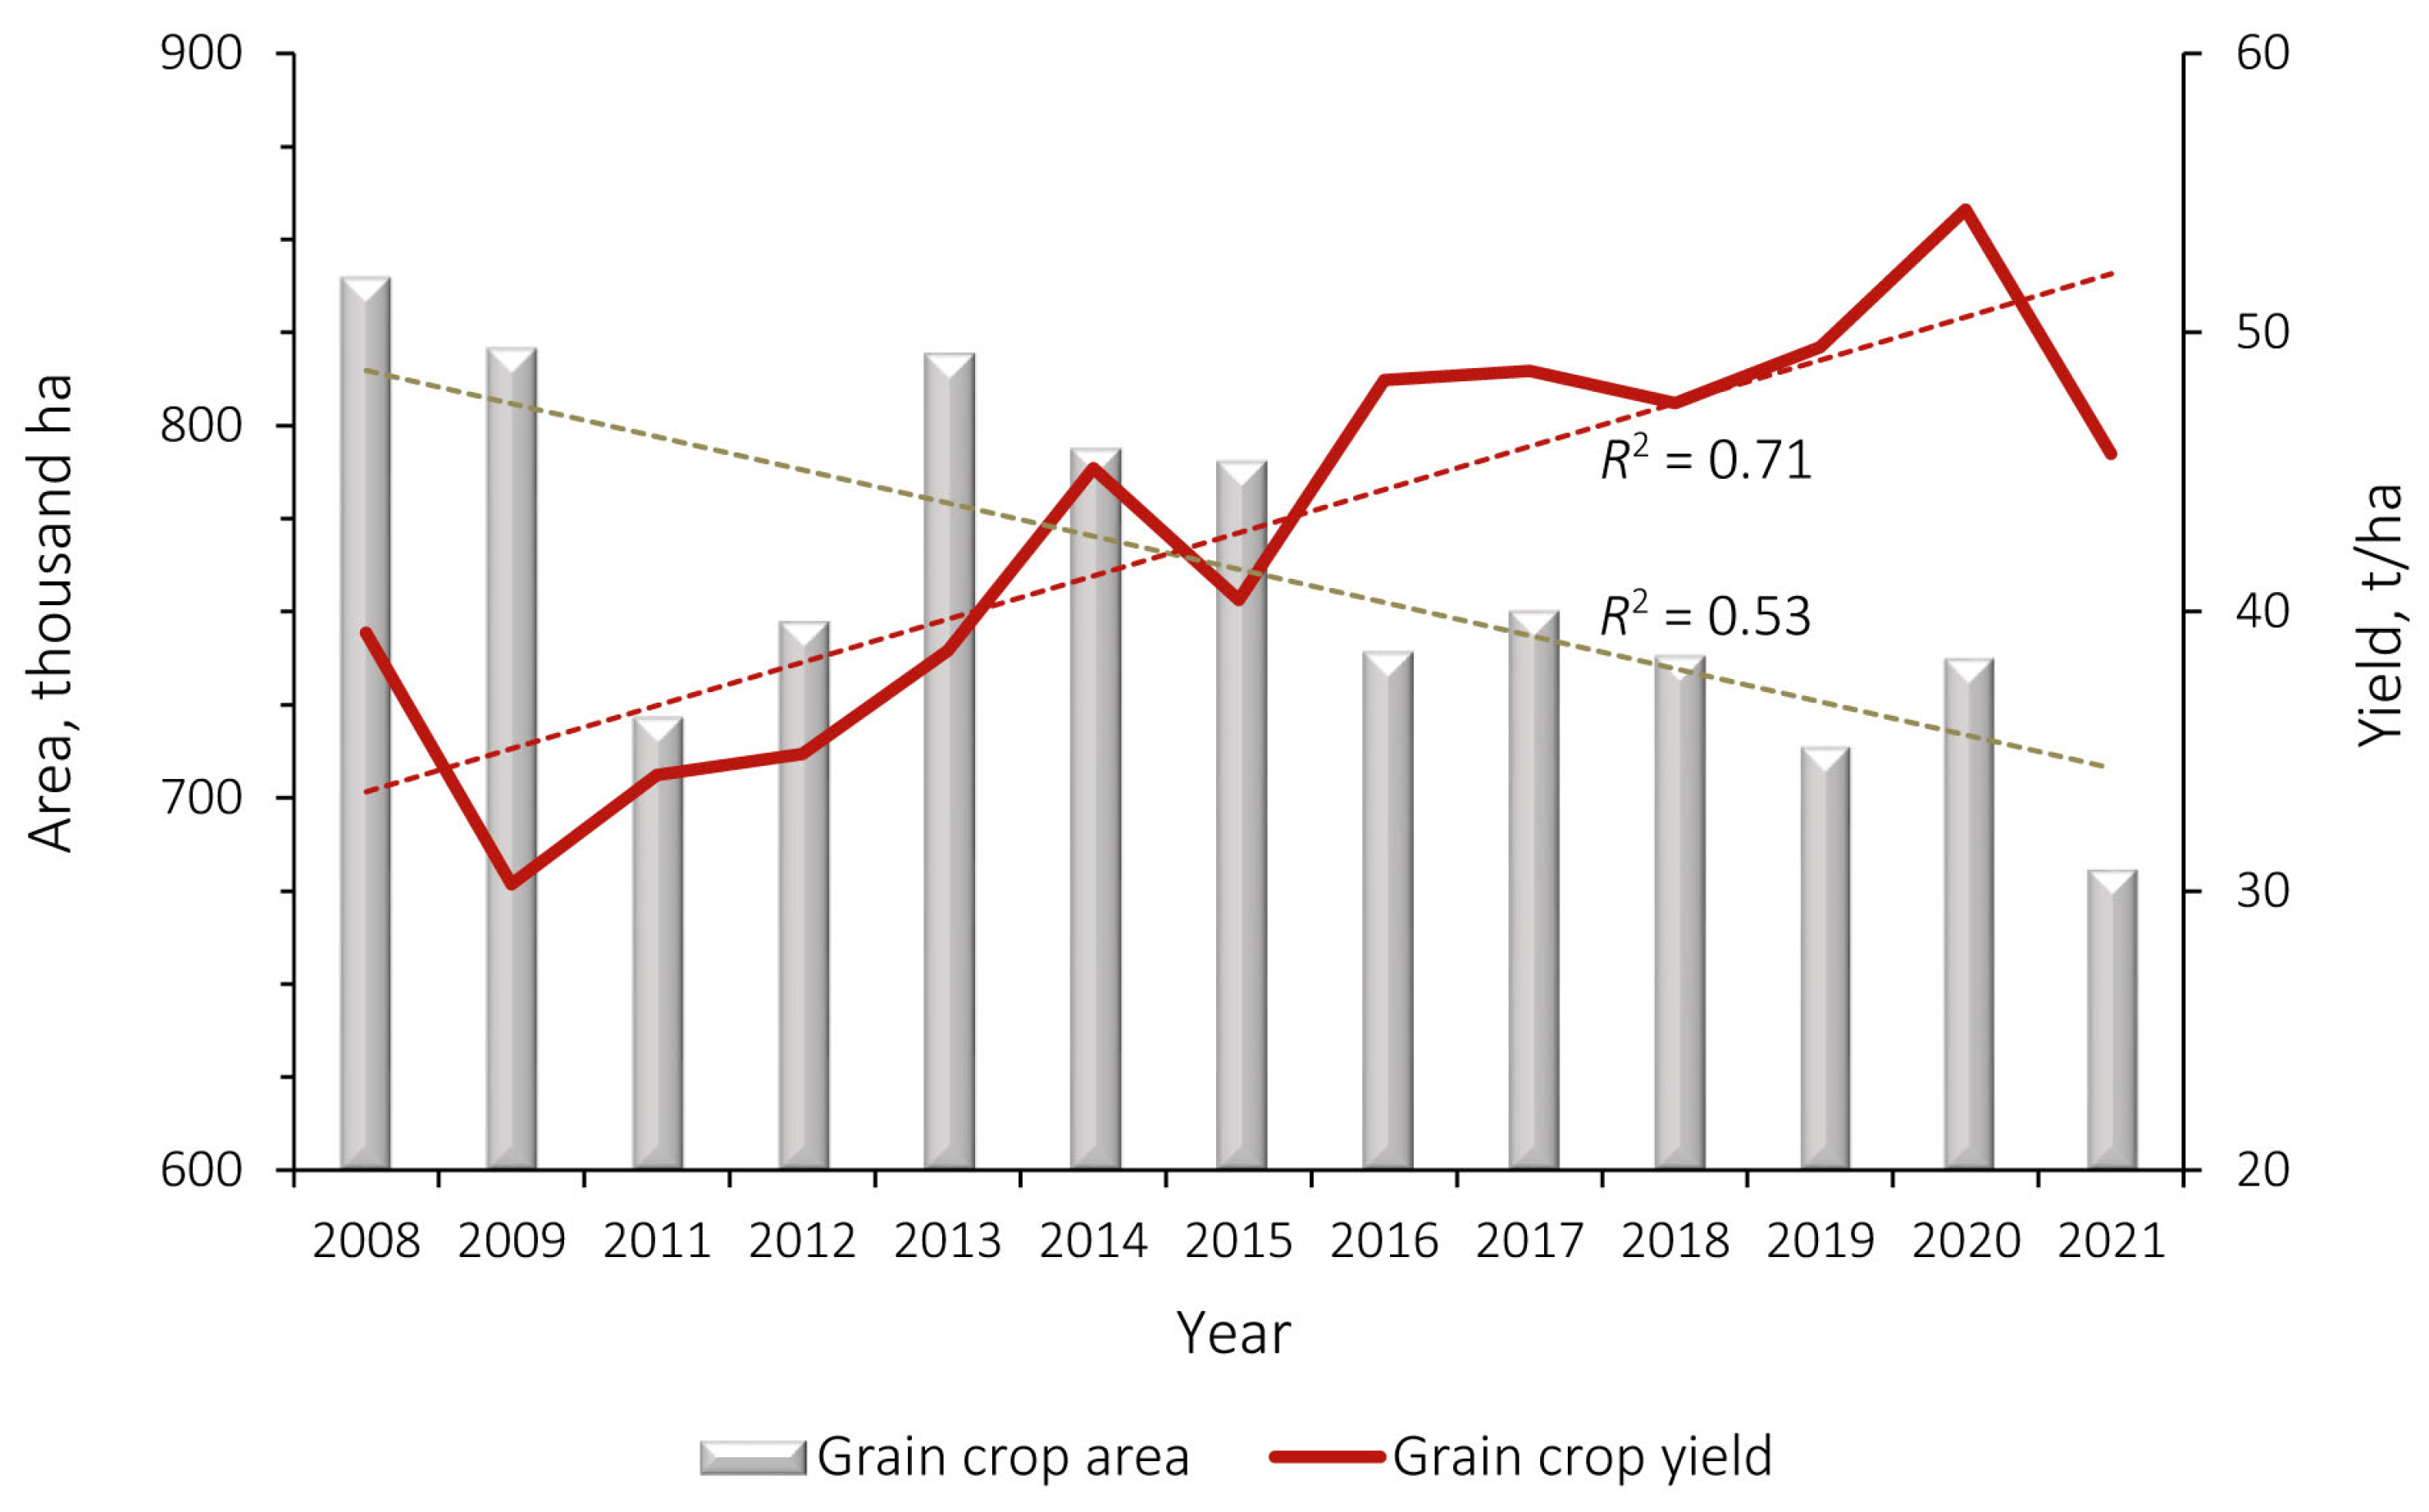
The area of cropland abandoned in the 1990s and still not returned to crop rotation is inconvenient for cultivation or has a high degree of degradation [35]. For the Belgorod Oblast, these are soils with a high risk of soil erosion with water. It is noteworthy that the projected reduction in the area of cropland in the region is due not so much to the effects of soil degradation, but to the development of modern regional programs that involve and develop abandoned agricultural land in the direction of greening and the development of private housing. At the same time, the forecast for the reduction in the area of cropland in the region does not pose a threat to agricultural production, as evidenced with the retrospective yield statistics in the Belgorod Oblast [26] (Figure 8).
Thus, against the background of a 19% reduction in the area under grain crops, the yield increased by 16%. First of all, this was due to the successful implementation of the programs on river-basin nature management, biologization, and adaptive landscape farming in the Belgorod Oblast [36,37].
The obtained forecast estimates of the area of cultivated land in the Belgorod Oblast indicate a trend toward a decrease in the share of cultivated areas. In the context of changing climate, legal, and political boundary conditions, the following assumptions can be made about the validity of the forecast.
Negative agroclimatic trends are recorded throughout the agricultural zone of European Russia [38], affecting primarily the productivity of agricultural crops. The trend of changes in the moisture regime during the growing season is negative, but not so catastrophic as to affect the shift in crop production zones in the near future. Socio-political changes have a much more significant impact. The Belgorod Oblast is a border region of European Russia and has been in a tense political situation since February 2022. Nevertheless, in the current situation, economic activity is carried out at the same pace.
It should be noted that the developed model should be updated depending on innovations and changes in land-use regulation. In forecasting land dynamics for the coming decades, different land-use scenarios can also be analyzed, which will give different spatial patterns and total land areas [39,40]. Regarding the Belgorod Oblast, in the near future, the implementation of the state program for the effective involvement of agricultural land and the development of the reclamation complex of Russia will begin [41]. All this should result in an increase in cropland due to fallows. Restorative forest vegetation successions are quite common on abandoned agricultural lands [42], which makes it very difficult to return these territories to agricultural use. In the Belgorod Oblast, the fallow fund is represented mainly by erosion-prone lands, the development of which implies non-conflict soil-rehabilitation land use under conditions of increased erosion risk [28].

6. Conclusions

The analysis of data on the transformation of the land fund of the Belgorod Oblast made it possible to reveal the temporal rates of the rotation of land resources, to identify trends in the reduction in the most valuable cropland, and to develop a predictive model for their change. According to the results of the established correlation–regression analysis, an equation for the dependence of the areal characteristics of cropland and other lands was obtained. It was found that UIA and meadows have the greatest influence on the change in cropland. The relationship equation is recognized as an empirical model, since both the parameters and the equation as a whole are statistically significant, which means that the resulting land fund transformation model can be used for forecasting purposes. This model can be widely used by authorities to monitor cropland.
Also, in addition to the general regional model, a local spatially distributed model was implemented for the growing urbanized territory (the Belgorod district). In contrast to the balance model, it is based on a spatial combination of independent factors (terrain features, distance from the city border and other settlements, and population size). As a result, areas of cropland with a high probability (P > 0.75) of conversion to other types of land use were identified.
The models presented in the study make it possible to make preliminary forecasts when managing the structure of the land fund. The scope of application of these models can be carried out at the regional level. However, the general concept of this approach to forecasting the area of cultivated land and the threat of its reduction due to the need to replace other types of land can be tested in other agricultural regions and countries with developing urbanization processes, taking into account natural geographical and socio-economic conditions. It can serve as an example for practice to predict the consequences of land rotation on their quantitative composition.

Author Contributions

Conceptualization, Z.A.B.; methodology, Z.A.B. and O.I.G.; software, A.V.G.; validation, Z.A.B. and O.I.G.; formal analysis, Z.A.B. and A.V.G.; investigation, O.I.G.; resources, O.I.G.; data curation, A.V.G.; writing—original draft preparation, Z.A.B. and O.I.G.; writing—review and editing, Z.A.B. and A.V.G.; visualization, Z.A.B.; supervision, A.V.G.; project administration, Z.A.B.; funding acquisition, Z.A.B. and A.V.G. All authors have read and agreed to the published version of the manuscript.

Funding

This research was funded by the Ministry of Science and Higher Education of the Russian Federation within the framework of State Assignment No. FZWG-2023-0011 (collection, preparation, and compilation of statistical data; development model of arable land transformation). The work was also carried out in accordance with the Strategic Academic Leadership Program “Priority 2030” of the Kazan Federal University of the Government of the Russian Federation (statistical data analysis).

Institutional Review Board Statement

Not applicable.

Informed Consent Statement

Not applicable.

Data Availability Statement

Not applicable.

Conflicts of Interest

The authors declare no conflict of interest. The funders had no role in the design of the study; in the collection, analyses, or interpretation of data; in the writing of the manuscript; or in the decision to publish the results.

References

  1. FAO. The State of the World’s Land and Water Resources for Food and Agriculture—Systems at Breaking Point; Main Report; FAO: Rome, Italy, 2022. [Google Scholar] [CrossRef]
  2. Lisetskii, F. Water resources of rivers and erosion-accumulation processes. Biosci. Biotechnol. Res. Commun. 2022, 15, 580–582. [Google Scholar] [CrossRef]
  3. Cameron, D.; Osborne, C.; Horton, P.; Sinclair, M.A. Sustainable Model for Intensive Agriculture; Grantham Centre Briefing Note; Grantham Centre for Sustainable Futures & the University of Sheffield: Sheffield, UK, 2015. [Google Scholar]
  4. Colsaet, A.; Laurans, Y.; Levrel, H. What drives land take and urban land expansion? A systematic review. Land Use Policy 2018, 79, 339–349. [Google Scholar] [CrossRef]
  5. Hanta, E.; Bakker, M. Abandonment and expansion of arable land in Europe. Ecosystem 2011, 14, 720–731. [Google Scholar] [CrossRef]
  6. Wu, X.D.; Guo, J.L.; Han, M.Y.; Chen, G.Q. An overview of arable land use for the world economy: From source to sink via the global supply chain. Land Use Policy 2018, 76, 201–214. [Google Scholar] [CrossRef]
  7. Voronkova, O.Y.; Akhmetshin, E.M.; Sycheva, I.N.; Shpakova, R.N.; Pashkova, E.Y.; Poltarykhin, A.L. Economic mechanism of regulating land relations in the agricultural sector of Russia. Eur. Res. Stud. J. 2018, 21, 280–291. [Google Scholar] [CrossRef]
  8. Prăvălie, R.; Patriche, C.; Borrelli, P.; Panagos, P.; Roșca, B.; Dumitraşcu, M.; Nita, I.; Săvulescu, I.; Birsan, M.; Bandoc, G. Arable lands under the pressure of multiple land degradation processes. A global perspective. Environ. Res. 2021, 194, 110697. [Google Scholar] [CrossRef]
  9. Nekrich, A.S.; Lyuri, D.I. Changes of the dynamic of agrarian lands of Russia in 1990–2014. Izv. Ross. Akad. Nauk. Seriya Geogr. 2019, 3, 64–77. (In Russian) [Google Scholar] [CrossRef]
  10. Golosov, V.N.; Collins, A.L.; Dobrovolskaya, N.G.; Bazhenova, O.I.; Ryzhov, Y.V.; Sidorchuk, A.Y. Soil loss on the arable lands of the forest-steppe and steppe zones of European Russia and Siberia during the period of intensive agriculture. Geoderma 2021, 381, 114678. [Google Scholar] [CrossRef]
  11. Gusarov, A.V. Land-use/-cover changes and their effect on soil erosion and river suspended sediment load in different landscape zones of European Russia during 1970–2017. Water 2021, 13, 1631. [Google Scholar] [CrossRef]
  12. Singh, S.K.; Srivastava, P.K.; Szilárd, S.; Petropoulos, G.P.; Gupta, M.; Islam, M. Landscape transform and spatial metrics for mapping spatiotemporal land cover dynamics using Earth Observation data-sets. Geocarto Int. 2016, 32, 113–127. [Google Scholar] [CrossRef]
  13. Soma, A.S.; Kubota, T.; Aditian, A. Comparative study of land use change and landslide susceptibility using frequency ratio, certainty factor, and logistic regression in upper area of Ujung-Loe watersheds, South Sulawesi, Indonesia. Int. J. Eros. Control Eng. 2019, 11, 103–115. [Google Scholar] [CrossRef]
  14. Lambin, E.F.; Rounsevell, M.D.A.; Geist, H.J. Are agricultural land-use models able to predict changes in land-use intensity? Agric. Ecosyst. Environ. 2000, 82, 321–331. [Google Scholar] [CrossRef]
  15. Briassoulis, H. Analysis of Land Use Change: Theoretical and Modeling Approaches, 2nd ed.; Loveridge, S., Jackson, R., Eds.; WVU Research Repository: Morgantown, WV, USA, 2020; Available online: https://researchrepository.wvu.edu/rri-web-book (accessed on 24 January 2023).
  16. Feng, Y.; Lei, Z.; Tong, X.; Gao, C.; Chen, S.; Wang, J.; Wang, S. Spatially-explicit modeling and intensity analysis of China’s land use change 2000–2050. J. Environ. Manag. 2020, 263, 110407. [Google Scholar] [CrossRef] [PubMed]
  17. Liu, D.; Zheng, X.; Wang, H. Land-use simulation and decision-support system (LandSDS): Seamlessly integrating system dynamics, agent-based model, and cellular automata. Ecol. Model. 2020, 417, 108924. [Google Scholar] [CrossRef]
  18. Baker, W.L. A review of models of landscape change. Landsc. Ecol. 1989, 2, 111–133. [Google Scholar] [CrossRef]
  19. Weng, Q. Land use change analysis in the Zhujiang delta of China using satellite remote sensing, GIS and stochastic modeling. J. Environ. Manag. 2002, 64, 273–284. [Google Scholar] [CrossRef] [PubMed]
  20. Kovyazin, V.F.; Thi Xuan, N. Development of predictive models of land use change in Vietnam. Bull. Tomsk Polytech. Univ. Geo Assets Eng. 2019, 330, 221–229. (In Russian) [Google Scholar]
  21. Hyka, I.; Hysa, A.; Dervishi, S.; Solomun, M.K.; Kuriqi, A.; Vishwakarma, D.K.; Sestras, P. Spatiotemporal dynamics of landscape transformation in Western Balkans’ metropolitan areas. Land 2022, 11, 1892. [Google Scholar] [CrossRef]
  22. Federal Service for State Registration. Cadaster and Cartography. State (National) Report on the State and Use of Land. Available online: https://rosreestr.gov.ru/activity/gosudarstvennoe-upravlenie-v-sfere-ispolzovaniya-i-okhrany-zemel/gosudarstvennyy-natsionalnyy-doklad-o-sostoyanii-i-ispolzovanii-zemel-rossiyskoy-federatsii/ (accessed on 24 January 2023).
  23. Matasov, V.; Prishchepov, A.V.; Jepsen, M.R.; Müller, D. Spatial determinants and underlying drivers of land-use transitions in European Russia from 1770 to 2010. J. Land Use Sci. 2019, 14, 362–377. [Google Scholar] [CrossRef]
  24. Chugunova, N.; Polyakova, T.; Morkovskaya, D.; Narozhnaya, A.; Kuharuk, N. Spatial differentiation of border areas of the Central Black Earth Region in metropolisation processes. In Proceeding of the 3rd International Conference Spatial Development of Territories (SDT 2020), Belgorod, Russia, 26–27 November 2020; Stryabkova, E., Ed.; Atlantis Press: Dordrecht, The Netherlands, 2021; Volume 181, pp. 14–19. [Google Scholar] [CrossRef]
  25. Lisetskii, F.N.; Buryak, Z.A. Runoff of water and its quality under the combined impact of agricultural activities and urban development in a small river basin. Water 2023, 15, 2443. [Google Scholar] [CrossRef]
  26. Russian Federal State Statistics Service for Belgorod Oblast. Available online: https://belg.gks.ru/belg_db (accessed on 24 January 2023).
  27. Public Cadastral Map of Russia. Available online: https://pkk.rosreestr.ru (accessed on 26 July 2023).
  28. Buryak, Z.A.; Narozhnyaya, A.G.; Gusarov, A.V.; Beylich, A.A. Solutions for the spatial organization of cropland with increased erosion risk at the regional level: A case study of Belgorod Oblast, European Russia. Land 2022, 11, 1492. [Google Scholar] [CrossRef]
  29. Sarkar, A.; Chouhan, P. Dynamic simulation of urban expansion based on Cellular Automata and Markov Chain Model: A case study in Siliguri Metropolitan Area, West Bengal. Model. Earth Syst. Environ. 2019, 5, 1723–1732. [Google Scholar] [CrossRef]
  30. Nouri, J.; Gharagozlou, A.; Arjmandi, R.; Faryadi, S.; Adl, M. Predicting urban land use changes using a CA–Markov model. Arab. J. Sci. Eng. 2014, 39, 5565–5573. [Google Scholar] [CrossRef]
  31. Grigoreva, O.I.; Marinina, O.A.; Zelenskaya, E.Y. Spatial and temporal changes in the land resources of the Belgorod region from 1954 to 2017 under the influence of anthropogenic factors. Biosci. Biotechnol. Res. Commun. 2020, 13, 60–67. [Google Scholar] [CrossRef]
  32. Prishchepov, A.V.; Müller, D.; Baumann, M.; Kuemmerle, T.; Alcantara, C.; Radeloff, V.C. Underlying drivers and spatial determinants of post-Soviet agricultural land abandonment in temperate Eastern Europe. In Land-Cover and Land-Use Changes in Eastern Europe after the Collapse of the Soviet Union in 1991; Gutman, G., Radeloff, V., Eds.; Springer: Cham, Switzerland, 2017; pp. 91–117. [Google Scholar] [CrossRef]
  33. Litvin, L.F.; Kiryukhina, Z.P.; Krasnov, S.F.; Dobrovol’skaya, N.G. Dynamics of agricultural soil erosion in European Russia. Eurasian Soil Sci. 2017, 50, 1344–1353. [Google Scholar] [CrossRef]
  34. Kitov, M.V.; Tsapkov, A.N. Assessment of the area of fallow land in the Belgorod region and other regions of European Russia for the period 1990–2013 years. Belgorod State Univ. Sci. Bull. Nat. Sci. Ser. 2015, 15, 163–171. (In Russian) [Google Scholar]
  35. Ivanov, M.A.; Prishchepov, A.V.; Golosov, V.N.; Zalyaliev, R.R.; Efimov, K.V.; Kondrat’eva, A.A.; Kinyashova, A.D.; Ionova, Y.K. Changes of cropland area in the river basins of the European part of Russia for the period 1985–2015, as a factor of soil erosion dynamics. Sovrem. Probl. Distantsionnogo Zondirovaniya Zemli Iz Kosmosa 2017, 14, 149–157. [Google Scholar] [CrossRef]
  36. Lisetskii, F.N.; Pavlyuk, Y.V.; Kirilenko, Z.A.; Pichura, V.I. Basin organization of nature management for solving hydroecological problems. Russ. Meteorol. Hydrol. 2014, 39, 550–557. [Google Scholar] [CrossRef]
  37. Savchenko, E.S.; Kiryushin, V.I.; Lukin, S.V. Experience of biologization of agricultural technologies during the development of adaptive-landscape agricultural systems in Belgorod region. Int. Agric. J. 2022, 6, 658–661. (In Russian) [Google Scholar] [CrossRef]
  38. Pavlova, V.N.; Calanca, P.; Karachenkova, A.A. Grain crops productivity in the European Part of Russia under recent climate change. Russ. Meteorol. Hydrol. 2020, 45, 290–302. [Google Scholar] [CrossRef]
  39. Chen, Z.; Huang, M.; Zhu, D.; Altan, O. Integrating remote sensing and a Markov-FLUS model to simulate future land use changes in Hokkaido, Japan. Remote Sens. 2021, 13, 2621. [Google Scholar] [CrossRef]
  40. Deng, Z.; Quan, B. Intensity characteristics and multi-scenario projection of land use and land cover change in Hengyang, China. Int. J. Environ. Res. Public Health 2022, 19, 8491. [Google Scholar] [CrossRef]
  41. Volkov, S.N. Complex land use planning as a mechanism for restoration of the unused agricultural lands. Land Manag. Monit. Cadastre 2022, 7, 437–441. (In Russian) [Google Scholar] [CrossRef]
  42. Terekhin, E.A. Parameters of abandoned agricultural lands and their reflectance in the Central Russian forest-steppe. Reg. Geosyst. 2022, 46, 356–365. (In Russian) [Google Scholar]
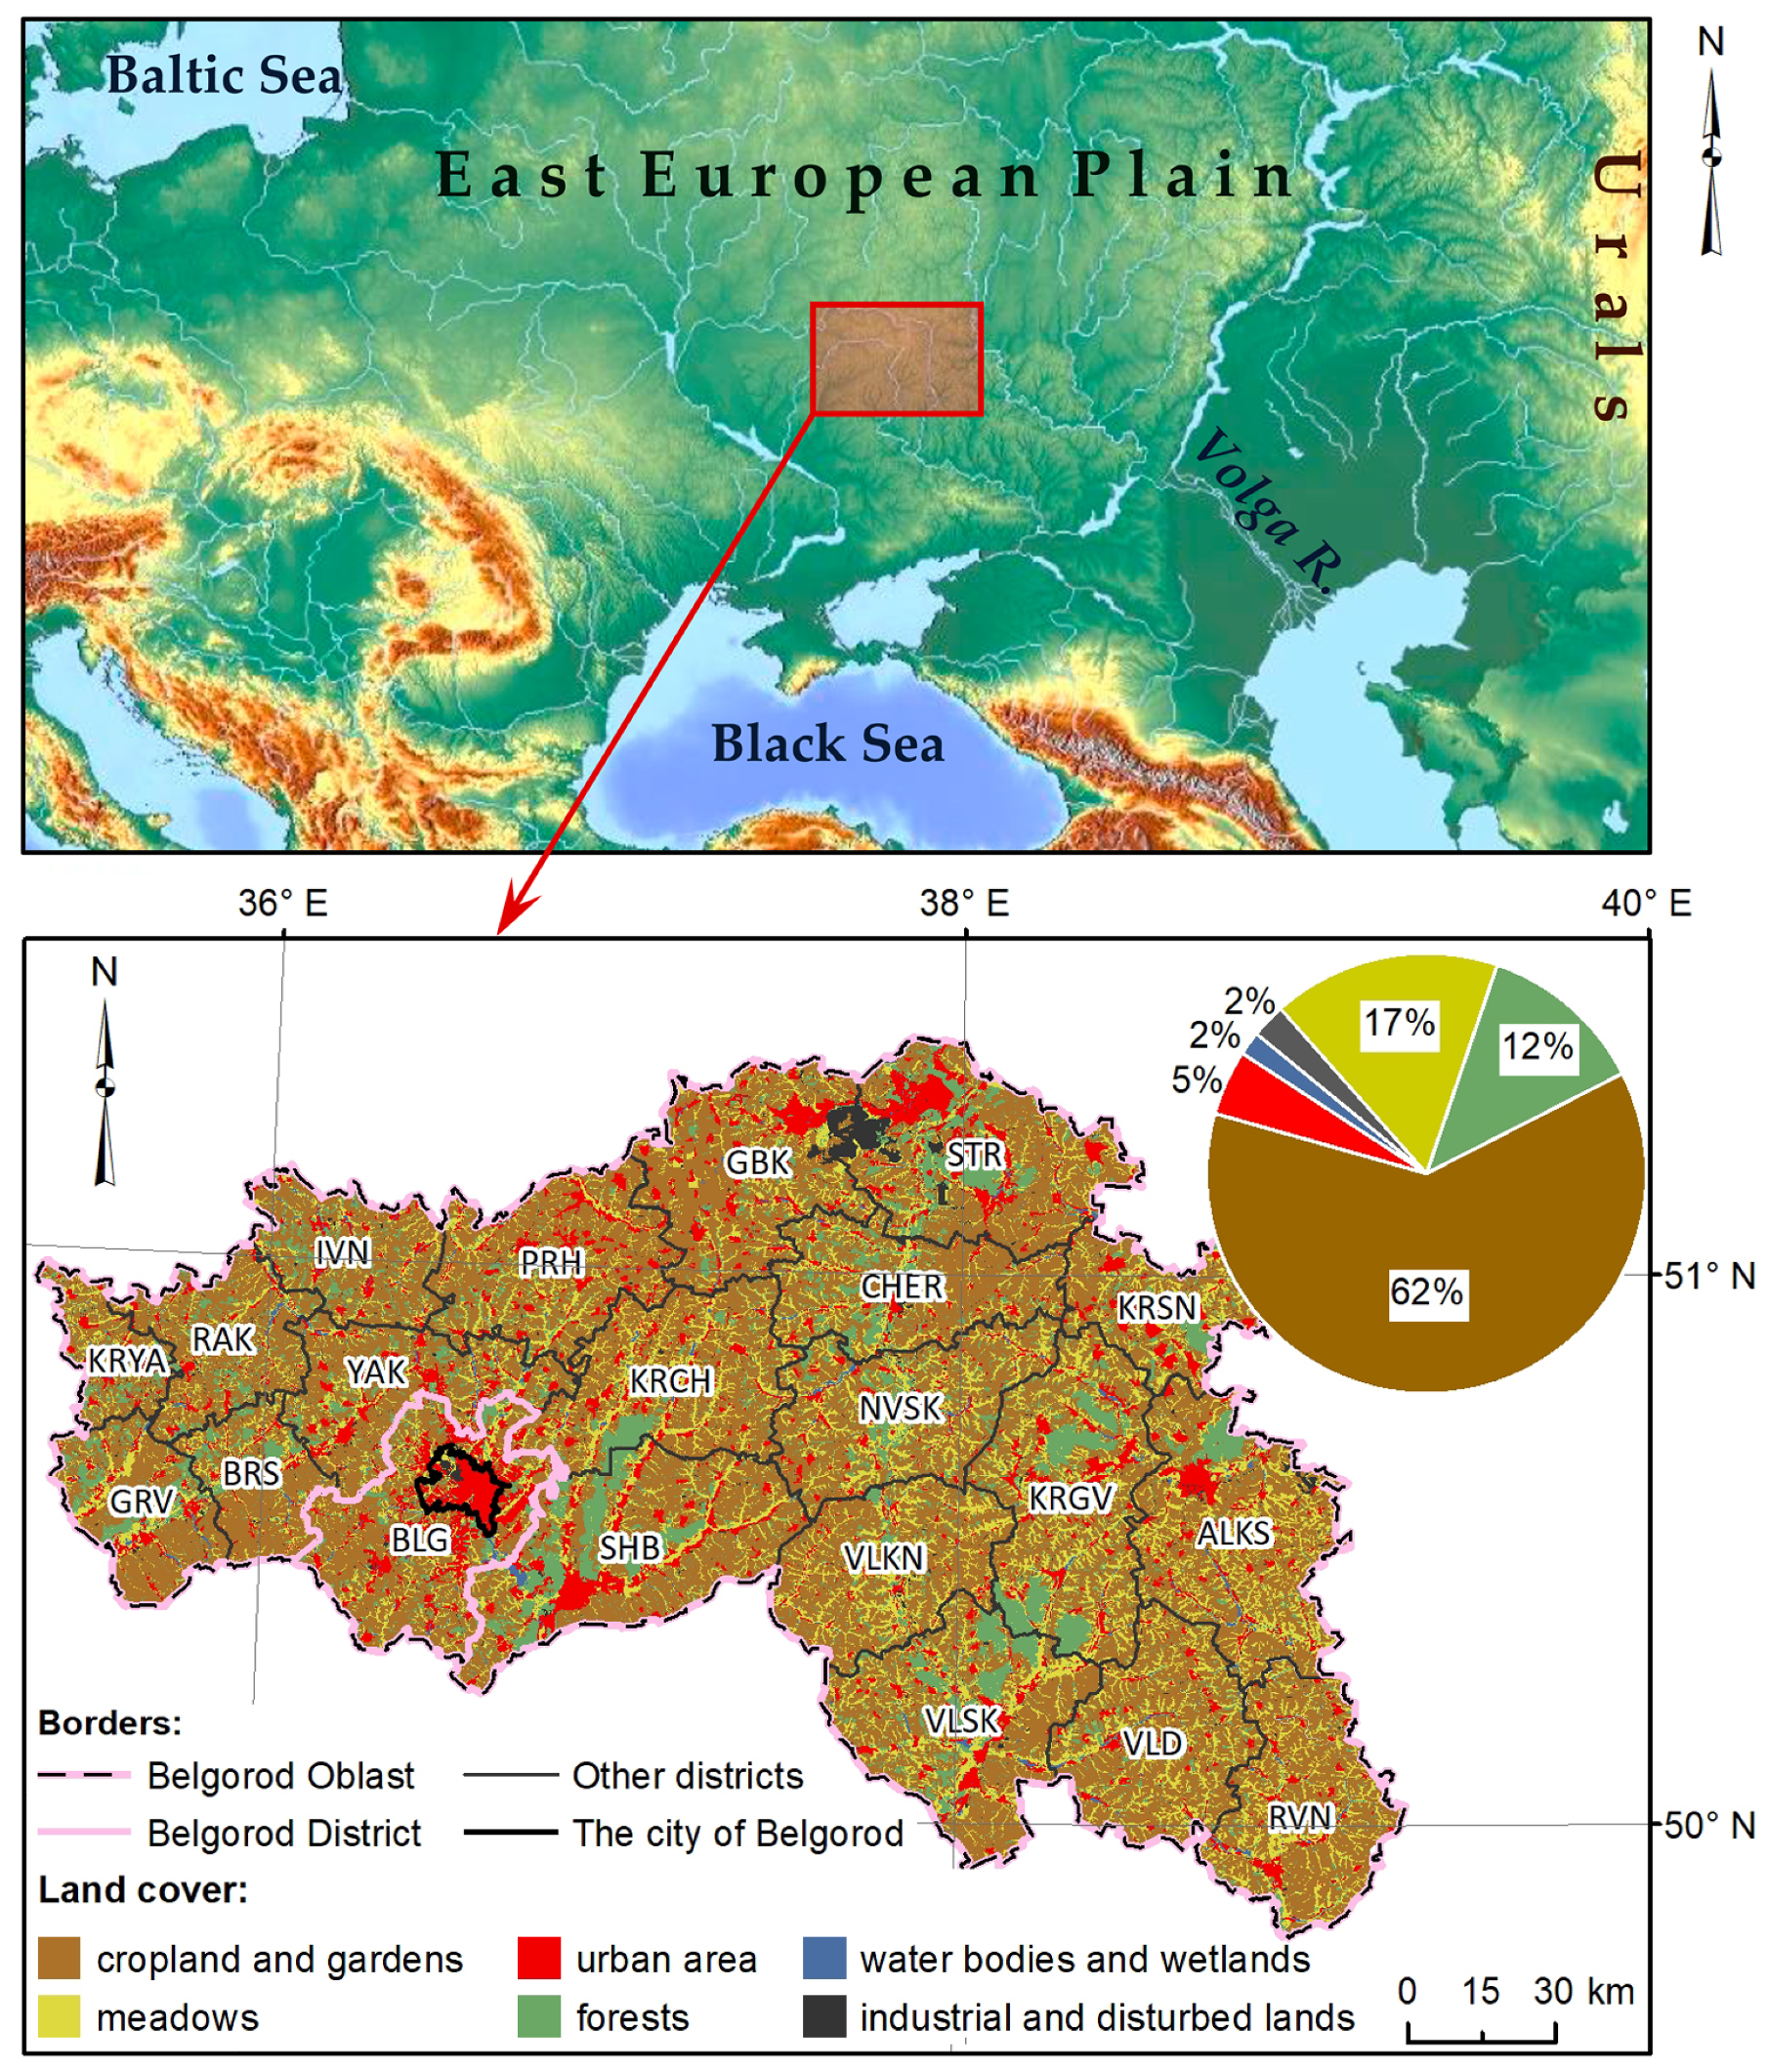
Figure 1. The Belgorod Oblast and its modern (as of 1 January 2022) structure of land use. The administrative districts of Belgorod Oblast: STR—Starooskolskiy, BLG—Belgorodskiy, GBK—Gubkinskiy, VLKN—Volokonovskiy, ALKS—Alekseyevskiy, VLSK—Valuiskiy, KRCH—Korochanskiy, NVSK—Novooskolskiy, YAK—Yakovlevskiy, KRSN—Krasnenskiy, RAK—Rakityanskiy, CHER—Chernyanskiy, KRGV—Krasnogvardeyskiy, SHB—Shebekisnkiy, IVN—Ivnyanskiy, BRS—Borisovskiy, PRH—Prokhorovskiy, KRYA—Krasnoyaruzhskiy, GRV—Graivoronskiy, RVN—Rovenskiy, and VLD—Veidelevskiy.
Resources 12 00127 g001
Figure 2. Block diagram of the spatial probabilistic model.
Resources 12 00127 g002
Figure 3. Direction of changes in the structure of the land fund of Belgorod Oblast (European Russia) in 1995–2020. NB: The curves are presented in normalized values (μ).
Resources 12 00127 g003
Figure 4. The structure of land use by administrative districts of the Belgorod Oblast (for 2020). The arrows show the dynamics of cropland (in %) since the 1990s until now.
Resources 12 00127 g004
Figure 5. An example of changes in cropland of the Belgorod district (including the city of Belgorod) of the Belgorod Oblast over the past 30 years.
Resources 12 00127 g005
Figure 6. Examples of the transformation of cultivated land into other types of land in the Belgorod Oblast.
Resources 12 00127 g006
Figure 7. Map of the predicted structure of cropland in the Belgorod district. NB: The areas of modern cropland with a forecast of its transformation to other land-use categories with probability P > 0.75 are highlighted in three colors.
Resources 12 00127 g007
Figure 8. Change in areas and yields of grain crops in the Belgorod Oblast (European Russia) by years in the period 2008–2021. R2 is the coefficient of determination of linear trends: red dotted line shows yield trend; brown dotted line shows grain crop area trend.
Resources 12 00127 g008
Table 1. Matrix of paired correlation coefficients for changes in the areas of various categories of land in the Belgorod Oblast (European Russia) during 1995–2022.
VariableCroplandMeadowsForestsWetlands and WaterUIAOther Lands
Cropland–0.39–0.21–0.15–0.63–0.23
Meadows–0.39–0.13–0.030.22–0.43
Forests–0.21–0.130.31–0.040.11
Wetlands and water–0.15–0.030.31–0.070.42
UIA–0.630.22–0.04–0.070.22
Other lands–0.23–0.430.110.420.22
Note: Statistically significant relationships are highlighted in green (p < 0.05).
Table 2. Correlation coefficients and estimation of the multiple linear regression equation for modeling changes in the area of cropland in the Belgorod Oblast (European Russia).
Estimation of Correlation and Regression Equation as a Whole
Multiple RR2Fc (2;59)p-ValueSE
0.840.7170.72<<0.050.22
Estimating the parameters of the regression equation
Variableβ0-ktc (59)p-valueSE
Free member β0–0.056
Independent variable (X1-k):
         Meadows–0.798–7.66<<0.050.10
         UIA–0.954–8.59<<0.050.11
Fc—calculated F; tc—calculated t.
Table 3. Cropland transformation models for different types of land use in the Belgorod district.
ModelPredictors
(p > 0.05)
Accuracy, %χ2p-ValueAUCResidue Distribution
UAIL, D, S, TPI76.0169.24<<0.00010.85Normal
DachasL, D, S029.1<<0.00010.74Abnormal
MeadowsI, S, TPI64.8132.50<<0.00010.83Normal
Accepted types are indicated in green; rejected type is indicated in pink.
Table 4. The parameters of the logistic regression models for different types of land use in the Belgorod district.
PredictorsUIAMeadows
ValueSEχ2p-ValueValueSEχ2p-Value
β02.78–0.44
L−0.080.0220.73<0.0001Not included in the model
Not included in the model
D−0.720.1523.28<0.0001
INot included in the model−0.060.0117.19<0.0001
S−0.450.0831.86<<0.00010.170.066.650.01
TPI0.040.0116.76<0.0001−0.060.0135.44<<0.0001
Disclaimer/Publisher’s Note: The statements, opinions and data contained in all publications are solely those of the individual author(s) and contributor(s) and not of MDPI and/or the editor(s). MDPI and/or the editor(s) disclaim responsibility for any injury to people or property resulting from any ideas, methods, instructions or products referred to in the content.