Article

Rigid Polyethylene Terephthalate Packaging Waste: An Investigation of Waste Composition and Its Recycling Potential in Austria

by
Viktoria Helene Gabriel
1,*,
Andreas Schaffernak
1,2,
Manuel Pfitzner
1,
Johann Fellner
3,
Manfred Tacker
1,4 and
Silvia Apprich
1
1
Institute of Packaging and Resource Management, Department Applied Life Sciences, FH Campus Wien, University of Applied Sciences, 1100 Vienna, Austria
2
Waste Management, Umweltbundesamt (Environment Agency Austria) GmbH, 1090 Vienna, Austria
3
Institute of Water Quality and Resource Management, TU Wien, 1040 Vienna, Austria
4
Circular Analytics TK GmbH, 1010 Vienna, Austria
*
Author to whom correspondence should be addressed.
Resources 2023, 12(11), 128; https://doi.org/10.3390/resources12110128
Submission received: 23 August 2023 / Revised: 4 October 2023 / Accepted: 9 October 2023 / Published: 31 October 2023

Abstract

:
The need for increased recycling of plastic packaging waste (PPW) is apparent from a legal and waste management perspective and, therefore, further waste streams need to be investigated in detail in terms of their recycling potential. Polyethylene terephthalate (PET) PW is already closed-loop recyclable (bottle-to-bottle recycling); however, other rigid PET PW is mainly thermally recovered. Explicit quantitative and qualitative data on rigid PET packaging waste are limited. Therefore, this study investigates the composition and packaging characteristics of rigid PET packaging waste contained in separate waste collection as well as in the mixed PET sorting stream in Austria by conducting a manual sorting analysis. Furthermore, the waste volume is projected, and the recycling potential is extrapolated according to new European recycling rate reporting formats. The results show that approximately 11% of separate collection represents rigid PET packaging waste. Most PW derives from food packaging and is transparent. Contained residues with more than 1% of the total packaging weight might negatively impact the sortability. The applicable net quantity indicator (ALR) amounts to 0.888 at the stage of sorting. The volume of rigid PET PW is extrapolated to 26–36 kt in 2020 with a high-quality recycling rate of 25%, which contributes 2.6% to the Austrian PPW recycling target of 50%.

1. Introduction

Nowadays, resource efficiency and the further exploitation of recycling options for plastic packaging are of utmost importance. European plastic consumption amounted to 53.6 mt in 2020, with packaging accounting for 33.5% [1] and 50% of generated plastic packaging waste needing to be recycled by 2025 [2,3]. The latest reported recycling rates are 46% in EU27+3 in 2019 [1] and 25.3% in Austria in 2020 [4], which indicate an apparently increased need for recycling. In addition to the PPW recycling target, legal requirements were implemented pertaining to net recycling rate reporting [5] and were proposed regarding a minimum recycled content in plastic packaging: 30% for PET contact-sensitive packaging and 35% for all other packaging, respectively, by 2030 [6]. Higher targeted recycling rates, increasing anticipated recyclate demand, and new reporting requirements compel further investigation into valuable plastic packaging waste streams and their circularity potential [7].
PET possesses outstanding material and barrier properties [8], and plastic converter demand for PET amounted to 8.4% in 2020 [9]. Moreover, PET demonstrates greater environmental benefits when recycled compared to other polymers [10]. However, research into PET packaging has, for a long time, been solely focused on PET bottle-to-bottle recycling, for which the published literature is extensive [8,11,12,13,14]. In addition, a well-established waste management and recycling infrastructure exists for PET beverage bottles at the European level, and closed-loop material circulation is in place thanks to recycling technologies authorized by the EFSA [15], although a significant share of generated rPET is utilized for other packaging applications or fibers [16,17]. However, recent investigations show that a growing amount of PET packaging is used beyond PET beverage bottles, for instance, as rigid PET packaging (e.g., nonbeverage bottles, trays, and cups), for which an increase is expected due to the rising processed food industry [18]. Nonetheless, this particular waste stream is currently sorted and recycled at a limited scale due to restricted prevalent separate collection systems, especially for trays, as well as insufficient required sorting streams [16]. PET trays are not separately collected in all EU Member States [16], which was the case for Austria when this study was conducted. Meanwhile, Austria has implemented a widespread separate collection scheme for PPW in 2023 [19]. PET packaging disposed of in municipal solid waste (MSW) is lost to mechanical recycling [7]. Moreover, separate sorting is a prerequisite for mechanical recycling, but rigid PET is predominantly sorted into a mixed heterogenous sorting stream [20], which negatively affects the recycling process [16] and leads to inferior recyclate quality. Therefore, rigid PET PW is predominantly thermally recovered at present [7,21].
Nonetheless, rigid PET possesses potential for circular resource utilization, such as tray-to-tray recycling, which would involve greater sorting depths for the effective separation of bottles and monolayer trays [16,17,22]. To encourage qualitative recycling and to increase the recyclability of PPW, respective information concerning product types in the PPW stream is of importance [7] to effectively contribute to resource efficiency. However, explicit data about rigid PET are limited, which is reflected in the increasing number of studies examining, at least, this particular waste stream [16,22,23,24,25,26,27,28,29].
This paper examines the quantitative and qualitative composition of rigid PET packaging waste and extrapolates the Austrian waste and recycling potential for 2020.

1.1. Market Figures

A recent report by Plastic Recyclers Europe (PRE) found that 1.0 mt of PET trays and 3.6 mt of PET bottles, 323 kt of which are accounted for by nonbeverage bottles, were placed on the European market in 2020 [16], demonstrating that the demand for PET rose compared to 2019 [9]. For Austria, the volume of rigid PET was estimated to be between 11 kt [7] and 20 kt [30], but information concerning composition and explicit mass flows is limited. Current European recycling rates amount to 21% for PET trays in 2020 [16] compared to 18% rigid PET in Austria for 2019, including nonbeverage bottles [30]. However, the current reported figures mainly represent gross sorting rates, which do not reflect the waste potential for sorting nor a feasible recycling rate.

1.2. Waste Management

Lightweight packaging waste separately collected via households and similar establishments, such as educational institutions, accounted for 159,131 tons in 2020 [31]. The separate collection of PPW is organized differently among the nine federal provinces, either via collection or drop-off separate collection systems for lightweight packaging (yellow bag/yellow bin), commingled collection systems with metals, or the targeted separate collection of hollow-body plastic packaging [32]. The latter was in place in certain regions when we conducted this research. The collection as well as sorting of PET packaging waste represents a major challenge as PET trays are not always targeted for separate collection nor sorted out in a separate stream [16,20,32]. However, a uniform PPW separate collection scheme has been in place since January 2023 [19] and a deposit return system (DRS) for beverage bottles will be implemented from 2025 onwards [33].
According to the National Waste Management Plan, there were 15 operating sorting facilities for plastic waste in Austria in 2019 [32]. Sorting facilities for lightweight packaging waste separate PET packaging waste into two sorting streams: PET beverage bottles and a remaining mixed PET sorting fraction [20]. While PET beverage bottles are further divided based on color (transparent clear (“nature”), blue and green), the mixed PET sorting fraction contains all remaining PET packaging waste such as trays or nonbeverage bottles, which is not further segmented [20]. Nonetheless, a further separation of bottles and trays would positively impact the quality of the PET flake and the yield of the recycling process, but an additional separation process is limited by low sorting quantities and the high degree of heterogeneity [16,22,28]. PET trays particularly diverge in terms of composition concerning packaging components, materials, and other packaging characteristics such as size and color [22]. Moreover, a further separation among mono- versus multimaterial PET trays would be favorable [16,22]. However, additional knowledge concerning the composition and feasible sorting efficiencies of the rigid PET sorting stream is needed to further investigate the circularity potential.
The conventional recycling method for the Austrian PET packaging waste represents mechanical recycling [32]. Other forms of recycling, such as chemical recycling, of the PET packaging waste are not in operation in Austria at present. One chemical recycling facility is in operation for polyolefin PPW (PE—polyethylene, PP—polypropylene) and polystyrene at the pilot scale (ReOil) [34]. Lechleitner et al. (2019) and Damayanti and Ho-Shing Wu (2021) provide an overview of global chemical recycling facilities and their applied technologies for PET waste [35,36].
With regards to mechanical recycling, three operating mechanical recycling facilities for PET packaging waste were examined in more detail by Neubauer et al. (2020), which mainly focus on the production of rPET deriving from beverage bottles [20]. Only one of the examined mechanical recycling facilities processes other PET packaging waste to recyclate [20]. However, the majority of separately collected rigid PET packaging waste is sent to thermal recovery [7]. PET trays are recyclable by standardized mechanical recycling processes [22] but the generated recyclate quality is mainly dependent on the input material. The higher the purity of the PET trays (transparent monotrays), the better the optical properties [16,22], although further increase in intrinsic viscosity is still needed [22]. In addition to that, (food-grade) closed-loop recycling is in place for PET beverage bottles (bottle-to-bottle recycling), which should not contain more than 5% of nonfood packaging [37]. This implies that further efforts with respect to sorting and recycling for other rigid PET are inevitable but the present waste processing of PET trays is not profitable [23].

1.3. Recycling Rate Methodology

The new recycling rate methodology highly affects the values of recycling rates. Thus far, it is common practice that either the gross sorting rates or the recyclate output are communicated as official recycling rates [4,7,30,38]. While the first ratio does not consider any contaminants or material losses, the latter is more prone for application. EC implementing decision 2019/665 creates a sound and comparable base for recycling rate calculation for packaging and packaging waste, which is based on the net recycling input amount [5]. ARA has demonstrated a decrease in the PPW recycling rate in 2017 from 33.4% [4] to 25% [39] based on the new calculation methodology. However, very little is currently known about applicable average loss rates (ALRs) for net recycling rate calculation, which is based on the input waste amount, especially for rigid PET recycling.

1.4. Aim of This Study

According to the state-of-the-art knowledge and the further research need presented previously, there are two primary aims of this study:
(1)
Identification of the qualitative and quantitative composition of rigid PET packaging waste contained in the separate waste collection (collected rigid PET) as well as in the remaining PET sorting stream after beverage bottles are sorted out (sorted rigid PET)
(2)
Extrapolation of the total amount and recycling potential of rigid PET packaging waste for the year 2020 in Austria.
By comparing the composition of collected rigid PET and sorted rigid PET, indications about the sorting efficiency of different rigid PET packaging products should be made. This will provide crucial information to increase the overall recycling rate of rigid PET packaging by identification of valuable target waste categories, the recyclable packaging design of PET, and the precollection management of packaging (“cleaning of packaging waste prior to disposal and collection”), as well as the determination of the quantitative contamination potential from foreign materials (e.g., closures and non-PET packaging components). Finally, the overall contribution of rigid PET recycling to achieve the recycling targets for plastics packaging waste should be evaluated.
It is important to note that the investigated packaging waste of this study mainly aims at nonbeverage bottles such as food bottles (e.g., whipped cream, yoghurt) and nonfood bottles (e.g., detergents, cleaners) as well as trays (e.g., packaging for meat and vegetables).
Nonetheless, this research provides the first extensive examination of rigid PET packaging waste in Austria and contributes to our knowledge concerning the quantitative recycling potential compared to the current end-of-life treatment. This study sheds new light on applicable ALRs regarding net recycling rate methodology and serves as a solid basis for further research.

2. Materials and Methods

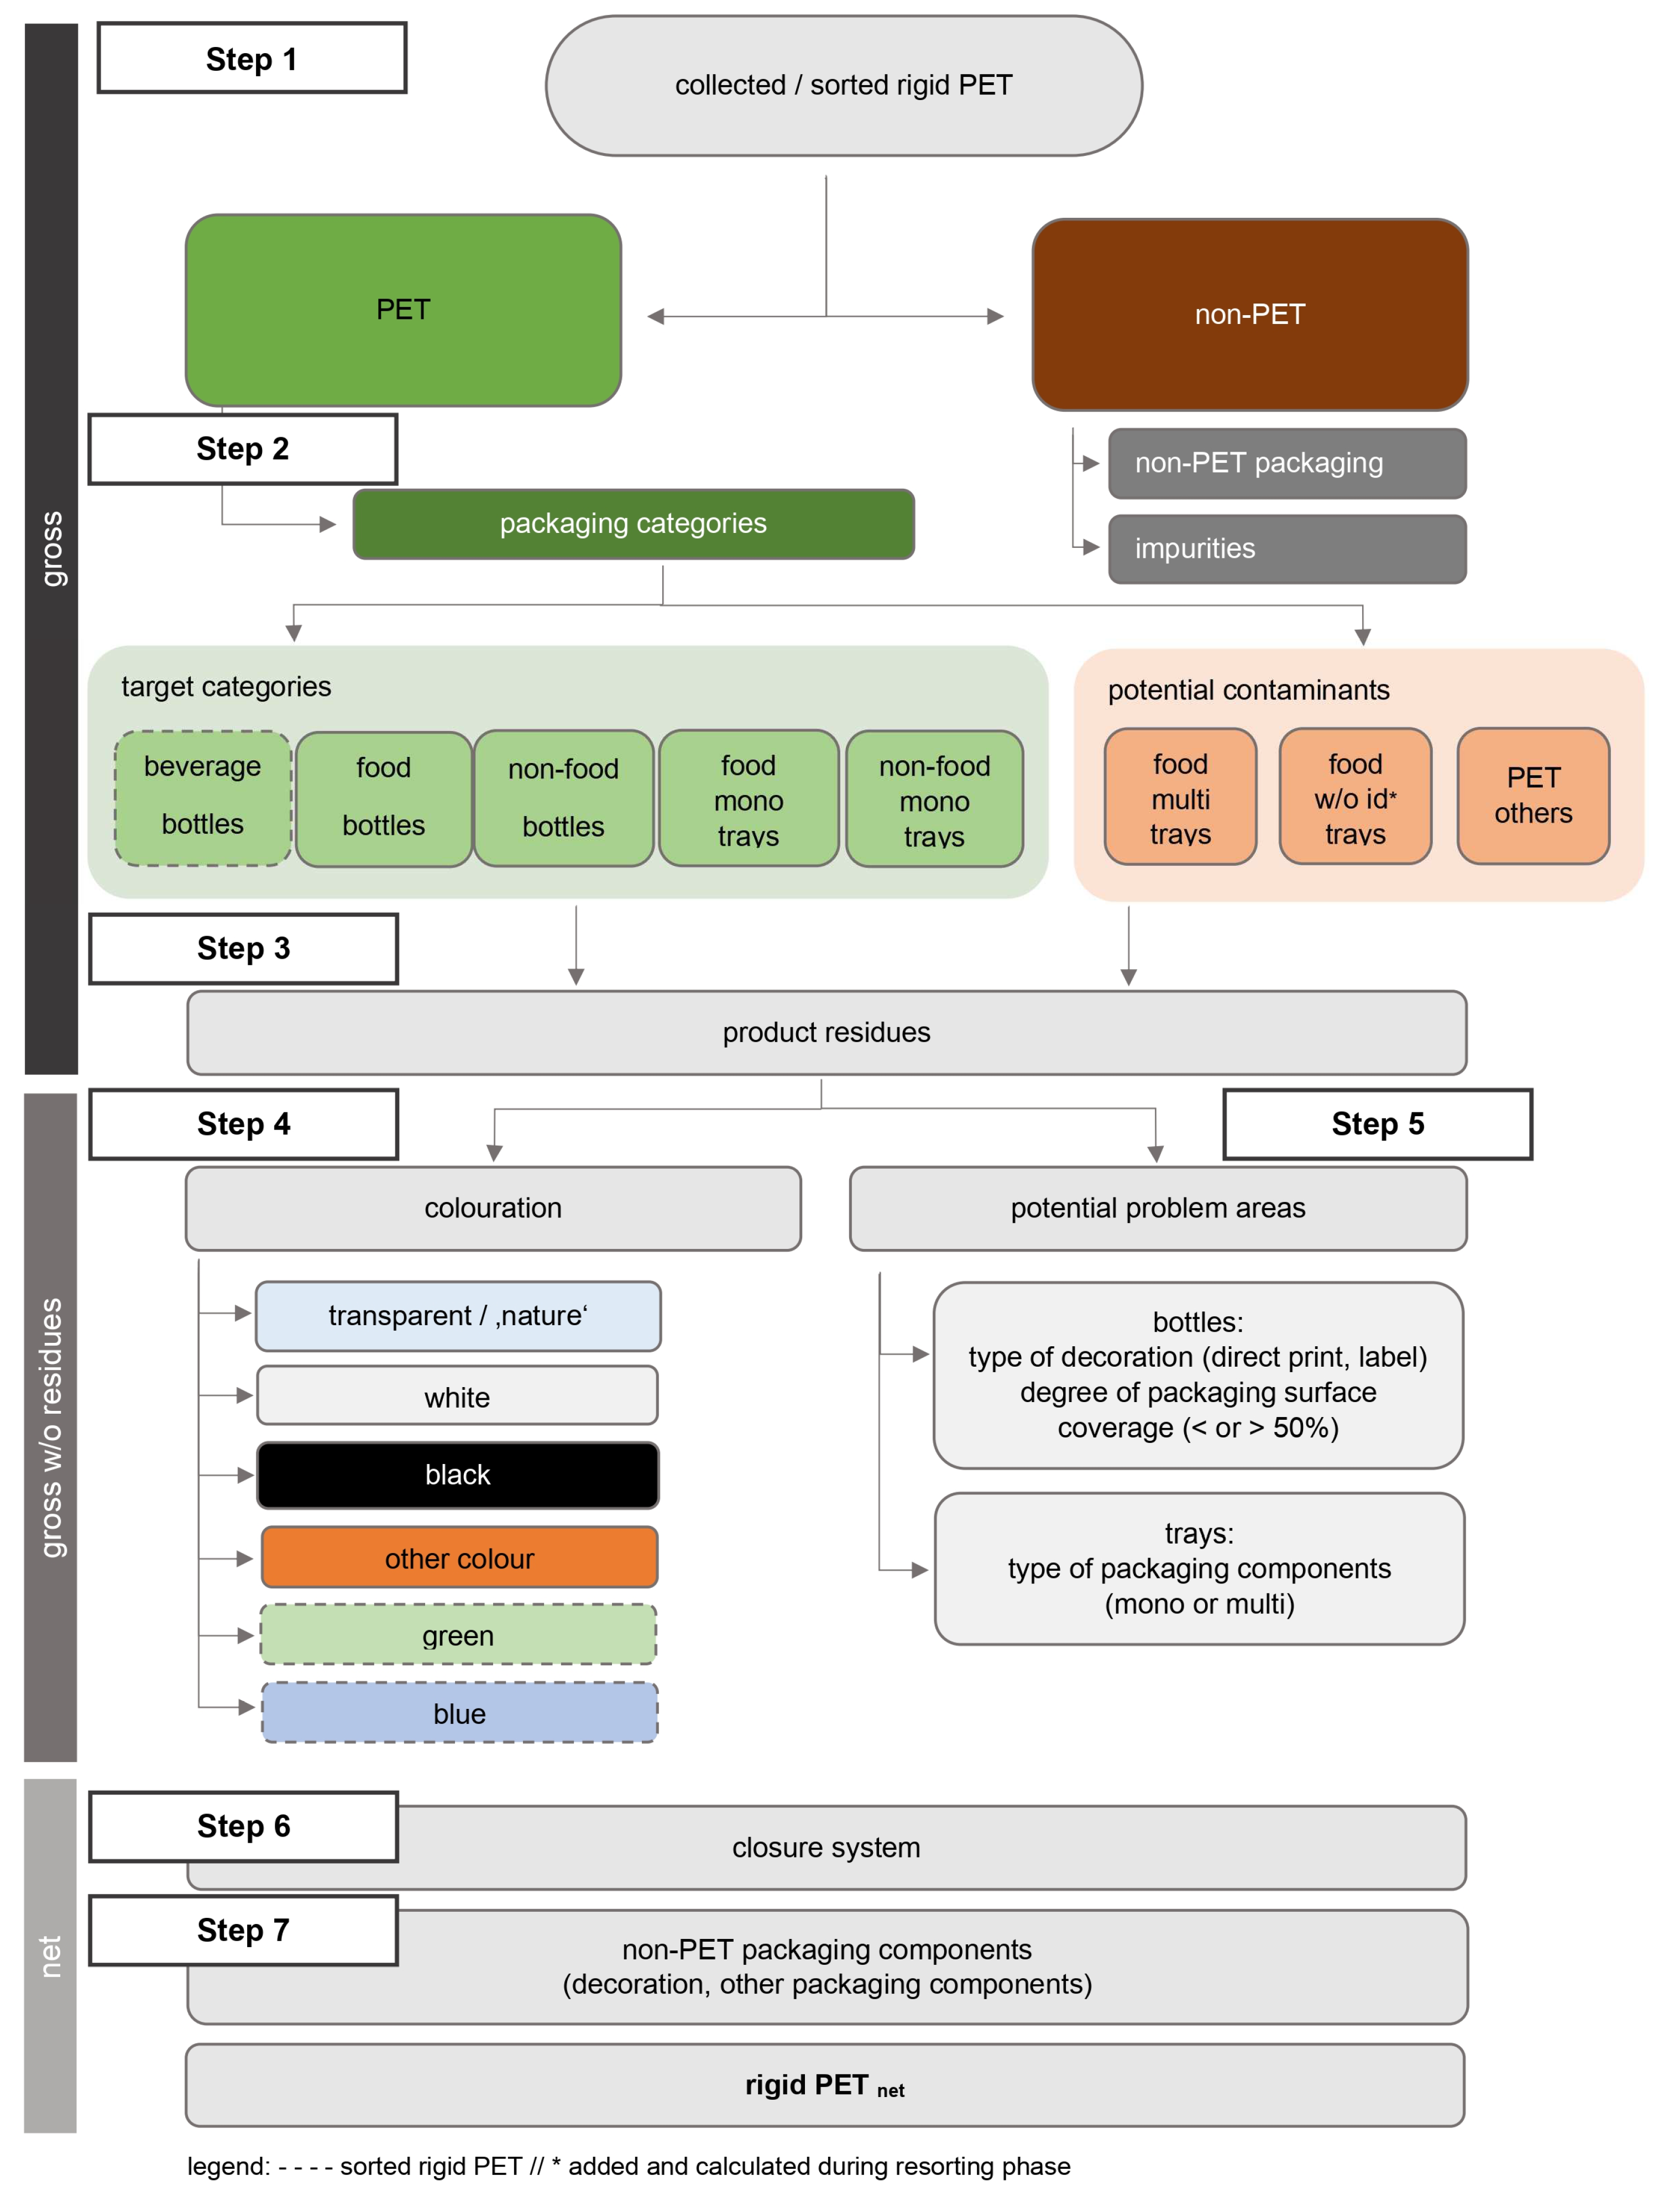
2.1. Overview of the Applied Methodology

A two-tiered approach is employed in this research. Firstly, a manual sorting analysis is undertaken to investigate the determined rigid PET PW streams: collected rigid PET as well as sorted rigid PET. Secondly, for the extrapolation of the waste and recycling potential, the present study utilizes a multiple-data approach by combining results from manual sorting analysis with data from other studies. The following subchapters provide further insights into the applied methodology.

2.2. Manual Sorting Analysis

2.2.1. Sampling

The extracted and analyzed waste samples concerning “collected rigid PET” were drawn from the separate lightweight packaging waste collection (yellow bag), while waste samples for “sorted rigid PET” were extracted from the PET mixed sorting stream after beverage bottles were sorted out. Samples from the separate collection derived from households and similar establishments from five different federal provinces in Austria, namely, Burgenland, Upper Austria, Lower Austria, Tyrol, and Styria. These provinces have a similar waste collection (door-to-door, yellow bag for lightweight packaging waste) in place. Moreover, out of nine Austrian provinces in total, the five provinces selected for sampling are geographically representative and constituted approximately 75% of the generated lightweight packaging waste volume from municipal waste of households and similar establishments in 2019 [32].
The sampling was conducted either via randomly selected yellow bags at a sorting plant for lightweight packaging waste, or samples were directly taken from the conveyer belt at the sorting plant after the bag opener but before entering the sorting. For the latter method, the conveyer belt was stopped, and samples of similar size were randomly selected from the belt. The waste samples “collected rigid PET” represent the average share and composition of the rigid PET PW contained in the separately collected PPW.
The randomly selected waste samples for sorted rigid PET, after PET beverage bottles were sorted out, derived from four Austrian packaging waste sorting facilities. The determined four out of fifteen Austrian sorting plants for plastic waste [32] are representative according to the selected geographic regions. The samples were manually taken from the plant output with a shovel. The waste samples “sorted rigid PET” represent the average composition of rigid PET PW in the mixed PET sorting stream after beverage bottles were sorted out. Overall, the sampling took place within two sampling rounds. The first samples were taken and analyzed in November and December 2020, totaling 277 kg of PPW and 112 kg sorted rigid PET. After the first sampling round, the minimum sample size was calculated (see Section 2.2.2). The second sampling round took place in the first quarter of 2021, where a further 354 kg of PPW and 63 kg of the PET mixed sorting stream were drawn and further analyzed.

2.2.2. Minimum Sample Size

To generate representative results for Austria, the required minimum sample size was calculated based on the waste analysis of the first sampling round. The calculation of the minimum sample size was performed according to Skutan and Brunner [40], which is mathematically defined in Equation (1) as follows:
M = 1 ω × c ² e x p e c t e d s ² d e s i r e d × m m a x 1 + 3 × lg m m a x 3 m 10 % 3
The formula concerning the minimum sample size M expressed in kilogram (kg) is defined by the following terms: ω is the weight proportion of relevant particles in the population (no dimension), c e x p e c t e d denotes the expected concentration of the analyte in the population (in mg/kg), s d e s i r e d is the desired maximum sampling error or standard deviation (in mg/kg), m m a x constitutes the weight or mass of the heaviest particles within the population (in kg), and m 10 % presents the 10th percentile of the particle mass within the population (in kg) [40]. To calculate the representative sample size, the subsequent data in Table 1 were used:
To determine ω , the PET packaging waste fraction with the lowest mass share, which was the case for PET nonfood monotrays in both waste streams, was set in relation to the sample mass from sampling round 1. For c e x p e c t e d , the determined waste fraction was set in relation to the total population. For collected rigid PET, the population represented the separate collected PPW in 2018, which amounted to 161,006 tons [41], whereas for sorted rigid PET, the gross sorting volume for 2019 was applied, which corresponded to approximately 4000 tons [30]. The desired sampling errors s d e s i r e d were determined with 15% error and are expressed in mg/kg in Table 1. Other determined values can be taken from Table 1. The calculated values for M in Table 1 represent the required minimum sample size in kg to generate representative results, which result in 363 kg for collected rigid PET and 168 kg for sorted rigid PET. As stated in the previous Section 2.2.1, a second sampling round took place, and 631 kg from the separate collection (collected rigid PET) and 175 kg from the mixed PET sorting stream (sorted rigid PET) were analyzed in total.

2.2.3. Manual Sorting Procedure and Data Collection

The manual sorting analysis took place between November 2020 and March 2021. The analysis of the waste samples followed a standardized manual sorting procedure to generate comparable and reliable results, which are shown in Figure 1.
The first sorting step included each sample being weighed with the Sartorius Extend (model number ED8201-CW) scale (Sartorius Lab Instruments, Goettingen, Germany), followed by sorting out nonplastic packaging waste, as well as the separation of PET and non-PET for which an embossed or attached recycling code was used. Packaging without a recycling code was identified with a handheld NIR (near infrared) device (Thermo Scientific Portable Analytical Instruments, Inc., Tewksbury, MA, USA). Within the second sorting step, the category PET beverage bottles were investigated in detail solely within the mixed PET sorting stream (sorted rigid PET). An additional category named “food trays without identification” constituted trays without containing any recycling code, as it represented a possible contamination potential. It needs to be highlighted that the assignment of this additional category took place with net weights. To calculate the gross weights, the average amounts for residues, closures, and non-PET components, as well as coloration and problem areas, took place on the assumption based on data generated from food monotrays. Sorting step three involved the detection of obvious product residues. If residues were evident, the respective packaging was weighed, emptied, thoroughly rinsed with water, dried overnight in a climatic chamber, and accurately reweighed. The nonobvious contained residues that cannot be visually detected, such as drops of oil, water, fat, or small-size residues, were not considered within the present study. Within sorting step four, the packaging was separated according to its coloration of the main packaging body. The coloration of the main packaging body is of importance concerning the packaging sortability and its recycling compatibility because of alleged impacts concerning the recyclate quality [42,43]. Moreover, it enables the quantification of possible color waste streams according to the existing sorting streams for beverage bottles [20] within the extrapolation of the waste volume. The fifth sorting step involved the investigation of potential problem areas for automatic sorting and recycling, such as bottle decoration. A coverage degree of more than 40 or 50% of the packaging surface [42,44] or other adherent packaging components, such as cardboard walls from blister packaging or absorbent pads, might lead to an insufficient sorting capability. The sixth sorting step comprised the investigation of closure systems, while the final step of sorting investigated the weight of adherent non-PET packaging components such as decorative elements (labels, sleeves) or absorbent pads. This facilitated an assessment of the composition and the purity levels of rigid PET at the point of collection and sorting.
The net volume of rigid PET was calculated based on Equation (2):
P E T r i g i d n e t = P E T r i g i d g r o s s r e s i d u e s c l o s u r e s n o n   P E T   p a c k a g i n g   c o m p o n e n t
Equation (2) considers the possible contaminants such as product residues, packaging closures, and non-PET packaging components to calculate the net waste volume of rigid PET.

2.3. Extrapolation of Waste and Recycling Potential

According to the second aim, this study extrapolates the quantitative waste and recycling amount of rigid PET packaging waste in Austria for the year 2020 based on the generated data deriving from the conducted manual sorting analysis. The extrapolation aims to demonstrate the recycling potential of highly valuable materials (targeted product categories) of this waste stream and its contribution to the overall PPW recycling rate.
The projection of the separately collected rigid PET packaging waste potential is based on the results obtained throughout this investigation. The mass share of collected rigid PET (exclusive beverage bottles) (see Table 2 in Section 3) was set in relation to the total separately collected lightweight packaging of 159,131 tons in 2020 [31]. A standard deviation of ±15% was considered for this extrapolation. The applied collection and sorting efficiency indicators for rigid PET are based on Van Eygen et al. (2018) [7] from 2013 and were calculated based on the weighed composition of the collected rigid PET (collection efficiency) and the sorted rigid PET (sorting efficiency) fractions investigated in this study, whereas for PET beverage bottles, the latest figures from WKÖ [38] were applied.
Furthermore, the present study projects an approximate net recycling rate for rigid PET as well as PET beverage bottles by considering ALRs in relation to the gross sorting volume. The applicable ALR is based on Equation (2), which considers product residues, non-PET closure systems, and non-PET packaging components, and is expressed by the net quantity indicator of the sorting output n f S O , which is defined as follows:
n f P E T   r i g i d   s o r t e d = m i   n e t   P E T   r i g i d   s o r t e d m i   g r o s s   P E T   r i g i d   s o r t e d
The net quantity indicator of the sorting output is defined as the mass of the net sorting output in relation to the gross sorting mass. Further details can be found in Table S1 in the Supplementary Materials.
The aim of defining a net recycling rate is based on demonstrating a more realistic recycling rate compared to the currently reported recycling rates and to partly apply the new reporting methodology in accordance with the European Commission implementing decision 2019/665 [5]. It needs to be highlighted that further process-related material losses [45] during the recycling pretreatment are not taken into account in the present study. A supplementary data collection would be required to determine the impact of additional material losses regarding the recycling input amount [5].
However, the present study intends to demonstrate the net recycling rate r r i n p u t in relation to the extrapolated generated rigid PET waste volume, and in addition, it set outs the recycling potential of the total generated PPW in 2020 to show the contribution of rigid PET recycling to achieve the targeted 50% recycling rate until 2025 [2,3]. However, the revealed recycling rates do not consider the recycling of other materials present or attached to the rigid PET packaging such as polyolefin closures or PET-fines used in the fiber industry [20]. The calculated recycling potential, therefore, represents the extrapolated maximum net volume of rigid PET PW sortable and available for recycling.
The determined calculation points, formulas, and applied data can be found in Supplementary Materials Figure S1, Tables S1 and S2.

3. Results

This section is divided into two results sections. The first section is related to results generated from the manual sorting analysis concerning the composition of collected and sorted rigid PET PW. The second section comprises the generated results concerning the extrapolation of the waste volume and recycling potential of rigid PET packaging waste.

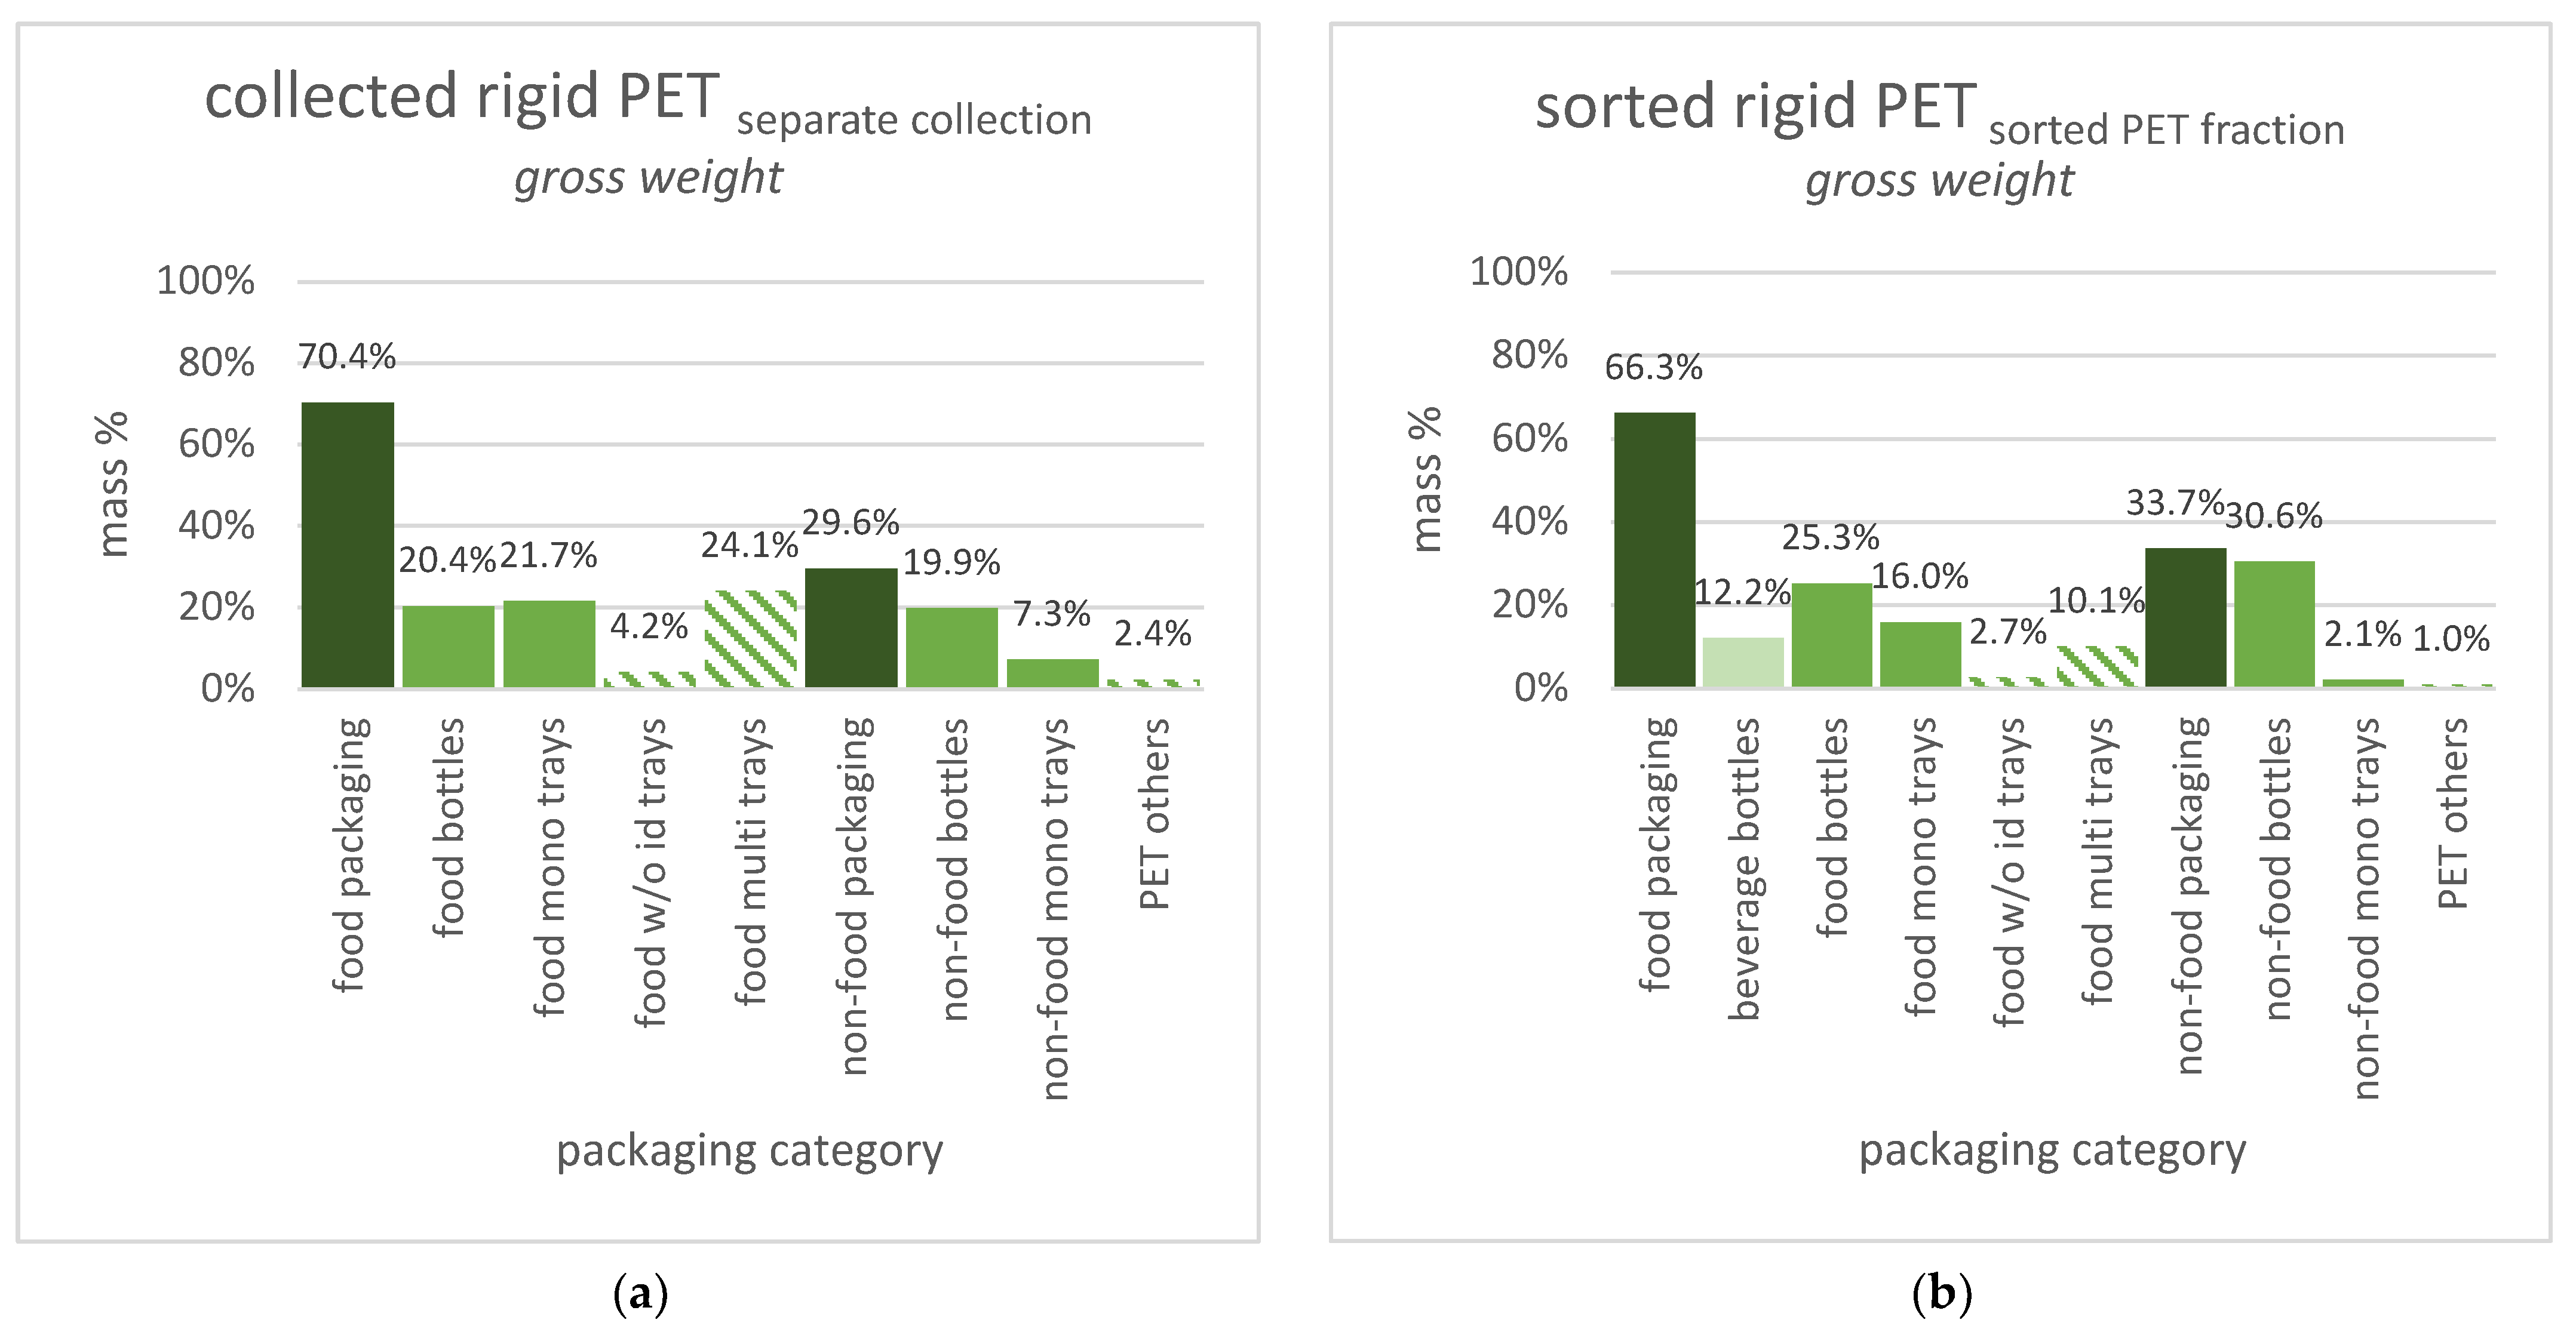
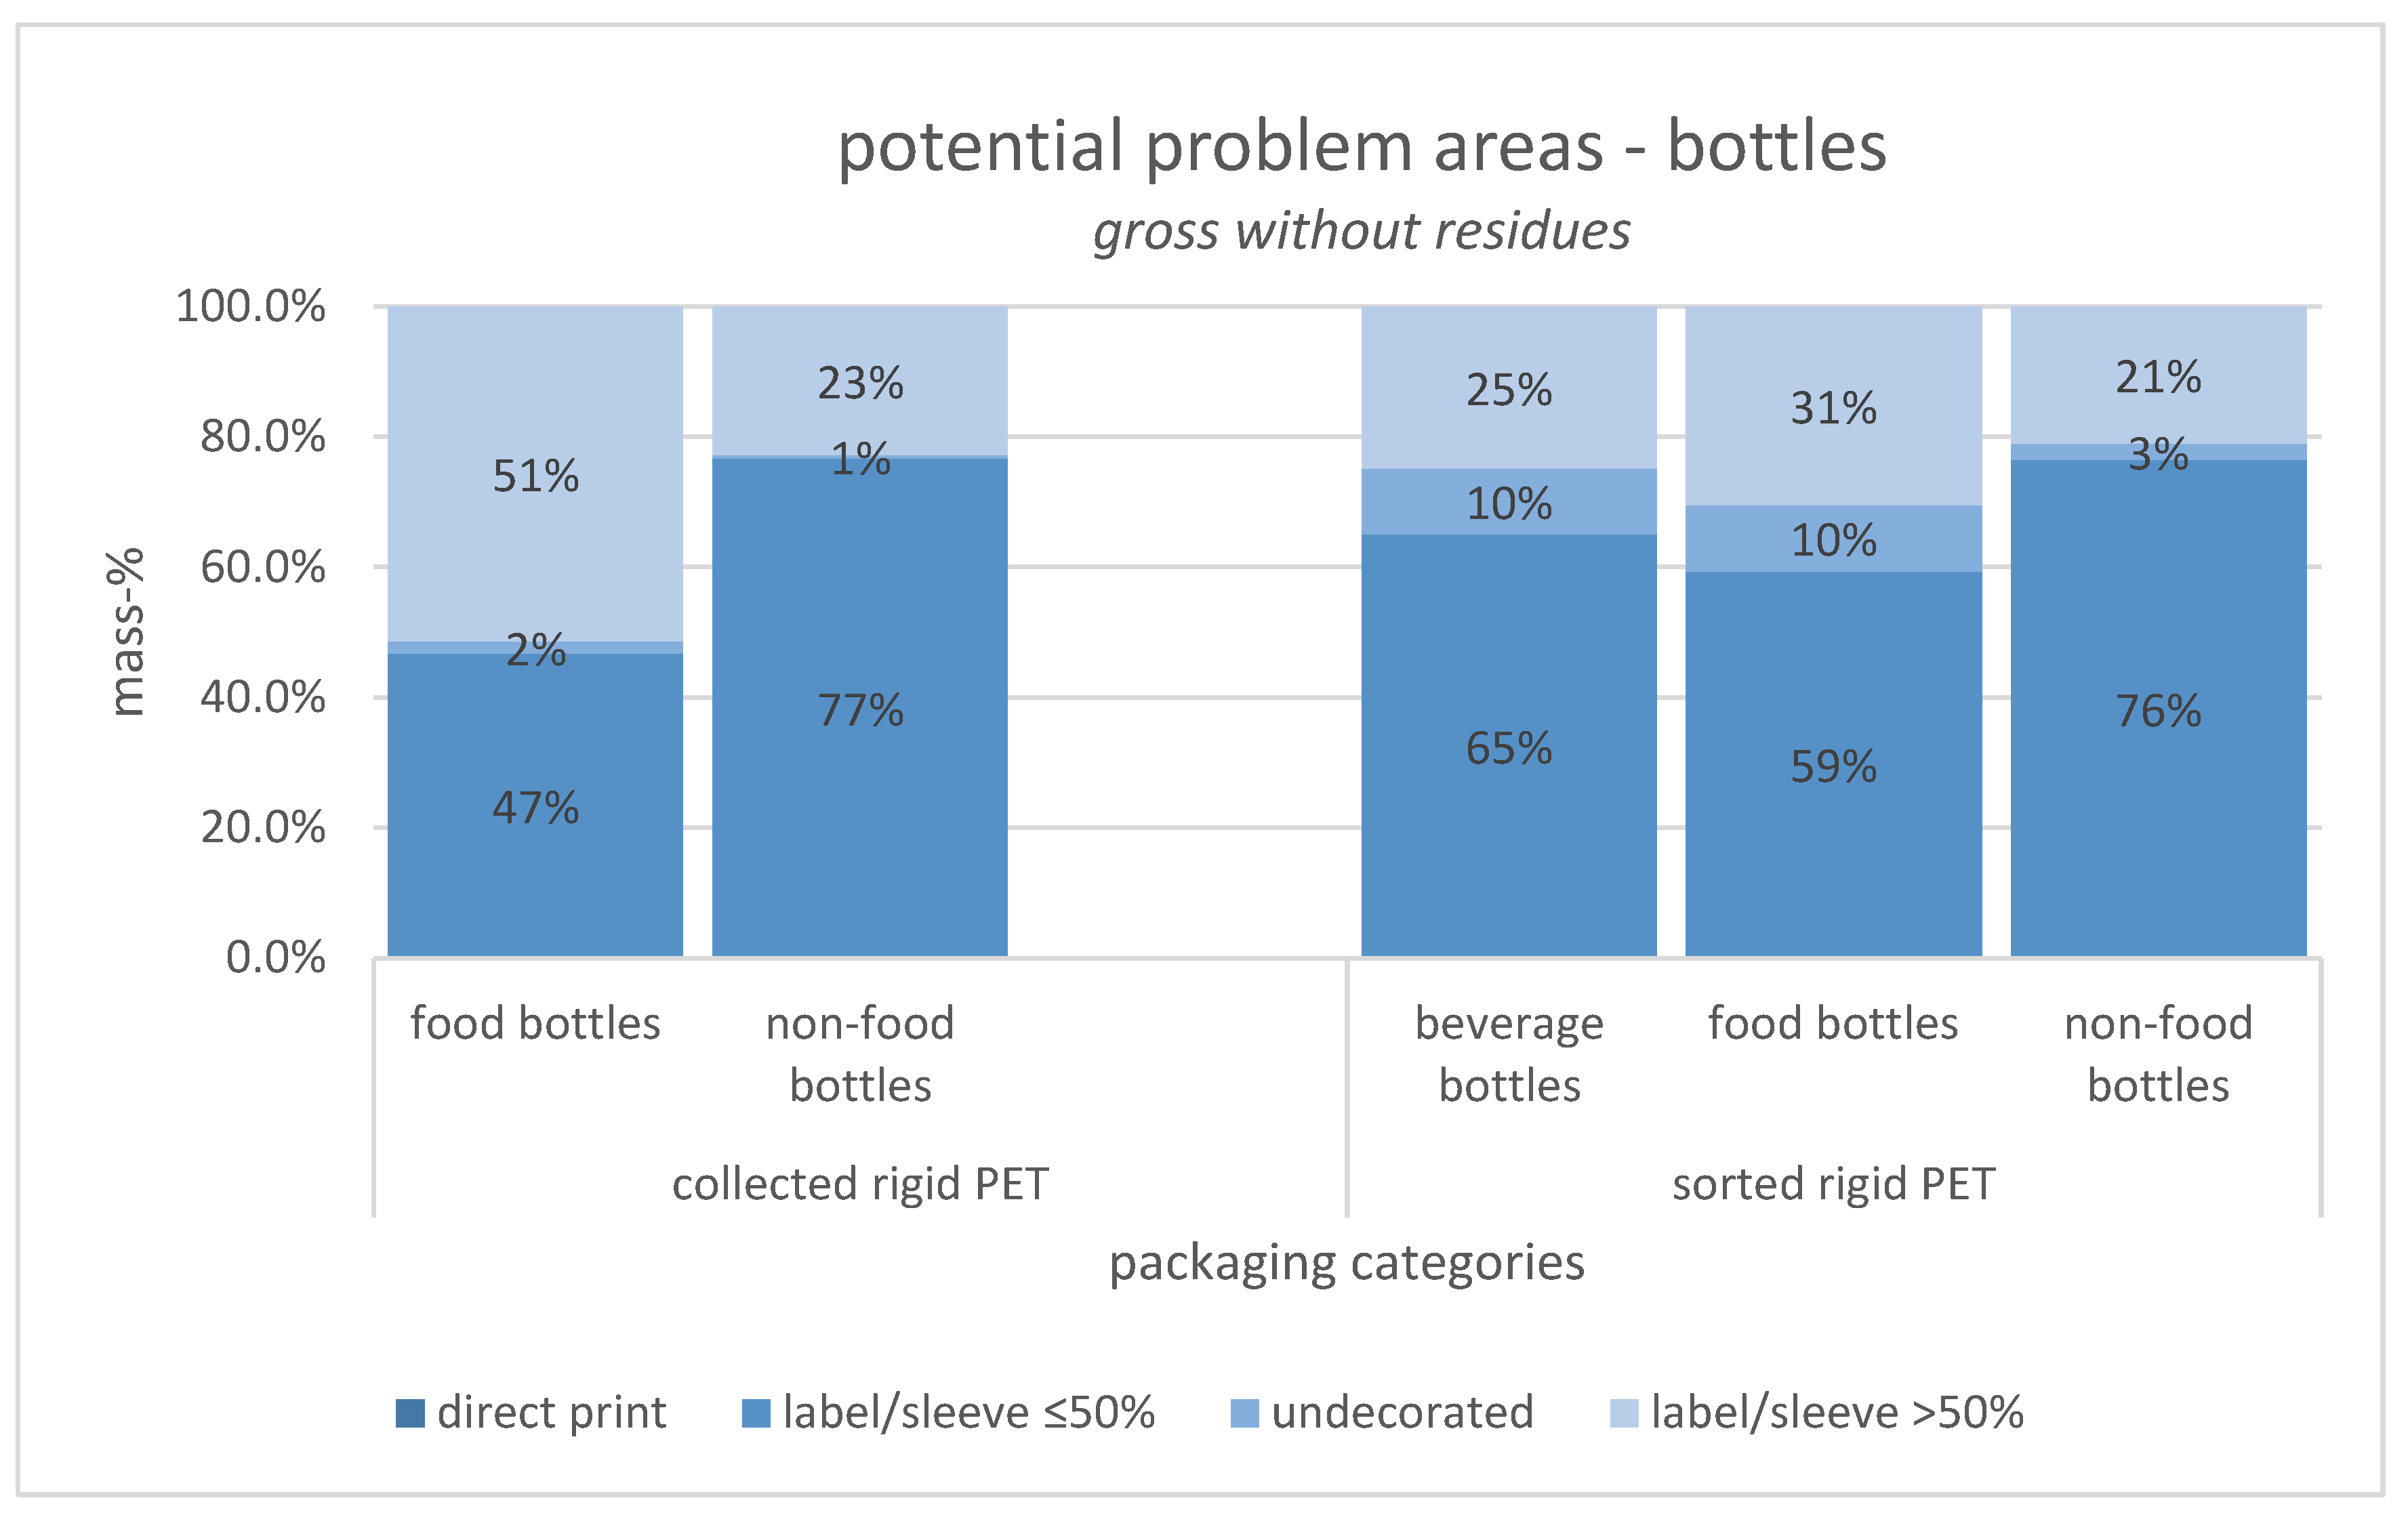
3.1. Results from the Manual Sorting Analysis

The first set of questions aimed to investigate the mass and composition of rigid PET packaging waste in Austria. According to Table 2, around one-third of separate collection can be allocated to PET packaging, although the major share derives from PET beverage bottles, while 11.4% belong to other rigid PET packaging. One-fifth represents impurities such as plastic products, which do not belong to packaging at all. The purity rate within the PET mixed sorting stream amounts to 94%, of which 11% represent PET beverage bottles. The share of impurities and non-PET packaging is negligible.
Figure 2 illustrates the breakdown of rigid PET packaging according to packaging categories. The proportions of food and nonfood packaging for collected rigid PET (a) with 70/30 and 66/34 for sorted rigid PET (b) are comparable. Nonfood bottles dominate the nonfood packaging waste, which is a rather significant result. In addition, the mass share of trays is lower in sorted rigid PET versus collected rigid PET, which indicates that PET trays are sorted out at a lower rate in comparison to PET bottles.
The next section of the manual sorting analysis was concerned with the investigation of obvious product residues. Table 3 shows the results concerning obvious product residues contained in rigid PET packaging. The indicator “share of residues on gross packaging waste weight” is shown with two decimal places to avoid rounding errors.
The identified product residues amount to 4% within the collected rigid PET and only 0.7% within the sorted rigid PET. A total of 11% of collected rigid PET packaging units contained obvious residues, but only 3.5% of sorted rigid PET did, showing that packaging units with higher contents of residues are less likely to be sorted out and are hence lost for recycling. Standing out in Table 3 is the high share of contaminated packaging for nonfood monotrays (25%). Such a high share of contamination is rather uncertain, as the data for nonfood trays derive from a small sample size compared to other packaging categories. Overall, the average weight of residues per packaging is 75% lower in the sorting output compared to separately collected PET packaging.
The next section of the analysis was concerned with the coloration of PET packaging waste (see Figure 3). The majority of rigid PET packaging waste is “nature”-colored, so-called transparent clear, with approximately 80% in both waste streams, while “other colors” accounted for almost 10% each. White-colored packaging is representative for dairy food and accounted for significantly less in the sorting output. Other colored packaging is highly used in the nonfood product segments, such as cleaners and detergents, while the amount of black-colored packaging is negligible.
Further attention was paid to potential problem areas, which might affect the sortability and recyclability of the packaging. PET bottles were investigated among the type and degree of decoration (see Figure 4). Interestingly, nonfood bottles show a similar share of decoration within the collected and sorted rigid PET, while a significantly higher percentage of food bottles covering more than 50% of the bottle surface was identified in the separate collection compared to the sorting output. Interestingly, the sorting output comprised a higher share of unlabeled packaging, with up to 10 mass % for beverage bottles and food bottles. Additionally, the share of sleeves and labels covering more than 50% of the packaging surface was lower for sorted rigid PET, with 25.2% for all bottle categories, compared to collected rigid PET, amounting to 36.7%, which again highlights that large-area labeling hinders the sufficient sorting of plastics.
Concerning potential problem areas of PET tray packaging, the focus was on the use of multimaterial packaging components, such as cardboard sheets and absorbent pads, or monomaterials. The obtained results are shown in Supplementary Materials Table S6. While most of the rigid PET trays consisted of only plastic packaging components, such as multilayer lids or plastic films, certain PET trays for nonfood products showed a significant share of attached multimaterial components, mainly cardboard sheets. This derived mainly from blister packaging of nonfood products such as toilet tabs or batteries identified during the manual sorting analysis.
In the final part of the manual sorting analysis, all investigated data were amalgamated to calculate the rigid PET net quantity. The following bar charts in Figure 5 show the average contaminant coefficients of the separate collection as well as the mixed PET sorting stream, listed as residues, closures, and non-PET packaging components.
The indicator for the net quantity of collected rigid PET amounted to 0.841 (a) compared to sorted rigid PET with 0.888 (b) (see Figure 5). While the share of closure systems was similar in both waste streams, it was observed that non-PET components and residues were significantly lower in the sorting stream, which is to be expected. Significant results of the investigated net quantity indicators for all packaging categories are highlighted in yellow in Supplementary Materials Table S7. Food bottles in particular showed a high product residue content, with 12.1% on average, and nonfood monolayer trays contained a high amount of non-PET components, which derived from cardboard sheets used for blister packaging. Significantly higher amounts of closures were detected for nonfood bottles, due to the complex trigger closures, as well as for food multilayer trays, owing to additionally attached packaging wraps.

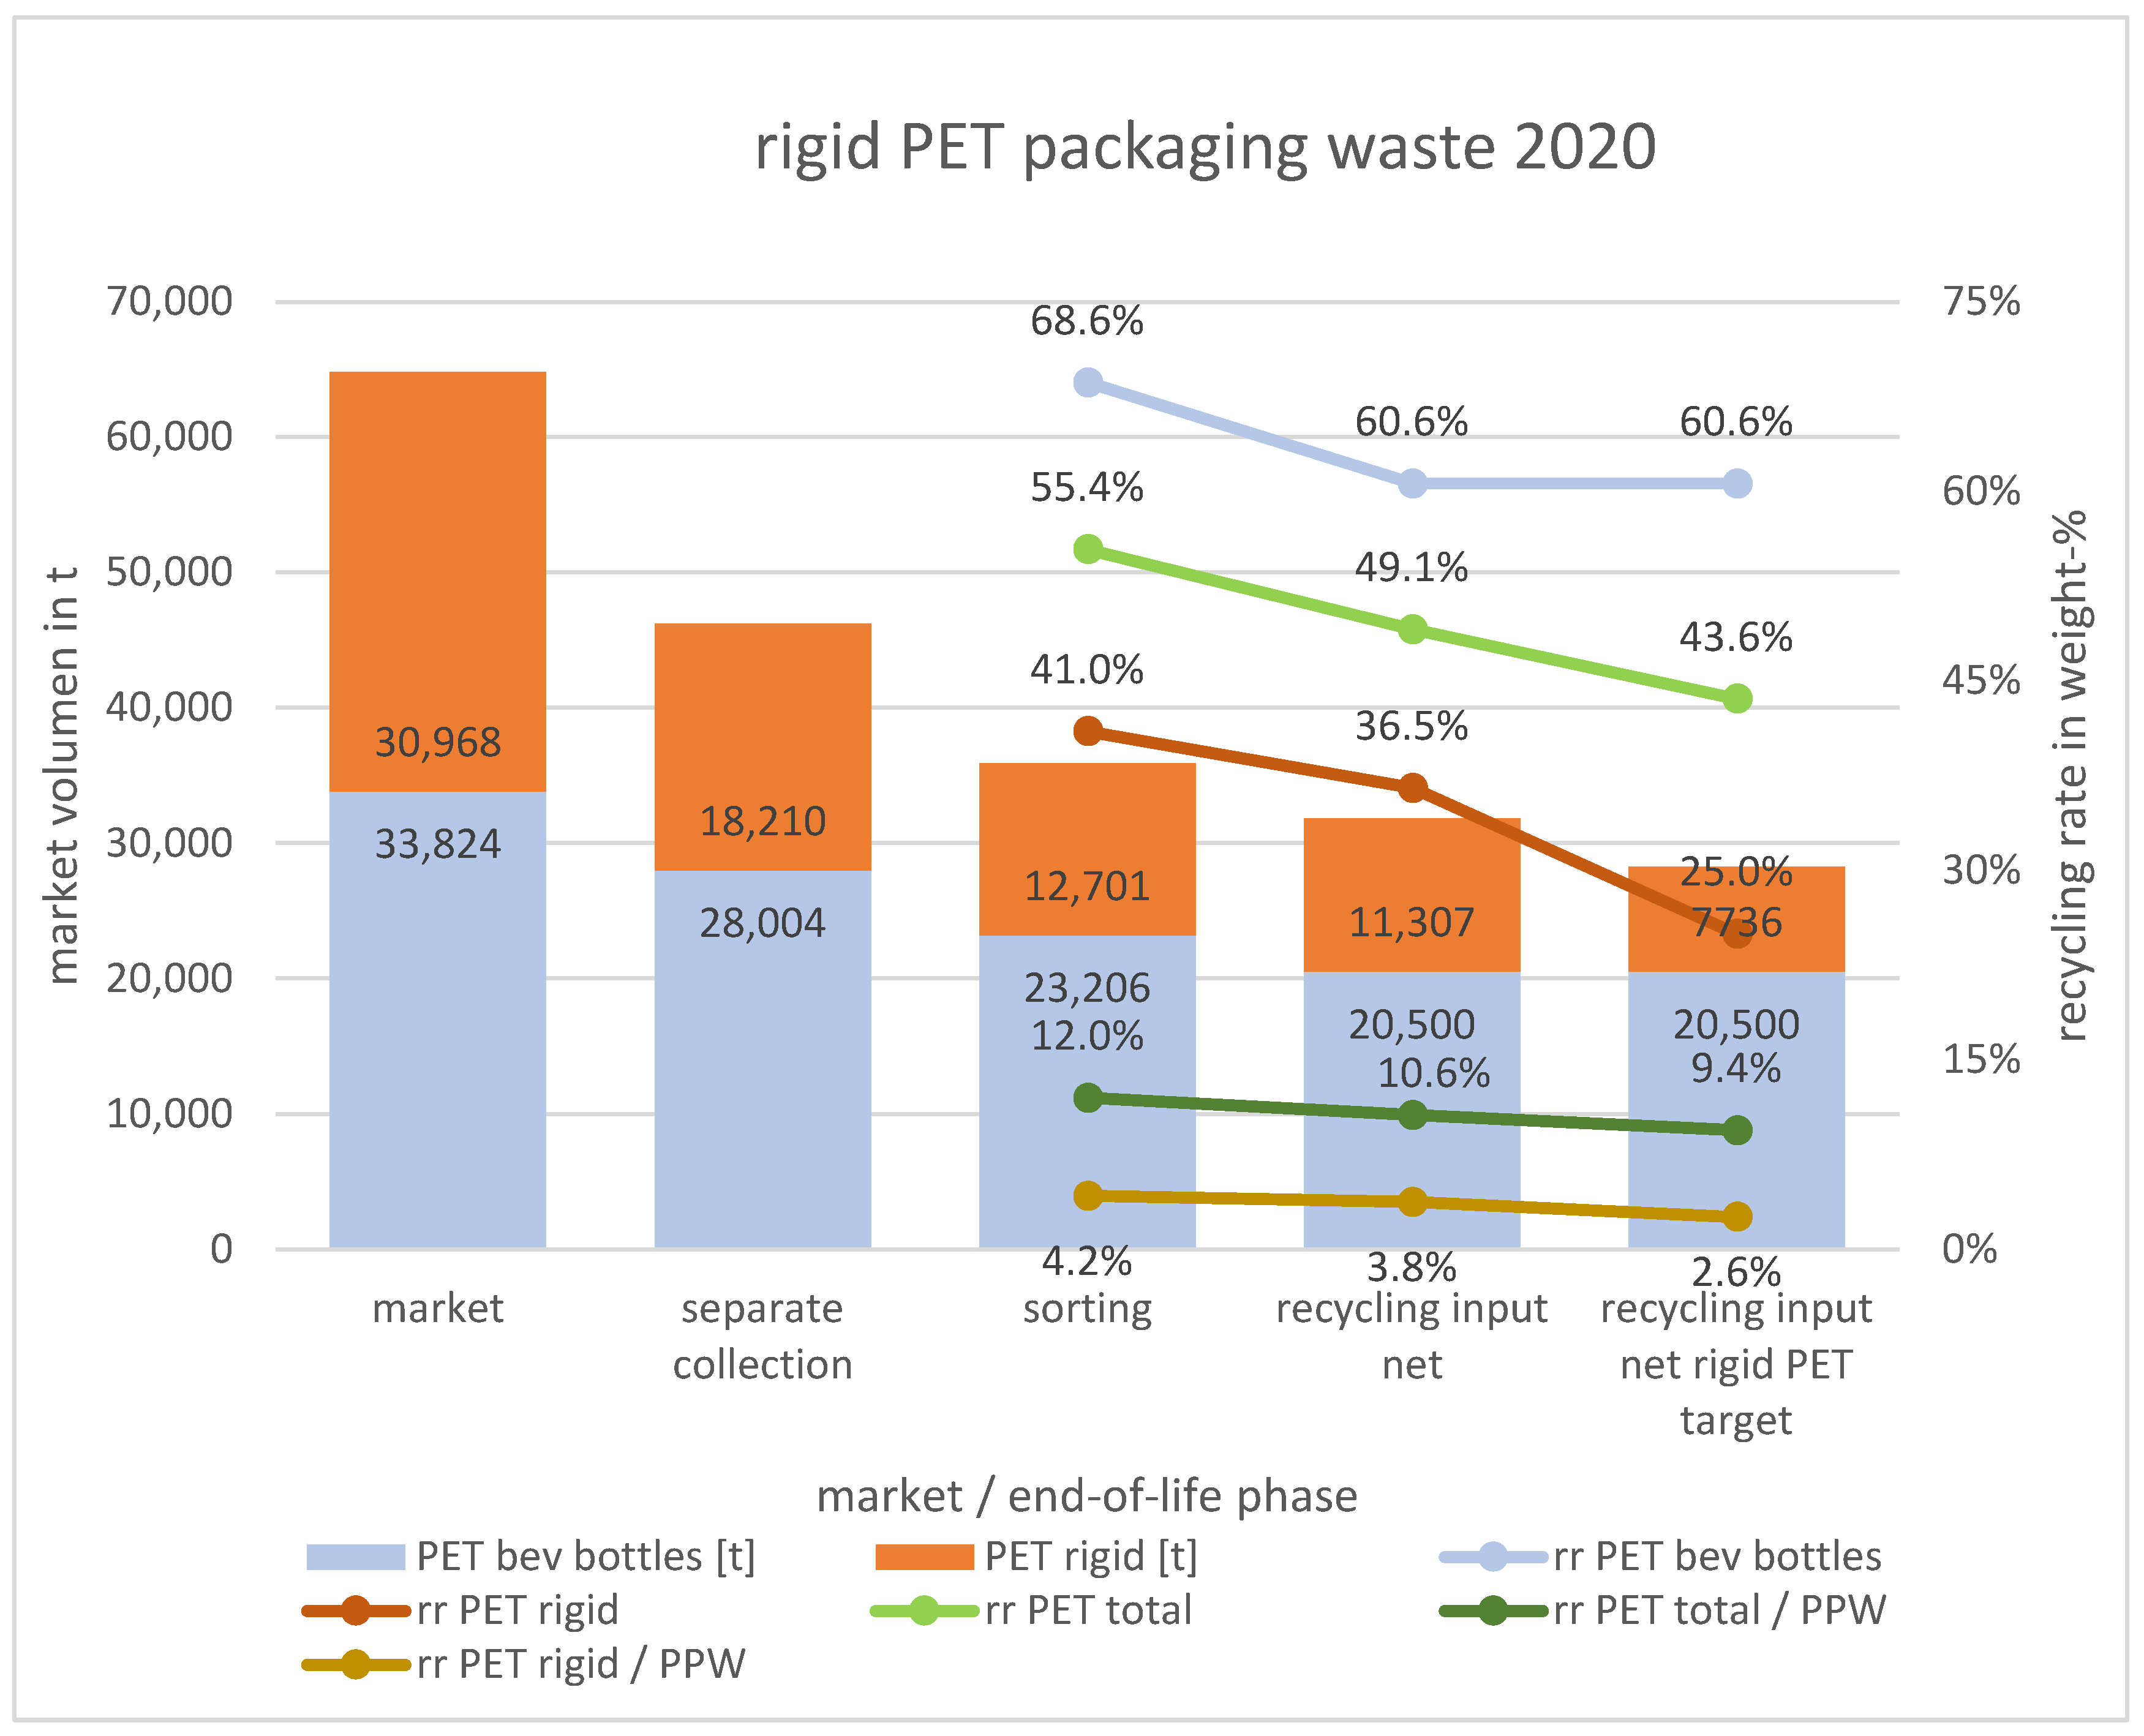
3.2. Extrapolation of the Waste Amount and Recycling Potential

This part of the study was concerned with the quantification of PET packaging waste in Austria for the year 2020 and the calculation of a possible recycling rate thereto.
The projected market volume for rigid PET in Austria accounts for 65,000 tons, of which 71% are collected separately (18.2 kt of rigid PET and 28.0 kt of PET beverage bottles) and a further 77.7% (compared to the separately collected waste volume) or 55.4% (compared to the total market volume) are sorted out. The sorted volume represents gross weight including contamination. A quantitative sorting potential of 12 kt was estimated for rigid PET. Application of the investigated net indicator n f S O from Table S7 (Supplementary Materials), to calculate a net sorted-for-recycling volume, resulted in 21 kt for beverage bottles and 11 kt for rigid PET. An overall PET recycling rate of 49.1%, compared to 55.4%, was estimated. The latter represents the recycling rate based on gross sorting volume according to current common practice. PET beverage bottles achieve a recycling rate potential of 60.6% compared to 36.5% for rigid PET. As shown in Figure 6, the main reason for the low actual recycling rate of rigid PET derives from a low separate collection rate of 58.8% as well as a low sorting rate at only 41%. Furthermore, by focusing on the rigid PET target categories exclusive beverage bottles (right bar in Figure 6), which represent nonbeverage bottles and monotrays (see Table S8 in Supplementary Materials), the gross sorting volume potential constitutes 8625 tons and the net recycling volume potential accounts for 7736 tons, which would result in an estimated recycling rate of 25%. If beverage bottles are considered within the rigid PET target categories, the net recycling potential would result in 9102 tons and a recycling rate of 29.4%. The overall contribution to achieve the 50% recycling rate target for PPW [3] amounts to 10.6% for total PET, 2.6% for high-qualitative rigid PET target categories exclusive beverage bottles, and 3.0% inclusive beverage bottles (compared to the total PPW volume of 299,140 t [4]).

4. Discussion

The main results and the applied methodology for calculating the waste and recycling potential of rigid PET packaging are discussed in detail and compared with published data.

4.1. Results from the Manual Sorting Analysis

A comparison of the findings with those of other studies partly confirms the results of the current investigation. The present study identified that 29% is PET in the separate collection of lightweight packaging waste, of which 11% accounts for rigid PET packaging (nonbeverage bottles and trays). The PET mass share in this investigation is higher compared to that of Van Eygen et al. (2018), with 21% in 2013 [7], which might be due to an increasing use of PET as packaging material. The PET purity level of the sorting output amounts to 93.8%, which complies with European MRFs (material recovery facilities) of 65–98% [46], but it slightly deviates from the required purity level in Austria of 95% for plastic packaging recycling [20]. Moreover, 70% of rigid PET packaging accounts for food packaging in the Austrian separate waste collection, which matches the results obtained by Eriksen et al. (2019), with more than 80% in Denmark [25], which is a relevant finding concerning possible food-grade recycling according to EFSA standards [37].
With regards to product residues and packaging composition, the shares of closures (9.3–11%) and labels (2.8–2.9%) for PET bottles in the present study are equivalent to Roosen et al. (2020) [27], with 9.3% and 2.7%, respectively. Additionally, the investigated amount of product residues, with 0.8–8.1%, in this research is consistent with 6.4% [27]. However, PET trays show differences: 6.8–7.8% lids, 0.6–3% other packaging components, and 0.5–1.1% residues, compared to 12.5% lids, 3.6% labels, and 4.7% residues [27]. While the wide range of values in the present study derives from different points of sampling (collection versus sorting), the differences might also derive from different sample size and might be influenced by potential outliers as well as country-specific differences.
However, the share of closures of beverage bottles in the sorting output account for 7.5%, which is in accordance with 5–8% polyolefin closures according to Neubauer et al. (2020) [20]. The overall amount for bottle closures of 9.3% derives from the fact that nonbeverage bottles, e.g., cleaning products, contain more and heavier closure systems compared to PET beverage bottles.
Another finding is that residues amount to less in the sorting stream than in the separate collection. Hence, it could conceivably be hypothesized that packaging containing more than 1 mass % of residues in relation to the packaging gross weight cannot be sorted out. Nevertheless, it is important to bear in mind that the present study did not investigate the extent to which certain packaging is emptied throughout the sorting process itself as well as concerning potential impacts of product residues regarding effective sorting capability. Further research is required to assess and validate these findings.
With regard to coloration, the present study found that the vast proportion of sorted rigid PET is transparent clear, with more than 80%, in Austria. The share of black and other colored trays (7.6%) corresponds with the average European figures of 7% provided by PRE, while the mass share of transparent mono-PET trays in relation to all contained trays in the sorting stream constitutes 54%, compared to Europe with 46% [16].
Initially, it was assumed that decorative packaging elements amount to less in the sorting output compared to the sorting input (collected rigid PET). The following surprising insights were gained: firstly, an equivalent share of nonfood bottles with more than 50% decorative coverage was found in both waste streams, which might be related to different points of investigation (point of collection vs. sorting). Secondly, the weight share of decorative elements such as labels or sleeves applied onto bottles was slightly lower in the sorting output (2.8%) compared to the sorting input (3.2%). And thirdly, a significantly lower mass share (10%) of nonfood trays containing multimaterial components was observed in the sorting output compared to the input mass share (25%), which supports the hypothesis that other material components might negatively impact the sortability. Lastly, one unexpected finding was the high mass share of unlabeled bottles in sorted rigid PET compared to collected rigid PET. It is difficult to explain this result, but it might be related to lost decorative components throughout the sorting process, which is in accordance with the observations of PET trays. However, to develop a full picture of the packaging sorting capability, additional studies are required concerning different types of decoration and their potential losses during the sorting process. In addition, a reliable assessment needs to be undertaken regarding the detectability and its influencing factors of PET bottles covered with full-body sleeves.
Most striking were the findings concerning the investigated net quantity indicators for PET packaging waste, with 0.841 for the separate collection, and for the sorting output, 0.887 (inclusive beverage bottles) and 0.888 (exclusive beverage bottles). Previous studies demonstrated a net ratio of 0.813 for plastic packaging in MSW [47]. The slightly higher net factors from the present study might emanate from less contamination in separate waste collection compared to MSW.

4.2. Extrapolation of the Waste Amount and Recycling Potential

An initial objective of the study was to quantify the total rigid PET waste volume for Austria and to provide insights regarding its recycling potential.
The projection of the total separately collected packaging waste volume is based on lightweight packaging of 159,131 tons in 2020 [31], while total collection, including MSW and sorting volumes are based on the applied efficiency indicators by Van Eygen et al. (2018) [7]. It is assumed that no significant changes in waste management systems were induced during the past decade. For PET beverage bottles, the latest figures from WKÖ [38] were used.
Table 4 provides an overview of the published figures from other studies in relation to the generated results of the present study. Investigated values of the present study are stated in the range of a ±15% standard deviation.
First of all, the overall PET amount in Austria for 2020 is comparable with research published by Packforce (2022), with more than 60,000 tons [30]. The findings concerning PET beverage bottles are partly consistent with those provided by WKÖ [38]. For a better comparison with Van Eygen et al. (2018) [7], the last column “present study revised” was added by subsuming beverage and nonbeverage bottles. This investigation revealed that PET packaging increased by 6.5 kt on average compared to Van Eygen et al. (2018) [7]. The mass share of PET bottles with 13–18% in the Austrian PPW stream is comparable to 15% reported by Van Eygen et al. (2018) [7]. Similarly, the mass share of total PET with 18–25% corroborate the findings of Van Eygen et al. (2018), with 19% [7], and Packforce (2022), with 21% [30], while the level of other PET packaging is higher compared to Van Eygen et al. (2018) [7]. A possible explanation for these developments might be changes in packaging design such as reduced weight of beverage bottles [48] and the greater amount of rigid PET packaging due to the increasing processed food industry [18]. Moreover, the gathered results correlate with European reported figures: bottle/tray mass share resulted in 71%/29% in Austria compared to 78%/22% within EU27+UK [16]. During the period of waste sampling, different separate collection schemes were in place in Austria [32]. However, the implementation of a uniform separate collection of PPW [19] and DRS [33] should have a positive effect on the separate collection rate and the collection efficiency.
However, significant differences appear in the sorting volume. The present study revealed a maximum sorting potential of 14.6 kt rigid PET (inclusive beverage bottles) and 4.7 kt without bottles, while Packforce (2022) reported that 3495 t were sorted and sent to recycling in 2019 [30]. The resulting sorting efficiency (sorting volume in relation to separately collected waste) amounted to 90% for bottles and 37% for other PET packaging, which differed from the figures reported by Van Eygen et al. (2018) [7], with 83% (PET bottles) and 24% (other PET waste). This discrepancy could be explained by the additional theoretical sorting mass potential deriving from nonbeverage bottles and trays. Furthermore, the sorted for recycling rate (the gross sorting volume in relation to the generated PET waste (collection volume)) for rigid PET resulted in 41% compared to 18% [30], while for total PET it amounted to 55%, compared to 49% at the European level based on an assumption by PRE [16]. The estimated sorted for recycling rate (the sorting amount in relation to the market volume (collection)) for PET trays by PRE for EU27+3 with 21% [16] is fairly consistent with 22% in the present study. According to these data, we can infer that the possible sorting and recycling potential is not yet fully exploited in Austria and that a significant amount is thermally recovered, which corresponds to Wagner et al. (2018) [21], who showed that PET nonbottles are sorted out and thermally recovered in Germany. Despite this, the Netherlands established a separate sorting stream for PET trays in 2015 [23], of which approximately two-thirds were sorted out correctly in 2017, but not further processed due to lacking operational facilities [24].
With respect to the second aim of this study, this investigation was designed to determine the recycling potential by partly ascertaining applicable ALRs for rigid PET packaging waste. The pertinent net quantity indicators were investigated for different rigid PET packaging categories (see Table S7 in Supplementary Materials). However, these partly investigated ALRs ( n f S O ) consider foreign contaminants from residues, closures, and other packaging components exclusively (see Equation (2)). Further process-related material losses [45], either occurring during the recycling pretreatment or the recycling process itself [16,20,44,49], are not regarded. Therefore, a significant difference appears among the contaminant coefficient in the present study, with 11.3% for total rigid PET PW (Austria) compared to the published ALR for plastic packaging with 30.3% in Germany [45]. Nonetheless, a note of caution is due here since different waste streams are compared (rigid PET PW versus PPW) and, in addition, German ALRs are based on recycling yields investigated by Wagner et al. (2018) [21], which mainly take PET bottle recycling into consideration. Wagner et al. (2018) [21] reported a recycling yield (defined as recyclate output in relation to the sorting amount) for PET of 52.5%, where only PET bottles are mechanically recycled and other PET packaging is used energetically. Apart from that, this discrepancy could be attributed to country-specific differences in the waste management system as well as the composition of the packaging waste.
Moreover, this study revealed a recycling rate of 36.5%, which represents the highest achievable recycling rate for rigid PET in general. By further focusing on valuable waste streams and target categories, the achievable recycling rate would decrease to 29.4% (inclusive beverage bottles) or 25% (target categories exclusive beverage bottles), but it would positively affect the recyclate quality due to the lower contamination potential deriving from multilayer trays. Even though rigid PET currently contributes only 3.8% or 3.0% (target fraction inclusive beverage bottles) to the overall achievable 50% PPW recycling rate [3], this value could be increased by raising the collection and sorting volumes. It needs to be highlighted that this value does not take other recyclable packaging components into account. Nevertheless, using the recycling rate as an appropriate indicator for further movement towards a circular economy has been a controversial issue and a much disputed subject as important quality aspects are not considered [50,51]. As already mentioned, the extrapolated waste and recycling potential in this study does not consider any technological feasibility, economic viability, or ecological aspects by closing the loop of rigid PET.
Nonetheless, rigid PET packaging possesses a significant recycling potential thanks to its material properties, particularly for food packaging as well as its high quality [8], as already demonstrated by bottle-to-bottle recycling throughout the past decades. Moreover, PET has a lower calorific value compared to other plastic waste [52,53], which might endorse mechanical recycling compared to other forms of recovery. According to Meys et al. (2020), mechanical recycling represents the preferential treatment for PET packaging waste compared to chemical recycling (production of refinery feedstock and fuels) thanks to its lower environmental impact [54]. Commodity prices for PET are economically advantageous compared to other plastics [55], but the PET recyclate is under increased pressure from the favorable pricing of virgin material [56]. Nonetheless, PET is one of the mainly used materials in the processed food industry, and its exponential growth is forecasted [18].

4.3. Limitations

Due to the applied two-tiered approach of this investigation, there are several sources of error. Results from the manual sorting analysis might be representatively biased in terms of seasonality and COVID-19. The waste samples were taken between November 2020 and March 2021 during COVID-19 lockdown, which, therefore, might influence the composition and amount of rigid PET packaging waste deriving from the separate collection. Moreover, PET beverage bottles do not represent a target packaging waste category due to existing bottle-to-bottle recycling; therefore, beverage bottles contained in the separate collection (collected rigid PET) were not analyzed in detail. However, beverage bottles, which were not previously sorted out and remained in the PET mixed sorting stream, account for sorted rigid PET and were taken into consideration. Comparisons with other studies need to be analyzed with caution. Presented factors concerning the sortability and the sorting efficiency, such as contained product residues and bottle decoration, represent indications, which might negatively affect the sortability, but this was not tested by conducting sorting tests. Moreover, the extrapolation concerning the separately collected and sorted waste amount of the rigid PET packaging waste was based on the efficiency factors reported by Van Eygen et al. (2018) [7]. Furthermore, changes of the mass flows of the investigated waste streams are to be expected due to accomplished harmonized separate collection for PPW [19] and the upcoming implementation of DRS for beverage bottles [33] in Austria. Notwithstanding, the drawback of this study was the paucity of data concerning the process-related material losses, which would affect the recycling rate further and represents a fruitful area for further work.

5. Conclusions

The main goal of the current study was to determine the amount and composition of collected rigid PET and sorted rigid PET, to generate insights into the sorting efficiency and to project the current waste and recycling potential for Austria.
The main conclusions concerning the methodology as well as the generated results, which can be drawn from the present study, are as follows:
  • Representative results for a total year might be seasonally variable limited due to short period of sampling.
  • Insights into the sorting efficiency are limited due to the absence of sorting trials.
  • Rigid PET accounts for 11 mass % contained in the separate collection.
  • Extrapolated waste amount for rigid PET is estimated at between 26.3 and 35.6 kt for 2020.
  • More than two-thirds account for food packaging and the majority is transparently colored.
  • Packaging containing residues with more than 1% of total packaging weight as well as adherent non-PET components might negatively affect the sortability.
  • The quantitative contamination potential of the sorting output (sorted rigid PET exclusive beverage bottles) from foreign materials amounts to 11.2 mass % of the total packaging weight, which comprises residues: 0.7%, closures: 8.5%, and non-PET packaging components: 2.0%. This results in an applicable net quantity indicator of 0.888.
  • The recycling rate for rigid PET is projected to be 37%, and for the respective target categories to be 25%.
Overall, the present study was one of the first attempts to thoroughly examine the rigid PET packaging waste stream in Austria and enhanced our understanding of its quantitative waste and recycling potential. This study showed that there is a limited but significant fraction of PET rigid packaging not yet sorted out but available for recycling. To exploit this potential, further work on improving the sorting efficiency is necessary, as well as reducing the amount of currently nonrecyclable PET-multimaterial that impairs the recyclate quality. Further research might explore the closed-loop recycling routes for this waste stream in particular.
The current study was limited by its theoretical approach, irrespective of the technical and qualitative feasibility concerning closed-loop recycling. Further research is required to explore to which qualitative extent rigid PET is recyclable by additionally considering the ecological and economical dimensions.

Supplementary Materials

The following supporting information can be downloaded at: https://www.mdpi.com/article/10.3390/resources12110128/s1, Figure S1: Calculation points for projecting the waste and recycling potential; Table S1: Applied formulas for the waste and recycling potential; Table S2: Applied data for the waste and recycling potential; Table S3: Results—composition of rigid PET packaging waste; Table S4: Results—residues; Table S5: Results—problem areas: bottles; Table S6: Results—problem areas: trays; Table S7: Results—net quantity indicators; Table S8: Results—rigid PET packaging waste and circularity potential in Austria for 2020.

Author Contributions

Conceptualization, V.H.G. and A.S.; data curation, V.H.G. and A.S.; formal analysis, V.H.G., A.S. and J.F.; investigation, V.H.G. and A.S.; methodology, V.H.G., A.S., J.F. and M.T.; project administration, V.H.G. and M.P.; resources, J.F., M.T. and S.A.; supervision, J.F., M.T. and S.A.; validation, V.H.G.; visualization, V.H.G.; writing—original draft, V.H.G.; writing—review and editing, A.S., M.P., J.F., M.T. and S.A. All authors have read and agreed to the published version of the manuscript.

Funding

This research was funded by the FFG (Austrian Research Promotion Agency) for the research project PET2Pack grant number 901069. The APC was funded by FH Campus Wien.

Data Availability Statement

The data presented in this study are available in Supplementary Materials Tables S3–S8.

Acknowledgments

The authors would like to thank all PET2Pack project partners for their administrative support and expertise as well as involved staff at the sorting plants for their support during sampling and sample processing. Special thanks are directed to all persons who were involved in manual sorting analysis for their support concerning packaging waste analysis, data collection, technical support, and provision of laboratory, in particular, the laboratory team of Research Unit of Waste and Resource Management at TU Wien, as well as involved team members of the institute of Packaging and Resource Management at FH Campus Wien. The authors would like to thank Mary Grace Wallis in particular for reviewing and providing comments on the manuscript.

Conflicts of Interest

The authors declare no conflict of interest. The funders had no role in the design of the study; in the collection, analyses, or interpretation of data; in the writing of the manuscript; or in the decision to publish the results.

References

  1. Plastics Europe. The Circular Economy for Plastics: A European Overview. 2022. Available online: https://plasticseurope.org/knowledge-hub/the-circular-economy-for-plastics-a-european-overview-2/ (accessed on 12 October 2022).
  2. European Parliament. European Parliament and Council Directive 94/62/EC of 20 December 1994 on packaging and packaging waste: OJ L 365. 2018. Available online: https://eur-lex.europa.eu/legal-content/EN/TXT/HTML/?uri=CELEX:01994L0062-20180704&qid=1678852881190&from=de (accessed on 15 March 2023).
  3. BMLFUW. Verordnung des Bundesministers für Land- und Forstwirtschaft, Umwelt und Wasserwirtschaft über die Vermeidung und Verwertung von Verpackungsabfällen und bestimmten Warenresten (Verpackungsverordnung 2014). 2014. BGBl. II Nr. 184/2014. Available online: https://www.ris.bka.gv.at/GeltendeFassung.wxe?Abfrage=Bundesnormen&Gesetzesnummer=20008902 (accessed on 22 August 2023).
  4. BMK. Bundes-Abfallwirtschaftsplan (BAWP) 2023: Teil 1, Wien. 2023. Available online: https://www.bmk.gv.at/themen/klima_umwelt/abfall/aws/bundes_awp/bawp2023.html (accessed on 7 March 2023).
  5. European Commission. Commission Implementing Decision (EU) 2019/665 of 17 April 2019 amending Decision 2005/270/EC establishing the formats relating to the database system pursuant to European Parliament and Council Directive 94/62/EC on packaging and packaging waste (notified under document C(2019) 2805) (Text with EEA relevance). 2019. Available online: https://eur-lex.europa.eu/legal-content/EN/TXT/HTML/?uri=CELEX:32019D0665&from=EN (accessed on 7 March 2023).
  6. European Commission. Proposal for a Regulation on Packaging and Packaging Waste, Amending Regulation (EU) 2019/1020 and Directive (EU) 2019/904, and Repealing Directive 94/62/EC: COM(2022) 677 Final. 2022. Available online: https://environment.ec.europa.eu/publications/proposal-packaging-and-packaging-waste_en (accessed on 10 March 2023).
  7. Van Eygen, E.; Laner, D.; Fellner, J. Circular economy of plastic packaging: Current practice and perspectives in Austria. Waste Manag. 2018, 72, 55–64. [Google Scholar] [CrossRef] [PubMed]
  8. Welle, F. Twenty years of PET bottle to bottle recycling—An overview. Resour. Conserv. Recycl. 2011, 55, 865–875. [Google Scholar] [CrossRef]
  9. Plastics Europe. Plastics—The Facts 2021: An Analysis of European Plastics Production, Demand and Waste Data. 2021. Available online: https://plasticseurope.org/knowledge-hub/plastics-the-facts-2021/ (accessed on 12 October 2022).
  10. Tonini, D.; Garcia-Gutierrez, P.; Nessi, S. Environmental Effects of Plastic Waste Recycling: EUR 30668 EN; JRC122455; Publications Office of the European Union: Luxembourg, 2021; ISBN 978-92-76-41130-7. [Google Scholar] [CrossRef]
  11. Oromiehie, A.; Mamizadeh, A. Recycling PET beverage bottles and improving properties. Polymer Int. 2004, 53, 728–732. [Google Scholar] [CrossRef]
  12. Pinter, E.; Welle, F.; Mayrhofer, E.; Pechhacker, A.; Motloch, L.; Lahme, V.; Grant, A.; Tacker, M. Circularity Study on PET Bottle-To-Bottle Recycling. Sustainability 2021, 13, 7370. [Google Scholar] [CrossRef]
  13. Schmidt, S.; Laner, D.; Van Eygen, E.; Stanisavljevic, N. Material efficiency to measure the environmental performance of waste management systems: A case study on PET bottle recycling in Austria, Germany and Serbia. Waste Manag. 2020, 110, 74–86. [Google Scholar] [CrossRef] [PubMed]
  14. Welle, F. Is PET bottle-to-bottle recycling safe? Evaluation of post-consumer recycling processes according to the EFSA guidelines. Resour. Conserv. Recycl. 2013, 73, 41–45. [Google Scholar] [CrossRef]
  15. European Food Safety Authority. PET Recycling Processes for Food Contact Materials: EFSA Adopts First Opinions. Available online: https://www.efsa.europa.eu/en/press/news/120802 (accessed on 3 May 2023).
  16. PRE Website. PET Market in Europe State of Play 2022: Production, Collection and Recycling. 2022. Available online: https://www.plasticsrecyclers.eu/plastics-recyclers-publications (accessed on 14 October 2022).
  17. Grant, A.; Lahme, V.; Connock, T.; Lugal, L. How circular is PET?: A Report on the Circularity of PET Bottles, Using Europe as a Case Study, February 2022. Available online: https://zerowasteeurope.eu/wp-content/uploads/2022/02/HCIP_V13-1.pdf/ (accessed on 3 October 2023).
  18. Strategic Market Research. PET Packaging Market Size, Growth Trends|Report 2030. Available online: https://www.strategicmarketresearch.com/market-report/pet-packaging-market (accessed on 28 April 2023).
  19. BMK. Kreislaufwirtschaft: Ab 2023 österreichweit einheitliche Sammlung von Kunststoffverpackung. 2022. Available online: https://infothek.bmk.gv.at/verpackungsverordnung-ab-2023-oesterreichweit-einheitliche-sammlung-von-kunststoffverpackung/ (accessed on 5 May 2023).
  20. Neubauer, C.; Stoifl, B.; Tesar, M.; Thaler, P. Sortierung und Recycling von Kunststoffabfällen in Österreich: Status 2019, REP-0744. Wien. 2020. Available online: https://www.umweltbundesamt.at/studien-reports/publikationsdetail?pub_id=2357&cHash=55a375c9008e945f8c5b750745a179f6 (accessed on 11 October 2022).
  21. Wagner, J.; Günther, M.; Rhein, H.-B.; Meyer, P. Analyse der Effizienz und Vorschläge zur Optimierung von Sammelsystemen (Hol- und Bringsysteme) der Haushaltsnahen Erfassung von Leichtverpackungen und Stoffgleichen Nichtverpackungen auf der Grundlage Vorhandener Daten 37/2018, Dessau-Roßlau. 2018. Available online: https://www.umweltbundesamt.de/publikationen/analyse-der-effizienz-vorschlaege-zur-optimierung (accessed on 17 May 2023).
  22. van Thoden Velzen, E.U.; Smeding, I.W.; Molenveld, K. Verkenning Maximaal Haalbarekwaliteiten Gerecyclede PET uit Schalen: Praktische Studie Naar de Maximaal Haalbare Kwaliteit van Mechanisch Gerecyclede PET uit Schalen; Wageningen Food & Biobased Research: Wageningen, The Netherlands, 2020; ISBN 9789463954662. [Google Scholar]
  23. van Thoden Velzen, U. Recyclingopties voor PET Schalen; Wageningen Food & Biobased Research: Wageningen, The Netherlands, 2017. [Google Scholar] [CrossRef]
  24. Brouwer, M.; Picuno, C.; van Thoden Velzen, E.U.; Kuchta, K.; de Meester, S.; Ragaert, K. The impact of collection portfolio expansion on key performance indicators of the Dutch recycling system for Post-Consumer Plastic Packaging Waste, a comparison between 2014 and 2017. Waste Manag. 2019, 100, 112–121. [Google Scholar] [CrossRef]
  25. Eriksen, M.K.; Astrup, T.F. Characterisation of source-separated, rigid plastic waste and evaluation of recycling initiatives: Effects of product design and source-separation system. Waste Manag. 2019, 87, 161–172. [Google Scholar] [CrossRef]
  26. Eriksen, M.K.; Christiansen, J.D.; Daugaard, A.E.; Astrup, T.F. Closing the loop for PET, PE and PP waste from households: Influence of material properties and product design for plastic recycling. Waste Manag. 2019, 96, 75–85. [Google Scholar] [CrossRef] [PubMed]
  27. Roosen, M.; Mys, N.; Kusenberg, M.; Billen, P.; Dumoulin, A.; Dewulf, J.; van Geem, K.M.; Ragaert, K.; de Meester, S. Detailed Analysis of the Composition of Selected Plastic Packaging Waste Products and Its Implications for Mechanical and Thermochemical Recycling. Environ. Sci. Technol. 2020, 54, 13282–13293. [Google Scholar] [CrossRef]
  28. Roosen, M.; Mys, N.; Kleinhans, K.; Lase, I.S.; Huysveld, S.; Brouwer, M.; van Thoden Velzen, E.U.; van Geem, K.M.; Dewulf, J.; Ragaert, K.; et al. Expanding the collection portfolio of plastic packaging: Impact on quantity and quality of sorted plastic waste fractions. Resour. Conserv. Recycl. 2022, 178, 106025. [Google Scholar] [CrossRef]
  29. FH Campus Wien. PET2Pack—FH Campus Wien. Available online: https://www.fh-campuswien.ac.at/en/forschung/projekte-und-aktivitaeten/pet2pack.html (accessed on 17 August 2023).
  30. Packforce. Kunststoff-Verpackungen in Österreich: Kreislaufwirtschaft und Nachhaltigkeitsbewertung, Wien. 2022. Available online: https://www.fh-campuswien.ac.at/studium-weiterbildung/aktuell/news-und-events/kunststoff-studie-kreislaufwirtschaft-und-nachhaltigkeitsbewertung.html (accessed on 7 March 2023).
  31. Altstoff Recycling Austria. Stoffströme: Sortierung und Verwertung—Rohstoffe Erfolgreich im Kreislauf Halten. Kennzahlen Materialströme—Circular Economy. Available online: https://transparenzbericht.ara.at/was-uns-ausmacht/stoffstrome/#sortierung-und-verwertung (accessed on 16 March 2023).
  32. BMK. Die Bestandsaufnahme der Abfallwirtschaft in Österreich: Statusbericht 2021 (Referenzjahr 2019), Wien. 2021. Available online: https://www.bmk.gv.at/themen/klima_umwelt/abfall/aws/bundes_awp/bawp.html (accessed on 20 October 2022).
  33. BMK. Gegen die Plastikflut: Österreich bekommt ab 2025 neues Einwegpfandsystem. 2021. Available online: https://infothek.bmk.gv.at/ (accessed on 2 May 2023).
  34. OMV AG. Plastic2Plastic: ReOil Completes the Circle in Plastics Recycling. Available online: https://www.omv.com/en/blog/plastic2plastic-reoil-completes-the-circle-in-plastics-recycling (accessed on 14 September 2023).
  35. Damayanti; Wu, H.-S. Strategic Possibility Routes of Recycled PET. Polymers 2021, 13, 1475. [Google Scholar] [CrossRef] [PubMed]
  36. Lechleitner, A.; Schwabl, D.; Schubert, T.; Bauer, M.; Lehner, M. Chemisches Recycling von gemischten Kunststoffabfällen als ergänzender Recyclingpfad zur Erhöhung der Recyclingquote. Österr Wasser-Und Abfallw 2020, 72, 47–60. [Google Scholar] [CrossRef]
  37. EFSA Panel on food contact materials, enzymes, flavourings and processing aids (CEF). Scientific Opinion on the criteria to be used for safety evaluation of a mechanical recycling process to produce recycled PET intended to be used for manufacture of materials and articles in contact with food. EFSA J. 2011, 9, 2184. [Google Scholar] [CrossRef]
  38. WKÖ. Gesellschaftliche Verantwortung: Nachhaltigkeitsagenda für Getränkeverpackungen, Umsetzungsbericht 2020, Juni 2021. Available online: https://www.wko.at/oe/netzwerke/umsetzungsbericht-nachhaltigkeitsagenda-2020.pdf (accessed on 16 March 2023).
  39. Altstoff Recycling Austria AG. Rohstoff Kunststoff: Ressourcen und Kreislaufwirtschaft neu denken. Und machen, September 2019. Available online: https://www.ara.at/uploads/Dokumente/EU-Kreislaufwirtschaftspaket/Kunststoffbroschuere/ARA_Kunststoffbroschuere.pdf (accessed on 4 August 2023).
  40. Skutan, S.; Brunner, P.H. Metals in RDF and other high calorific value fractions from mechanical treatment of MSW: Analysis and sampling errors. Waste Manag. Res. 2012, 30, 645–655. [Google Scholar] [CrossRef] [PubMed]
  41. BMK. Die Bestandsaufnahme der Abfallwirtschaft in Österreich: Statusbericht 2020 (Referenzjahr 2018), Vienna. 2020. Available online: https://www.wko.at/service/ooe/umwelt-energie/BAWP_Statusbericht_2020_4.pdf (accessed on 25 October 2022).
  42. Gürlich, U.; Kladnik, V.; Pavlovic, K. Circular Packaging Design Guideline: Design Recommendations for Recyclable Packaging; Vienna, September 2022. Available online: https://digital.obvsg.at/obvfcwacc/download/pdf/8086823?originalFilename=true (accessed on 6 March 2023).
  43. Faraca, G.; Astrup, T. Plastic waste from recycling centres: Characterisation and evaluation of plastic recyclability. Waste Manag. 2019, 95, 388–398. [Google Scholar] [CrossRef]
  44. Kozlowski, M. Recycling of Food Packaging Materials. In Functional Polymers in Food Science: From Technology to Biology; Volume 1: Food, Packaging; Iemma, F., Cirillo, G., Spizzirri, U.G., Eds.; John Wiley & Sons Inc: Hoboken, NJ, USA, 2015; pp. 355–399. ISBN 1119109604. [Google Scholar]
  45. Burger, A.; Cayé, N.; Jaegermann, C.; Schüler, K. Aufkommen und Verwertung von Verpackungsabfällen in Deutschland im Jahr 2019: Abschlussbericht 148/2021, Dessau-Roßlau. 2021. Available online: https://www.umweltbundesamt.de/publikationen/aufkommen-verwertung-von-verpackungsabfaellen-in-15 (accessed on 17 April 2023).
  46. Antonopoulos, I.; Faraca, G.; Tonini, D. Recycling of post-consumer plastic packaging waste in the EU: Recovery rates, material flows, and barriers. Waste Manag. 2021, 126, 694–705. [Google Scholar] [CrossRef]
  47. Beigl, P. Auswertung der Restmüllzusammensetzung in Österreich 2018/19: Ergebnisbericht, Wien. 2020. Available online: https://www.bmk.gv.at/themen/klima_umwelt/abfall/Kreislaufwirtschaft/verwertung/studien/restmuell.html (accessed on 7 March 2023).
  48. Welle, F. The Facts about PET. 2018. Available online: https://petcore-europe.org/images/news/pdf/factsheet_the_facts_about_pet_dr_frank_welle_2018.pdf (accessed on 21 April 2023).
  49. Kauertz, B.; Detzel, A. Verwendung und Recycling von PET in Deutschland: Verwendung von PET und PET Rezyklaten aus Verpackungen in Deutschland; Eine Kurzstudie im Auftrag des NABU—Naturschutzbund Deutschland e.V.: Heidelberg, Germany, 2017. [Google Scholar]
  50. Fellner, J.; Lederer, J. Recycling rate—The only practical metric for a circular economy? Waste Manag. 2020, 113, 319–320. [Google Scholar] [CrossRef]
  51. Haupt, M.; Vadenbo, C.; Hellweg, S. Do We Have the Right Performance Indicators for the Circular Economy?: Insight into the Swiss Waste Management System. J. Ind. Ecol. 2017, 21, 615–627. [Google Scholar] [CrossRef]
  52. Suthar, M.; Lata, N.; Nagar, B. Plastic Waste as an Alternate Fuel. Int. J. Eng. Res. Technol. (IJERT) 2020, 9, 1254–1261. [Google Scholar]
  53. Sogancioglu, M.; Ahmetli, G.; Yel, E. A Comparative Study on Waste Plastics Pyrolysis Liquid Products Quantity and Energy Recovery Potential. Energy Procedia 2017, 118, 221–226. [Google Scholar] [CrossRef]
  54. Meys, R.; Frick, F.; Westhues, S.; Sternberg, A.; Klankermayer, J.; Bardow, A. Towards a circular economy for plastic packaging wastes—The environmental potential of chemical recycling. Resour. Conserv. Recycl. 2020, 162, 105010. [Google Scholar] [CrossRef]
  55. Plasticker. Angebotspreise in der Plasticker Rohstoffbörse. Available online: https://plasticker.de/preise/preise_monat.php?group=com (accessed on 28 April 2023).
  56. Probst, T. bvse-Marktbericht: Kunststoffe März 2023. Available online: https://plasticker.de/docs/preise/bvse_Marktbericht_Kunststoff_2023_03.pdf (accessed on 28 April 2023).
Figure 1. Sorting catalogue. The manual sorting procedure followed a standardized analysis consisting of seven sorting steps. The investigation of PET packaging waste took place concerning material, product origin, product residues, coloration, and problem areas, as well as packaging components.
Resources 12 00128 g001
Figure 2. Packaging categories. Comparison of the composition of collected rigid PET (a) and sorted rigid PET (b) according to defined packaging categories. The bars in light green represent target packaging categories, while striped bars do not due to potential contamination (data given in mass %). Beverage bottles contained in the sorting output are not a target category, in fact, but do not represent contaminants simultaneously for rigid PET recycling.
Resources 12 00128 g002
Figure 3. Coloration. The share of PET packaging categories among packaging coloration identified in the separate collection (collected rigid PET) (a) as well as the sorting output (sorted rigid PET) (b) based on the packaging gross weight without residues (data given in mass %).
Resources 12 00128 g003
Figure 4. Potential problem areas: bottles. Identified problem areas for PET bottles in the separate collection (collected rigid PET) and PET sorting stream (sorted rigid PET): the share of bottle decoration split up into direct print, label/sleeve ≤ 50%, “undecorated”, and label/sleeve > 50% of the packaging surface coverage. The mass base represents gross weight without residues (data given in mass %). The share of bottles with direct print in the sorting output constitutes less than 0.1 m %.
Resources 12 00128 g004
Figure 5. Net quantity indicator (nf) for rigid PET packaging waste in mass %. Indicators for contaminants concerning product residues, closure systems, and non-PET packaging components for collected rigid PET (nfYB) (a) as well as sorted rigid PET (nfSO) (b).
Resources 12 00128 g005
Figure 6. Waste and recycling potential. Extrapolated average rigid PET packaging waste amount and recycling potential for the year 2020 in Austria.
Resources 12 00128 g006
Table 1. Minimum sample size. Applied values for Equation (1) to calculate minimum required sample size for collected rigid PET and sorted rigid PET to generate representative results for Austria in 2020.
Collected Rigid PETSorted Rigid PET
ω 0.0074 kg/kg0.016 kg/kg
c e x p e c t e d 7400 mg/kg16,000 mg/kg
s d e s i r e d 1100 mg/kg2400 mg/kg
m m a x 0.15 kg0.15 kg
m 10 % 0.005 kg0.005 kg
M 363 kg168 kg
Table 2. Packaging waste composition. Composition of the PPW separate collection “collected rigid PET” and the PET sorting output “sorted rigid PET” (data given in mass %).
Separately Collected PPW
Mass %
Sorted Rigid PET
Mass %
PET total29.093.8
Beverage bottles PET17.611.4
Rigid PET11.482.4
Impurities20.21.4
Non-PET plastic packaging50.84.8
Table 3. Product residues. Investigated obvious product residues, which are represented by the following factors: (column 1) weight of residues in relation to gross packaging weight in mass %, (column 2) percentage of packaging units containing residues in mass %, (column 3) average gram of residues per packaging unit containing residues, and (column 4) average residues in gram of all packaging units.
Factors Share of Residues on Gross Packaging Waste Weight (Mass %)Share of Residues Contained Packaging Units on Total Packaging Units (Mass %)Average Residues in g per Packaging Unit Containing Residues (g/Unit)Average Residues per Packaging Unit (g/Unit)
Collected Rigid PETPET total3.9811.021.92.4
Food bottles12.1113.535.04.7
Nonfood bottles4.0520.114.93.0
Food monotrays1.507.611.20.8
Nonfood monotrays1.4925.015.73.9
Sorted Rigid
PET
PET total0.713.516.80.6
Beverage bottles0.953.717.20.6
Food bottles0.905.216.30.8
Nonfood bottles0.602.316.70.4
Food monotrays0.552.618.90.5
Nonfood monotrays0.5118.24.50.8
Table 4. Comparative studies concerning rigid PET packaging waste in Austria from 2013 until 2020. The recycling rate (rr input) is based on the gross sorting volume and therefore represents the sorting rate (SR). Values in the columns “present study” and “present study revised” represent the net input material amount into the recycling process. * “PET others” in the present study includes beverage bottles contained in the mixed PET sorting stream.
Source Van Eygen et al. [7]Packforce
[30]
WKÖ
[38]
Present StudyPresent Study
Revised
Reference Year20132019202020202020
MarketPET bottlesgrosstons45,487 39,368-53,263
PET beverage
bottles
41,40038,80028,751-38,898
PET others11,21719,600 26,323-35,61415,706-21,249
PET total56,70461,000 55,074-74,51255,074-74,512
SortingPET bottlesgrosstons24,493 27,070-36,623
PET beverage
bottles
23,06122,74819,725-26,687
PET others14423495 10,796 *-14,606 *3451-4670
PET total25,93526,556 30,521-41,29330,521-41,293
Recycling
input
PET bottlesnettons 23,823-32,232
PET beverage
bottles
17,425-23,576
PET others 9611 *-13,004 *3183-4306
PET total 27,037-36,57927,006-36,538
PET bottlesweight-%54 61
PET beverage
bottles
565961
PET others1318 3720
PET total4644 4949
Disclaimer/Publisher’s Note: The statements, opinions and data contained in all publications are solely those of the individual author(s) and contributor(s) and not of MDPI and/or the editor(s). MDPI and/or the editor(s) disclaim responsibility for any injury to people or property resulting from any ideas, methods, instructions or products referred to in the content.

