1. Introduction
Environmental degradation and climate change have been a vital concern for the world since the 1990s after the Rio 1992 and Kyoto 1997 UN conferences. The conference is the starting point for policies about the environmental effects of sustainable development. The Kyoto Protocol’s goal was to bring greenhouse gas (GHG) emissions down to 1990 levels between 2008 and 2012. Environmental deterioration, global warming, and climate change are interconnected [
1,
2,
3].
According to [
4], two direct reasons for environmental degradation are energy consumption and energy production. These two factors are closely related to economic activities and urbanisation, as well as their management sphere. One of the consequences of urbanisation is increasing energy consumption and, further, environmental degradation. Turkey is one of the countries which has a long urbanisation history. Population in urban areas was 15% in 1937, then reached 45% in 1975 [
5], and in 2021, it was 93.2% [
6]. These data are the main evidence of urbanisation in Turkey. It is well-known that urbanisation increases industrial output and energy consumption. It has occurred the same in Turkey, and the increasing energy consumption caused environmental degradation in big cities.
In this paper, we investigate two models using two different theories on the relationship between climate change and urbanisation. The two theories are STIRPAT (stochastic impacts by regression on population, affluence, and technology) and the EKC (environmental Kuznets curve). STIRPAT was developed by [
7], and the EKC was developed by [
8]. In the literature, various models are developed on the variables affecting CO
2 emissions, such as the Laspeyres method [
9] and the LMDI method [
10].
The paper is organised as follows.
Section 2 presents the literature review. The theoretical model is introduced in
Section 3.
Section 4 reveals the empirical analysis, data, and unit test.
Section 5 presents the results and the discussion of the results, while
Section 6 provides the conclusions, limitations, and policy recommendations.
2. Literature Review
There is much literature on these connections between environmental degradation, economic growth, and management, such as [
11,
12,
13,
14,
15,
16,
17,
18], and urbanisation and environment/climate change, such as [
11,
19,
20,
21,
22,
23].
The STIRPAT model is the extended model of the proposed IPAT model [
9]; Ref. [
10] extended it and reached the IPBAT model after the IPBAT model and [
11] extended it and reached the STIRPAT model. The IPAT, IPBAT, and STIRPAT models aim to explain factors that affect the environment, capture behavioural choices’ effects, and estimate causal effects between the driving forces, respectively. The IPAT model is a straightforward conceptual representation that links various drivers to environmental impact and is inappropriate for direct use to determine the individual factors [
12]. Ref. [
11] aims to solve the lack of individual determining features of the IPAT model and developed STRIPAT, which is a stochastic version of IPAT. Different techniques have been used to estimate the STIRPAT model, e.g., the common correlated effects mean group estimator (CCEMG) of [
24], the augmented mean group (AMG) estimator of [
25], and the kernel-based regularised lease squares estimator [
24,
25].
The EKC hypothesis [
13] assumes that the dependent variable CO
2 in its model is affected by the independent variable GDP and other control variables, which explains an inverted U-shaped relationship between environmental quality and economic development. The researchers investigate this relationship, whether it is U-shaped, N-shaped, or V-shaped.
The EKC has enormously wide literature, and the STIRPAT model has less fame compared to the EKC. That is why there are many articles on the EKC for Turkey but few on the STIRPAT model. At first, considering the EKC literature of Turkey, we split the papers into two categories: papers showing that the EKC is valid in Turkey and papers showing that the EKC is not valid in Turkey. The papers which find that the EKC is valid in Turkey are [
14,
15,
16,
17,
18,
19,
20,
21,
22,
23,
26]. The papers which find EKC is not valid in Turkey are [
24,
25,
27,
28,
29,
30,
31,
32].
Similar to our paper, there are two papers [
33,
34] that investigate both STIRPAT analysis and the EKC for Turkey. Additionally, ref. [
34] states that this paper is the first paper on these topics for Turkey, but based on our literature survey, the first is [
33]. However, these two pieces of research are similar to our paper based on the theories they used. They combine two theories and estimate one model, but in our paper, we estimate the model for each theory. Ref. [
33] uses ecologic footprint (EF) as the dependent variable in the EKC model and finds that GDP has a positive and its square has a negative impact on EF; therefore, the relation is in an inverted U-shape in the long-run and short-run relationship. (Çağlar, 2022) uses CO
2 emissions per capita and finds an inverted-U shape for Turkey, which is consistent with [
33].
Ref. [
35] estimated the VEC model and used the Johansen cointegration method for STIRPAT analysis of Turkey for the 1970–2013 period. They find a long-run relationship between CO
2 emissions and affluence, population, technology, urbanization, financial development, and globalization. Except for financial development, all the variables have an increasing effect on CO
2 emissions in the long run, and short-run dynamics are valid in the model. Another paper that investigates the validity of the STIRPAT model for Turkey is [
36], which uses panel data methodology for ten newly industrialized countries (NICs), one of which is Turkey. The empirical analysis consists of a dynamic common correlated effects estimator (DCCE), fully modified ordinary least square (FMOLS), and dynamic ordinary least square (DOLS). DCCE shows that all the independent variables (population, affluence, technology, energy intensity, urban employment, and energy mix) have a significant impact on CO
2 emissions. The general results show that for the NIC’s population, GDP per capita is the main reason for CO
2 emissions. Ref. [
37] conducted the quantile regression methodology implemented within the STIRPAT model structure for 154 countries’ data, one of the countries being Turkey. They used ecological footprint per capita as a dependent variable and found that GDP per capita and the financial development index have a positive impact on population, and services negatively impact ecological footprint. Ref. [
36] presents a literature review on the extended STIRPAT model, with CO
2 as the dependent variable, and summarizes the direction of the variables, which are P (population), A (affluence), and T (technology). Refs. [
38,
39,
40,
41] find positive P (population) and A (affluence), and positive T (technology); Refs. [
42,
43,
44,
45] find positive P (population) and A (affluence), and negative T (technology), and [
46] finds negative P (population) and A (affluence), and positive T (technology) in their STIRPAT model.
In this paper, we aim to use the ARDL and DCC models to investigate the validity of the STIRPAT model and the EKC hypothesis in Turkey. The EKC model is a widely investigated topic in economics and management, especially in the energy economics area. Ref. [
47] is the first paper to examine the EKC theory for Turkey and discover an inverted U-shaped curve. Additionally, there are broad literature sources on Turkey on the EKC [
32,
33,
34,
35,
36,
37,
38,
42,
43]. The literature has contradictory results; while [
48,
49] find an N-shaped relationship, Ref. [
50] finds an invalid EKC relationship for Turkey. Ref. [
30] uses instead of carbon emissions, the ecological footprint as a proxy for environmental degradation, and confirmed the EKC hypothesis for Turkey from 1961 to 2013. STIRPAT does not have as many literature achievements compared to the EKC results. Ref. [
51] finds that emissions have achieved a reduced level of prosperity in Turkey during 1990–2015 using the STIRPAT model. Ref. [
35] finds that there is a cointegration among the variables in the STIRPAT model in Turkey.
This paper has some contributions to the literature. First, we use both the EKC and STIRPAT model, which are the theories of environmental degradation, by including the urbanization variable. Second, to estimate the relationship, we use two different kinds of models: The ARDL bound approach and the DCC-GARCH approach.
3. Theoretical Model
We mentioned the development steps of the STIRPAT model in the previous section. The model starts with the following Equation (1), which is developed by [
52]:
where
presents the environmental impact,
presents population,
presents affluence or consumption per capita, and
presents technology or impact per unit of consumption. Ref. [
7] extends the IPAT model to the STIRPAT model and indicates the model in exponential form as follows:
where
,
and
are exponent terms of P, A, and T, respectively, and
is the error term. If we take the logarithm of both sides of Equation (2), we will reach Equation (3):
At last, if we change the variables I to COE (carbon dioxide emission), P to URB, A to Y, and T to E, we will have Equation (4):
where COE is a proxy for CO
2 emissions, URB is urbanisation, E is energy components, Y is per capita GDP, and finally, e is the residual error term. Following [
16,
53,
54], we add international trade (TR) as a proxy for the degree of openness, foreign direct investment (FDI), and for energy components, total energy supply (ES), total final consumption (FEC), and environmental and resource productivity (energy productivity)(EP). Therefore, (4) will take (5), as follows, by showing the logarithm by L:
Another hypothesis is the environmental Kuznets curve (EKC). The EKC is a hypothesis that explains an inverted U-shaped relationship between environmental quality and economic development. It means that per capita income increases, and the degree of environmental degradation also increases until the turning point. After the turning point, environmental degradation begins to decline. The EKC investigates the relation between the relative levels of environmental damage and the GDP per capita [
53]. By using the variables we select, the EKC can be written as follows (L shows the logarithm of the variables):
We aim to test the three forms (level, quadratic, and cubic) of per capita GDP in the model. The coefficients of the three forms of GDP per capita determine the relationship between environmental quality and economic growth. If , , and , it is described as an inverted U-shaped curve.
5. Results and Discussion
The ARDL bound test is a test for cointegration between variables that integrates different orders less than I(2), and the bounds test can be employed for all the cases, provided none of the series is beyond I(1). We tried many different lags for the ARDL model, and the results show that the ARDL (1,0,0,0,2,0,1) is the best-fit model.
Table 4 shows the long-run coefficient of (4) or the STIRPAT model. The ARDL (1,0,0,0,2,0,1) is the best-fit model for our model. Using CO
2 emissions as a dependent variable, the coefficient of GDP per capita, EP, FEC, and URB are statistically significant, but FDI and TR are not significant. The EC
t-1 term is in the acceptable range, which is −2 to 0, and F-bound is 39.60, which is the upper bound of 1% of 3.99, indicating that the variables are cointegrated and there is a long-run relationship among the variables. The coefficient of Y is positive, which indicates that economic activities are caused by
emissions and environmental degradation in Turkey. The total final energy consumption coefficient is 1.17 and positive, the largest coefficient among the factors which have caused environmental degradation. Urbanisation has a negative impact.
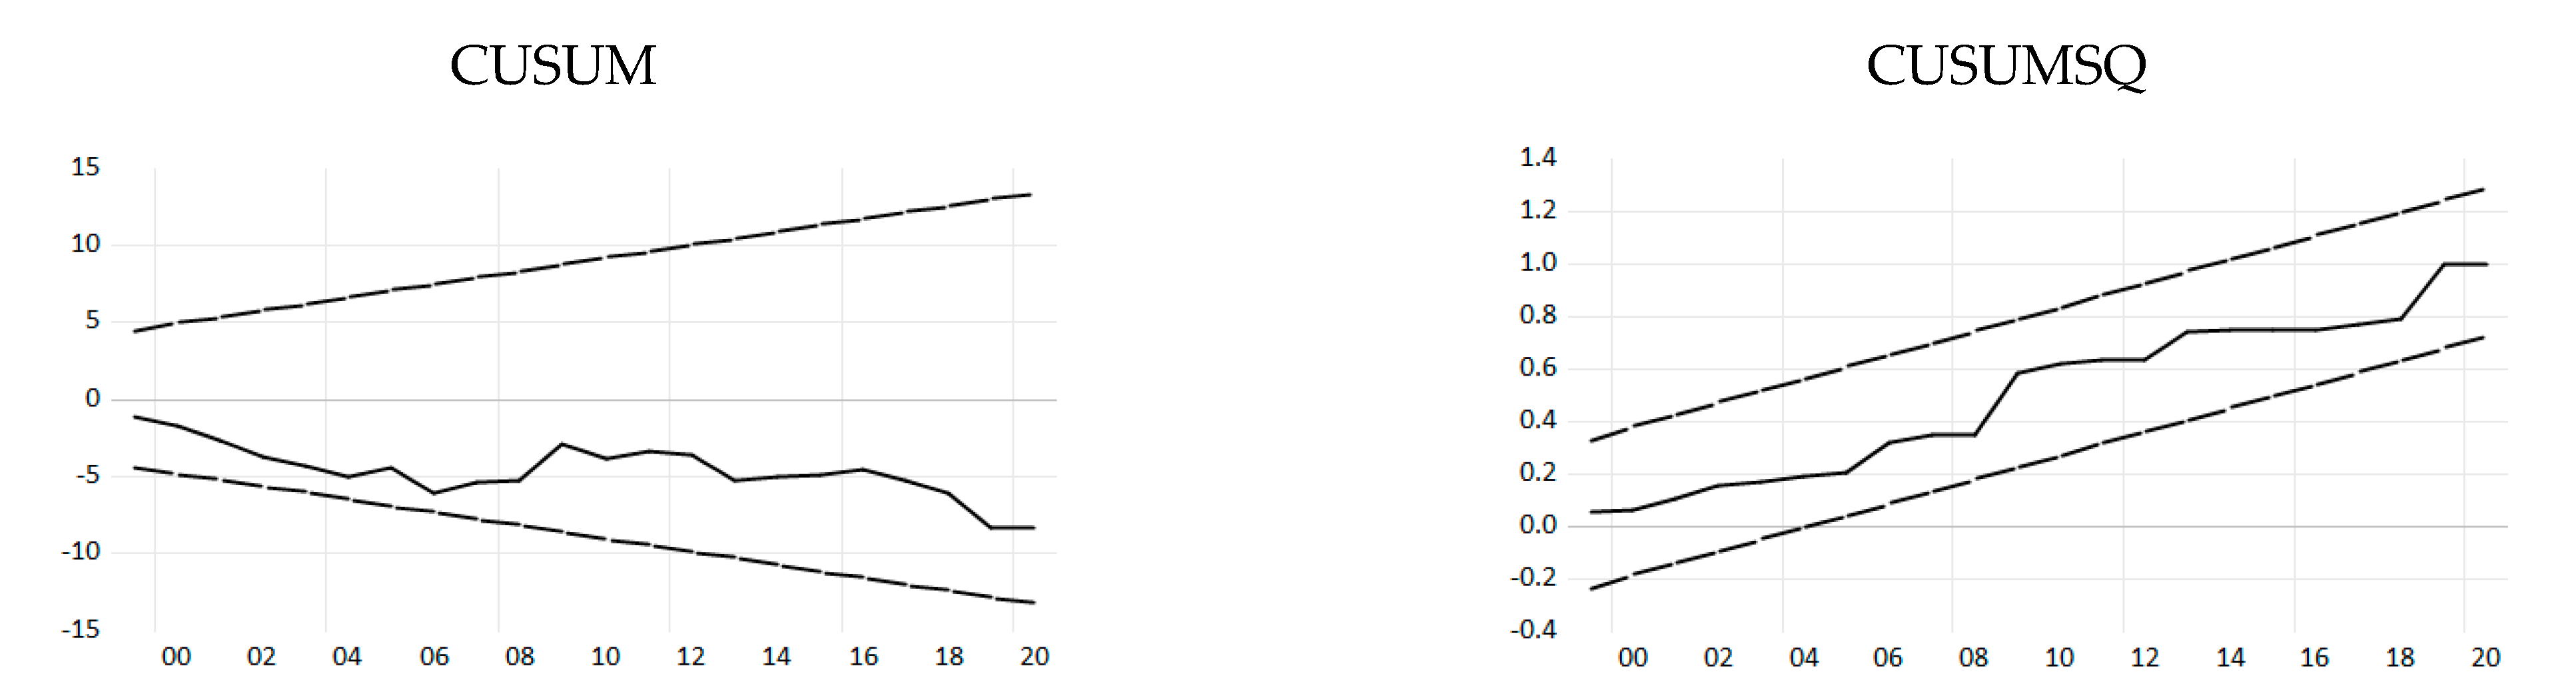
Residual diagnostics of the ARCH test show that the null hypothesis of homoscedasticity cannot be rejected; therefore, we do not have heteroscedasticity in the two models. The serial correlation (LM) test shows there is no problem regarding the autocorrelation problem. The CUSUM and CUSUMSQ tests are stable in the full period for both models (see
Appendix A). Therefore, the estimated model is stable and has a long-run relationship between variables. In the next step, the EKC model helps us to understand the functional form of this GDP on emissions. Therefore, we rewrite our EKC model (7):
In the model,
and
are the squared and cubic terms for real GDP per capita. For recognising the shape of the EKC, the signs of the
,
, and
should be examined. Based on the revised EKC scenario [
72,
73], the coefficients are significant, and the result will be
> 0,
< 0, and
. Thus, the turning point of
means there is a linkage between the later development of the economy with lower pollution. In the N-shaped hypothesis, the significant coefficients
> 0,
< 0, and
> 0 need to be justified.
> 0,
< 0, and
are insignificant and the N-shaped hypothesis fails to be supported, but the conventional EKC is confirmed. In case both
and
are insignificant, then the validity of the EKC cannot be confirmed. The coefficient of energy consumption (
) is expected to be
> 0. The signs of
and
are unclear due to their mixed effects on the environment. Each of them can be either positive or negative [
73].
We find a significant relationship between GDP, URB, and FDI, which is consistent with [
35,
36,
37]. Although the direction of the coefficients of urbanization is generally positive in previous articles, we found that urbanization has a negative effect in our research, which is similar to [
35]. Consistent with [
33,
34,
35,
36,
37], GDP increases the values of the variable and it is different in each paper, which shows environmental degradation in the models. In our STIRPAT model, P (urban population) is negative and A (affluence) is positive, which is consistent with [
46], and T (technology) (EP is used as a proxy of technology in this paper) is negative, which is consistent with [
42,
45].
The results of the ARDL bound test of (6) are summarized in
Table 5.
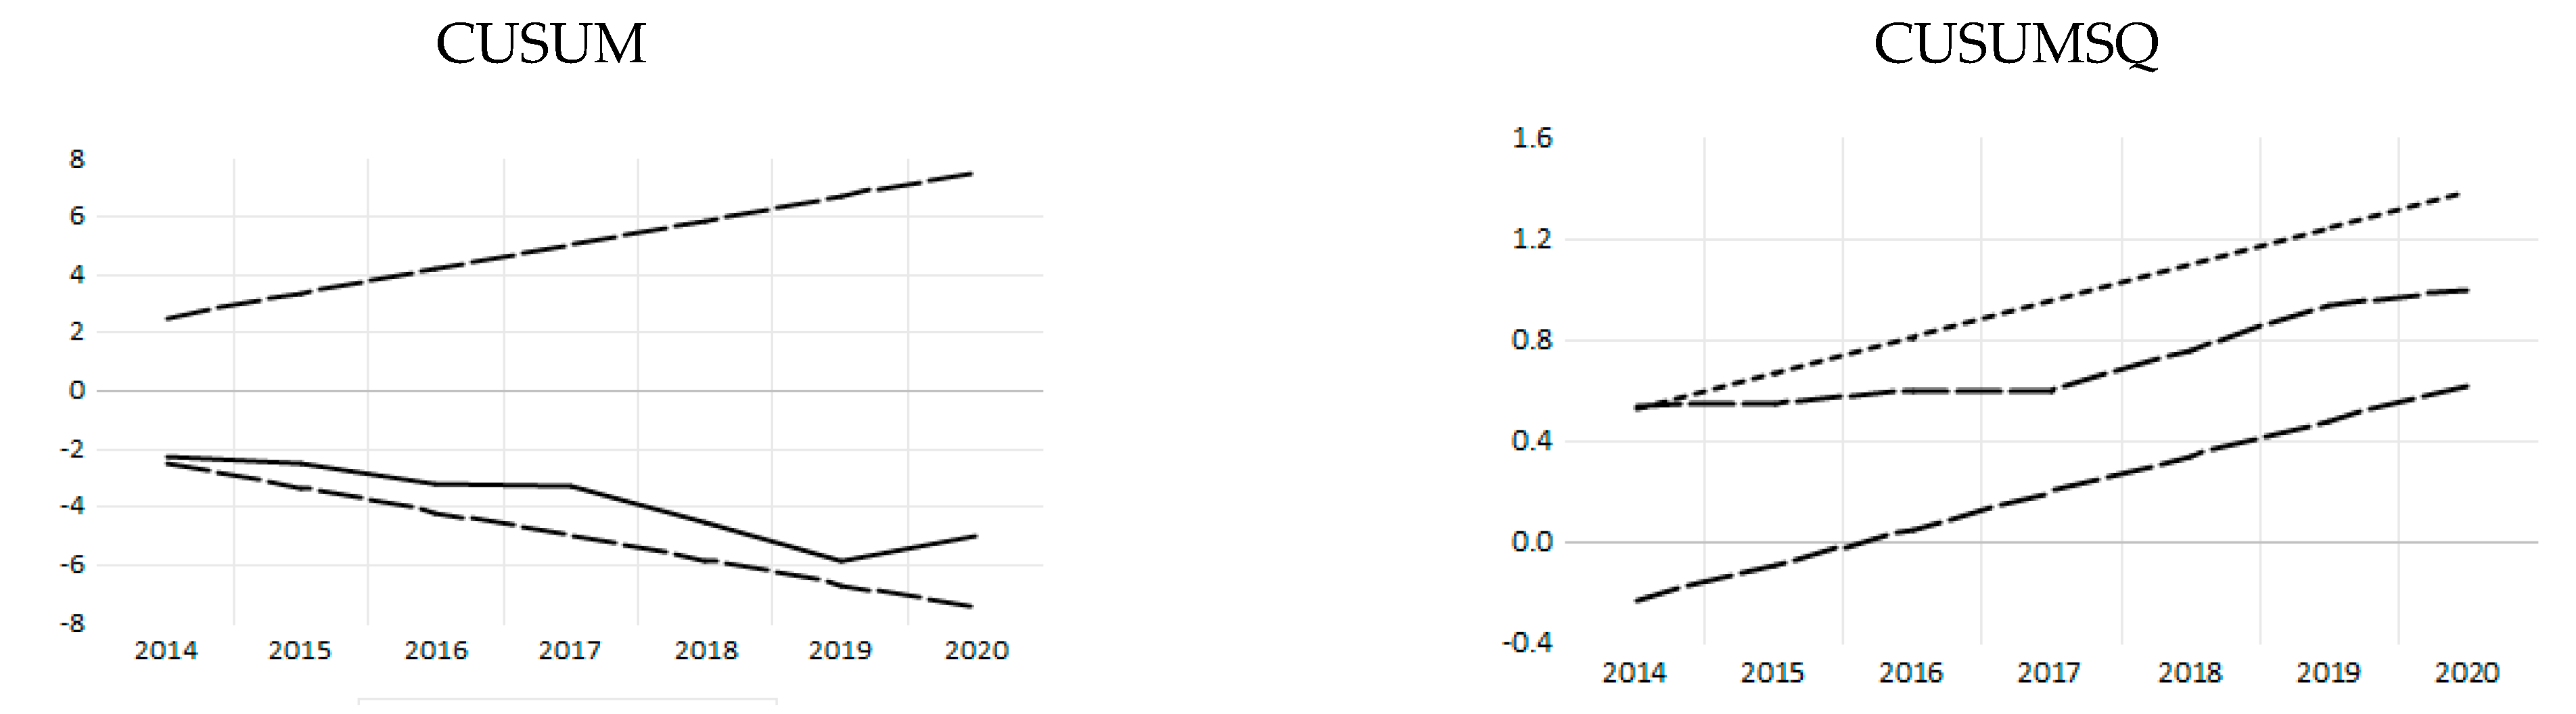
Table 5 shows the long-run coefficient of the (6) EKC hypothesis. The error terms are −1.27 and they are statistically significant. According to the CUSUM and CUSUMQ tests (
Appendix B), the model is stable, and the important variables, such as Y components, are statistically significant, and in the model
> 0,
< 0, and
> 0. Therefore, the N-shaped environmental Kuznets curve (EKC) hypothesis is confirmed. Similarly, in the STIRPAT model, the coefficients of energy consumption and economic activities are positive and statistically significant, which means both have a significant effect on environmental degradation. Our results are consistent with previous studies, such as [
28,
74,
75,
76,
77], which fund an N-shaped Kuznets curve as well.
In this section, we analyse the relationship between economic activities and the environment of Turkey’s indicators. Based on [
30,
35,
51], resources, and availability of data, we select emissions of carbon dioxide (CO
2), economic growth, and environmental and resource productivity (energy productivity) in Turkey using dynamic conditional correlation multivariate GARCH (DCC-EGARCH(1,1)) [
52] for the period between 1990 and 2021, which reflects investing levels of renewable energy and the impact of economic activities on emissions of carbon dioxide in Turkey. According to the theoretical framework, the testable model is taken as follows:
The dynamic conditional correlation multivariate GARCH (DCC_GARCH) model is defined by [
78]. Conditional correlation between two random variables is shown with
as follows:
where
and
show two random variables. Conditional correlation lies between −1 and +1, the same condition of a correlation coefficient. Following [
55,
79], we set a multivariate GARCH model allowing for time-varying correlation as follows:
where
and A(L) is a matrix in the lag operator L,
is the vector of innovation, which follows the conditional variance–covariance matrix, and
At last, H is defined as follows:
where
for I, and j = 1, 2 is a symmetric positive definite matrix with
, i is the correlation matrix containing conditional correlation coefficients, and
, which contains the time-varying standard deviational from univariate GARCH models. The univariate GARCH (p, q) process is as follows:
Table 6 presents the dynamic conditional correlation model estimation results.
Based on the results of the estimation of the DCC model in
Table 3,
and
of the DCC model are non-negative, and their sum
) is less than one
.
in the DCC model shows the effect of the conditional correlation of the previous period on the conditional correlation of the current period, which in our case is
. A larger
indicates that conditional correlations of the current period will be close to the conditional correlations of the previous period.
Since the probability value related to the Hosking, Li, and McLeod test on the standardised residuals is greater than 0.05, there are no autocorrelation and heteroskedasticity problems in the estimated models, and the models are relevant.
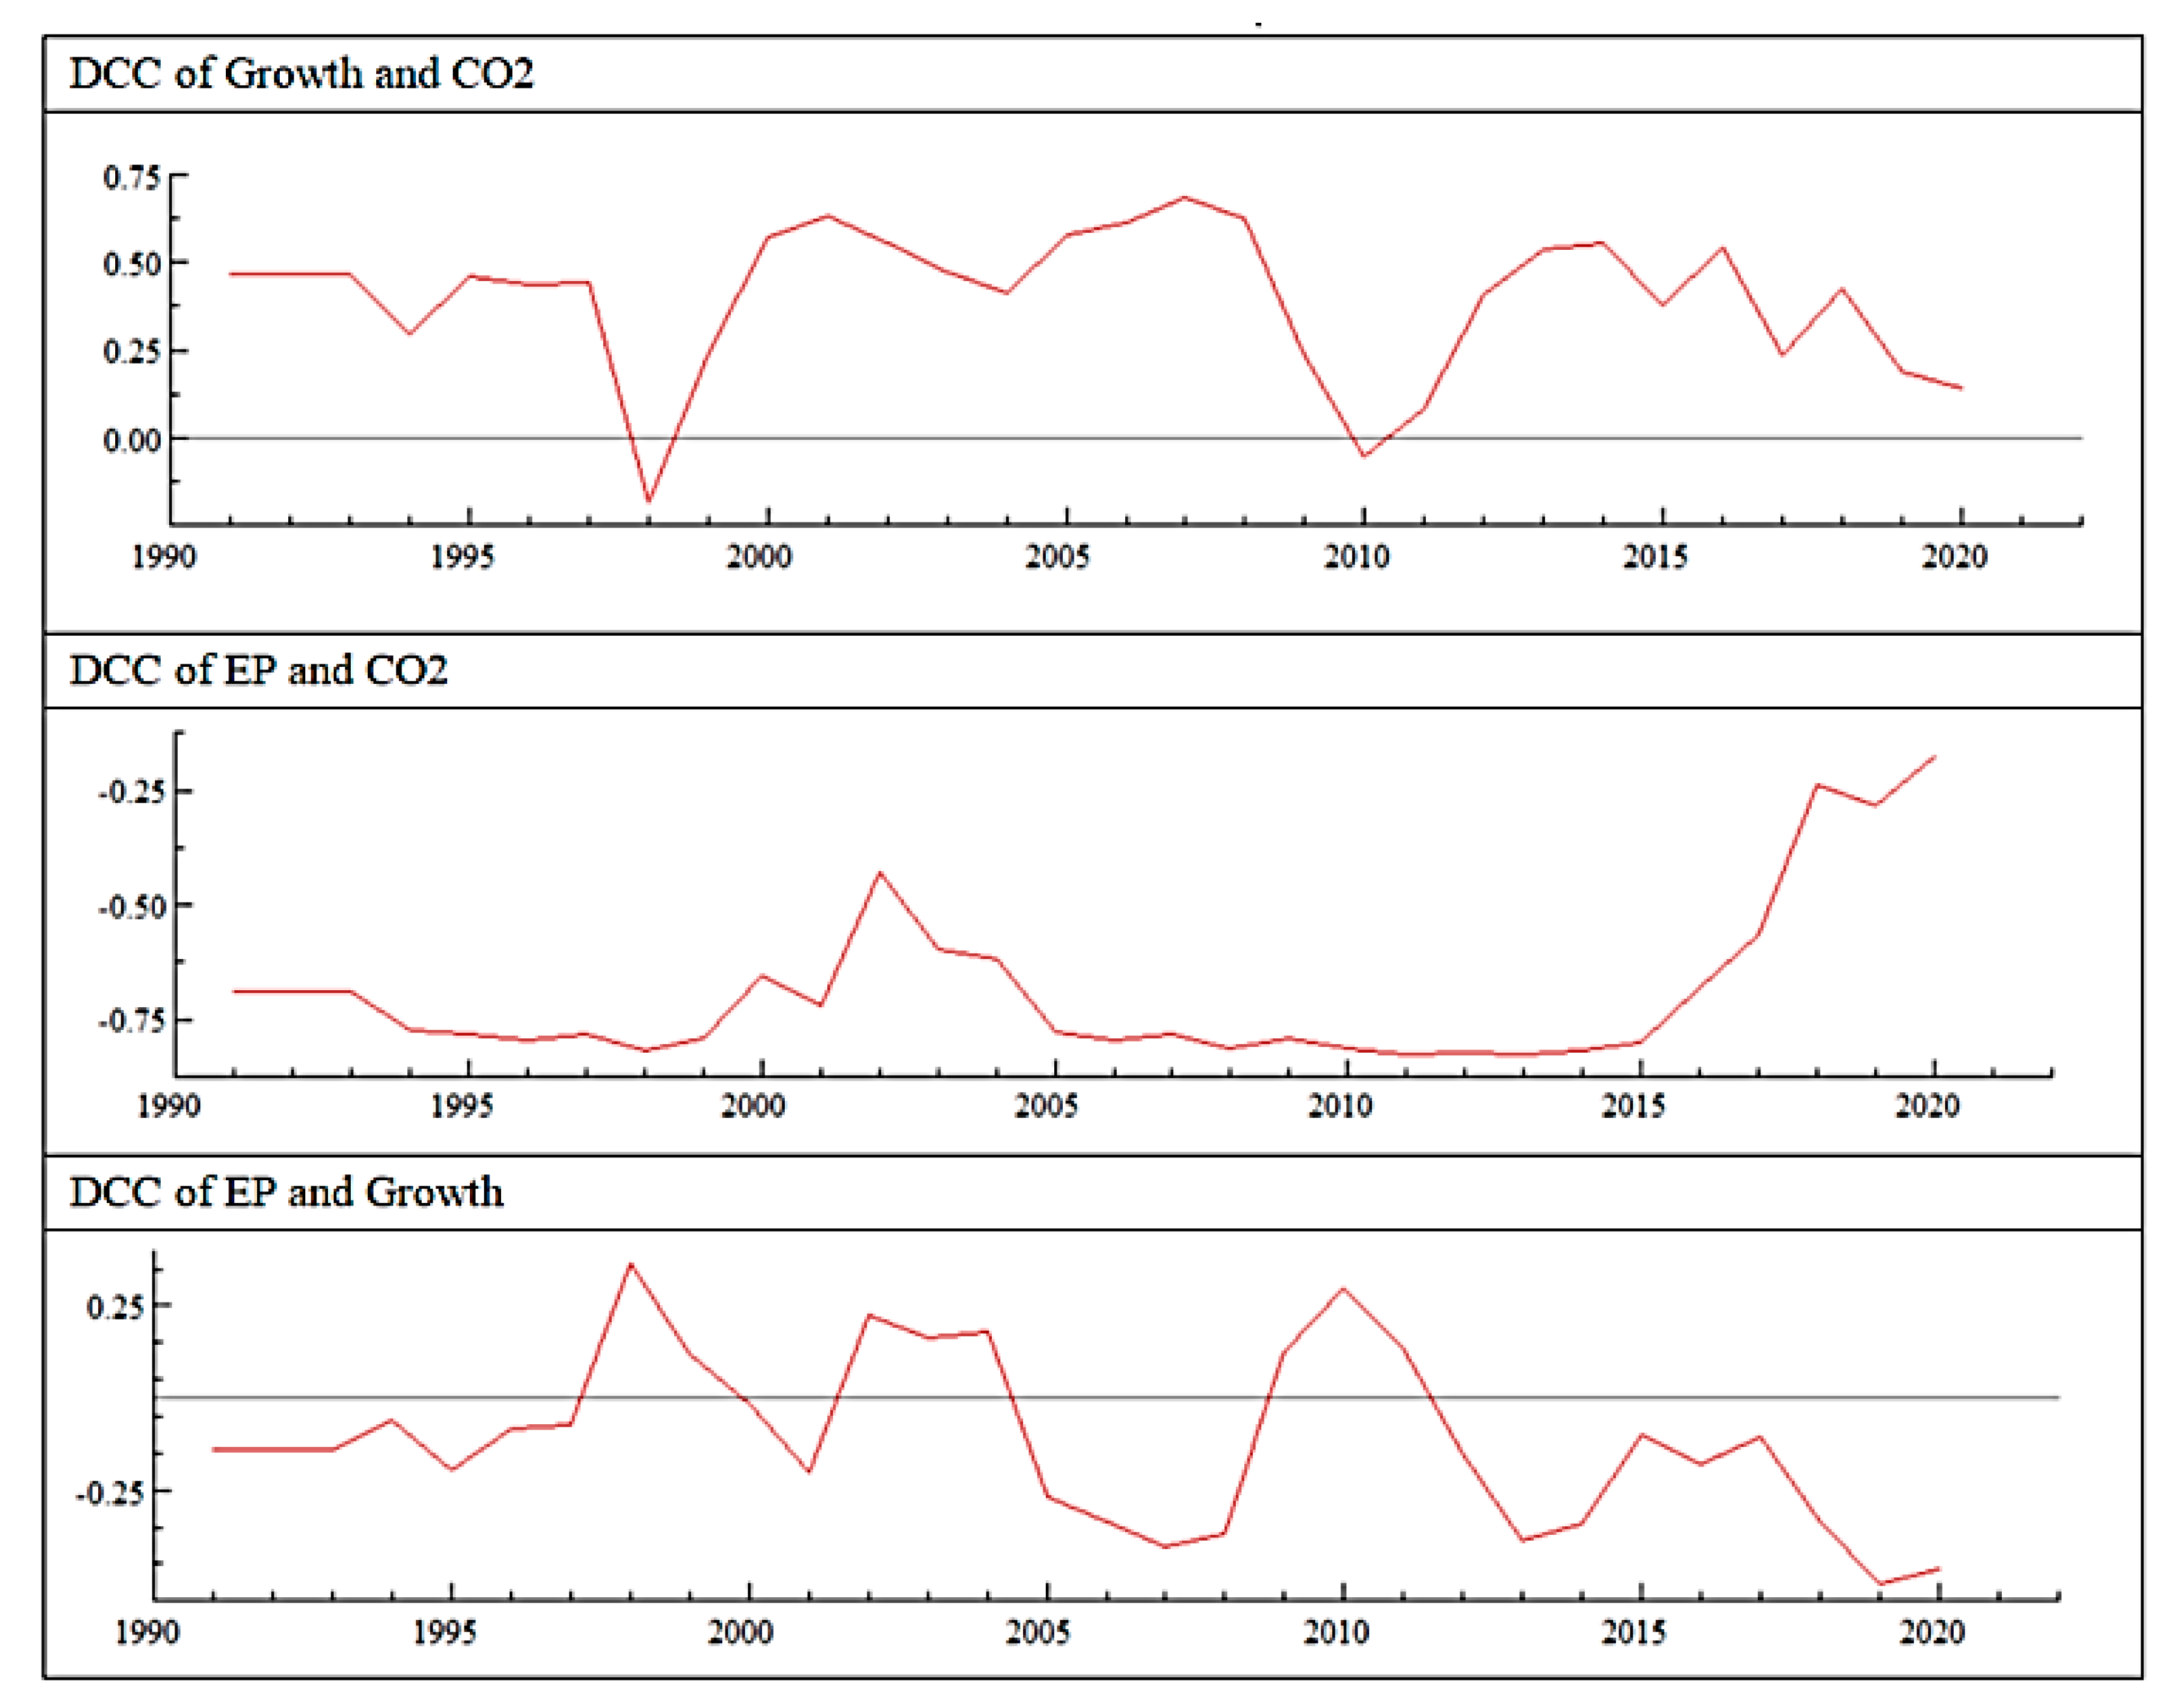
Figure 1 shows the dynamic condition correlation between CO
2 emissions, economic growth, and environmental and resource productivity in Turkey.
Figure 1 illustrates that by the improvement of investments in environmental and resource productivity to energy productivity, the CO
2 emissions have shown a negative response. These results are consistent with the findings of [
16,
33,
53,
55,
70].
As seen in
Figure 1, there is a distinct dynamic conditional correlation to alter in response to a time change and a positive DCC between economic growth and CO
2 emissions in the whole selected period, except for the short term in late 1997, and only one dot is negative in 2010. In the case of CO
2 emissions and environmental and resource productivity, there is a full and strong negative DCC between CO
2 and environmental resource productivity. There is a positive DCC between environmental and resource productivity and growth in 1997–1999, 2002–2004, and 2009–2011. In contrast, the relationship is mainly negative, showing that increased growth was affected negatively when inverting environmental and resource productivity. Nevertheless, at the end of 1997 and from 2009 to 2011, when carbon dioxide had a negative relationship with economic growth, economic growth and environmental and resource productivity had a positive relationship. We find that final energy consumption is the most important factor that has caused environmental degradation in Turkey. This result is consistent with related theories that the European Environmental Agency emphasizes. Additionally, we find that economic activities have an important role in environmental deregulation in Turkey, which is consistent with the EKC hypothesis.
6. Conclusions
In this paper, the contribution of the driving forces to economic activities and CO2 emissions was tested for Turkey by employing the STIRPAT and EKC models.
In this context, we investigated the long-run relationship between CO2 emissions, economic activities and management, energy consumption components, urbanization, and sustainable development. We estimated three hypotheses and methodology using the ARDL bound test and the DCC model over the period between 1980 and 2021.
In the STIRPAT case of the analysis, there is a long-run relationship among variables of the STIRPAT model that confirmed the results of the EKC. The coefficient of income and energy consumption affected CO
2 emissions positively, which means that energy consumption and the expansion of economic activity have a significant effect on environmental degradation, which is consistent with [
42]. According to the EKC estimation, there is a long-run relationship between variables and energy consumption. Economic activities and management have the main effect on CO
2 emissions, which leads to environmental degradation in Turkey. Additionally, in the EKC analysis, we find the N-shaped curve.
After obtaining these results, we aimed to understand clearly the impact of energy production and economic activities and the management of CO2 emissions. Therefore, we applied the DCC model. The results of the DCC model indicate that there is a distinct dynamic conditional correlation to alter in response to a time change. Additionally, we find a positive DCC between economic growth and CO2 emissions in the whole selected period, except for the short term in late 1997; it became negative in 1997 and then reached positive values again in 2010. In the case of CO2 emissions and environmental and resource productivity, there is a full and strong negative DCC between CO2 and environmental resource productivity. Hence, if the government invests in energy productivity, it can prevent environmental degradation by reducing economic activities that cause carbon dioxide emissions and manage the economy based on environmental concerns.


