
Assessment of Energy and Heat Consumption Trends and Forecasting in the Small Consumer Sector in Poland Based on Historical Data

 ,
,  ,
,  ,
,  and
and 
Abstract
:1. Introduction
2. Literature Review
2.1. The Strategic Direction to Reduce Emissions in European Policies
2.2. Households as Energy Consumers in the European Policies
2.3. Active Small Consumers in the Energy Market
2.4. Small Consumer in the Industry 4.0 and Smart Cities
2.5. Trends and Developments in the Small Consumer Market
- –
- saving energy and heat by investing in technologies that provide energy from renewable sources (own renewable energy and heat sources),
- –
- the need to purchase boilers that reduce CO2 emissions (certified boilers),
- –
- thanks to the internet and new “smart” technologies, citizens’ access to information and services in a diversified energy and heat market is increasing,
- –
- solutions offered by energy technology and transmission network service providers are increasingly personalized, and
- –
- legal protection of consumer rights.
- –
- market liberalization and high prices for energy and fuels produced from coal [79],
- –
- increased demand for renewable energy (transitioning towards clean energy and a low-carbon/zero-carbon economy by 2050) [80],
- –
- increasing climate awareness of consumers,
- –
- increased share of distributed energy sources in the total market,
- –
- consumers’ access to various forms of energy and heat savings,
- –
- increased proportion of network usage charges and taxes, and in particular additional charges in the final household electricity and heat bills [81], and
- –
- houses and network modernization and infrastructure investments using smart technologies [82].
3. Materials and Methods
3.1. Background
3.1.1. Emissions in the Economy
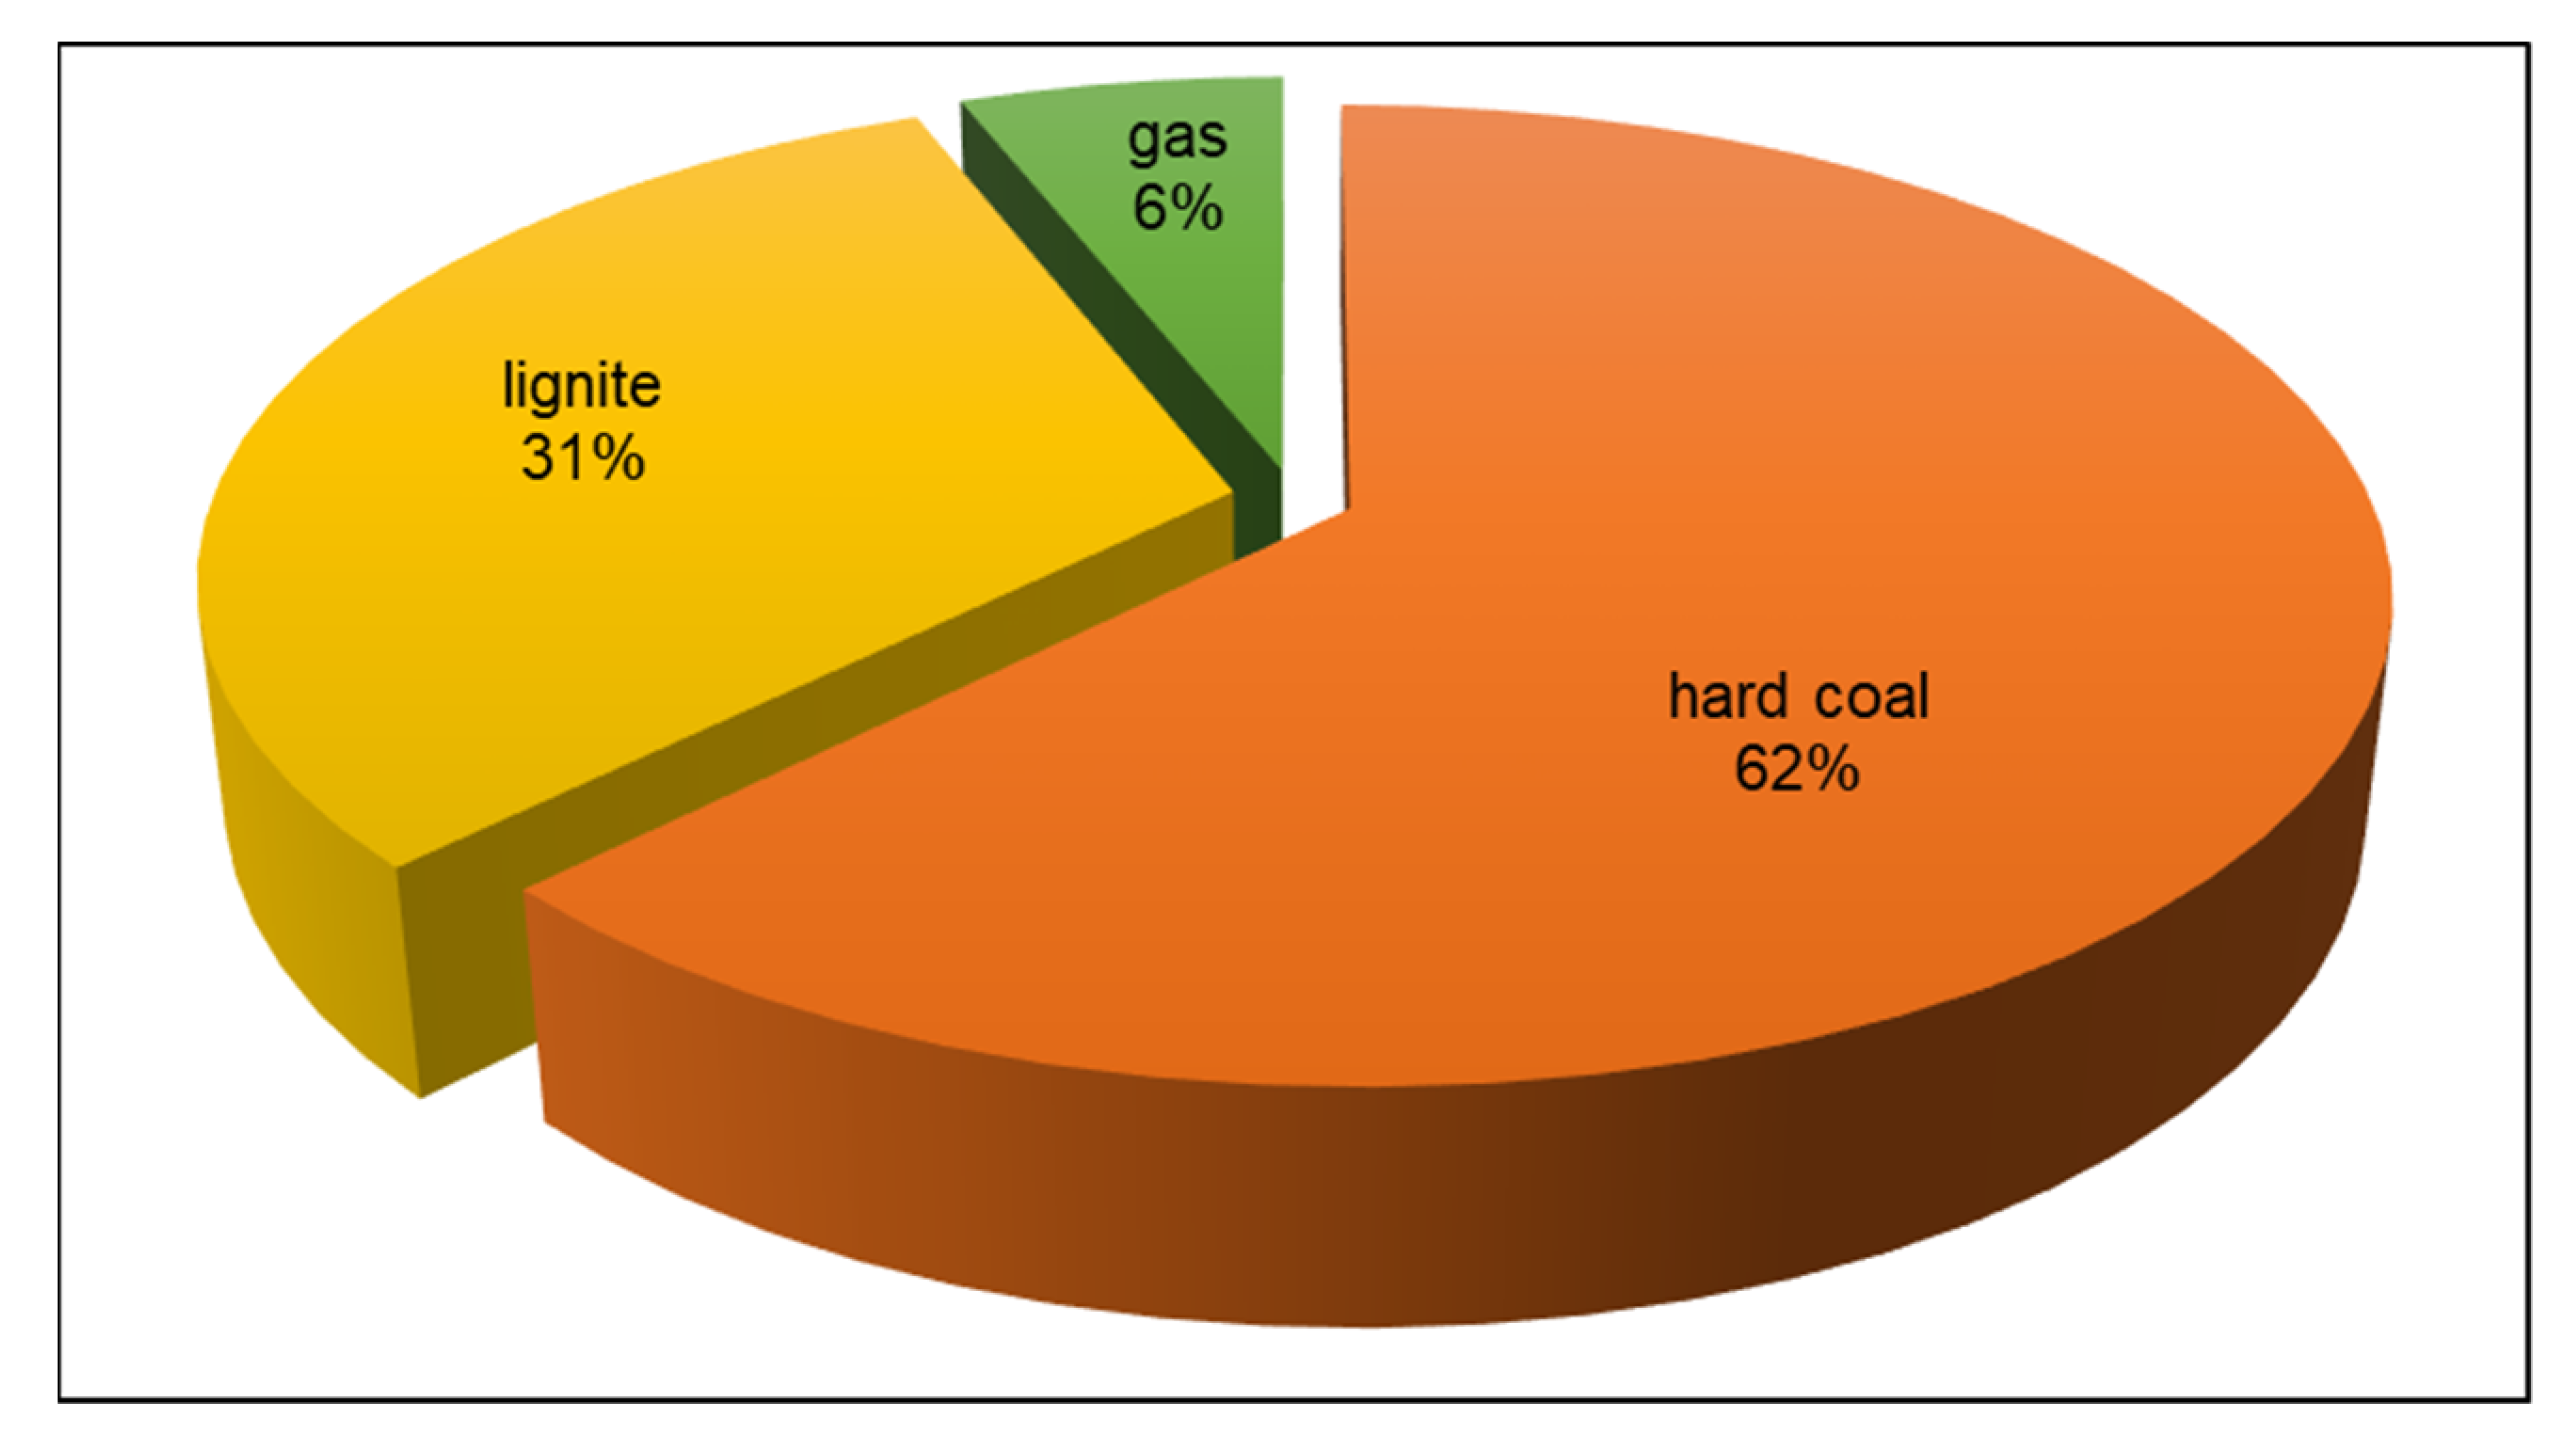
3.1.2. Sources of Electricity in Poland
3.1.3. Challenges of the Polish Energy Policy
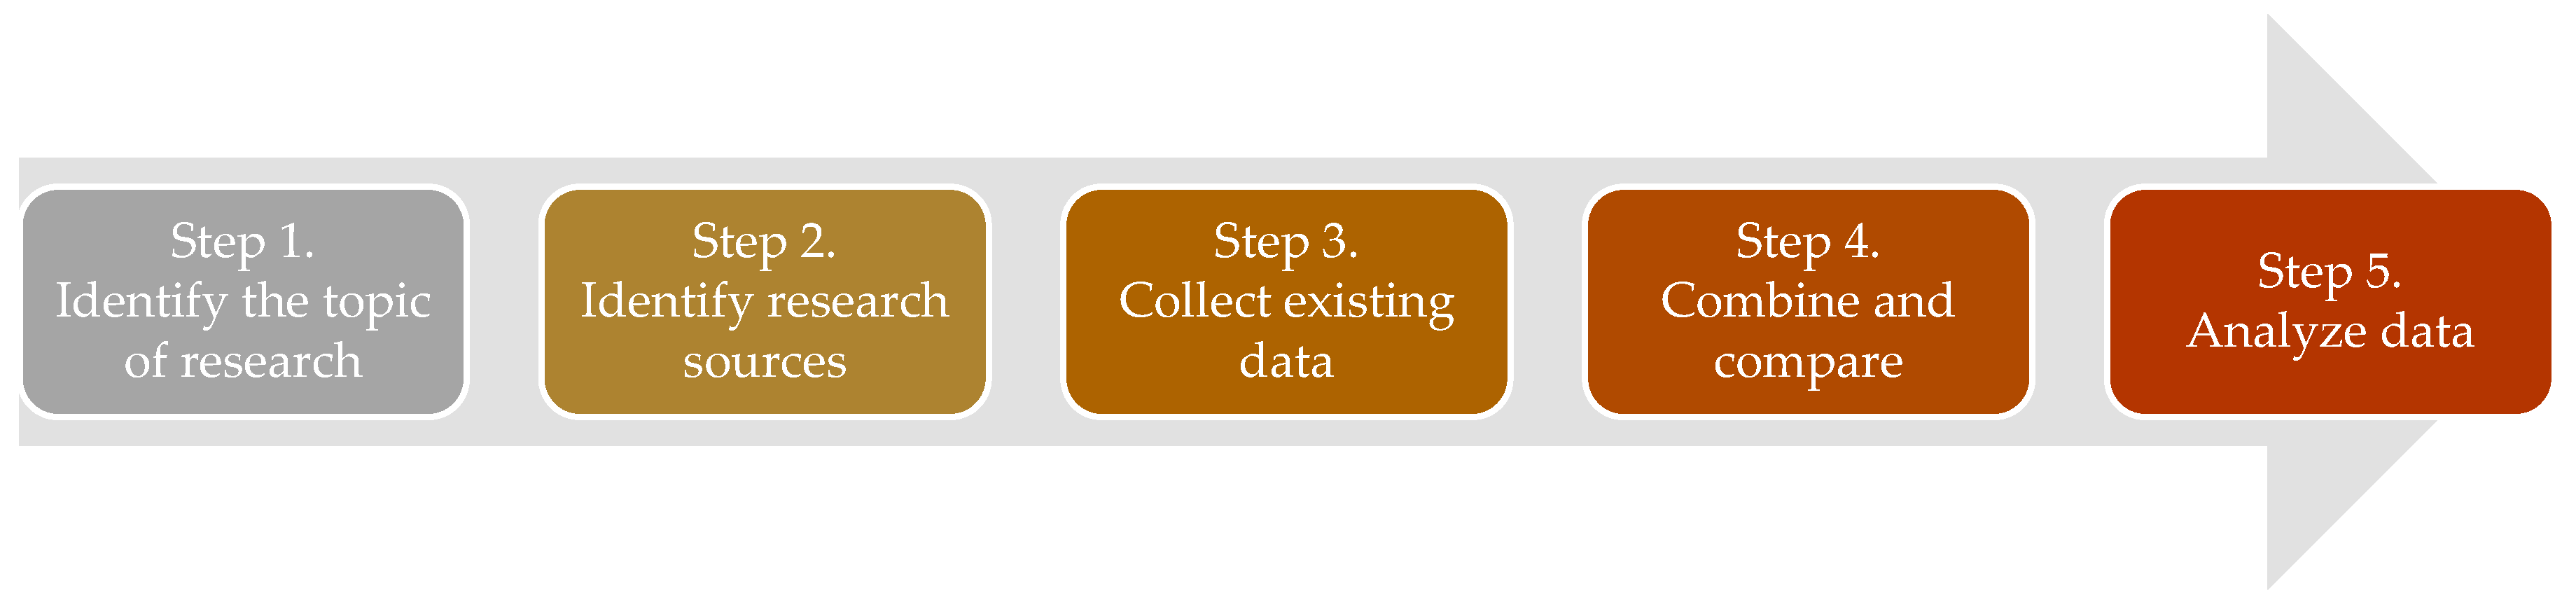
3.2. Steps of the Analysis and Data
3.3. Limitations of the Paper
4. Results of the Analysis
5. Discussion
6. Conclusions
6.1. Summary of the Research
6.2. Future Research
Author Contributions
Funding
Data Availability Statement
Conflicts of Interest
References
- European Green Deal. Komunikat Komisji do Parlamentu Europejskiego, Rady Europejskiej, Rady, Komitetu Ekonomiczno-Społecznego i Komitetu Regionów, Bruksela 11 December 2019, COM(2019)640 Final. Available online: https://eur-lex.europa.eu/legal-content/pl/TXT/?uri=CELEX%3A52019DC0640 (accessed on 15 June 2021).
- Clean Energy for All Europeans—Unlocking Europe’s Growth Potential. IP_16_4009. European Commission, Brussel, 2016. Available online: https://europa.eu/rapid/press-release_IP-16-4009_en.htm (accessed on 15 April 2023).
- European Comisssion. Komunikat Prasowy; Czysta Energia dla Wszystkich Europejczyków, Czyli Jak Wyzwolić; European Comisssion: Brussels, Belgium, 2016. [Google Scholar]
- Potencjał Wzrostu Europy, Bruksela 30 November 2016. Available online: https://ec.europa.eu/commission/presscorner/detail/pl/ (accessed on 15 March 2023).
- Porozumienie Paryskie do Ramowej Konwencji Narodów Zjednoczonych w Sprawie Zmian Klimatu, Sporządzonej w Nowym Jorku Dnia 9 Maja 1992 r., Przyjęte w Paryżu Dnia 12 Grudnia 2015 r., Dz.U. 2017, poz. 36. Available online: https://isap.sejm.gov.pl/isap.nsf/DocDetails.xsp?id=WDU20170000036, (accessed on 15 April 2023).
- OECD. Greening Household Behaviour. The Role of Public Policy. 2011. p. 22. Available online: http://www.oecdilibrary.org/environment/greening-household-behaviour_9789264096875-en (accessed on 10 March 2023).
- Consumer Laws in Poland. Available online: https://www.ure.gov.pl/pl/konsumenci/zbior-praw-konsumenta (accessed on 13 March 2023).
- Eurostat. Energy Consumption in Households. Eurostat 2020. Available online: https://ec.europa.eu/eurostat/statistics-explained/%20index.php (accessed on 10 March 2023).
- Fredriksson, G.; Zachmann, G. The Distributional Effects of Climate Policies. In The European Energy Transition; Nies, S., Ed.; Agenda for the Twenties; Claeys & Casteels Publishers BV: Deventer, The Netherlands, 2020; p. 88. [Google Scholar]
- Adams, A.; Jumpah, E.T.; Dramani, H.S. Dynamics of Clean and Sustainable Households’ Energy Technologies in Developing Countries: The Case of Improved Cookstoves in Ghana. Sustain. Futures 2023, 5, 100108. [Google Scholar] [CrossRef]
- Piao, X.; Managi, S. Household energy-saving behavior, its consumption, and life satisfaction in 37 countries. Sci. Rep. 2023, 13, 1382. [Google Scholar] [CrossRef] [PubMed]
- Wilson, L. Average Household Electricity Consumption—2023. Available online: https://shrinkthatfootprint.com/average-household-electricity-consumption/ (accessed on 11 August 2023).
- Best, R. Equitable reverse auctions supporting household energy investments. Energy Policy 2023, 177, 113548. [Google Scholar] [CrossRef]
- Brewer, D. Household responses to winter heating costs: Implications for energy pricing policies and demand-side alternatives. Energy Policy 2023, 177, 113550. [Google Scholar] [CrossRef]
- Kumar, P.; Caggiano, H.; Shwom, R.; Felder, F.A.; Andrews, C.J. Saving from home! How income, efficiency, and curtailment behaviors shape energy consumption dynamics in US households? Energy 2023, 271, 126988. [Google Scholar] [CrossRef]
- Su, S.; Ding, Y.; Li, G.; Skitmore, M.; Menadue, V. Temporal dynamic assessment of household energy consumption and carbon emissions in China: From the perspective of occupants. Sustain. Prod. Consum. 2023, 37, 142–155. [Google Scholar] [CrossRef]
- Tete, K.H.S.; Soro, Y.M.; Sidibé, S.S.; Jones, R.V. Urban domestic electricity consumption in relation to households’ lifestyles and energy behaviours in Burkina Faso: Findings from a large-scale, city-wide household survey. Energy Build. 2023, 285, 112914. [Google Scholar] [CrossRef]
- Energy Prosumers in Europe Citizen Participation in the Energy Transition. EEA Report. No 01, 2022. Available online: https://www.eea.europa.eu/publications/the-role-of-prosumers-ofTH_AL_22_007_EN_N_EnergyProsumersinEurope.pdf (accessed on 20 January 2023).
- Campos, I.; Marín-González, E. People in transitions: Energy citizenship, prosumerism and social movements in Europe. Energy Res. Soc. Sci. 2020, 69, 101718. [Google Scholar] [CrossRef]
- Oberst, C.A.; Schmitz, H.; Madlener, R. Are Prosumer Households That Much Different? Evidence from Stated Residential Energy Consumption in Germany; FCN Working Paper No. 24/2016 December 2016, revised March 2018; FCN: Berlin, Germany, 2016; Available online: https://www.researchgate.net/profile/Hendrik-Schmitz-2/publication/324030375_Are_Prosumer_ Households_That_Much_Different_Evidence_from_Stated_Residential_Energy_Consumption_in_Germany/links/5aba04e445851515f5a13237/Are-Prosumer-Households-That-Much-Different-Evidence-from-Stated-Residential-Energy-Consumption-in-Germany.pdf (accessed on 30 March 2023).
- Directive 2012/27/EU of the European Parliament and of the Council of 25 October 2012; pp. 34–35. Available online: https://eur-lex.europa.eu/legal-content/EN/TXT/PDF/?uri=CELEX:02012L0027-20200101&from=NL, (accessed on 15 August 2023).
- 7 Komunikat Komisji do Parlamentu Europejskiego, Rady Europejskiego Komitetu Ekonomiczno-Społecznego i Komitetu Regionów, Stworzenie Nowego Ładu Dla Odbiorców Energii {SWD(2015)141final}, COM(2015)339 Final, Bruksela. 2015. Available online: https://eur-lex.europa.eu/legal-content/PL/TXT/PDF/?uri=CELEX:52015DC0339&from=EN (accessed on 26 May 2021).
- Lilliu, F.; Loi, A.; Recupero, D.-R.; Sisinni, M.; Vinyals, M. An uncertainty-aware optimization approach for flexible loads of smart grid prosumers: A use case on the Cardiff energy grid. Sustain. Energy Grids Netw. 2019, 20, 100272. [Google Scholar] [CrossRef]
- Egert, R.; Daubert, J.; Marsh, S.; Mühlhäuser, M. Exploring energy grid resilience: The impact of data, prosumer awareness, and action. Perspective 2021, 2, 100258. [Google Scholar] [CrossRef]
- Goulden, M.; Bedwell, B.; Rennick-Egglestone, S.; Rodden, T.; Spence, A. Smart grids, smart users? the role of the user in demand side management. Energy Res. Soc. Sci. 2014, 2, 21–29. [Google Scholar] [CrossRef]
- Building Finland’s Largest Industrial Microgrid. News Press. Schneider Electric. Available online: https://www.schneider-electric.com/en/about-us/press/news/corporate-2018/building-finlandlargest-industrial-microgrid.jsp (accessed on 20 March 2023).
- Zhao, Z.; Luo, F.; Zhang, C.; Ranzi, G. A social relationship preference aware peer-to-peer energy market for urban energy prosumers and consumers. IET Renew. Power Gener. 2022, 16, 688–699. [Google Scholar] [CrossRef]
- Cseres, K. The Active Energy Consumer in EU Law. Euro. J. Risk Regul. 2018, 9, 227–244. [Google Scholar] [CrossRef]
- Milčiuvienė, S.; Kiršienė, J.; Doheijo, E.; Urbonas, R.; Milčius, D. The Role of Renewable Energy Prosumers in Implementing Energy Justice Theory. Sustainability 2019, 11, 5286. [Google Scholar] [CrossRef]
- Słupik, S. Conscious energy consumer in the silesian voivodeship in the field of survey. Stud. Ekonomiczne. Zesz. Nauk. Uniw. Ekon. Katowicach 2015, 232, 215–224. [Google Scholar]
- Gajdzik, B.; Jaciow, M.; Wolniak, R.; Wolny, R.; Grebski, W.W. Energy Behaviors of Prosumers in Example of Polish Households. Energies 2023, 16, 3186. [Google Scholar] [CrossRef]
- Lang, B.; Botha, E.; Robertson, J.; Dolan, R.; Kietzmann, J. How to grow the sharing economy? Create Prosumers! Australas. Mark. J. 2020, 28, 56–58. [Google Scholar] [CrossRef]
- Farhangi, H. The path of the smart grid. IEEE Power Energ. Mag. 2009, 8, 18–28. [Google Scholar] [CrossRef]
- Hargreaves, T.; Nye, M.; Burgess, J. Keeping energy visible? Exploring how householders interact with feedback from smart energy monitors in the longer term. Energy Policy 2013, 52, 126–134. [Google Scholar] [CrossRef]
- Koskela, T.; Väananen-Vainio-Mattila, K. Evolution towards smart home environments: Empirical evaluation of three user interfaces. Pers. Ubiquitous Comput. 2004, 8, 234–240. [Google Scholar] [CrossRef]
- Hoenkamp, R.; Huitema, G. Good standards for smart meters. In Proceedings of the 2012 9th International Conference on the European Energy Market, Florence, Italy, 10–12 May 2012; pp. 1–6. [Google Scholar]
- Urbano, E.M.; Martinez-Viol, V.; Kampouropoulos, K.; Romeral, L. Future european energy markets and industry 4.0 potential in energy transition towards decarbonization. Renew. Energy Power Qual. J. 2020, 18, 190–195. [Google Scholar] [CrossRef]
- Arana-Landín, G.; Uriarte-Gallastegi, N.; Landeta-Manzano, B.; Laskurain-Iturbe, I. The Contribution of Lean Management—Industry 4.0 Technologies to Improving Energy Efficiency. Energies 2023, 16, 2124. [Google Scholar] [CrossRef]
- Salonitis, K. Manufacturing Energy Efficiency and Industry 4.0. Energies 2023, 16, 2268. [Google Scholar] [CrossRef]
- Bhagwan, N.; Evans, M. A review of industry 4.0 technologies used in the production of energy in China, Germany, and South Africa. Renew. Sustain. Energy Rev. 2023, 173, 113075. [Google Scholar] [CrossRef]
- Gupta, P.; Tomar, A. Industry 4.0 Based Efficient Energy Management in Microgrid. J. Sci. Ind. Res. 2023, 82, 287–296. [Google Scholar]
- Patra, B.; Nema, P.; Khan, M.Z.; Khan, O. Optimization of solar energy using MPPT techniques and industry 4.0 modelling. Sustain. Oper. Comput. 2023, 4, 22–28. [Google Scholar] [CrossRef]
- Matsunaga, F.; Zytkowski, V.; Valle, P.; Deschamps, F. Optimization of Energy Efficiency in Smart Manufacturing Through the Application of Cyber-Physical Systems and Industry 4.0 Technologies. J. Energy Resour. Technol. Trans. ASME 2022, 144, 102104. [Google Scholar] [CrossRef]
- Bernat, T.; Flaszewska, S.; Lisowski, B.; Lisowska, R.; Szymańska, K. Facing Environmental Goals for Energy-Efficiency Improvements in Micro and Small Enterprises Operating in the Age of Industry 4.0. Energies 2022, 15, 6577. [Google Scholar] [CrossRef]
- Wolniak, R.; Saniuk, S.; Grabowska, S.; Gajdzik, B. Identification of energy efficiency trends in the context of the development of Industry 4.0 using the Polish steel sector as an example. Energies 2020, 13, 2867. [Google Scholar] [CrossRef]
- Grzybowska, K.; Gajdzik, B. Optimization of equipment setup processes in enterprises. Metalurgija 2012, 51, 555–558. [Google Scholar]
- Gajdzik, B. Comprehensive classification of environmental aspects in a manufacturing enterprise. Metalurgija 2012, 51, 541–544. [Google Scholar]
- Gajdzik, B.; Wolniak, R.; Grebski, W.W. Electricity and heat demand in steel industry technological processes in Industry 4.0 conditions. Energies 2023, 16, 787. [Google Scholar] [CrossRef]
- Gajdzik, B.; Wolniak, R.; Grebski, W.W. An Econometric Model of the Operation of the Steel Industry in Poland in the Context of Process Heat and Energy Consumption. Energies 2022, 15, 7909. [Google Scholar] [CrossRef]
- Gajdzik, B.; Wolniak, R. Digitalisation and innovation in the steel industry in Poland—Selected tools of ICT in an analysis of statistical data and a case study. Energies 2021, 14, 3034. [Google Scholar] [CrossRef]
- Gajdzik, B.; Sroka, W.; Vveinhardt, J. Energy Intensity of Steel Manufactured Utilising EAF Technology as a Function of Investments Made: The Case of the Steel Industry in Poland. Energies 2021, 14, 5152. [Google Scholar] [CrossRef]
- Gajdzik, B.; Sroka, W. Resource Intensity vs. Investment in Production Installations—The Case of the Steel Industry in Poland. Energies 2021, 14, 443. [Google Scholar] [CrossRef]
- Gajdzik, B.; Wolniak, R.; Grebski, W.W. Process of transformation to net zero steelmaking: Decarbonisation scenarios based on the analysis of the Polish steel industry. Energies 2023, 16, 3384. [Google Scholar] [CrossRef]
- Zheng, S.; Huang, G.; Lai, A.C.K. Coordinated energy management for commercial prosumers integrated with distributed stationary storages and EV fleets. Energy Build. 2023, 282, 112773. [Google Scholar] [CrossRef]
- Liu, D.; Qi, S.; Xu, T. In the post-subsidy era: How to encourage mere consumers to become prosumers when subsidy reduced? Energy Policy 2023, 174, 113451. [Google Scholar] [CrossRef]
- Postnikov, I. Methods for the reliability optimization of district-distributed heating systems with prosumers. Energy Rep. 2023, 9, 584–593. [Google Scholar] [CrossRef]
- Wang, X.; Wang, Z.; Mu, Y.; Deng, Y.; Jia, H. Rolling horizon optimization for real-time operation of prosumers with Peer-to-Peer energy trading. Energy Rep. 2023, 9, 321–328. [Google Scholar] [CrossRef]
- Manna, C.; Sanjab, A. A decentralized stochastic bidding strategy for aggregators of prosumers in electricity reserve markets. J. Clean. Prod. 2023, 389, 135962. [Google Scholar] [CrossRef]
- Gajdzik, B.; Grabowska, S.; Saniuk, S.; Wieczorek, T. Sustainable Development and Industry 4.0: A Bibliometric Analysis Identifying Key Scientific Problems of the Sustainable Industry 4.0. Energies 2020, 13, 4254. [Google Scholar] [CrossRef]
- Grabowska, S.; Saniuk, S.; Gajdzik, B. Industry 5.0: Improving humanization and sustainability of Industry 4.0. Scientometrics 2022, 127, 3117–3131. [Google Scholar] [CrossRef] [PubMed]
- Carayannis, E.G.; Dezi, L.; Gregori, G.; Calò, E. Smart Environments and Techno-centric and Human-Centric Innovations for Industry and Society 5.0: A Quintuple Helix Innovation System View Towards Smart, Sustainable, and Inclusive Solutions. J. Knowl. Econ. 2022, 13, 926–955. [Google Scholar] [CrossRef]
- Chen, Y.; Tanaka, M.; Takashima, R. Death spiral, transmission charges, and prosumers in the electricity market. Appl. Energy 2023, 332, 120488. [Google Scholar] [CrossRef]
- Lopez, H.K.; Zilouchian, A. Peer-to-peer energy trading for photo-voltaic prosumers. Energy 2023, 263, 125563. [Google Scholar] [CrossRef]
- Liu, Y.; Zhang, Y.; Cheng, G.; Zhu, J.; Che, Y. Grid-friendly energy prosumers based on the energy router with load switching functionality. Int. J. Electr. Power Energy Syst. 2023, 144, 108496. [Google Scholar] [CrossRef]
- Peng, D.; Xiao, H.; Pei, W.; Sun, H.; Ye, S. A novel deep learning based peer-to-peer transaction method for prosumers under two-stage market environment. IET Smart Grid 2022, 5, 430–439. [Google Scholar] [CrossRef]
- Wang, J.; An, Q.; Zhao, Y.; Hu, Q.; Tan, C.-W. Role of electrolytic hydrogen in smart city decarbonization in China. Appl. Energy 2023, 336, 120699. [Google Scholar] [CrossRef]
- Feng, Y.; Liao, H.-T.; Bu, M. Responsible Decarbonization for Smart Cities: A People-Centered Agenda. In Proceedings of the 2022 IEEE European Technology and Engineering Management Summit, E-TEMS 2022, Bilbao, Spain, 9–11 March 2022; pp. 202–207. [Google Scholar]
- Kinelski, G. Smart-city trends in the environment of sustainability as support for decarbonization processes. Polityka Energetyczna 2022, 25, 109–136. [Google Scholar] [CrossRef]
- Nagano, N.; Furubayashi, T.; Nakata, T. Quantitative analysis of energy supply and demand structure for regional decarbonization: A case study on Miyako city, Iwate prefecture and the Miyako smart community project. Stud. Reg. Sci. 2020, 50, 227–241. [Google Scholar] [CrossRef]
- Kobashi, T.; Yamagata, Y.; Yoshida, T.; Ahl, A.; Aleksejeva, J. Smart city and ICT infrastructure with vehicle to X applications toward urban decarbonization. In Urban Systems Design Creating Sustainable Smart Cities in the Internet of Things Era; Elsevier: Amsterdam, The Netherlands, 2020; pp. 289–333. [Google Scholar]
- Volpato, G.; Carraro, G.; Cont, M.; Rech, S.; Lazzaretto, A. General guidelines for the optimal economic aggregation of prosumers in energy communities. Energy 2022, 258, 124800. [Google Scholar] [CrossRef]
- Ren, Z.; Verbič, G.; Guerrero, J. Multi-period dynamic tariffs for prosumers participating in virtual power plants. Electr. Power Syst. Res. 2022, 212, 108478. [Google Scholar] [CrossRef]
- Li, R.; Yan, X.; Liu, N. Hybrid energy sharing considering network cost for prosumers in integrated energy systems. Appl. Energy 2022, 323, 119627. [Google Scholar] [CrossRef]
- Zomorodi Moghadam, A.; Javidi, M.H. Designing a two-stage transactive energy system for future distribution networks in the presence of prosumers’ P2P transactions. Electr. Power Syst. Res. 2022, 211, 108202. [Google Scholar] [CrossRef]
- Lomascolo-Pujadó, A.; Martínez-García, H. Contribution to Collaborative Electricity Microgrid Management Strategies of Domestic Prosumers. Renew. Energy Power Qual. J. 2022, 20, 635–640. [Google Scholar] [CrossRef]
- Tostado-Véliz, M.; Rezaee Jordehi, A.; Icaza, D.; Mansouri, S.A.; Jurado, F. Optimal participation of prosumers in energy communities through a novel stochastic-robust day-ahead scheduling model. Int. J. Electr. Power Energy Syst. 2023, 147, 108854. [Google Scholar] [CrossRef]
- Chen, X.; Wei, T.; Hu, S. Uncertainty-aware household appliance scheduling considering dynamic electricity pricing in smart home. IEEE Trans. Smart Grid 2013, 4, 932–941. [Google Scholar] [CrossRef]
- Final Report: Demand Side Flexibility Perceived Barriers and Proposed Recommendations European Smart Grids Task Force. 2019. Available online: https://ec.europa.eu/energy/sites/ener/files/documents/eg3_final_report_demand_sside_flexiblity_2019.04.15.pdf (accessed on 26 May 2021).
- TSO—DSO Report an Integrated Approach to Active System Management with the Focus on TSO-DSO Coordination in Congestion Management and Balancing. 2019. Available online: https://cdn.eurelectric.org/media/3797/tso-dso_report_-_an_integrated_approach_to_active_system_management-2019-030-0255-01-e-h-B31641F6.pdf (accessed on 20 March 2023).
- Koirala, B.P.; Araghi, Y.; Kroesen, M.; Ghorbani, A.; Hakvoort, R.A.; Herder, P.M. Trust, awareness, and independence: Insights from a socio-psychological factor analysis of citizen knowledge and participation in community energy systems. Energy Res. Soc. Sci. 2018, 38, 33–40. [Google Scholar] [CrossRef]
- Staniszewska, Z. Kto Dyktuje Ceny Prądu? Konsument Jako Główny Uczestnik Rynku Energii Elektrycznej w Pakiecie „Czysta Energia Dla Wszystkich Europejczyków”. In Szanse i Zagrożenia Dla Uczestników Rynku Energii; Materna, G., Król, J., Eds.; INP PAN: Warsaw, Poland, 2021; pp. 93–110. Available online: https://ebp.inp.pan.pl/xmlui/bitstream/handle/123456789/729/materna_krol_szanse_i_zagrozenia_dla_uczestnikow_rynku_energii.pdf?sequence=3&isAllowed=y (accessed on 24 March 2023).
- Electricity Production, Consumption and Market Overview. Eurostat 2020. Report. Available online: https://ec.europa.eu/eurostat/statistics-explained/index.php?title=Electricity_production,_consumption_and_market_overview#Household_electricity_consumption (accessed on 23 October 2020).
- European Green Deal. The EU Renewable Energy Target Declared by the European Parliament in 2018 for 2030 is 32% (Article 3 of the RED II Directive); Commissioner Ursula Von Der Leyen’s proposal is to increase it to at least 50%, Communication from the European Commission of December 11, 2019 European Green Deal. Available online: https://eur-lex.europa.eu/PL/legal-content/summary/renewable-energy.html, (accessed on 19 June 2023).
- Eurostat. Electricity Price Statistics. Available online: https://ec.europa.eu/eurostat/statistics-explained/index.php?title=Electricity_price_statistics#Electricity_prices_for_household_consumers (accessed on 23 October 2020).
- Tomaszewski, R.; Sieć do Zmiany. Jak Zreformować Polski Sektor Dystrybucji Energii Elektrycznej, Polityka Insight, Research, Fundacja Przyjazny Kraj, Warszawa. 2019. Available online: https://www.politykainsight.pl/prawo/_resource/multimedium/20182100 (accessed on 26 May 2021).
- Li, J.; Ge, S.; Xu, Z.; Wang, C.; Cheng, X. A network-secure peer-to-peer trading framework for electricity-carbon integrated market among local prosumers. Appl. Energy 2023, 335, 120420. [Google Scholar] [CrossRef]
- Gržanić, M.; Capuder, T.; Zhang, N.; Huang, W. Prosumers as active market participants: A systematic review of evolution of opportunities, models and challenges. Renew. Sustain. Energy Rev. 2022, 154, 111859. [Google Scholar] [CrossRef]
- Chaudhry, S.; Surmann, A.; Kühnbach, M.; Pierie, F. Renewable Energy Communities as Modes of Collective Prosumership: A Multi-Disciplinary Assessment Part II—Case Study. Energies 2022, 15, 8936. [Google Scholar] [CrossRef]
- Borowski, P.F. Digital Transformation and Prosumers Activities in the Energy Sector. Lect. Notes Netw. Syst. 2023, 549, 129–150. [Google Scholar]
- Muqeet HAMunir, H.M.; Javed, H.; Muhammad, S.; Jamil, M.; Guerrero, J.M. An Energy Management System of Campus Microgrids: State-of-the-Art and Future Challenges. Energies 2021, 14, 6525. [Google Scholar] [CrossRef]
- Sdrignola, P.; Ricci, M.; Ancona, M.A.; Gianaroli, F.; Capodaglio, C.; Melino, F. Modelling a Prototype of Bidirectional Substation for District Heating with Thermal Prosumers. Sustainability 2023, 15, 4938. [Google Scholar] [CrossRef]
- Almarzooqui, A.H.; Osman, A.H.; Shabaan Nassar, M. An Exploratory Study of the Perception of Peer-to-Peer Energy Trading within the Power Distribution Network in the UAE. Sustainability 2023, 15, 4891. [Google Scholar] [CrossRef]
- Tenti, P.; Caldognetto, T. Integration of Local and Central Control Empowers Cooperation among Prosumers and Distributors towards Safe, Efficient, and Cost-Effective Operation of Microgrids. Energies 2023, 16, 2320. [Google Scholar] [CrossRef]
- Cheng, M. Sharing economy: A review and agenda for future research. Int. J. Hospitality Manag. 2016, 57, 60–70. [Google Scholar] [CrossRef]
- Bessa, R.J.; Rua, D.; Abreu, C.; Gonçalves, C.; Reis, M. Data economy for prosumers in a smart grid ecosystem. In Proceedings of the e-Energy’18: The Ninth International Conference on Future Energy Systems, Karlsruhe, Germany, 12–15 June 2018; pp. 622–630. [Google Scholar]
- Steinhoff, J. Transformacja polskiej energetyki jako konsekwencja European Green Deal. In Ekonomiczne Skutki Pandemii; based on PSE; Błach, J., Barszczowska, B., Eds.; Akademia WSB: Dabrowa Górnicza, Poland, 2021; pp. 251–256. Available online: https://www.rynekelektryczny.pl/produkcja-energii-elektrycznej-w-polsce/ (accessed on 10 October 2020).
- Gawlik, L. (Ed.) Węgiel Dla Polskiej Energetyki w Perspektywie 2050 Roku–Analizy Scenariuszowe; GIPH: Katowice, Poland, 2013. [Google Scholar]
- Szpor, A.; Ziółkowska, K. The Transformation of the Polish Coal Sector; GSI Report; International Institute for Sustainable Development: Winnipeg, MB, Canada, 2018. [Google Scholar]
- Gawlik, L.; Mokrzycki, E. Dylematy Krajowej Energetyki: Energia Konwencjonalna Czy Odnawialna? In Szanse i Zagrożenia dla Uczestników Rynku Energii; ILS PAS Publishing House: Warsaw, Poland, 2021; pp. 55–74. [Google Scholar]
- PEP2030 Polityka Energetyczna Polski do 2030 r., Warszawa, 10 Novemver 2009. Available online: http://nfosigw.gov.pl/download/gfx/nfosigw/pl/nfoopisy/1328/1/4/polityka_energetyczna_polski_do_2030r.pdf (accessed on 15 March 2023).
- Eurostat. Greenhouse Gas Emission Statistics; Eurostat: Luxembourg, 2022; Available online: https://ec.europa.eu/eurostat/statisticsexplained/index.php?title=Greenhouse_gas_emission_statistics_-_air_emissions_accounts&oldid=551500#Greenhouse_gas_emissions (accessed on 25 September 2022).
- Dusiło, M. Transformacja Energetyczna w Polsce. Edycja 2022. Analizy i Dialog; Forum Energii: Warszawa, Poland, 2022. [Google Scholar]
- Transformacja energetyczna w Polsce Edycja. 2023. Available online: https://www.forum-energii.eu/public/upload/articles/files/Raport_Transformacja%20energetyczna%20Polski_2023.pdf (accessed on 15 August 2023).
- IEA. Poland 2022. Energy Policy Review; IEA: Paris, France, 2022; p. 105. [Google Scholar]
- Ritchie, H.; Roser, M. Greenhouse gas emissions. Available online: https://ourworldindata.org/greenhouse-gas-emissions (accessed on 25 September 2022).
- Kawecka-Wyrzykowska, E. Challenges of decarbonisation of Polish economy: The role of coal. Społeczeństwo I Polityka 2022, 73, 67–90. [Google Scholar] [CrossRef]
- Air Emissions Accounts by NACE Rev. 2 Activity. Available online: https://ec.europa.eu/eurostat/databrowser/view/ENV_AC_AINAH_R2__custom_5207098/default/table?lang=en (accessed on 25 September 2022).
- Witczak, M.; How Many Householders Use the Coal Mix. Ile Gospodarstw Domowych Używa Węgla miks. Available online: https://demagog.org.pl/wypowiedzi/ile-gospodarstw-domowych-uzywa-wegla-mkis-podalo-szacunki/ (accessed on 20 May 2023).
- GUS. Share of Householders Using Various Energy Commodities for Space Heating in Poland; GUS (Statistics Poland): Warsaw, Poland, 2022. [Google Scholar]
- Share of Fuels in the Final Energy Consumption in the Residential Sector, 2020 (%) v5.png. Available online: https://ec.europa.eu/eurostat/statistics-explained/index.php?title=File:Share_of_fuels_in_the_final_energy_consumption_in_the_residential_sector,_2020_(%25)_v5.png (accessed on 25 September 2022).
- Eurostat. Final Energy Consumption. 2021. Available online: https://ec.europa.eu/eurostat/statistics-explained/index.php?title=Glossary:Final_energy_consumption (accessed on 20 May 2023).
- Kuczera, A.; Płoszaj-Mazurek, P. Zerowy Ślad Węglowy Budownictwa. Mapa Drogowa Dekarbonizacji Budownictwa do Roku 2050; PLGBC: Gliwice, Poland, 2021; Available online: https://plgbc.org.pl/wp-content/uploads/2021/06/Mapa-drogowa-dekarbonizacji-2050.pdf (accessed on 20 May 2023).
- Ostermeyer, Y.; Bienge, K.; Camarasa, C.; Sarag, G.; Nägeli, C.; Jakob, B. Building Market Brief Poland; CUES Foundation: Delft, The Netherlands, 2018. [Google Scholar]
- Ministerstwo Klimatu i Środowiska. Strategia dl Ciepłownictwa do 2030 r. z Perspektywą do 2040 r. Strategy for Heating (2030–2040); Ministerstwo Klimatu i Środowiska: Warszawa, Poland, 2022. Available online: https://bip.mos.gov.pl/fileadmin/user_upload/bip/strategie_plany_programy/Strategia_dla_cieplownictwa_do_2030_r._z_perspektywa_do_2040_r/Strategia_dla_cieplownictwa.docx (accessed on 20 May 2023).
- Available online: https://www.google.com/search?q=Dekarbonizacja+gospodarstw+domowych+w+Polsce&ei=5RWlZNrKJaj-7_UProi48As&start=20&sa=N&ved=2ahUKEwia0fuKgPf_AhUo_7sIHS4EDr44ChDy0wN6BAgKEAc&biw=1536&bih=696&dpr=1.25 (accessed on 20 May 2023).
- Forum Energii i Polskiego Instytutu Ekonomicznego. Raport pt. Czas na Ciepłownictwo. In Energetyka 24; Forum Energii i Polskiego Instytutu Ekonomicznego: Warsaw, Poland, 2021; Available online: https://energetyka24.com/strona-autora/energetyka24 (accessed on 13 February 2020).
- PAP Polska Agencja Prasowa; Newsletter 14 April 2023 (13:03). Available online: https://www.tvpparlament.pl/69174356/80-90-proc-wegla-w-gospodarstwach-domowych-pochodzilo-ze-spolek-skarbu-panstwa (accessed on 20 May 2023).
- Ustawa z Dnia 5 Sierpnia 2022 r. o Dodatku Węglowym; Tekst aktu: D20221692L.pdf. Available online: https://isap.sejm.gov.pl/isap.nsf/DocDetails.xsp?id=WDU20220001692 (accessed on 20 May 2023).
- „Barometru Zdrowych Domów” Velux. 2022. Available online: https://www.velux.pl/inspiracje/zdrowe-domy (accessed on 20 May 2023).
- Piątkowski, J.; Gajdzik, B.; Mesjasz, A. Assessment of Material Durability of Steam Pipelines Based on Statistical Analysis of Strength Properties—Selected Models. Energies 2020, 13, 3633. [Google Scholar] [CrossRef]
- Kiuila, O. Decarbonisation perspectives for the Polish economy. Energy Policy 2018, 118, 69–76. [Google Scholar] [CrossRef]
- Karaczun, R.; Budowa Przydomowych Mikroinstlacji a Dekrabonizacja Polskiej Gospodarki. Aktualności, 4 Kwiecień 2022. Available online: https://architektura.info/wiadomosci/aktualnosci/budowa_przydomowych_mikroinstalacji_a_dekarbonizacja_polskiej_gospodarkiBudowaprzydomowychmikroinstalacjiadekarbonizacjapolskiejgospodarki (accessed on 20 May 2023).
- Balicka-Sawiak, E.; Polski Instytut Ekonomiczny. (Raport) PIE: Przyspieszona Dekarbonizacja Potrzebna, ale Konieczne są Osłony dla Najuboższych Gospodarstw Domowych. 2021. Available online: https://pie.net.pl/pie-przyspieszona-dekarbonizacja-potrzebna-ale-konieczne-sa-oslony-dla-najubozszych-gospodarstw-domowych/ (accessed on 20 May 2023).
- PTPiREE. Transformacja Energetyczna w Polsce, Edycja. 2022. Available online: https://www.forum-energii.eu/public/upload/articles/files/Raport_Transformacja%20energetyczna%20Polski_2022.pdf (accessed on 29 September 2022).
- Polski Komitet Energii Elektrycznej. Polska Ścieżka Transformacji Energetycznej; Report; Polski Komitet Energii Elektrycznej: Warszawa, Poland, 2022; Available online: https://pkee.pl/publications/raport-ey-i-pkee-polska-sciezka-transformacji-energetycznej/ (accessed on 27 May 2023).
- Tobór-Osadnik, K.; Gajdzik, B.; Strzelec, G. Configurational Path of Decarbonisation Based on Coal Mine Methane (CMM): An Econometric Model for the Polish Mining Industry. Sustainability 2023, 15, 9980. [Google Scholar] [CrossRef]
- PEP 2040. Polska Polityka Energetyczna. Polityka Energetyczna Polski do 2040; r. (PEP2040). Available online: https://www.gov.pl/web/klimat/polityka-energetyczna-polski (accessed on 21 May 2023).
- Antosiewicz, M.; Nikas, A.; Szpor, A.; Witajewski-Baltvilks, J.; Doukas, H. Pathways for the transition of the Polish power sector and associated risks. Environ. Innov. Soc. Transit. 2020, 35, 271–291. [Google Scholar] [CrossRef]
- Sokołowski, J.; Frankowski, J.; Mazurkiewicz, J.; Antosiewicz, M.; Lewandowski, P. Dekarbonizacja i Zatrudnienie W Górnictwie Węgla Kamiennego w Polsce; ibs research report 01/2021; Instytut Badań Strukturalnych (IBS): Warszawa, Poland, 2021; p. 14. [Google Scholar]
- United Nations Environment Programme (2020). 2020 Global Status Report for Buildings and Construction: Towards a Zero-emission, Efficient and Resilient Buildings and Construction Sector. Available online: https://globalabc.org/sites/default/files/inline-files/2020%20Buildings%20GSR_FULL%20REPORT.pdf (accessed on 30 March 2023).
- The Mission of Public Statistics. Available online: https://bip.stat.gov.pl/dzialalnosc-statystyki-publicznej/jakosc-w-statystyce/misja-statystyki-publicznej/ (accessed on 3 May 2023).
- Zużycie Paliw i Nośników Energii (Lata 2006–2021), GUS. Available online: https://stat.gov.pl/obszary-tematyczne/srodowisko-energia/energia/zuzycie-paliw-i-nosnikow-energii-w-2021-roku,6,16.html (accessed on 30 March 2023).
- European Statistics Code of Practice. Available online: https://ec.europa.eu/eurostat/web/products-catalogues/-/ks-02-18-142 (accessed on 3 May 2023).
- Alekseev, A.; Sokolov, M.V. How to measure the average rate of change? Math. Soc. Sci. 2021, 113, 43–59. [Google Scholar] [CrossRef]
- Čermáková, K.; Hromada, E. Change in the Affordability of Owner-Occupied Housing in the Context of Rising Energy Prices. Energies 2022, 15, 1281. [Google Scholar] [CrossRef]
- Long, Q.; Wang, F.; Ge, W.; Jiao, F.; Han, J.; Chen, H.; Roig, F.A.; Abraham, E.M.; Xie, M.; Cai, L. Temporal and Spatial Change in Vegetation and Its Interaction with Climate Change in Argentina from 1982 to 2015. Remote Sens. 2023, 15, 1926. [Google Scholar] [CrossRef]
- Jaciow, M. Ekwiwalencja w Międzynarodowych Badaniach Rynku; Wydawnictwo Uniwersytetu Ekonomicznego w Katowicach: Katowice, Poland, 2018; pp. 46–57. [Google Scholar]
- Goryl, A.; Jędrzejczyk, Z.; Kukuła, K.; Osiewalski, J.; Walkosz, A. Wprowadzenie do Ekonometrii w Przykładach I Zadaniach; Wydawnictwo Naukowe PWN: Warszawa, Poland, 1996; pp. 116–117. [Google Scholar]
- Wolny, R. Metody Ilościowe w Badaniach Rynku; Wydawnictwo Akademii Ekonomicznej: Katowice, Poland, 2009; pp. 32–38. [Google Scholar]
- Petropoulos, F.; Apiletti, D.; Assimakopoulos, V.; Zied Babai, M.; Barrow, D.K.; Ben Taieb, S.; Ziel, F. Forecasting: Theory and practice. Int. J. Forecast. 2022, 38, 705–871. [Google Scholar] [CrossRef]
- Mynarski, S. Badania Rynkowe w Warunkach Konkurencji; Oficyna Wydawnicza Fogra: Kraków, Poland, 1995; pp. 197–198. [Google Scholar]
- Neutralna Emisyjnie Polska 2050. Jak Wyzwanie Zmienić w Szansę, McKinsey & Company, 2020. Available online: https://www.mckinsey.com/pl/~/media/mckinsey/locations/europe%20and%20middle%20east/polska/raporty/carbon%20neutral%20poland%202050/neutralna%20emisyjnie%20polska%202050_raport%20mckinsey.pdf (accessed on 4 May 2023).
- Coal Production and Consumption Decreased by a Third in 2 Years. Available online: https://ec.europa.eu/eurostat/web/products-eurostat-news/-/ddn-20210810-1 (accessed on 3 May 2023).
- Stala-Szugaj, K. Trends in the consumption of hard coal in Polish households compared to EU households. Miner. Resour. Manag. 2016, 32, 5–22. [Google Scholar]
- Baldino, C.; O’Malley, J.; Searle, S.; Christensen, A. Hydrogen for heating? Options for Households in the European Union in 2050, International Council on Clean Transportation, 2021, Working Paper. Available online: https://theicct.org/wp-content/uploads/2021/06/Hydrogen-heating-eu-feb2021.pdf (accessed on 3 May 2023).
- Kermeli, K.; Crijns-Graus, W.; Johannsen, R.M.; Mathiesen, B.V. Energy efficiency potentials in the EU industry: Impacts of deep decarbonization technologies. Energy Effic. 2022, 15, 68. [Google Scholar] [CrossRef]
- Adun, H.; Ishaku, H.P.; Jazayeri, M.; Okoye, T.; Dike, G.C. Decarbonization of EU energy sector: Techno-feasibility analysis of 100% renewables by 2050 in Cyprus. Clean Technol. Environ. Policy 2022, 24, 2801–2824. [Google Scholar] [CrossRef]
- Khatiwada, D.; Vasudevan, R.A.; Santos, B.H. Of natural gas systems in the EU—Costs, barriers, and constraints of hydrogen production with a case study in Portugal. Renew. Sustain. Energy Rev. 2022, 168, 112775. [Google Scholar] [CrossRef]
- Di Bella, G.; Flaagan, M.; Foda, K.; Maslova, S.; Pienkowski, A.; Stuermer, M.; Toscanti, F. Natural Gas in Europe the Potential Impact of Disruptions to Supply, International Monetary Fund. 2022. Available online: https://www.google.com/url?sa=t&rct=j&q=&esrc=s&source=web&cd=&cad=rja&uact=8&ved=2ahUKEwjslJiuyNn-AhURHHcKHdetAwMQFnoECAsQAQ&url=https%3A%2F%2Fwww.imf.org%2F-%2Fmedia%2FFiles%2FPublications%2FWP%2F2022%2FEnglish%2Fwpiea2022145-print-pdf.ashx&usg=AOvVaw3PgU5wkBr1DVv0CPNgUqeB (accessed on 3 May 2023).
- Chrulski, T. Forecasting medium-term natural gas demand for the European Union. Przegląd Eur. 2022, 22, 1. [Google Scholar] [CrossRef]
- How the European Union Could Achieve Net-Zero Emissions at Net-Zero Cost, McKinsey Sustainability. 2020. Available online: https://www.mckinsey.com/capabilities/sustainability/our-insights/how-the-european-union-could-achieve-net-zero-emissions-at-net-zero-cost (accessed on 3 May 2023).
- Coal Production and Consumption Statistics. Available online: https://ec.europa.eu/eurostat/statistics-explained/index.php?title=Coal_production_and_consumption_statistics (accessed on 3 May 2023).
- Natural Gas Supply Statistic. Available online: https://ec.europa.eu/eurostat/statistics-explained/SEPDF/cache/10590.pdf (accessed on 3 May 2023).
- Mišík, M.; Nosko, A. Post-pandemic lessons for EU energy and climate policy after the Russian invasion of Ukraine: Introduction to a special issue on EU green recovery in the post-Covid-19 period. Energy Policy 2023, 177, 113546. [Google Scholar] [CrossRef] [PubMed]
- Guillot, V.; Siggini, G.; Assoumou, E. Interactions between land and grid development in the transition to a decarbonized European power system. Energy Policy 2023, 175, 113470. [Google Scholar] [CrossRef]
- Redko, K.; Borychenko, O.; Cherniavskyi, A.; Saienko, V.; Dudnikov, S. Comparative Analysis of Innovative Development Strategies of Fuel and Energy Complex of Ukraine and the EU Countries: International Experience. Int. J. Energy Econ. Policy 2023, 13, 301–308. [Google Scholar] [CrossRef]
- Bartnicki, G.; Nowak, B. The gas fuel market in Poland and the costs of final heat generated in a local boiler house. Energy Policy J. 2020, 2, 105–120. [Google Scholar] [CrossRef]
- Forum Energii. Energy Transition in Poland. 2022. Available online: https://forum-energii.eu/public/upload/articles/files/Energy%20transition%20in%20Poland.%202022%20Edition(2).pdf (accessed on 3 May 2023).
- Piekut, M. Patterns of Energy Consumption in Polish One-Person Households. Energies 2020, 13, 5699. [Google Scholar] [CrossRef]
- Berent-Kowalska, G.; Peryt, S.; Wnuk, R. Energy Efficiency trends and policies in Poland, GUS. Available online: https://www.odyssee-mure.eu/publications/national-reports/energy-efficiency-poland.pdf (accessed on 3 May 2023).
- Attia, S.; Kosiński, P.; Wójcik, R.; Weglarz, A.; Koc, D.; Laurent, O. Energy efficiency in the polish residential building stock: A literature review. J. Build. Eng. 2022, 45, 103461. [Google Scholar] [CrossRef]
- Nafkha, R.; Woźniakowski, T. Households electricity usage analysis and the effectiveness of changing tarif group. Inf. Syst. Manag. 2018, 7, 171–179. [Google Scholar]
- Poland among Countries with Lowest Energy and Gas Price Increases in EU. Available online: https://www.thefirstnews.com/article/poland-among-countries-with-lowest-energy-and-gas-price-increases-in-eu-34655 (accessed on 3 May 2023).
- Krzysztoszek, A. Poland: Cheapest Electricity, Biggest Complaints. 2021. Available online: https://www.euractiv.com/section/all/short_news/cheapest-electricity-biggest-complaints/ (accessed on 3 May 2023).
- Szoke, E. Poland Launches “Clean Air 2.0” Programme. 2020. Available online: https://ceenergynews.com/climate/poland-launches-clean-air-2-0-programme/ (accessed on 3 May 2023).
- Poland Launches “Clean Air” Program. Available online: https://www.trade.gov/market-intelligence/poland-launches-clean-air-program (accessed on 3 May 2023).
- Keynes, J.M. Inflation, No, It’s Not Transitory. Commodity Returns, Year to Date. 2021. Available online: https://acornmc.co.uk/wp-content/uploads/2021/12/Acorn_20210709_Inflation_No_its_not_Transitory.pdf (accessed on 20 May 2023).
- ISOVER. Available online: https://www.isover.pl/aktualnosci/ile-mozna-zaoszczedzic-dzieki-termomodernizacji-bierzemy-pod-lupe-dwa-popularne-typy-domow (accessed on 20 May 2023).
- Social Agreement. Poland, Katowice. Available online: https://www.gov.pl/web/aktywa-panstwowe/umowa-spoleczna (accessed on 20 May 2023).
- Sakson-Boulet, A. The Clean Air Priority Programme—Evaluation and Perspectives. Srod. Stud. Polit. 2020, 1, 171–192. [Google Scholar] [CrossRef]
- Malec, M.; Kinielski, G.; Czarnecka, M. The Impact of COVID-19 on Electricity Demand Profiles: A Case Study of Selected Business Clients in Poland. Energies 2021, 14, 5332. [Google Scholar] [CrossRef]
- Bielecki, S.; Skoczkowski, T.; Sobczak, L.; Buchowski, J.; Maciąg, Ł. Impact of the Lockdown during the COVID-19 Pandemic on Electricity Use by Residential Users. Energies 2021, 14, 980. [Google Scholar] [CrossRef]
- Strategia dla Ciepłownictwa do 2030 r. z Perspektywą do 2040 r. Available online: https://bip.mos.gov.pl/strategie-plany-programy/strategia-dla-cieplownictwa-do-2030-r-z-perspektywa-do-2040-r/ (accessed on 12 July 2023).
- Zhao, L.; Zhao, T.; Yuan, R. Drivers of household decarbonization: Decoupling and decomposition analysis. J. Clean. Prod. 2021, 289, 125154. [Google Scholar] [CrossRef]
- Moberg, K.R.; Sovacool, B.K.; Goritz, A.; Aall, C.; Nilsson, M. Barriers, emotions, and motivational levers for lifestyle transformation in Norwegian household decarbonization pathways. Clim. Change 2021, 165, 3. [Google Scholar] [CrossRef]
- Jiang, Y.; Long, Y.; Liu, Q.; Dowaki, K.; Ihara, T. Carbon emission quantification and decarbonization policy exploration for the household sector—Evidence from 51 Japanese cities. Energy Policy 2020, 140, 111438. [Google Scholar] [CrossRef]
- Kuang, B.; Schelly, C.; Ou, G.; Tiwari, S.; Chen, J. Data-driven analysis of influential factors on residential energy end-use in the US. J. Build. Eng. 2023, 75, 106947. [Google Scholar] [CrossRef]
- Xiang, X.; Zhou, N.; Ma, M.; Feng, W.; Yan, R. Global transition of operational carbon in residential buildings since the millennium. Adv. Appl. Energy 2023, 11, 100145. [Google Scholar] [CrossRef]
- Businge, C.N.; Mazzoleni, M. Impact of circular economy on the decarbonization of the Italian residential sector. J. Clean. Prod. 2023, 408, 136949. [Google Scholar] [CrossRef]
- Levesque, A.; Osorio, S.; Herkel, S.; Pahle, M. Rethinking the role of efficiency for the decarbonization of buildings is essential. Joule 2023, 7, 1087–1092. [Google Scholar] [CrossRef]
- Net-Zero EuropeDecarbonization Pathways and Socioeconomic Implications, McKinsey & Kompany. 2020. Available online: https://www.mckinsey.com/~/media/mckinsey/business%20functions/sustainability/our%20insights/how%20the%20european%20union%20could%20achieve%20net%20zero%20emissions%20at%20net%20zero%20cost/net-zero-europe-vf.pdf (accessed on 20 May 2023).
- Perrisi, I.; Jones, A. Investigating European Union Decarbonization Strategies: Evaluating the Pathway to Carbon Neutrality by 2050. Sustainability 2022, 14, 4728. [Google Scholar] [CrossRef]
- Matuszewska-Janica, A.; Żebrowska-Suchodolska, D.; Mazur-Dudzińska, A. The Situation of Households on the Energy Market in the European Union: Consumption, Prices, and Renewable Energy. Energies 2021, 14, 6364. [Google Scholar] [CrossRef]
- Shoeib, F.A.; Danial, E.A.; Pastora, M.B.B. Finding Sustainable Countries in Renewable Energy Sector: A Case Study for an EU Energy System. Sustainability 2023, 15, 10084. [Google Scholar] [CrossRef]
- Jalowiec, T.; Grala, D.; Maśloch, P.; Wojtaszek, H.; Maśloch, G.; Wójcik-Czerniawska, A. Analysis of the Implementation of Functional Hydrogen Assumptions in Poland and Germany. Energies 2022, 15, 8383. [Google Scholar] [CrossRef]
- Chudy-Laskowska, K.; Pisula, T. An Analysis of the Use of Energy from Conventional Fossil Fuels and Green Renewable Energy in the Context of the European Union’s Planned Energy Transformation. Energies 2022, 15, 7369. [Google Scholar] [CrossRef]


| Source | Poland | 27 Countries of EU |
|---|---|---|
| Coal | 81.3% | 35.6% |
| Wind | 10.0% | 14.3% |
| Solar energy | 1.2% | 5.2% |
| Water | 1.9% | 13.5% |
| Bioenergy | 5.3% | 5.8% |
| Atom | - | 24.6% |
| Others | 0.3% | 1.0% |
| Single-Family Residential Buildings | Multi-Family Residential Buildings | Public Buildings | Production Buildings, Warehouses | Collective Accommodation Buildings | Other * Buildings | Total Buildings |
|---|---|---|---|---|---|---|
| 5,604,000 | 553,000 | 420,000 | 5,116,000 | 3900 | 2,491,000 | 14,187,900 |
| 39.50% | 3.90% | 2.96% | 36.06% | 0.03% | 17.56% | 100% |
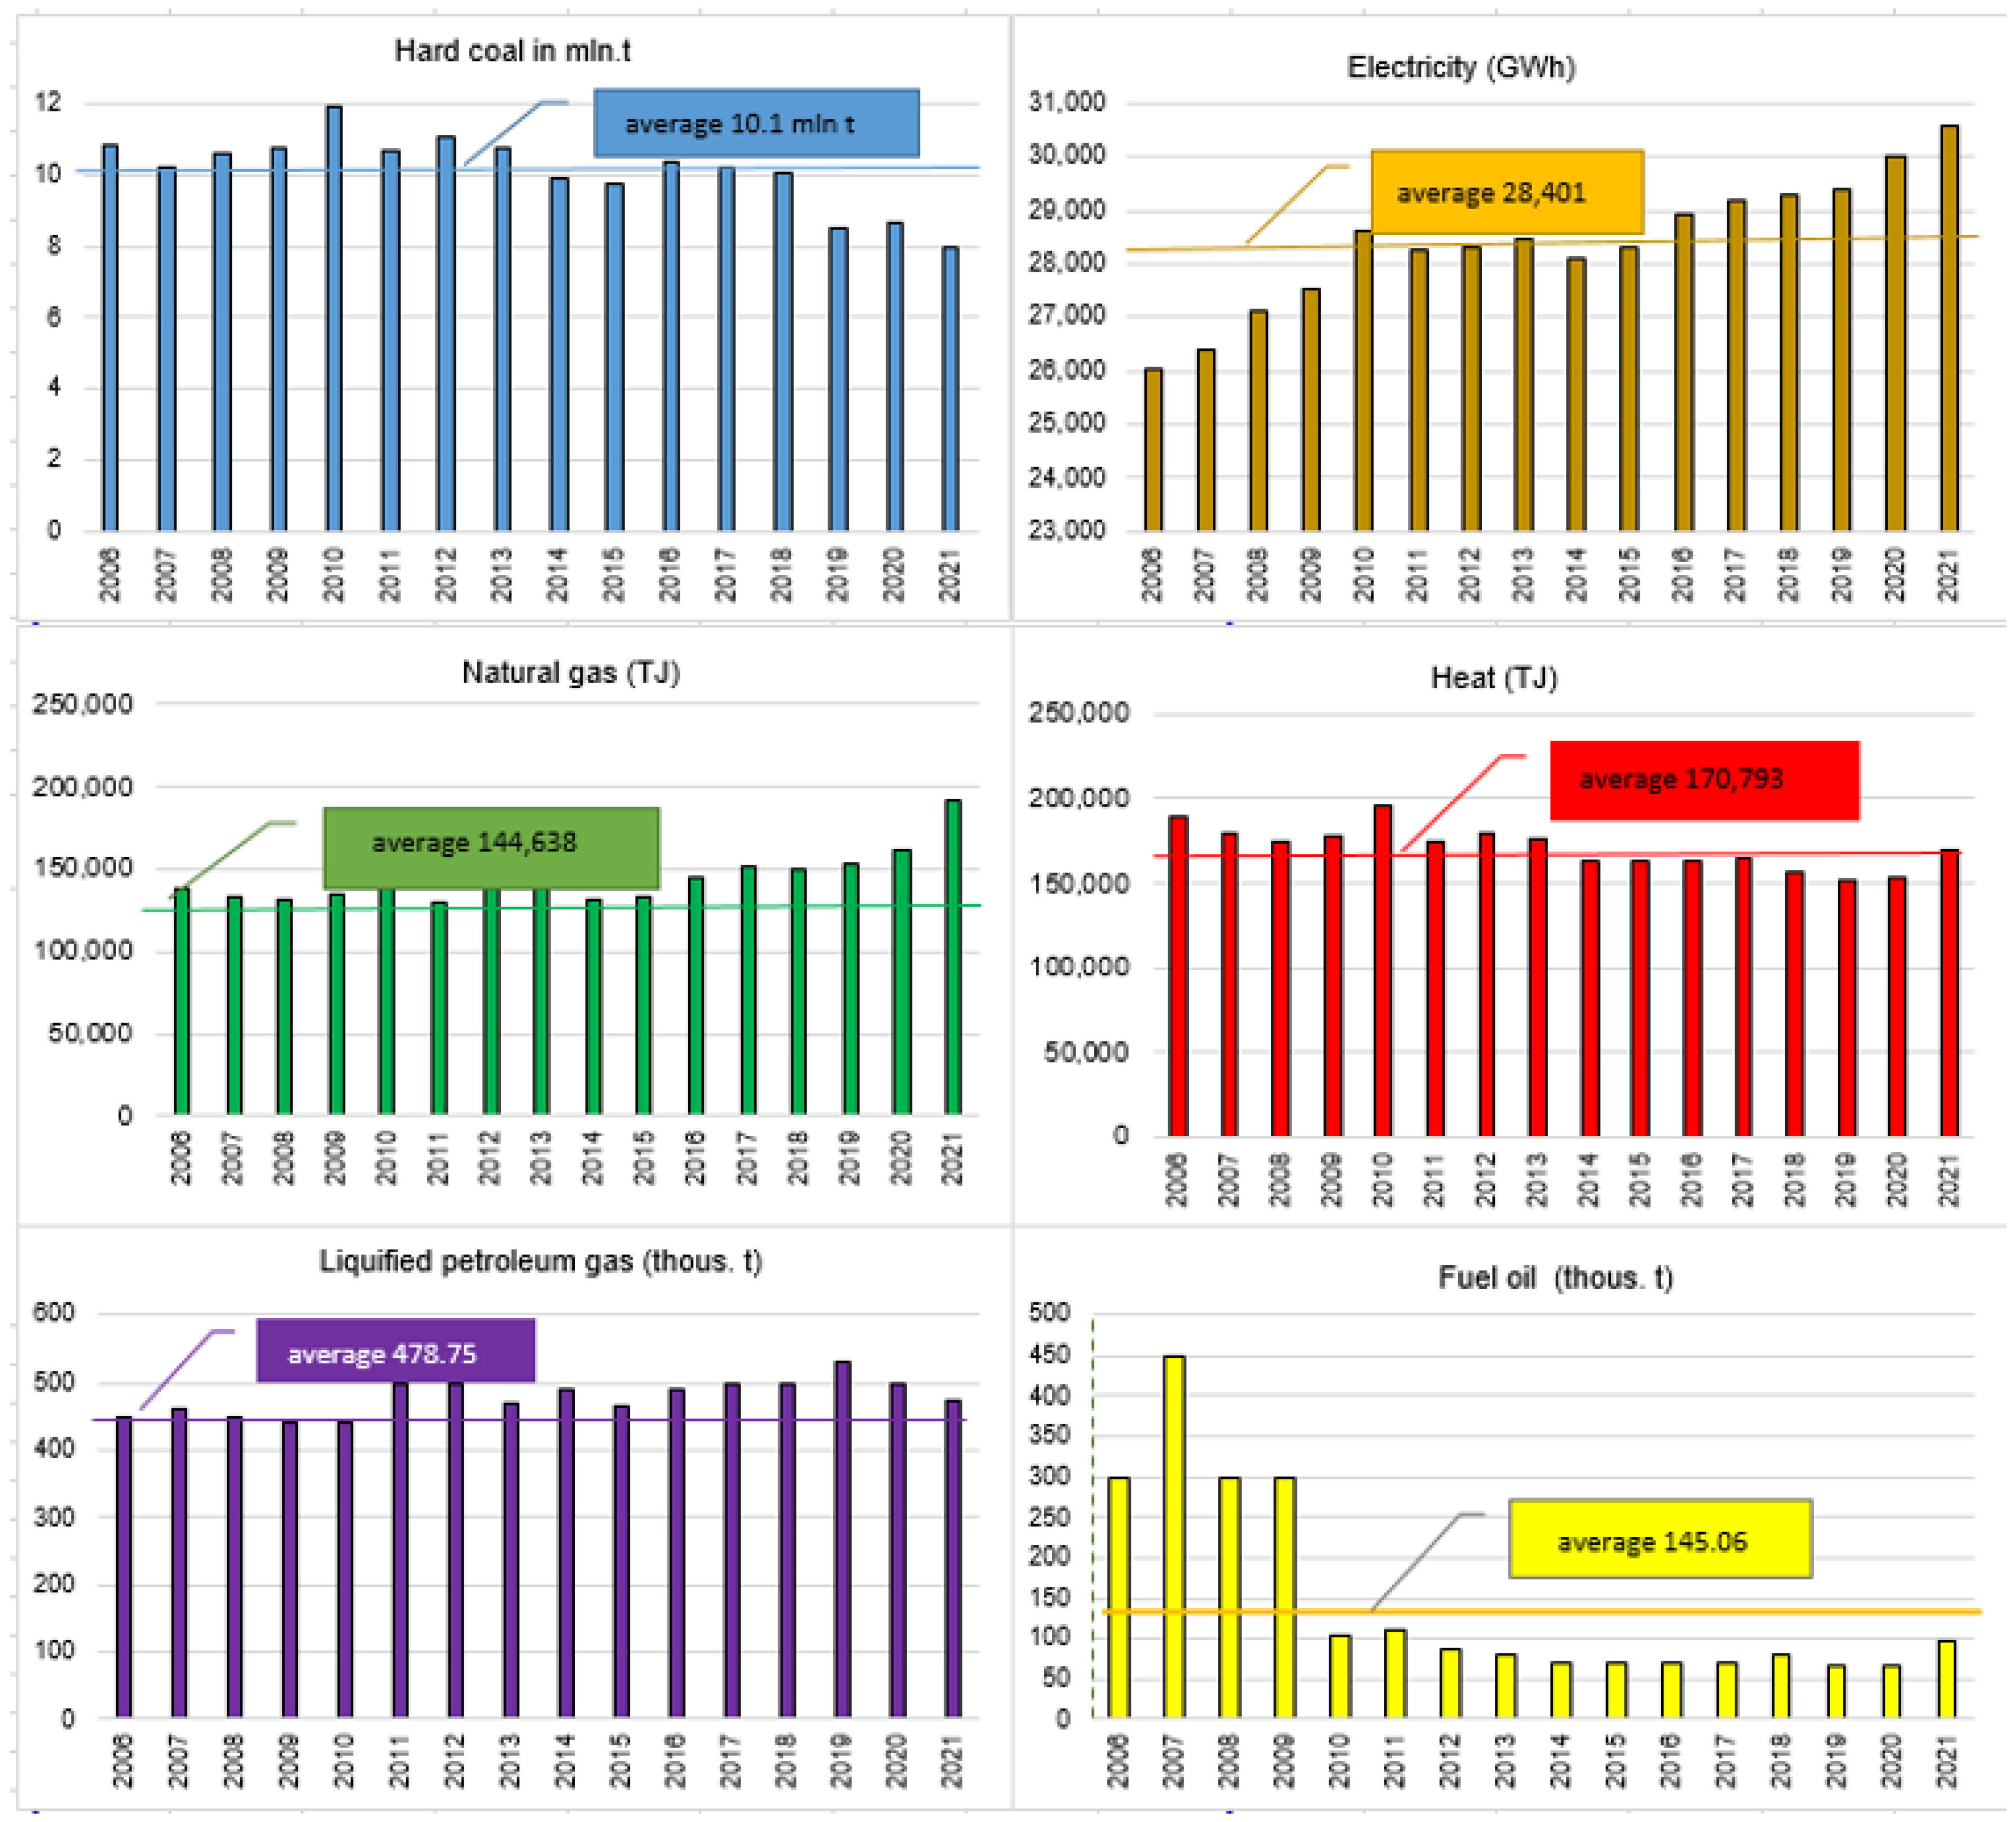
| Year | Hard Coal (Thousand t) | Electricity (GWh) | Natural Gas (TJ) | Heat (TJ) | Liquified Petroleum Gas (Thousand t) | Fuel Oil (Thousand t) |
|---|---|---|---|---|---|---|
| 2006 | 10,830 | 26,022 | 138,685 | 190,000 | 450 | 300 |
| 2007 | 10,230 | 26,369 | 132,622 | 180,000 | 460 | 450 |
| 2008 | 10,600 | 27,115 | 131,450 | 175,000 | 450 | 300 |
| 2009 | 10,780 | 27,534 | 134,822 | 177,500 | 440 | 300 |
| 2010 | 11,900 | 28,614 | 148,427 | 195,000 | 440 | 105 |
| 2011 | 10,640 | 28,258 | 129,246 | 175,000 | 500 | 110 |
| 2012 | 11,020 | 28,318 | 141,397 | 180,000 | 500 | 87 |
| 2013 | 10,770 | 28,442 | 143,189 | 176,000 | 470 | 80 |
| 2014 | 9900 | 28,083 | 131,598 | 163,000 | 490 | 70 |
| 2015 | 9750 | 28,280 | 132,202 | 162,500 | 465 | 70 |
| 2016 | 10,350 | 28,909 | 145,148 | 163,000 | 490 | 70 |
| 2017 | 10,200 | 29,181 | 151,972 | 164,000 | 500 | 70 |
| 2018 | 10,050 | 29,284 | 149,111 | 157,000 | 500 | 80 |
| 2019 | 8500 | 29,393 | 152,348 | 152,000 | 530 | 65 |
| 2020 | 8670 | 30,027 | 160,833 | 152,700 | 500 | 66 |
| 2021 | 8000 | 30,590 | 191,171 | 170,000 | 475 | 98 |
| average | 10,136.88 | 28,401.19 | 144,638.8 | 170,793.8 | 478.75 | 145.06 |
| Forecast for | Hard Coal | Electricity | Natural Gas |
|---|---|---|---|
| (thousand t) | (GWh) | (TJ) | |
| 2023 | 6961.26 | 30,687.52 | 220,598.00 |
| 2024 | 6325.03 | 30,928.16 | 245,103.50 |
| 2025 | 5641.40 | 31,168.80 | 273,864.00 |
| 2026 | 4910.37 | 31,409.44 | 307,211.67 |
| 2027 | 4131.94 | 31,650.08 | 345,478.76 |
Disclaimer/Publisher’s Note: The statements, opinions and data contained in all publications are solely those of the individual author(s) and contributor(s) and not of MDPI and/or the editor(s). MDPI and/or the editor(s) disclaim responsibility for any injury to people or property resulting from any ideas, methods, instructions or products referred to in the content. |
© 2023 by the authors. Licensee MDPI, Basel, Switzerland. This article is an open access article distributed under the terms and conditions of the Creative Commons Attribution (CC BY) license (https://creativecommons.org/licenses/by/4.0/).
Share and Cite
Gajdzik, B.; Jaciow, M.; Wolniak, R.; Wolny, R.; Grebski, W.W. Assessment of Energy and Heat Consumption Trends and Forecasting in the Small Consumer Sector in Poland Based on Historical Data. Resources 2023, 12, 111. https://doi.org/10.3390/resources12090111
Gajdzik B, Jaciow M, Wolniak R, Wolny R, Grebski WW. Assessment of Energy and Heat Consumption Trends and Forecasting in the Small Consumer Sector in Poland Based on Historical Data. Resources. 2023; 12(9):111. https://doi.org/10.3390/resources12090111
Chicago/Turabian StyleGajdzik, Bożena, Magdalena Jaciow, Radosław Wolniak, Robert Wolny, and Wieslaw Wes Grebski. 2023. "Assessment of Energy and Heat Consumption Trends and Forecasting in the Small Consumer Sector in Poland Based on Historical Data" Resources 12, no. 9: 111. https://doi.org/10.3390/resources12090111
APA StyleGajdzik, B., Jaciow, M., Wolniak, R., Wolny, R., & Grebski, W. W. (2023). Assessment of Energy and Heat Consumption Trends and Forecasting in the Small Consumer Sector in Poland Based on Historical Data. Resources, 12(9), 111. https://doi.org/10.3390/resources12090111