Article

Unveiling the Environmental Impacts of Concentrated Latex Manufacturing in Sri Lanka through a Life Cycle Assessment

1
Research Center for Advanced Science and Technology, The University of Tokyo, 4 Chome-6-1 Komaba, Meguro-ku, Tokyo 153-8904, Japan
2
International Centre for Research in Agroforestry (ICRAF), D.P. Wijesinghe Mawatha, Pelawatte, Battarmulle 10120, Sri Lanka
3
UTokyo LCA Center for Future Strategy (UTLCA), 4 Chome-6-1 Komaba, Meguro-ku, Tokyo 153-8904, Japan
4
Faculty of Information Networking for Innovation and Design (INIAD), Toyo University, 1-7-11 Akabanedai, Kita-ku, Tokyo 115-0053, Japan
*
Author to whom correspondence should be addressed.
Resources 2024, 13(1), 5; https://doi.org/10.3390/resources13010005
Submission received: 6 September 2023 / Revised: 20 December 2023 / Accepted: 21 December 2023 / Published: 25 December 2023

Abstract

:
Sri Lanka is a top producer of premium quality concentrated latex (CL), which becomes a base material for dipped rubber products such as gloves and condoms. The processing of CL is resource-intensive, requiring significant amounts of energy, fuel, water, and chemicals. This process leads to various environmental issues such as wastewater pollution, malodor, and greenhouse gas emissions. Several environmental life cycle assessments (LCA) have been conducted at international and local levels to address the aforesaid issues. However, LCAs encapsulating different environmental impact areas on CL processing in Sri Lanka are absent. The study revealed that electricity usage was the main hotspot of the environmental burden, significantly impacting abiotic depletion (fossil fuels), global warming potential, ozone layer depletion, photochemical oxidation, and acidification. Heavy reliance on coal in the Sri Lankan power grid was identified as the root of this trend. The study suggested two viable options to mitigate the environmental impact: installing inverters to centrifuge separators and solar systems in the factories. The second option was deemed more effective, reducing acidification, photochemical oxidation, and global warming potential by approximately 37%, 36%, and 28%, respectively. Relevant officials may immediately consider these improvement options and collaborate to pave the way to a sustainable natural rubber industry.

1. Introduction

Sri Lanka’s natural rubber industry has a rich history dating back to the late 19th century, when British colonial rule introduced it as an economic crop. Over time, Sri Lanka has grown into one of the world’s top global rubber producers. Specifically, Sri Lanka currently ranks 13th in the world in natural rubber production, with an annual production of ca. 77,000 tonnes (in 2021) [1]. Sri Lanka prides itself on producing premium quality natural rubber while being the largest exporter of industrial solid tires and the fifth largest exporter of gloves to the world [2]. The Sri Lankan rubber industry is an important contributor to the country’s economy, with raw rubber and finished rubber products accounting for around one billion dollars of export revenue annually [3]. The industry employs over 200,000 people and produces a wide range of finished products, including tires, surgical gloves, condoms, hoses, cables, and many other items [3,4,5,6].
Fresh latex is acquired by tapping rubber trees, collecting it in liquid form, and then subjecting it to further processing to make raw rubber products [7]. Sri Lanka produces a variety of raw rubber products, including concentrated latex, crepe rubber, and ribbed smoked sheets [2,7]. Among them, concentrated latex holds a significant position as it becomes the base material for various dipped rubber products such as gloves, balloons, condoms, rubber thread, and infant pacifiers, which are essential for humans [2,8]. Around 30% of the natural rubber production in Sri Lanka takes the form of concentrated latex [1]. The production of concentrated latex in Sri Lanka has been predominantly carried out in small and medium-sized factories with a daily capacity of less than 1 tonne [9].
Generally, raw rubber processing is labor-, energy-, and material-intensive, as it uses significant amounts of electric and/or thermal energy, diesel fuel, freshwater, and chemicals at different processing stages [2,7,10,11,12]. Therefore, it has been afflicted with various environmental issues such as contaminated wastewater, malodor caused by rubber particles and chemicals, and the emission of greenhouse gases (GHGs) [9,13,14,15,16,17,18]. Specifically, the wastewater generated by rubber factories is highly acidic with pH levels ranging from 3.5 to 6, and contains high concentrations of chemical oxygen demand, typically between 2000–30,000 mg/L [12]. Moreover, GHG emissions can be as high as 0.5–0.7 tonne-CO2 per tonne of rubber product [19]. As a result, community unrest fueled by water and air pollution has been reported on several occasions in Sri Lanka [16].
Environmental life cycle assessment (LCA) is a popular tool standardized under ISO 14040/44 [20] to evaluate the magnitude of these environmental impacts of a product, process, or service throughout its entire life cycle, from the extraction of raw materials to production, use, and disposal [21,22]. Hence, researchers have used it to quantify the environmental impacts (see Section 3.1 for more details) of various manufacturing processes and thereby to understand underlying hotpots and potential for improvements.
Several LCA studies have been conducted on concentrated latex manufacturing at international and local levels to address the aforementioned environmental issues. For instance, Jawjit et al. [19] and Wijaya and Fukushima [23] estimated the carbon footprint in Thai and Indonesian concentrated latex processing, respectively. They identified that electricity consumption is a crucial factor affecting the carbon footprint. Also, several LCAs are evident in the cases of Thailand [24,25] and Malaysia [26], where they focused on different environmental impact areas other than the carbon footprint (i.e., acidification, eutrophication, human toxicity, and photochemical oxidation). Most of these impact categories were affected by the electricity use of the subjected factories (i.e., acidification, photochemical oxidation, etc.). We have previously assessed the carbon footprint of concentrated latex processing in Sri Lanka and proposed improvement options (i.e., installing inverters and solar panels) to mitigate greenhouse gas emissions [9]. We found that those improvement options (especially the installation of solar panels) could remarkably reduce GHG emissions. However, LCAs encapsulating different environmental impact areas (in other words, impact categories) of concentrated latex manufacture in Sri Lanka are absent. Such an attempt is necessary to know the overall environmental impact of concentrated latex manufacture in the Sri Lankan scenario to ensure environmental sustainability and be competitive in the sustainability-conscious world rubber market. Therefore, we conducted LCA on concentrated latex processing in Sri Lanka with the objectives of: (1) identifying the environmental impacts and underlying hotspots, (2) seeking avenues to reduce the observed environmental impacts; and (3) identifying the degree of improvements once the hotspots are addressed.

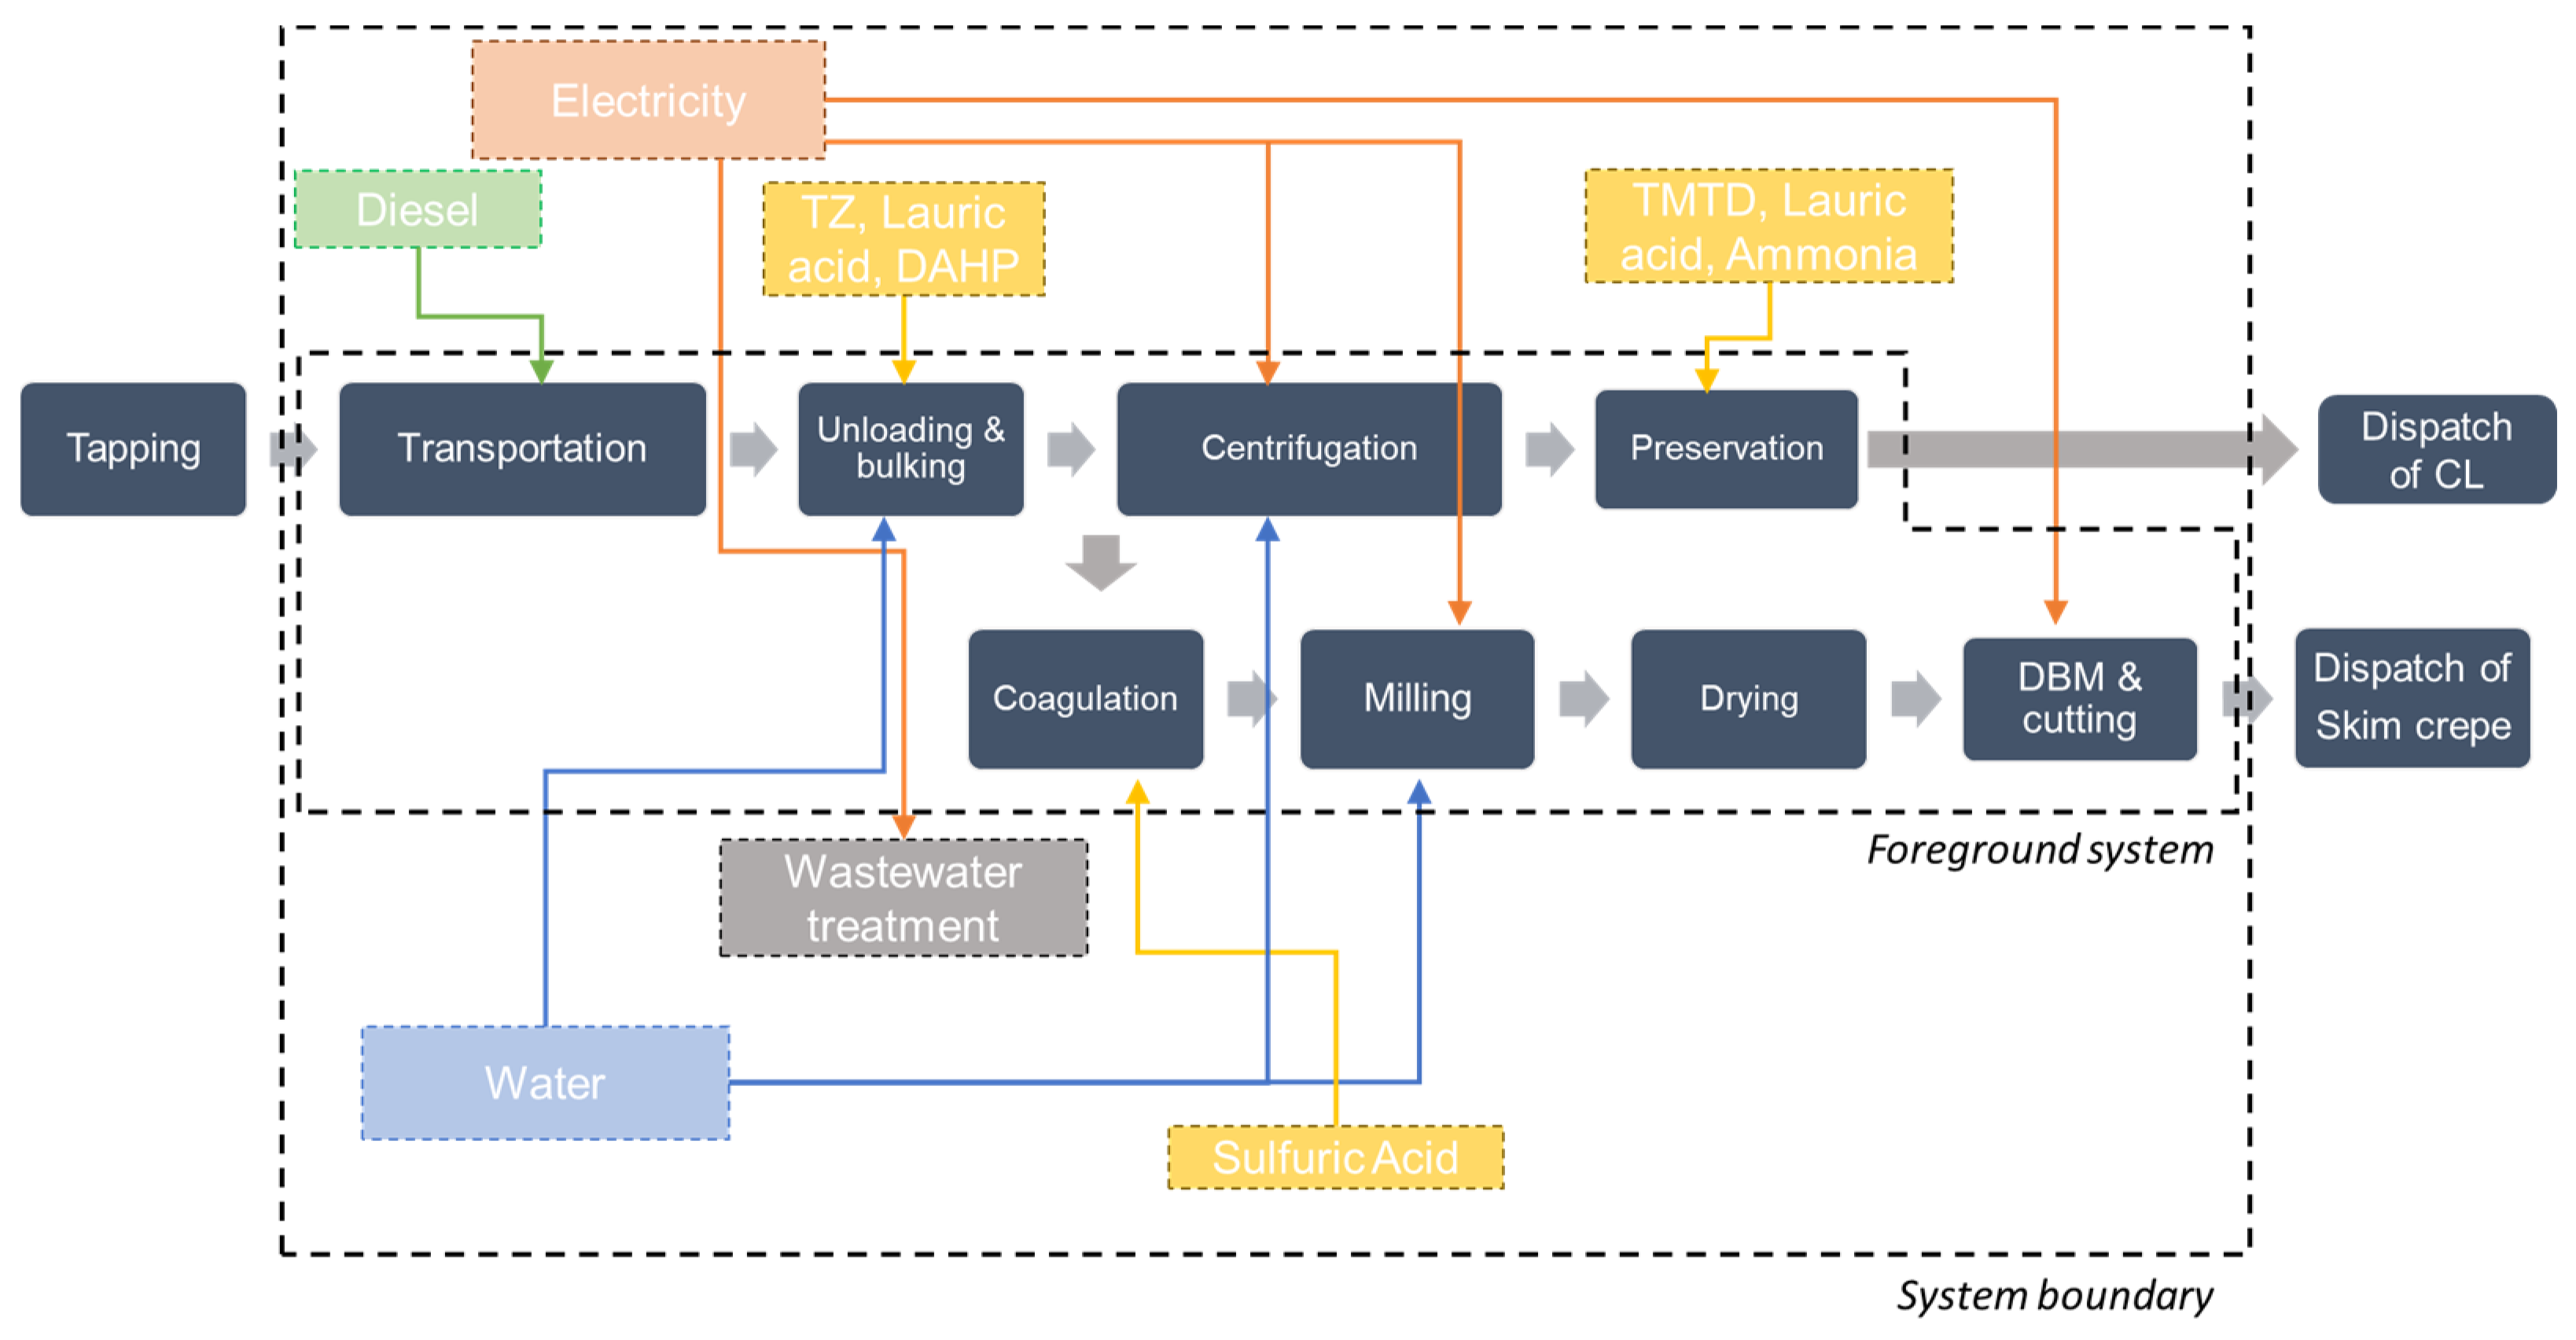
2. Concentrated Latex Manufacture

Figure 1 illustrates the concentrated latex manufacture. Natural rubber is obtained from the sap of rubber trees. A cut is made in the tree’s bark to extract this sap, and a container is attached to collect the latex. During latex collection, ammonia is added to the latex to prevent fungal growth before transportation to the factory. After arrival at the factory, a laboratory test is conducted to measure the dry rubber content (DRC) and ammonia concentration. The latex is then sifted through a 60-mesh sieve and collected in bulking tanks containing a mixture of preservatives, including tetramethylthiuram disulfide (TMTD) and zinc oxide (ZnO) (termed T.Z.), di ammonium hydrogen phosphate (DAHP), and lauric soap. DAHP plays a crucial role in removing magnesium ions (Mg2+), which are known to encourage bacterial growth. The next step involves decantation to remove Mg2+ in the form of magnesium ammonium phosphate. The remaining latex is then separated into concentrated %DRC of about 60% and skim segments DRC of around 3–6%, using centrifuge separators. The concentrated latex is preserved in steel tanks with the ammonia concentration adjusted according to customer specifications (i.e., high ammonia (about 0.7%) or low ammonia (about 0.2%), while the skim latex is coagulated in a separate tank using sulfuric acid (N.B., the audited factories produced low-ammonia concentrated latex unless they got a special request to produce high-ammonia concentrated latex). The coagulum is then removed and pressed to obtain air-dried-skim rubber laces, which are then mechanically pressed into rubber sheets. The sheets are cut into tile-shaped segments and packaged as skim crepe rubber.

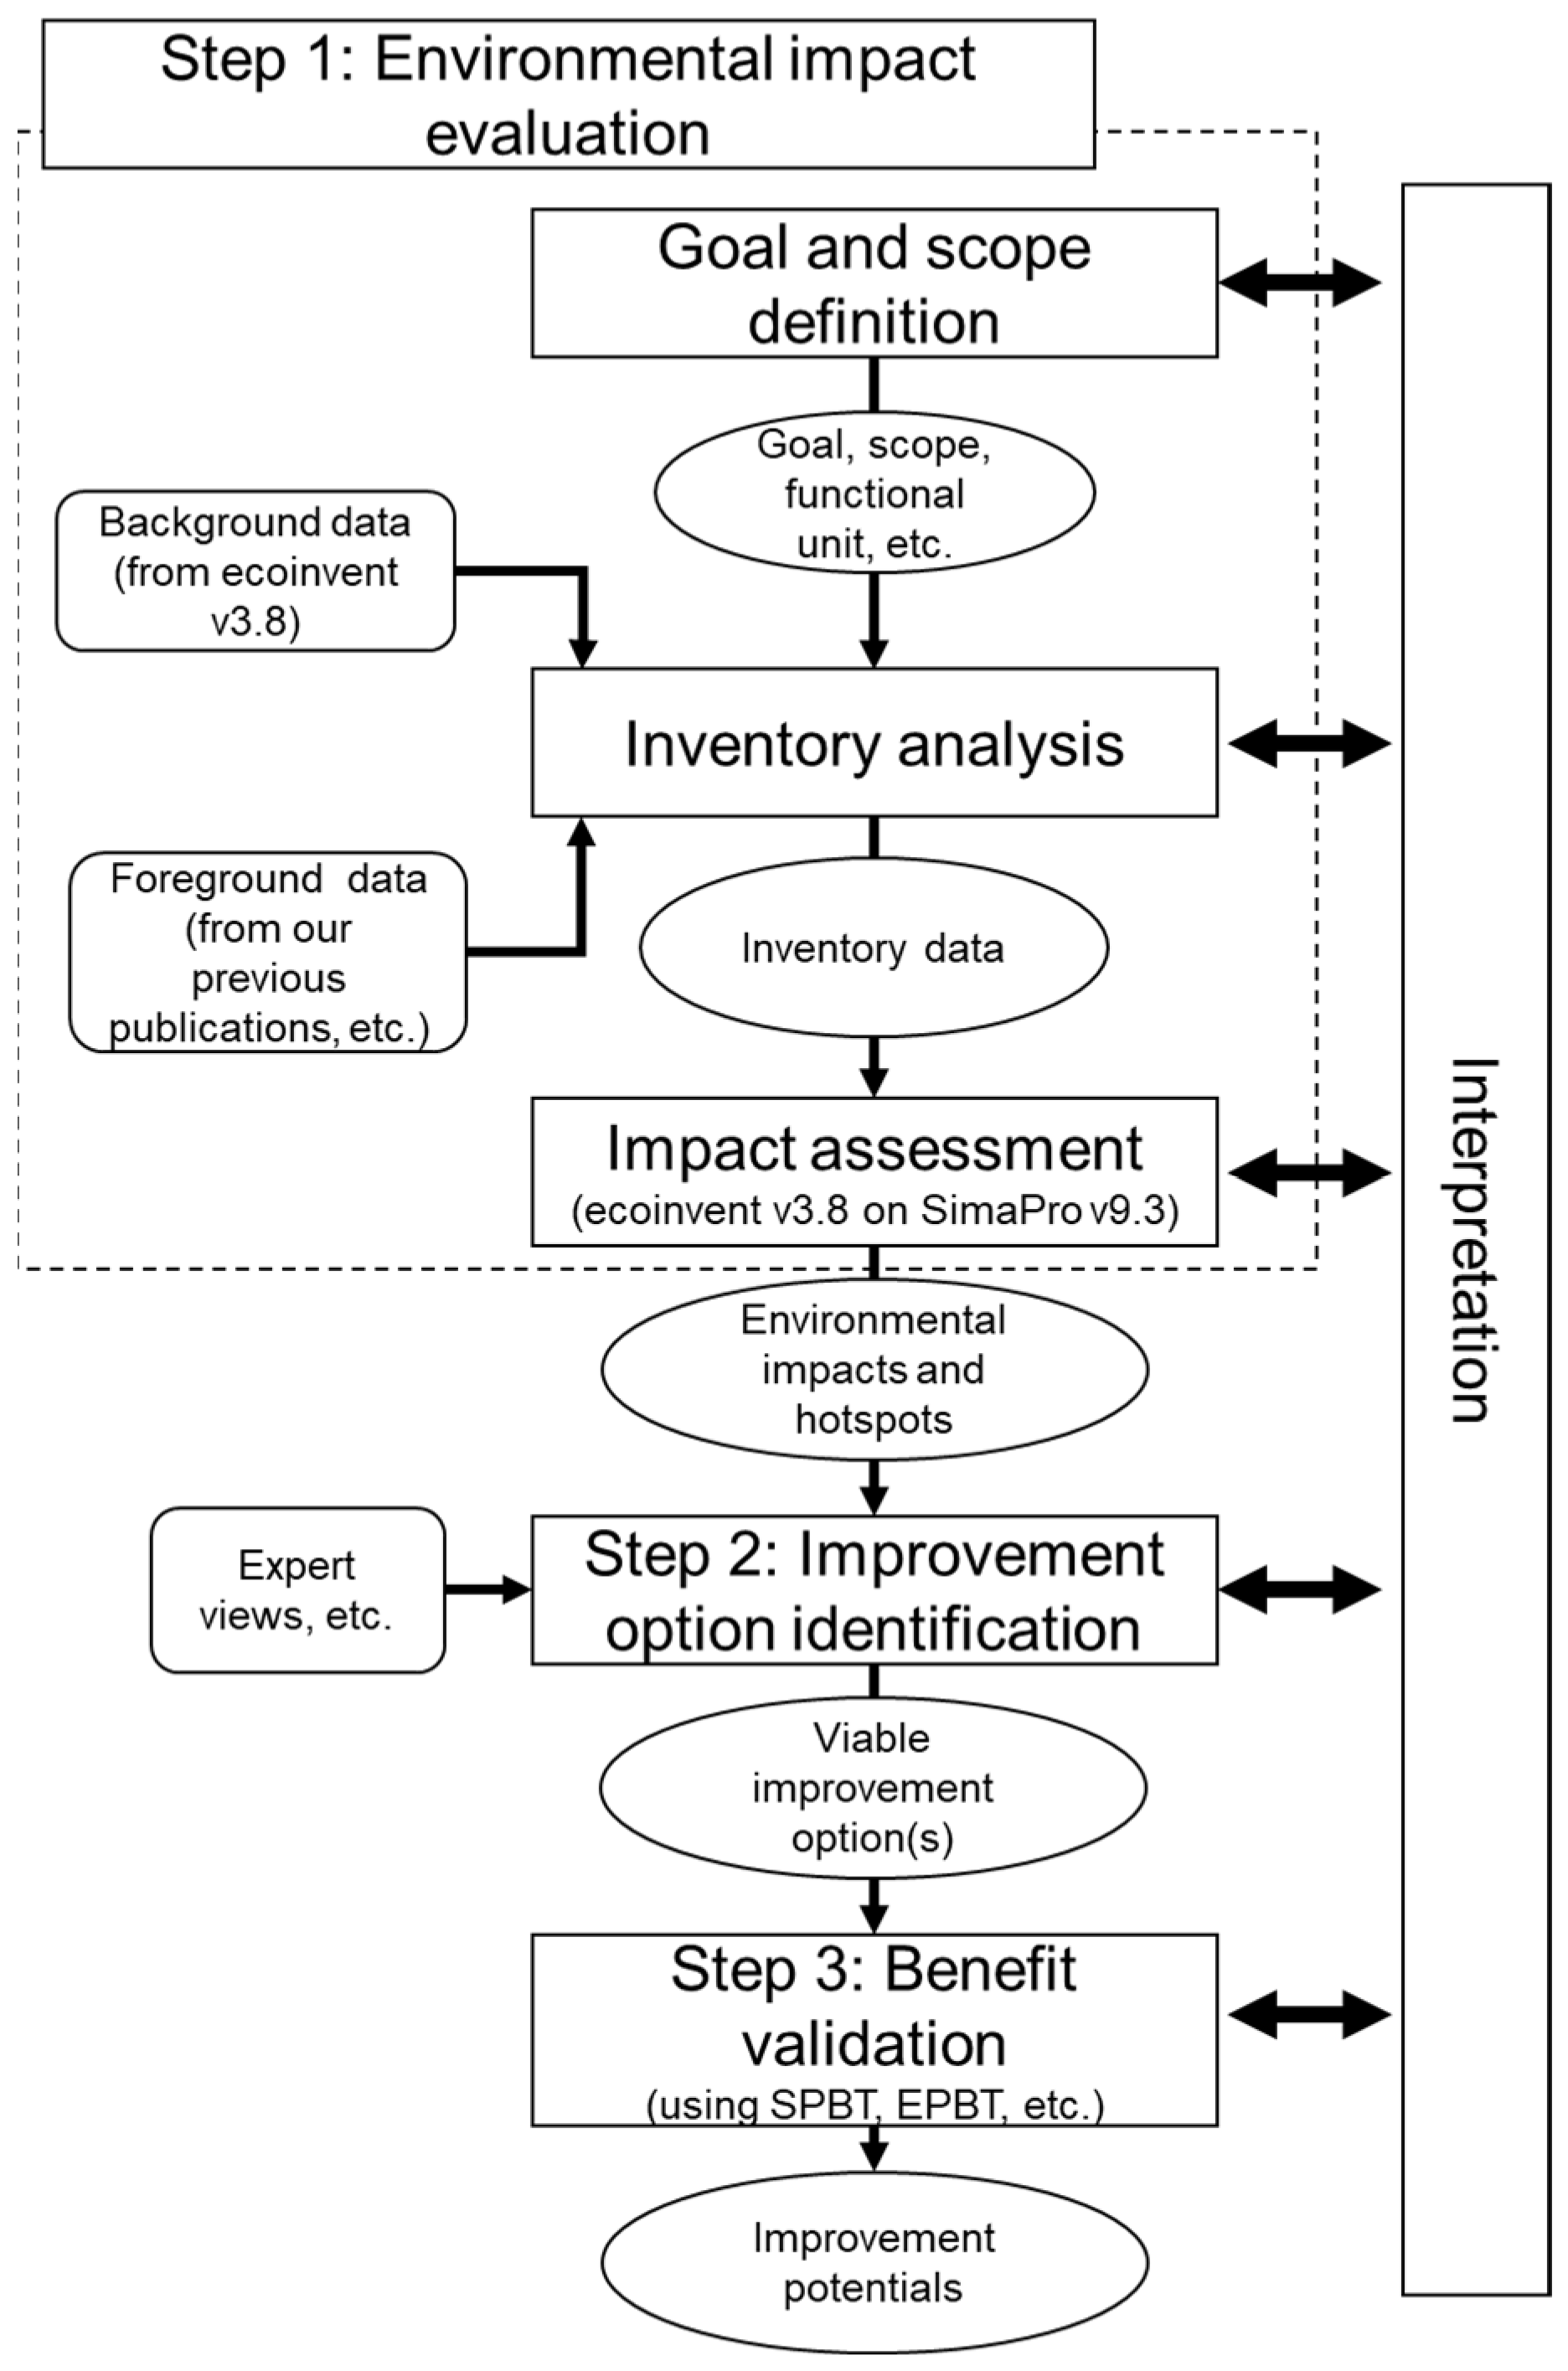
3. Materials and Methods

Our methodology consists of three steps, as depicted in Figure 2: (1) environmental impact evaluation, (2) improvement option identification, and (3) benefit validation.

3.1. Step-1: Environmental Impact Evaluation

LCA is a valuable tool that helps us understand the environmental impact of a product or service throughout its entire life cycle [20,27,28]. The framework of life cycle assessment follows ISO 14040/44 standards and involves four main stages: goal and scope definition, inventory analysis, impact assessment, and interpretation [20,29].

3.1.1. Goal and Scope Definition

During the goal and scope definition stage, the intended use of the assessment is identified, the functional unit of the product or service is assessed, and the system boundaries that will be considered is defined [20,29]. Our study aims to assess the environmental impact of concentrated latex manufacture in Sri Lanka. The system boundary is set as gate-to-gate—in other words, as in-factory assessment, including latex transportation to the factory by bowser trucks (see Figure 1). The functional unit is set as “processing 1 tonne of rubber in concentrated latex”.

3.1.2. Inventory Analysis

The inventory analysis stage involves collecting data on the inputs and outputs of the product or service regarding the system boundary defined in the previous stage. The data is then organized into a life cycle inventory [20,29].
There are two types of inventory data: foreground data and background data [20]. Foreground data is collected specifically for the system being analyzed. On the other hand, background data are used as inputs for the assessment but are not specific to the product being evaluated. In Figure 1, the processes of the foreground system are depicted in a darker color, while those for background systems are shaded with lighter colors.
Accordingly, the foreground data, DRCs, and amounts of field latex, chemicals, water, electricity, and diesel uses, concentrated latex, and skim crepe rubber as output was known by referring to the data of two of our previous publications (Dunuwila et al. [9] and Dunuwila et al. [13]), making it possible to estimate GHG emissions of concentrated latex manufacture. The data for these publications were gathered from three concentrated latex factories in the Mawanella, Danowita, and Polgahawela municipalities in Sri Lanka via field observations. To be specific, on-site measurements were conducted to determine the rubber throughputs, electricity usage, and water consumption. The percentage of dry rubber content (%DRC) in the washed-out latex (generated from utensil washing) was determined by laboratory tests, and interviews with factory officers were used to assess other potential rubber losses. Data on diesel consumption, %DRC values, outputs of concentrated latex and skim crepe rubber, as well as water quantities for cleaning equipment, such as bowser tanks and centrifuge bowls, were gathered from factory logbooks and interviews with various personnel, including factory officers, staff members, estate managers, and owners. All the factory-wise data were averaged to represent the concentrated latex manufacture in Sri Lanka used in impact assessment calculations (see Table 1).
In addition to the main product, concentrated latex, skim crepe rubber is produced as a by-product, which requires additional inputs for processing. To observe the real environmental impact of concentrated latex manufacture in Sri Lanka, the inputs used in skim crepe rubber were also considered for emission calculations per processing 1 tonne of rubber in concentrated latex. Hence no allocation of impacts for by-products was in place.
Data for background processes (see Figure 1) was extracted from the ecoinvent database v3.8 allocation at the point of substitution (APOS) system models [30]. The ecoinvent APOS model includes the impacts of recycled content, while the cut-off model assumes that recycled materials have no burdens [31,32]. For this reason, we preferred the APOS version in our study, aiming for a more comprehensive life cycle impact assessment outcome that accounts for any impacts from recycled materials present in the background processes used for the LCA (background process data for TMTD could not be observed, and is therefore excluded from impact calculations; see Table S1 for representative processes in the ecoinvent database v3.8 that are considered for study). Gathered foreground and background data were then used to map the manufacturing system on Sima pro v9.3 [33] and conduct the impact assessment.

3.1.3. Impact Assessment

In the impact assessment stage, the potential environmental impacts of the product or service are evaluated based on life cycle inventory data [20,29]. Due to the lack of Sri Lanka-specific impact assessment methods, the CML-IA baseline V3.07/World 2000 method [34], which was developed by the Institute of Environmental Science in Universetitet Leiden, Netherlands, was deployed herein as the impact assessment method. The eight impact categories were considered; Abiotic resource depletion in non-fossil resources, expressed as kg of Sb eq; abiotic resource depletion in fossil resources, expressed as MJ; global warming potential with a period of 100 years (GWP100); ozone layer depletion potential, expressed as kg of CFC-11 eq; human toxicity, expressed as kg 1,4-dichlorobenzene (1,4-DB) eq; photochemical ozone creation potential, expressed as kg of C2H4 eq;cidification potential, expressed as kg of SO2 eq.; and eutrophication potential, expressed as kg of PO43− eq.

3.1.4. Interpretation

The interpretation stage involves analyzing the results of the previous stages and drawing conclusions about the environmental impact of the product.

3.1.5. Sensitivity Analysis

The primary purpose of conducting a sensitivity analysis is to examine the impact of various commonly used impact assessment methods on the final output of the LCA study [21,22]. Hence, variations in the impacts were investigated with another three commonly used impact assessment methods, i.e., Impact 2002+ [35], Eco-indicator 95 v2.06 [36], and Environmental Product Declarations (EPD) 2013 [37]. Impact 2002+ was developed by the Swiss Federal Institute of Technology, and was based on IMPACT 2002 [35]. The Eco-indicator 95 was developed through a collaborative effort by PRé consultants, Philips Consumer Electronics, NedCar, Océ Copiers, Schuurink, CML Leiden, TU-Delft, IVAM-ER (Amsterdam), and CE Delft as part of the Dutch NOH program [34]. EPD 2013 was specifically designed to create EPDs by using impact categories from the CML baseline 2000 method [37].

3.2. Step-2: Improvement Proposals

This step identifies viable improvement options to reduce the environmental hotspots identified in the previous step, and is based on expert views, literature, and so forth.

3.3. Step-3: Validation of Improvement Options

At this stage, we validate the proposed improvement options to know the level of reductions that can be achieved. Here, the calculations were performed on Sima pro v9.3 [33], reflecting the reductions of the hotspots. To gain an insight into the point in time that money can be recovered after an investment (i.e., improvement option), we calculated the simple payback time using Equation (1). Similarly, environmental payback time (EPBT) was calculated to know the efficiency of the investment in recovering the embodied environmental burdens associated with the improvement option (see Equation (2)) [9].
SPBT = Initial   investment Annual   monetary   savings
E P B T i = E I i A I i  
where   E P B T i is the environmental payback time related to the environmental impact described by ith impact category, E I i is the embodied environmental impact described by ith impact category bound with the option, and A I i is the avoided impacts of ith impact category by the option on an annual basis.

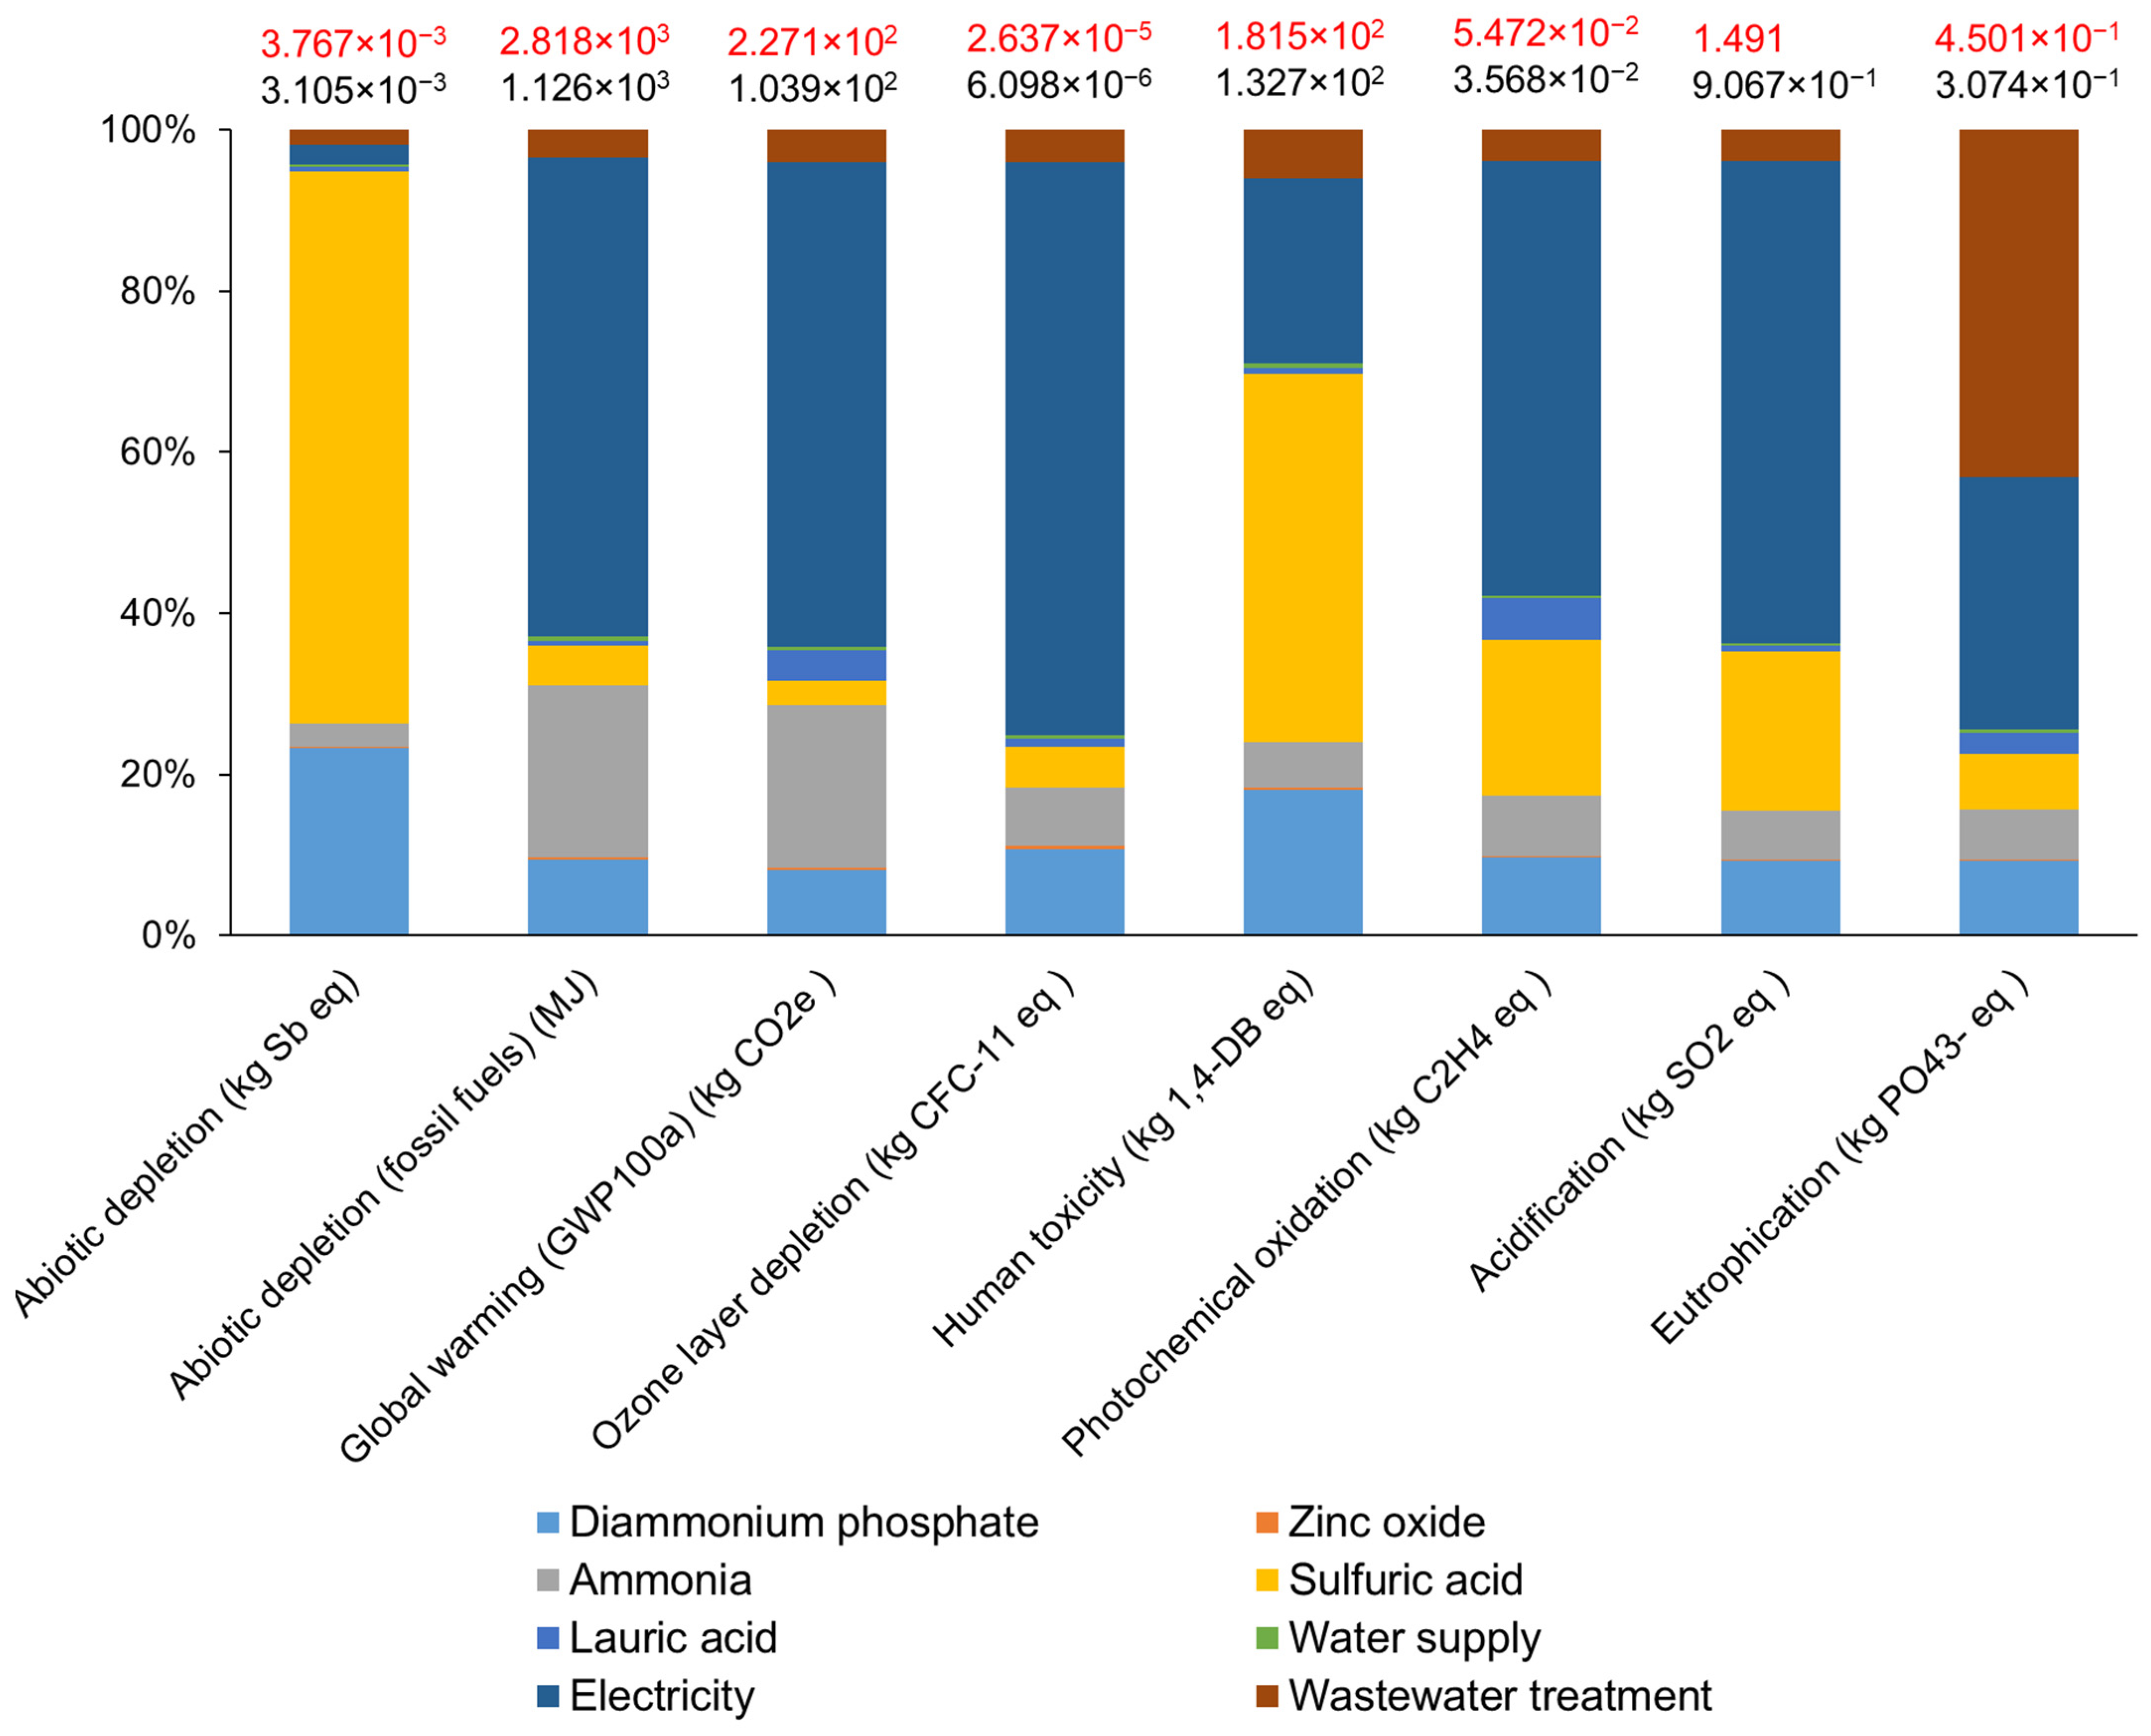
4. Results and Discussion

4.1. LCA Results

Table 1 encapsulates inventory data related to processing 1 tonne of concentrated latex in the audited factories. The column labeled “Mean” holds the average inventory values used for the impact assessment. Accordingly, DRCs of the factories tend to vary within the range of 29–32% (N.B., DRC of field latex is calculated by dividing the dry weight of the field latex by the weight of the same). A significant variation can be observed in ammonia usage, which is always tailored to customer-specific amounts. Due to this reason, officials at Factory C could not provide a credible estimate for ammonia usage; hence it was excluded from mean value calculations. Fresh water is used to wash bowsers and bulking tanks, the cone of the centrifuge machine, and cool machinery and to clean skim crepe rubber during milling. During the washing process, around 2–3% of rubber particles are washed out and ultimately end up in wastewater. Those particles are recovered at the trap tanks of the factories and re-milled to get a lower grade of skim crepe rubber; however, this process had been excluded from the calculation as only the higher grade (pure) of skim crepe rubber was in focus. Electricity remains the only energy source for the manufacturing process, where the centrifuge process consumes approximately 60% of it. In Sri Lanka, skim crepe rubber is dried naturally (air-dried) without the need for liquid petroleum gas (LPG), which is not the case in Thailand [24]. This approach could reduce energy consumption and emissions despite being a lengthier process. Around 88% of dry rubber ends as concentrated latex with around 60% of DRC. The same for the skim crepe rubber is 3–6%. Wastewater is the main component of waste, a larger proportion of which is derived from the freshwater used for cleaning the trucks and bulking tanks and the bowls of centrifuge separators. Sludge is sourced from non-rubber particles that precipitate during decantation at the bulking stage and are left at the bottom of the bowl after centrifuging.
The emissions of specific pollutants responsible for 80% or more of environmental impacts per 1 tonne of concentrated latex are presented in Table 2. These pollutants are discussed alongside the impact assessment results in following paragraphs.
Impact assessment results are depicted in Figure 3 and Table S3 in the supplementary material; Table S3 encapsulates the overall impacts per impact category with absolute values (for processing 1 tonne of rubber in concentrated latex), while Figure 3 depicts the contributions of all in-house activities (excluding transportation of field latex) of the impacts with absolute total impacts, excluding and including transportation of field latex. Of all in-house activities, electricity consumption has become the most significant contributor to five out of eight impact categories, i.e., abiotic resource depletion (fossil fuels), global warming potential, ozone layer depletion potential, photochemical oxidation, and acidification potential. Electricity generation in Sri Lanka heavily relies on fossil fuels (about 50%) [38] and is therefore subjected to the aforementioned tendency. For instance, if further examined, coal extracted for electricity generation had been identified as the main component causing abiotic depletion (fossil fuels). Similarly, CO2 derived from coal and crude oil burning during electricity generation tends to account for a larger proportion of global warming potential. Coal and crude oil burning can cause SO2 emissions as they naturally contain certain amounts of sulfur, significantly causing photochemical oxidation and acidification. Halons and CFCs are released during the petroleum refinery, as they are used as fire suppressants. Sulfuric acid has become the largest contributor to abiotic depletion and human toxicity. The former is due to the heavy metals present in copper ore that is used to produce copper concentrate for sulfuric acid production. The latter has been affected due to the discharge of heavy metals like Thaliam to water (N.B, termed the most toxic metal on earth, is derived from the waste disposal of sulfidic tailings in copper mine operations) and Nickel (during the smelting of copper concentrate to produce sulfuric acid, nickel emissions can occur if the copper concentrate contains nickel impurities) and toxic gases alike SO2 (SO2 emissions may occur due to an incomplete reaction of SO2 into SO3 on the catalyst). The contribution of electricity use and wastewater treatment to eutrophication is almost equal. The leaching of PO43− and nitrates into the water from coal mining residue and wastewater are the primary causes, respectively. Meanwhile, DAHP and ammonia showed relatively lower contributions in all impact categories. On the contrary, DAHP was found to be the largest contributor to eutrophication while the same applied to ammonia and human toxicity in Thai case studies [24,26]. The former can occur because the Thai power grid is less dependent on coal, unlike the Sri Lankan power grid. The latter is due to low ammonia use in the Sri Lankan case (i.e., the audited factories produced low-ammonia concentrated latex unless they got a special request to produce high-ammonia concentrated latex; given this, we can assume no significant change in the result, even if the ammonia value of Factory C is accounted for).
Table 3 summarizes the results of sensitivity analyses of impact assessment methods. Accordingly, larger variations are not evident in global warming and ozone layer depletion (maximum change from baseline around 1%). However, acidification and photochemical oxidation tend to vary across the impact assessment methods. For instance, acidification in IMPACT 2002+ has been magnified by about 340%, and the same applies to the CML method. Further, the enlargement of photochemical oxidation was recorded as 50%. However, relatively smaller variations were apparent under Eco-indicator 95 and EPD (2013), in relation to the same impact categories when the CML method was applied.

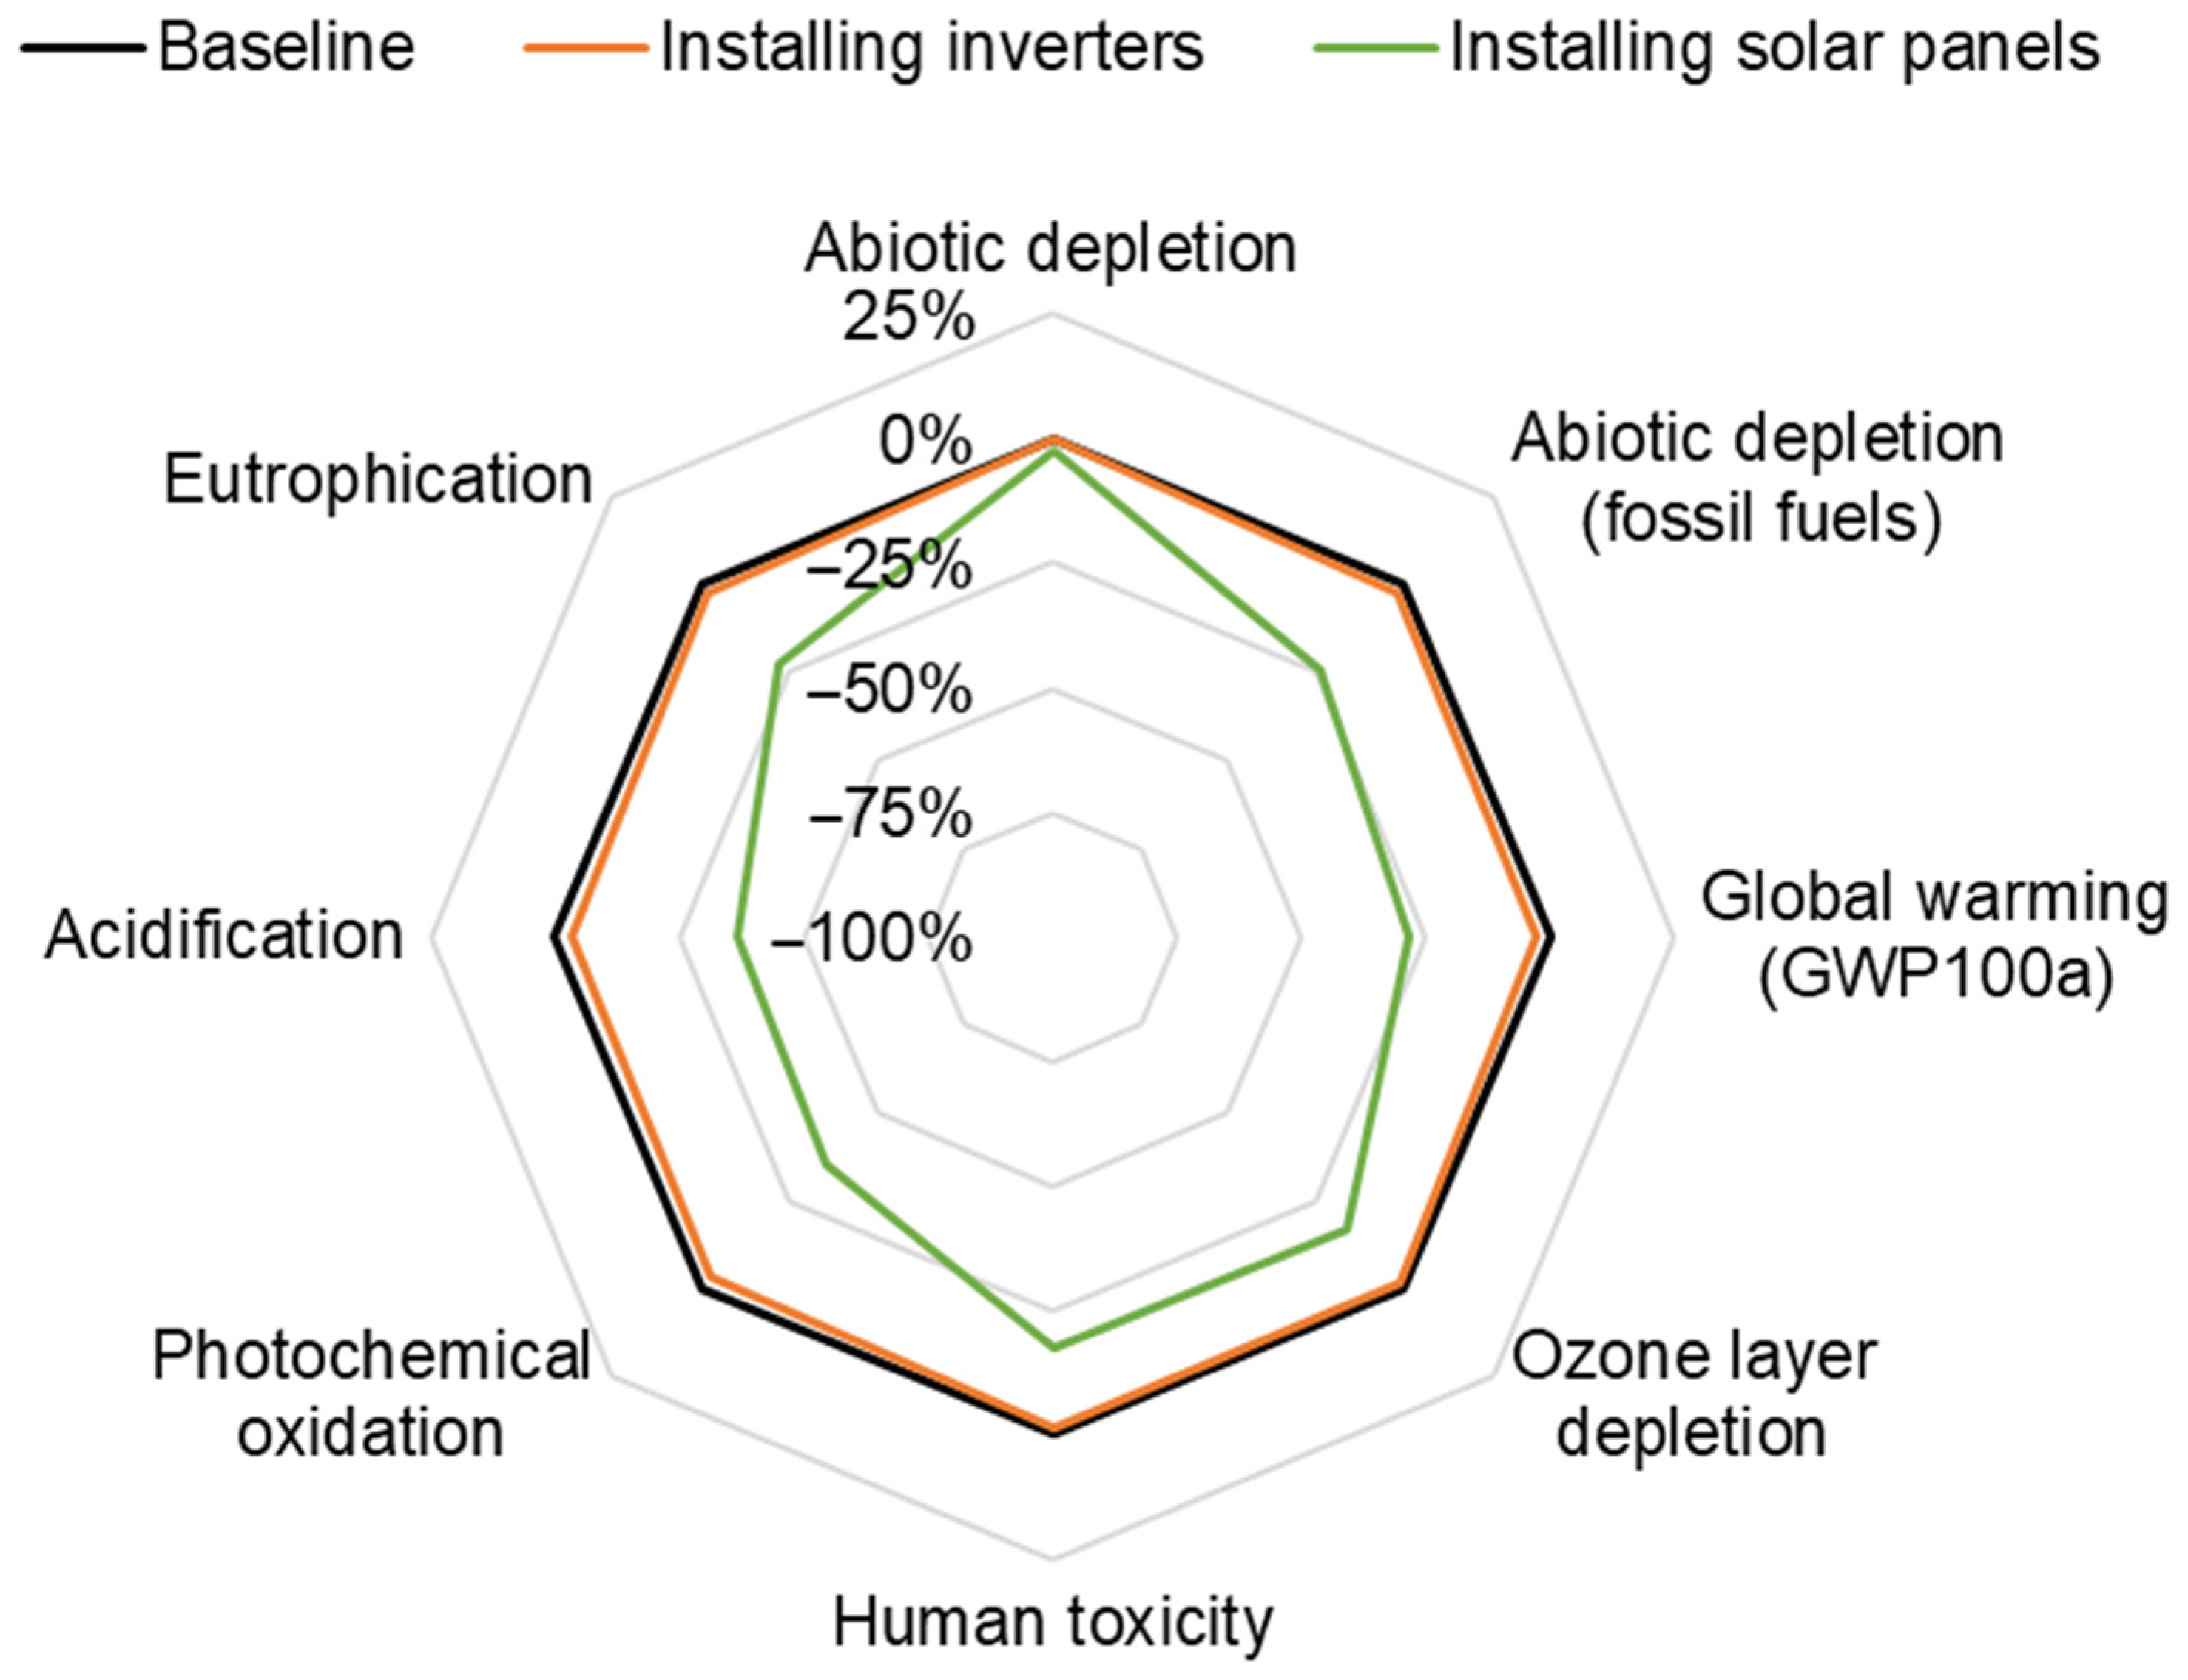
4.2. Improvement Options to Address the Hotspots

The environmental impacts within factories have primarily been influenced by electricity usage, making it a significant area of focus for improvement. After consulting with factory officials from each factory and referring to the literature, two viable options for reducing electricity consumption have been identified: (1) installing inverters in centrifuge separators; and (2) installing solar panel systems in all factories.

4.2.1. Option-1: Installing Inverters

In the manufacturing process of concentrated latex, centrifuging has been identified as the most electricity-intensive process. The factories have been using outdated centrifugal machines equipped with clutch and gear systems, which are known to consume more electricity due to the inherent friction of clutch plates during the start-up period. To address this issue, the installation of inverters has been proven to be effective. Inverters gradually distribute electrical current to the machine until it reaches the desired rotation, which reduces electricity loss during start-up to a minimum. This practice can result in a reduction of electricity consumption by 10–12% [19,24]. The appropriate inverter capacities and installation costs were recommended by an electrical superintendent in Ceylon Electricity Board, and the prices of inverters were obtained by contacting a retailer in Sri Lanka. Due to the lack of a specific dataset for inverters for centrifuge separators, embodied environmental impacts were calculated by referring to the average inventory data of a control unit on the ecoinvent database v3.8 (see Table S1 in the supplementary material for more information).

4.2.2. Option-2: Installing Solar Panels

The proposal of installing solar panels as an alternative renewable source of electricity was made due to the abundance of sunlight in the tropical climate where factories are located [9]. To gather information on appropriate system capacities, cost per kW, roof area, tariff schemes, and total project costs, a specialized company in Sri Lanka was contacted. Embodied emissions of the respective solar system were estimated based on the inventory data of photovoltaic flat-roof installation on the ecoinvent database v3.8 (see Table S1 supplementary material for more information).

4.3. Reduction Potentials of the Options

Figure 4 illustrates the reduction potentials of two options.

4.3.1. Option-1: Installing Inverters

As per Figure 4, the largest reductions were apparent in acidification and photochemical oxidation, which were recorded as 3.4%, and 3.3%, respectively. Global warming, eutrophication, and abiotic depletion (fossil fuels) also showed some reductions, of 2.6%, 2.2, and 2.2% respectively. The improvements in other impact categories remained negligible. The simple payback time for this option was recorded as around 2 years. Moreover, the shortest EPBT of 0.03 years was recorded for acidification and global warming potential, and while the longest for abiotic depletion (approximately 9 years).

4.3.2. Option-2: Installing Solar Panels

Reductions under this option were greater than those under Option-1 (see Figure 4). Similar to Option-1, the largest reduction was recorded for acidification and photochemical oxidation, of around 37 and 36%, respectively. Global warming, eutrophication, and abiotic depletion (fossil fuels) recorded 28%, 24%, and 22% reductions, respectively. Meanwhile, the smallest was for Abiotic depletion, of around 2%. The simple payback period was 9–10 years. Payback time under Acidification was found to be the shortest (2 years), and was longest (224 years) under abiotic depletion.
This study emphasizes the significance of implementing LCA in the natural rubber industry to pinpoint hotspots and potentials for improvement once those hotspots are addressed. Considering the potentiality of the improvement options, implementing Option-2 would be the most ideal for the time being. In addition to the directly achieved environmental impact reductions, it may have indirect implications. For instance, Option2’s reduced demand for electricity generated by fossil fuels helps minimize the risks associated with the extraction, processing, transport, and usage of those fuels. These risks include contamination of the environment through mining operations, drilling leaks, and explosions [39]. The surge in electricity rates caused by the elevated inflation rate in Sri Lanka could serve as a catalyst for factory officials to implement Option2 [40]. Efforts to achieve environmental sustainability in factories have the potential to generate favorable public perception towards the factories within their local communities, thereby fostering positive relationships [9,14,15]. This would also enhance the morale of workers, enhance teamwork and promote continuous improvement, while simultaneously contributing to a surge in demand for natural rubber. In-factory electricity demand can be further reduced by synchronizing motor start-ups to avoid peak loads and installing new centrifuge machines [9].
A comparison of environmental impacts caused by concentrated latex, as observed by various overseas studies and our own study, is presented in Table 4. Our results indicate that Indonesia had the greatest global warming potential, which is consistent with the heavy reliance on coal for electricity generation in that country. In fact, 66% of the electricity in Indonesia was derived from coal as of 2020 [41]. Sri Lanka also indicated a high Global warming potential value, which may be attributed to its significant coal dependence (43% of electricity is from coal). In contrast, Thailand had the lowest Global warming potential values due to its predominant use of natural gas, which emits lower CO2 than coal. The human toxicity values in Sri Lanka were found to be significantly higher than those in Thailand, which could be due to the greater use of sulfuric acid by the former (20.19 kg in Sri Lanka versus 13.4 kg in Thailand). The same trend was observed for eutrophication, which can also be attributed to Sri Lanka’s coal dependence. Specifically, our study found that leaching of PO43− from coal mining residue could significantly affect eutrophication. On the other hand, photochemical oxidation and acidification did not significantly vary across the countries.
Sulfuric acid reduction may be considered in the future to achieve further reductions in environmental impacts. Maintaining ammonia addition to fresh latex within the range of 0.4% to 0.5% can achieve the necessary pH level in skim latex for coagulation without any need for excessive sulfuric acid dosing. This system has been proven to significantly reduce sulfuric acid usage in Thai concentrated latex factories by up to 200 kg per 1 tonne of skim crepe rubber [42]. Stirring of sulfuric with skim latex, using de-ammonization tower, and constructing long troughs that lead to coagulation ponds are other measures that could be considered to reduce the use of sulfuric acid [43]. Though not considered herein, the reduction of diesel use can also significantly reduce environmental impacts, as transportation of fresh latex was found to be one of the significant contributors to the identified environmental impacts. Regular maintenance of engines, use of electric vehicles and biodiesel as fuel, and optimization of load efficiency could also be considered [9]. The effectiveness of these measures need to be investigated by future research.
Once a hotspot is addressed, the prominence goes to another, making it a new hotspot. Therefore, hotspots and improvements must be considered following an iterative process of life cycle assessment (e.g., PDCA cycle), to alleviate environmental impacts to a minimum. This may improve the positive image of the product being manufactured, which can in turn can increase sales.
This study stresses the importance of implementing cleaner production practices to mitigate diversified environmental impacts in the natural rubber industry. However, the successful adoption of these practices can be hindered by various barriers, which include a lack of expertise in sustainable manufacturing practices and industrial process analytics, a focus on profitability and market share over sustainability, and the high costs of investment and infrastructure upgrades. To overcome these challenges, it may be useful to offer workshops on sustainable manufacturing and industrial process analytics, provide incentives to factories to implement sustainable practices, and encourage knowledge sharing through assembly sessions on social media platforms. For sustainable financing, mechanisms for the payment for ecosystem services become mandatory. By addressing these barriers, we can create a more environmentally conscious natural rubber industry.
The overall sustainability of raw rubber processing can be achieved by considering tradeoffs between three dimensions of sustainability: economic, environmental, and social. Although studies are available that individually analyze those dimensions in the natural rubber sector [9,13,14,15,16,39,44], this emphasizes the need for a sustainability assessment that simultaneously encapsulates all three dimensions of sustainability of raw rubber manufacture with the use of life cycle costing, LCA, and social life cycle assessment. Extending the scope of this sustainability assessment to rubber cultivation may not only uncover various sustainability-related issues in the natural rubber industry but also help establish overall sustainability in the industry.

5. Conclusions

The first record of a comprehensive LCA conducted on concentrated latex manufacture in Sri Lanka is reported here. With the quantification of environmental impacts, the study revealed that the main contributor to the environmental burden was electricity usage, which significantly impacted the impact areas of abiotic depletion (fossil fuels), global warming potential, ozone layer depletion, photochemical oxidation, and acidification. Heavy reliance on coal in the Sri Lankan power grid was identified as the root of this trend. The study suggested two viable options to mitigate the environmental impact: installing inverters to centrifuge separators and solar systems in the factories. The second option was deemed more effective, reducing acidification, photochemical oxidation, and global warming potential by approximately 37%, 36%, and 28%, respectively. However, this option had a longer payback period than the first, with a value of 9–10 years compared to 0.03 years. Environmental payback indicators showed a similar trend, with a shorter global warming payback time for the former option (around 1 year) than the latter (around 2 years). Officials in the factories may implement Option2 in the first place.
The implications of our study extend beyond the direct impact of natural rubber production in Sri Lanka. Our findings highlight the critical role of adapting the global rubber industry to encourage more sustainable practices. For manufacturers, our research offers a stepping-stone towards refining their processes to reduce environmental implications. On a wider scale, policy-makers can leverage our study for formulating or refining policies governing rubber production and promoting sustainability. Further, consumers can use this information to make eco-conscious purchasing decisions, potentially transforming market dynamics by favoring sustainably produced rubber. Also, it is crucial to have an iterative process of LCA to identify and address the hotspots with the aim of bringing environmental impacts to a minimum level. To establish overall sustainability in the natural rubber industry, a sustainability assessment that goes beyond LCA is necessary, and this is a priority that needs to be addressed by future research.

Supplementary Materials

The following supporting information can be downloaded at: https://www.mdpi.com/article/10.3390/resources13010005/s1, Table S1: Representative processes in eco invent v3.8.; Table S2: Emission inventory of some selected pollutants per 1 tonne of concentrated latex. ZnO, and DAHP refer to Tetramethyl thiuram disulfide, Zinc oxide; Table S3: Impact assessment results per processing 1 tonne of concentrated latex.

Author Contributions

Conceptualization, P.D., V.H.L.R. and N.G.; methodology, P.D. and V.H.L.R.; software, P.D.; validation, P.D. and V.H.L.R.; formal analysis, P.D.; investigation, P.D.; resources, I.D. and N.G.; data curation, P.D.; writing—original draft preparation, P.D.; writing—review & editing, V.H.L.R., I.D. and N.G.; visualization, P.D.; supervision, V.H.L.R., I.D. and N.G. All authors have read and agreed to the published version of the manuscript.

Funding

This research received no external funding.

Data Availability Statement

Data available on request due to privacy restrictions.

Acknowledgments

We would like to express our appreciation for the help and support provided by the factory managers, officials, and workers at all study sites (namely, Factory A, B, and C) in gathering important information and extracting data. Additionally, we are grateful to the Ceylon Electricity Board for providing us with their measuring equipment and expertise.

Conflicts of Interest

The authors declare no conflicts of interest.

References

  1. Rubber Research Institute of Sri Lanka. Statistics. Available online: http://www.rrisl.gov.lk/statistics_e.php (accessed on 27 July 2023).
  2. Tillekeratne, L.M.K.; Nugawela, A.; Seneviratne, W.M.G. Handbook of Rubber; Vishva Lekha Printers: Ratmalana, Sri Lanka, 2003. [Google Scholar]
  3. Sri Lanka Export Development Board. Industry Capability Report Sri Lankan Rubber Products Sector; Sri Lanka Export Development Board: Colombo, Sri Lanka, 2016. [Google Scholar]
  4. Sri Lanka Export Development Board (EDB). The Natural Rubber Industry in Sri Lanka. Available online: http://www.srilankabusiness.com/blog/sri-lanka-natural-rubber-industry.html (accessed on 27 July 2016).
  5. Edirisinghe, J. Community Pressure and Environmental Compliance: Case of Rubber Processing in Sri Lanka. J. Environ. Prof. Sri Lanka 2013, 1, 14. [Google Scholar] [CrossRef]
  6. Nissanka, S.P. Cumulative Impact Assessment on Soil, Water, Workers, and Neighboring Community of the Estates of Lalan Rubbers Pvt Ltd. Available online: https://www.lalanrubber.com/monitoring_harvest.htm (accessed on 27 July 2023).
  7. IHS Markit Rubber, Natural—Chemical Economics Handbook. Available online: https://www.ihs.com/products/natural-rubber-chemical-economics-handbook.html (accessed on 18 December 2017).
  8. Bengtsen, P. Behind the Rubber Label; DanWatch: København, Denmark, 2013. [Google Scholar]
  9. Dunuwila, P.; Rodrigo, V.H.L.; Goto, N. Improving Financial and Environmental Sustainability in Concentrated Latex Manufacture. J. Clean. Prod. 2020, 255, 120202. [Google Scholar] [CrossRef]
  10. Kumara, P.R.; Munasinghe, E.S.; Rodrigo, V.H.L.; Karunaratna, A.S. Carbon Footprint of Rubber/Sugarcane Intercropping System in Sri Lanka: A Case Study. Procedia Food Sci. 2016, 6, 298–302. [Google Scholar] [CrossRef]
  11. Cecil, J.; Mitchell, P. Processing of Natural Rubber; FAO: Rome, Italy, 2003. [Google Scholar]
  12. Gamaralalage, D.; Sawai, O.; Nunoura, T. Effectiveness of Available Wastewater Treatment Facilities in Rubber Production Industries in Sri Lanka. Int. J. Environ. Sci. Dev. 2016, 7, 940–945. [Google Scholar]
  13. Dunuwila, P. Integration of Process Analysis and Decision-Making Tools for the Sustainability Improvements in Raw Rubber Manufacture; Toyohashi University of Technology: Toyohashi, Japan, 2019. [Google Scholar]
  14. Dunuwila, P.; Rodrigo, V.H.L.; Goto, N. Assessing the Financial and Environmental Sustainability in Raw Rubber Processing; a Case Study with Ribbed Smoked Sheet Manufacture in Sri Lanka. Indones. J. Life Cycle Assess. Sustain. 2018, 2, 1–7. [Google Scholar] [CrossRef]
  15. Dunuwila, P.; Rodrigo, V.H.L.; Goto, N. Sustainability of Natural Rubber Processing Can Be Improved: A Case Study with Crepe Rubber Manufacturing in Sri Lanka. Resour. Conserv. Recycl. 2018, 133, 417–427. [Google Scholar] [CrossRef]
  16. Dunuwila, P.; Rodrigo, V.H.L.; Daigo, I.; Goto, N. Social Impact Improving Model Based on a Novel Social Life Cycle Assessment for Raw Rubber Production: A Case of a Sri Lankan Rubber Estate. J. Clean. Prod. 2022, 338, 130555. [Google Scholar] [CrossRef]
  17. Tekasakul, S.; Tantichaowanan, M.; Otani, Y.; Kuruhongsa, P.; Tekasakul, P. Removal of Soot Particles in Rubber Smoking Chamber by Electrostatic Precipitator to Improve Rubber Sheet Color. Aerosol Air Qual. Res. 2006, 6, 1–14. [Google Scholar] [CrossRef]
  18. Leong, S.T.; Muttamara, S.; Laortanakul, P. Reutilization of Wastewater in a Rubber-Based Processing Factory: A Case Study in Southern Thailand. Resour. Conserv. Recycl. 2003, 37, 159–172. [Google Scholar] [CrossRef]
  19. Jawjit, W.; Kroeze, C.; Rattanapan, S. Greenhouse Gas Emissions from Rubber Industry in Thailand. J. Clean. Prod. 2010, 18, 403–411. [Google Scholar] [CrossRef]
  20. ISO 14040:2006 (En); Environmental Management—Life Cycle Assessment—Principles and Framework. The International Organization for Standardization (ISO): Geneva, Switzerland, 2006.
  21. Kumar, M.; Kumar Choubey, V.; Deepak, A.; Gedam, V.V.; Raut, R.D. Life Cycle Assessment (LCA) of Dairy Processing Industry: A Case Study of North India. J. Clean. Prod. 2021, 326, 129331. [Google Scholar] [CrossRef]
  22. Mahath, C.S.; Mophin Kani, K.; Dubey, B. Gate-to-Gate Environmental Impacts of Dairy Processing Products in Thiruvananthapuram, India. Resour. Conserv. Recycl. 2019, 141, 40–53. [Google Scholar] [CrossRef]
  23. Wijaya, R.; Fukushima, Y. Management Alternatives for Developing the Degraded Peat Swamp Forests in Central Kalimantan, Indonesia-Development of Inventory Data and Discussions on Framework for Comparisons. In Proceedings of the Seventh Conference of ILCAJ, Tokyo, Japan, 7–9 March 2012; pp. 178–179. [Google Scholar]
  24. Jawjit, W.; Pavasant, P.; Kroeze, C. Evaluating Environmental Performance of Concentrated Latex Production in Thailand. J. Clean. Prod. 2015, 98, 84–91. [Google Scholar] [CrossRef]
  25. Jawjit, W.; Pavasant, P.; Kroeze, C.; Tuffey, J. Evaluation of the Potential Environmental Impacts of Condom Production in Thailand. J. Integr. Environ. Sci. 2021, 18, 89–114. [Google Scholar] [CrossRef]
  26. Birnbach, M.; Lehmann, A.; Naranjo, E.; Finkbeiner, M. A Condom’s Footprint—Life Cycle Assessment of a Natural Rubber Condom. Int. J. Life Cycle Assess. 2020, 25, 964–979. [Google Scholar] [CrossRef]
  27. Dunuwila, P.; Hamada, K.; Takeyama, K.; Panasiuk, D.; Hoshino, T.; Morimoto, S.; Tahara, K.; Daigo, I. Influence of Different Allocation Methods for Recycling and Dynamic Inventory on CO2 Savings and Payback Times of Light-Weighted Vehicles Computed under Product- and Fleet-Based Analyses: A Case of Internal Combustion Engine Vehicles. Sustainability 2021, 13, 13935. [Google Scholar] [CrossRef]
  28. Liu, J.; Daigo, I.; Panasiuk, D.; Dunuwila, P.; Hamada, K.; Hoshino, T. Impact of Recycling Effect in Comparative Life Cycle Assessment for Materials Selection—A Case Study of Light-Weighting Vehicles. J. Clean. Prod. 2022, 349, 131317. [Google Scholar] [CrossRef]
  29. Guinée, J.B. Handbook on Life Cycle Assessment: Operational Guide to the ISO Standards, 2nd ed.; Kluwer Academic Publishers: Dordrecht, The Netherlands, 2002; ISBN 1402005571. [Google Scholar]
  30. Frischknecht, R.; Rebitzer, G. The Ecoinvent Database System: A Comprehensive Web-Based LCA Database. J. Clean. Prod. 2005, 13, 1337–1343. [Google Scholar] [CrossRef]
  31. Kamali, A.K.; Glogic, E.; Keppetipola, N.M.; Sonnemann, G.; Toupance, T.; Cojocaru, L. Prospective Life Cycle Assessment of Two Supercapacitor Architectures. ACS Sustain. Chem. Eng. 2023, 11, 15898–15909. [Google Scholar] [CrossRef]
  32. Sills, D.L.; Van Doren, L.G.; Beal, C.; Raynor, E. The Effect of Functional Unit and Co-Product Handling Methods on Life Cycle Assessment of an Algal Biorefinery. Algal Res. 2020, 46, 101770. [Google Scholar] [CrossRef]
  33. PRé Sustainability About SimaPro—SimaPro. Available online: https://simapro.com/about/ (accessed on 16 March 2023).
  34. Leiden University. CML-IA Characterisation Factors. Available online: https://www.universiteitleiden.nl/en/research/research-output/science/cml-ia-characterisation-factors (accessed on 17 July 2023).
  35. Humbert, S.; De Schryver, A.; Bengoa, X.; Margni, M.; Jolliet, O. IMPACT 2002+: User Guide. 2012. Available online: https://www.quantis.com/pdf/IMPACT2002+_UserGuide_for_vQ2.21_30April2014a.pdf (accessed on 17 July 2023).
  36. Goedkoop, M. Eco-Indicator 95; PRé Consultants: Amersfoort, The Netherlands, 1995. [Google Scholar]
  37. EPD International. Environmental Performance Indicators; EPD International: Stockholm, Sweden, 2023. [Google Scholar]
  38. CEB. CEB|Business with CEB. Available online: https://www.ceb.lk/electricity-generated/en (accessed on 17 July 2023).
  39. Dunuwila, P.; Rodrigo, V.H.L.; Goto, N. Financial and Environmental Sustainability in Manufacturing of Crepe Rubber in Terms of Material Flow Analysis, Material Flow Cost Accounting and Life Cycle Assessment. J. Clean. Prod. 2018, 182, 587–599. [Google Scholar] [CrossRef]
  40. dn Media Group Sri Lanka Eyes Renewables to Boost Energy Security|Upstream Online. Available online: https://www.upstreamonline.com/exploration/sri-lanka-eyes-renewables-to-boost-energy-security/2-1-1439837 (accessed on 20 July 2023).
  41. Energypedia Indonesia Energy Situation—Energypedia. Available online: https://energypedia.info/wiki/Indonesia_Energy_Situation (accessed on 20 July 2023).
  42. Chaiprapat, S.; Wongchana, S.; Loykulnant, S.; Kongkaew, C.; Charnnok, B. Evaluating Sulfuric Acid Reduction, Substitution, and Recovery to Improve Environmental Performance and Biogas Productivity in Rubber Latex Industry. Process Saf. Environ. Prot. 2015, 94, 420–429. [Google Scholar] [CrossRef]
  43. Department of Industrial Works (DIW). Industrial Sector Code of Practice for Pollution Prevention (Cleaner Technology); Department of Industrial Works: Ratchathewi, Bangkok, 2001. [Google Scholar]
  44. Dunuwila, P.; Rodrigo, V.H.L.; Daigo, I.; Goto, N. Social Sustainability of Raw Rubber Production: A Supply Chain Analysis under Sri Lankan Scenario. Sustainability 2023, 15, 11623. [Google Scholar] [CrossRef]
Figure 1. Concentrated latex manufacturing process. CL, TZ, DAHP, TMTD, and DBM refer to concentrated latex; the mixture of tetramethylthiuram disulfide (TMTD) and zinc oxide (ZnO); di ammonium hydrogen phosphate; tetramethylthiuram disulfide; and dry blanket milling. The flow diagram was only meant to demonstrate only the main activity flow with inputs, and so linkages to subsidiary were not shown to avoid complexity.
Resources 13 00005 g001
Figure 2. Overview of the research methodology. SPBT and EPBT refer to simple payback time and environmental payback time, respectively.
Resources 13 00005 g002
Figure 3. Contribution of in-factory activities to respective impact categories (except transportation). Black values represent the overall impact, excluding transportation, while red values represent the total impact, including transportation. For more information, please refer to Table S3 in the supplementary material.
Resources 13 00005 g003
Figure 4. Reduction potentials of improvement options under each impact category. Negative and positive scales respectively denote reductions and increments in environmental impacts from the baseline.
Resources 13 00005 g004
Table 1. Inventory of concentrated latex manufacturing of 1 tonne of concentrated latex. TMTD, ZnO, and DAHP respectively refer to tetramethylthiuram disulfide, zinc oxide, and di ammonium hydrogen phosphate.
Input/OutputFactory AFactory BFactory CMean Value
Material inputs
Field latex (kg) (dry basis)1136.381107.701152.551132.21
Field latex (kg) (wet basis)3554.933415.233974.323648.16
DAHP (kg)5.323.056.895.09
Lauric acid (kg)1.071.230.280.86
TMTD (kg)0.300.160.700.38
ZnO (kg)0.300.160.700.38
Ammonia (kg)2.0810.50N/A6.29
Sulfuric acid (kg)19.8915.9524.7320.19
Water (kg)8522.826646.215762.766977.26
Energy inputs
Electricity for centrifuging and milling (kWh)73.0748.14190.41103.87
Transportation of latex to the factory
Bowser truck (tkm)216.87256.14207.89226.97
Main product
Concentrated latex (kg) (dry basis)1000.001000.001000.001000.00
Concentrated latex (kg) (wet basis)1658.361646.101652.901652.45
By-product
Skim crepe rubber (kg)113.5677.78117.80103.05
Other outputs
Rubber dissolved in wastewater22.8229.9134.7529.16
Waste
Wastewater (kg)10,267.588344.537892.568834.89
Sludge (of non-rubber particles) (kg)12.7410.6112.1511.83
Water vapor (kg)65.5822.26101.0862.97
Table 2. Emission inventory of some selected pollutants per 1 tonne of concentrated latex. For more details, please refer to Table S2 in the Supplementary Materials.
Environmental Impact/PollutantsUnitTotal
Abiotic depletion
Telluriummg62.12
Silvermg215.04
Copperg181.76
Goldmg4.50
Leadg35.48
Zincg159.82
Abiotic depletion (fossil fuels)
Oil, crudekg42.57
Coal, hardkg35.04
Gas, naturalm310.89
Global warming (GWP100a)
CO2kg218.41
CH4g219.90
N2Og6.69
Ozone layer depletion
Halon 1301mg2.09
Halon 1211µg115.43
CFC-10µg312.76
HCFC-22mg2.89
Human Toxicity
Thalliummg365.81
Nickelmg440.35
Nitrogen oxideskg1.01
Sulfur dioxideg801.35
Ammoniag12.06
Particulates, <2.5 µmg93.14
Photochemical oxidation
SO2g801.35
COg287.47
CH4g219.90
NOxkg1.01
NMVOCg120.96
Acidification
SO2g726.68
NOxkg1.01
NH3g12.06
Eutrophication
Phosphateg185.09
Nitrogen oxideskg1.01
Nitrateg576.50
Ammonium, iong111.69
CODkg1.28
Table 3. Results of sensitivity analyses when different impact assessment methods are in place. EPD refers to environmental product declarations.
Impact CategoryUnitCML (Baseline)IMPACT 2002+Eco-Indicator 95EPD (2013)
Global warmingkg CO2 eq2.271 × 1022.230 × 1022.271 × 1022.276 × 102
Ozone layer depletionkg CFC-11 eq2.637 × 10−52.637 × 10−53.456 × 10−52.637 × 10⁻⁵
Acidificationkg SO2 eq1.4916.5461.5491.573
Photochemical oxidationkg C2H4 eq5.472 × 10−28.148 × 10−25.970 × 10−25.472 × 10⁻²
Table 4. Comparison of our study with similar studies conducted overseas. Jawjit et al. [19] and Wijaya and Fukushima [23] focused on evaluating greenhouse gas emissions from concentrated latex manufacturing and therefore only reported on global warming potential. N/A is “not applicable”.
Impact CategoryUnitOur Study (Sri Lanka; CML Method)Jawjit et al. [19] (Thailand; IPCC 2007)Jawijit et al. [24] (Thailand; CML Method)Wijaya and Fukushima [23] (Indonesia; IPCC 2007)Jawjit et al. [25] (Thailand; CML Method)
Global warmingkg CO2 eq227144169436165
Human toxicity1,4-DB eq181N/A38N/A38
Photochemical oxidationkg C2H4 eq0.05N/A0.08N/A0.08
Acidificationkg SO2 eq1.49N/A1.62N/A1.31
Eutrophicationkg PO43− eq0.45N/A0.21N/A0.24
Disclaimer/Publisher’s Note: The statements, opinions and data contained in all publications are solely those of the individual author(s) and contributor(s) and not of MDPI and/or the editor(s). MDPI and/or the editor(s) disclaim responsibility for any injury to people or property resulting from any ideas, methods, instructions or products referred to in the content.

