Article

Assessment of Nutrients in Natural Saltlicks, Artificial Saltlicks, and General Soils Used by Wild Asian Elephants (Elephas maximus) in the Western Forests of Thailand

by
Rattanawat Chaiyarat
1,*,
Salisa Kanthachompoo
2,
Nikorn Thongtip
3 and
Monthira Yuttitham
1
1
Wildlife and Plant Research Center, Faculty of Environment and Resource Studies, Mahidol University, Salaya, Nakhon Pathom Province 73170, Thailand
2
Office of Permanent Secretary, Ministry of Industry, Bangkok 10400, Thailand
3
Department of Large Animal and Wildlife Clinical Science, Faculty of Veterinary Medicine, Kasetsart University, Kampang Saen, Nakhon Pathom Province 73140, Thailand
*
Author to whom correspondence should be addressed.
Resources 2024, 13(1), 6; https://doi.org/10.3390/resources13010006
Submission received: 5 November 2023 / Revised: 22 December 2023 / Accepted: 27 December 2023 / Published: 29 December 2023

Abstract

:
Saltlicks are fundamental resources for wild Asian elephants (Elephas maximus). This study aimed to assess the nutrients found in natural saltlicks (NSs) and artificial saltlicks (ASs), as well as general soils (GS) in the natural forest of Salakphra Wildlife Sanctuary (SWS) and a restoration area of Kui Buri National Park (KNP), a which is a forest in Western Thailand. We monitored 33 NSs, 35 ASs, and 20 GSs used by wild Asian elephants. In both areas, the K, Mg, Fe, and Cu in NSs were significantly higher than in ASs. The Ca and Zn in NSs of KNP were lower than the ASs of SWS. The salinity of ASs was the highest, making it significantly higher than that of the NSs in both areas. The ASs can supplement Na, thereby increasing salinity in both areas. The Ca, K, Mg, Fe, and Cu in NSs were significantly higher than in ASs, making them a primary target for elephants. These findings have consequences for conserving elephants and other large herbivores by supplementing essential macro- and micro-nutrients in ASs.

1. Introduction

Saltlicks are areas on the ground surface in forests that naturally contain minerals [1] and on which animals actively ingest soil [2]. They can provide minerals to wild Asian elephants (Elephas maximus) and other wildlife species when food plants have mineral deficiencies [3]. As previous studies indicate, saltlicks can provide several supplementing nutrients, such as nitrogen (N), phosphorus (P), potassium (K), calcium (Ca), magnesium (Mg), sodium (Na), sulfur (S), zinc (Zn), copper (Cu), manganese (Mn), selenium (Se), iron (Fe), choline (Cl), or iodine (I) [2,4,5,6]. Therefore, natural saltlicks (NSs) have been classified as important landscape resources [7]. They affect the density and structure of wildlife in the surrounding areas [8] and suitability for salt-lick tourism, as has been studied in the Segaliud–Lokan Forest Reserve, Sandakan, Sabah, Malaysia [9]. In the natural habitats, NSs are located in certain specific areas that cannot be properly managed, which can cause some impacts on the special prey distribution of tigers (Panthera tigris) in the Royal Belum Rainforest, Malaysia [10]. Artificior al saltlicks (ASs) occur when the soil in a human-made saltlick is dug into basins and a sea salt mixture is poured into the excavated area. Subsequently, rain dissolves the salt mixture into the soil and becomes food for wildlife. The use of ASs may be a proper strategy to expand the carrying capacity of the protected areas, especially where the quality of habitat is insufficient. ASs have been an important management intervention used fin situ and ex situ conservation to support larger populations of wildlife, especially the wild Asian elephant in the Salakphra Wildlife Sanctuary (SWS) and a restoration area of the Kui Buri National Park (KNP).
Consequently, the NS distribution for elephants is not suitable. Even if wild elephants can extract nutrients from plants, some minerals are insufficient for their needs, resulting in a lack of minerals in their bodies. This is evident in male wild elephants that require high Ca to form teeth, tusks, and bones [11,12,13,14]. Female wild elephants also need Ca during pregnancy or when nursing a baby because the primary minerals of elephants are vital for breast milk. The World Wild Fund for Nature Thailand Office [15] reported that the S intake of wild elephants was inadequate, and that wild elephants and other mammals must supplement minerals by consuming saltlicks [16,17].
The distribution range of the wild Asian elephants is in Western and Northern India, Sri Lanka, Nepal, Bhutan, Bangladesh, Myanmar, Thailand, China, Lao PDR, Cambodia, Vietnam, Malaysia, Sumatra Island, and Borneo Island [18]. Their population has declined from approximately 41,410–52,345 [19] to 4189–6999 individuals [18].
The population of wild Asian elephants in Thailand in 2020 was between 3126 and 3341 individuals, according to Williams et al. [18]. Habitat fragmentation is the biggest threat to Asian elephants in Thailand because it increases conflicts between humans and elephants [20]. According to the International Union for Conservation of Nature (IUCN) Redlist data, wild elephants are endangered in each range country worldwide [18].
In SWS, an estimated 180 elephants with increased activity near saltlicks were reported [21], while in KNP, approximately 168 elephants were concentrated in The King’s project area. The objectives of the latter are to fulfill and extend the royal initiative in conserving the forest resources and wildlife in the areas of KNP, as well as to build check dams that will help in containing water, preventing floods, enhancing moisture in the area, collecting sediments, and serving as a water source for elephants and wildlife, which highlights the importance of habitat improvement for elephants. In the King’s project area, 12 small reservoirs were created and many ponds and hundreds of check dams were built to hold water all year round [22]. About 30 ASs were also created. In addition, two ranger stations were established in 1998 and 2004, both in the Kui canal valleys, to provide safety for the elephants [23].
Elephants need food every 12 h as they consume a dry weight of 1.5% of their body weight during the dry season and 1.9% in the wet season [24]. Some nutrients such as Na, S, Mg, Zn, Mn, and Se cannot be obtained from most plants [2]. Elephants directly receive minerals such as P, Ca, Na, and K from NSs [25]. Both Asian and African wild elephants (Loxodonta africana) must receive these minerals from other sources, such as soil, drinking water [26,27,28,29], or termite mounds in the case of African elephants [30]. Geophagia by elephants and other herbivore mammals will assist in controlling Na and hunger [31]. Soil consumption is more obvious when natural minerals are decreased [32]. Elephants and other wildlife species have been found eating saltlicks to supplement Ca and Na intake. In areas that lack the required NSs, the use of ASs is suitable for managing the habitat and maintaining the elephants’ health [11,12,13,14].
The SWS is a natural forest, while the KNP is a restored forest. Although both areas have NSs, there has been no clear approach or standard analysis of mineral content in either ASs or NSs. We aim to determine the compositions of general soil (GS), NSs, and ASs in two forest areas. These findings are important to provide a standardized approach to ensure that the mineral requirements of elephants are met with the provision of ASs.

2. Materials and Methods

2.1. Study Site

Salakphra Wildlife Sanctuary is located in Kanchanaburi Province, Thailand and is 858.55 km2 in size. It is located between latitude 14°9′ to 14°40′ N and longitude 99°9′ to 99°30′ E. Most areas form a mountainous complex with 50–1178 m height differences from the mean sea level. The highest mountain peak is Kao Hua Loan Mountain, which is 1178 m from mean sea level. The average highest temperature is 34 °C, and the lowest temperature is 23.1 °C. Important water sources include Kao Huai Sadong and Huai Salakphra, which are located in the central part of the area. Its length is approximately 26 km. Plant communities include dry dipterocarp forests, dry evergreen forests, mixed deciduous forests, bamboo forests, and tropical grasslands. The geology is Karst topography, metamorphic rock, and sedimentary rock. There is also a small amount of igneous (granite) rock in this area (Figure 1) [33]. Kui Buri National Park is located in Prachuap Khiri Khan Province, Thailand and is 969 km2 in size (14°9′ to 14°41′ N and 99°10′ to 99°25′ E). The geography is mostly part of the mountain range complex of Tenasserim Ridge, with an average elevation of 750 m above sea level. The forest community consists of mixed deciduous forests, dry evergreen forests, and tropical rainforests (Figure 1) [34].
In SWS, only sea salts (sodium chloride; NaCl, food grade) of approximately 20 kg/saltlick were added to ASs. The duration of adding salts varies between 5 and 10 years before the experiment. In KNP, approximately 20 kg of sea salts (sodium chloride; NaCl, food grade) and 10 kg of dicalcium phosphate (Ca2PO4) were added to ASs between 1 and 2 years before the experiment. Each saltlick was dug at 2 × 3 × 0.3 m (width × length × depth) [35].
General soils located 10 m from saltlicks that were not found to be eaten by elephants were collected with a shovel. Three samples of 33 NSs, 35 ASs, and 20 GSs used by wild Asian elephants were collected per site at a consistent depth of 2 cm, and at least 1 kg of soil was collected in a clean container at each sample site [36]. The minimum distances between samples in each site were 1 m in the dry season (January to March 2014). Soil sample locations were recorded. All samples were sent to the laboratory of the Faculty of Environment and Resource Studies, Mahidol University, in a cool box and were refrigerated to maintain the temperature and reduce chemical reactions before chemical analysis. They were homogenized, air-dried, and sieved through a 2 mm mesh, with another portion sieved through a 0.5 mm mesh to remove stony or rocky fragments, surface plant litter, and coarse root materials. Then, the standard analysis methodologies of the United States Department of Agriculture were performed [37].

2.2. Soil Chemical Analysis

The cation exchange capacity (CEC) and saturation of exchangeable bases (Ca, Mg, K, and Na) were determined using ammonium acetate (one natural and neutral in pH). Electrical conductivity (EC) was determined in a saturation extract, and particle size (texture) identification was performed using the hydrometer method [38]. Phosphorus (P) was determined using the Bray II method. Trace elements (Fe, Cu, Mn, Zn, and Se) were extracted with DTPA [39]. Organic carbon concentration was determined using the Walkley–Black method [40]. The pH for each sample was also determined by using a pH meter after mixing soil and deionized water in a ratio of 1:2.5 w/v at room temperature in triplicate [41].

2.3. Statistical Analysis

The results were shown in mean ± SD. Box plots were used to illustrate the distribution of data among different treatments. Two-way ANOVA was performed, and the mean values of soil pH, salinity, and chemical composition (macronutrient and micronutrient) were compared among treatments using post hoc multiple comparisons followed by Duncan’s testing for sites and treatments (NS, AS, GS), with significant differences set at the p-value = 0.05 level. The relationships among ASs, NSs, and GS in SWS and KNP, environmental factors, and minerals were analyzed using CCA.

3. Results

3.1. Soil Reaction and Salinity

The GSs in both areas, and the NSs and ASs in KNP, were neutral soils (pH value between 6.5 and 7.5), while NSs and ASs in SWS were alkaline soils (pH over 7.5). The pH was the highest in NSs in SWS (8.7 ± 0.5 ppm) and was significantly different from that in the other saltlicks and GS in both areas (F = 14.737, df1,2 = 5, 82, p < 0.001). In KNP, the pH was not significantly different between NSs, Ass, and GS (p > 0.05) (Table 1 and Figure 2).
The salinity in GS was high and significantly different from other salt licks in both areas (F = 7.1, df1,2 = 5, 82, p < 0.001), except for the NSs in SWS, which was not significantly different. The salinity of NSs in SWS was significantly lower than in KNP (p < 0.05). Supplementation by adding salts increased salinity in ASs in SWS and KNP (Table 1 and Table 2, Figure 2).

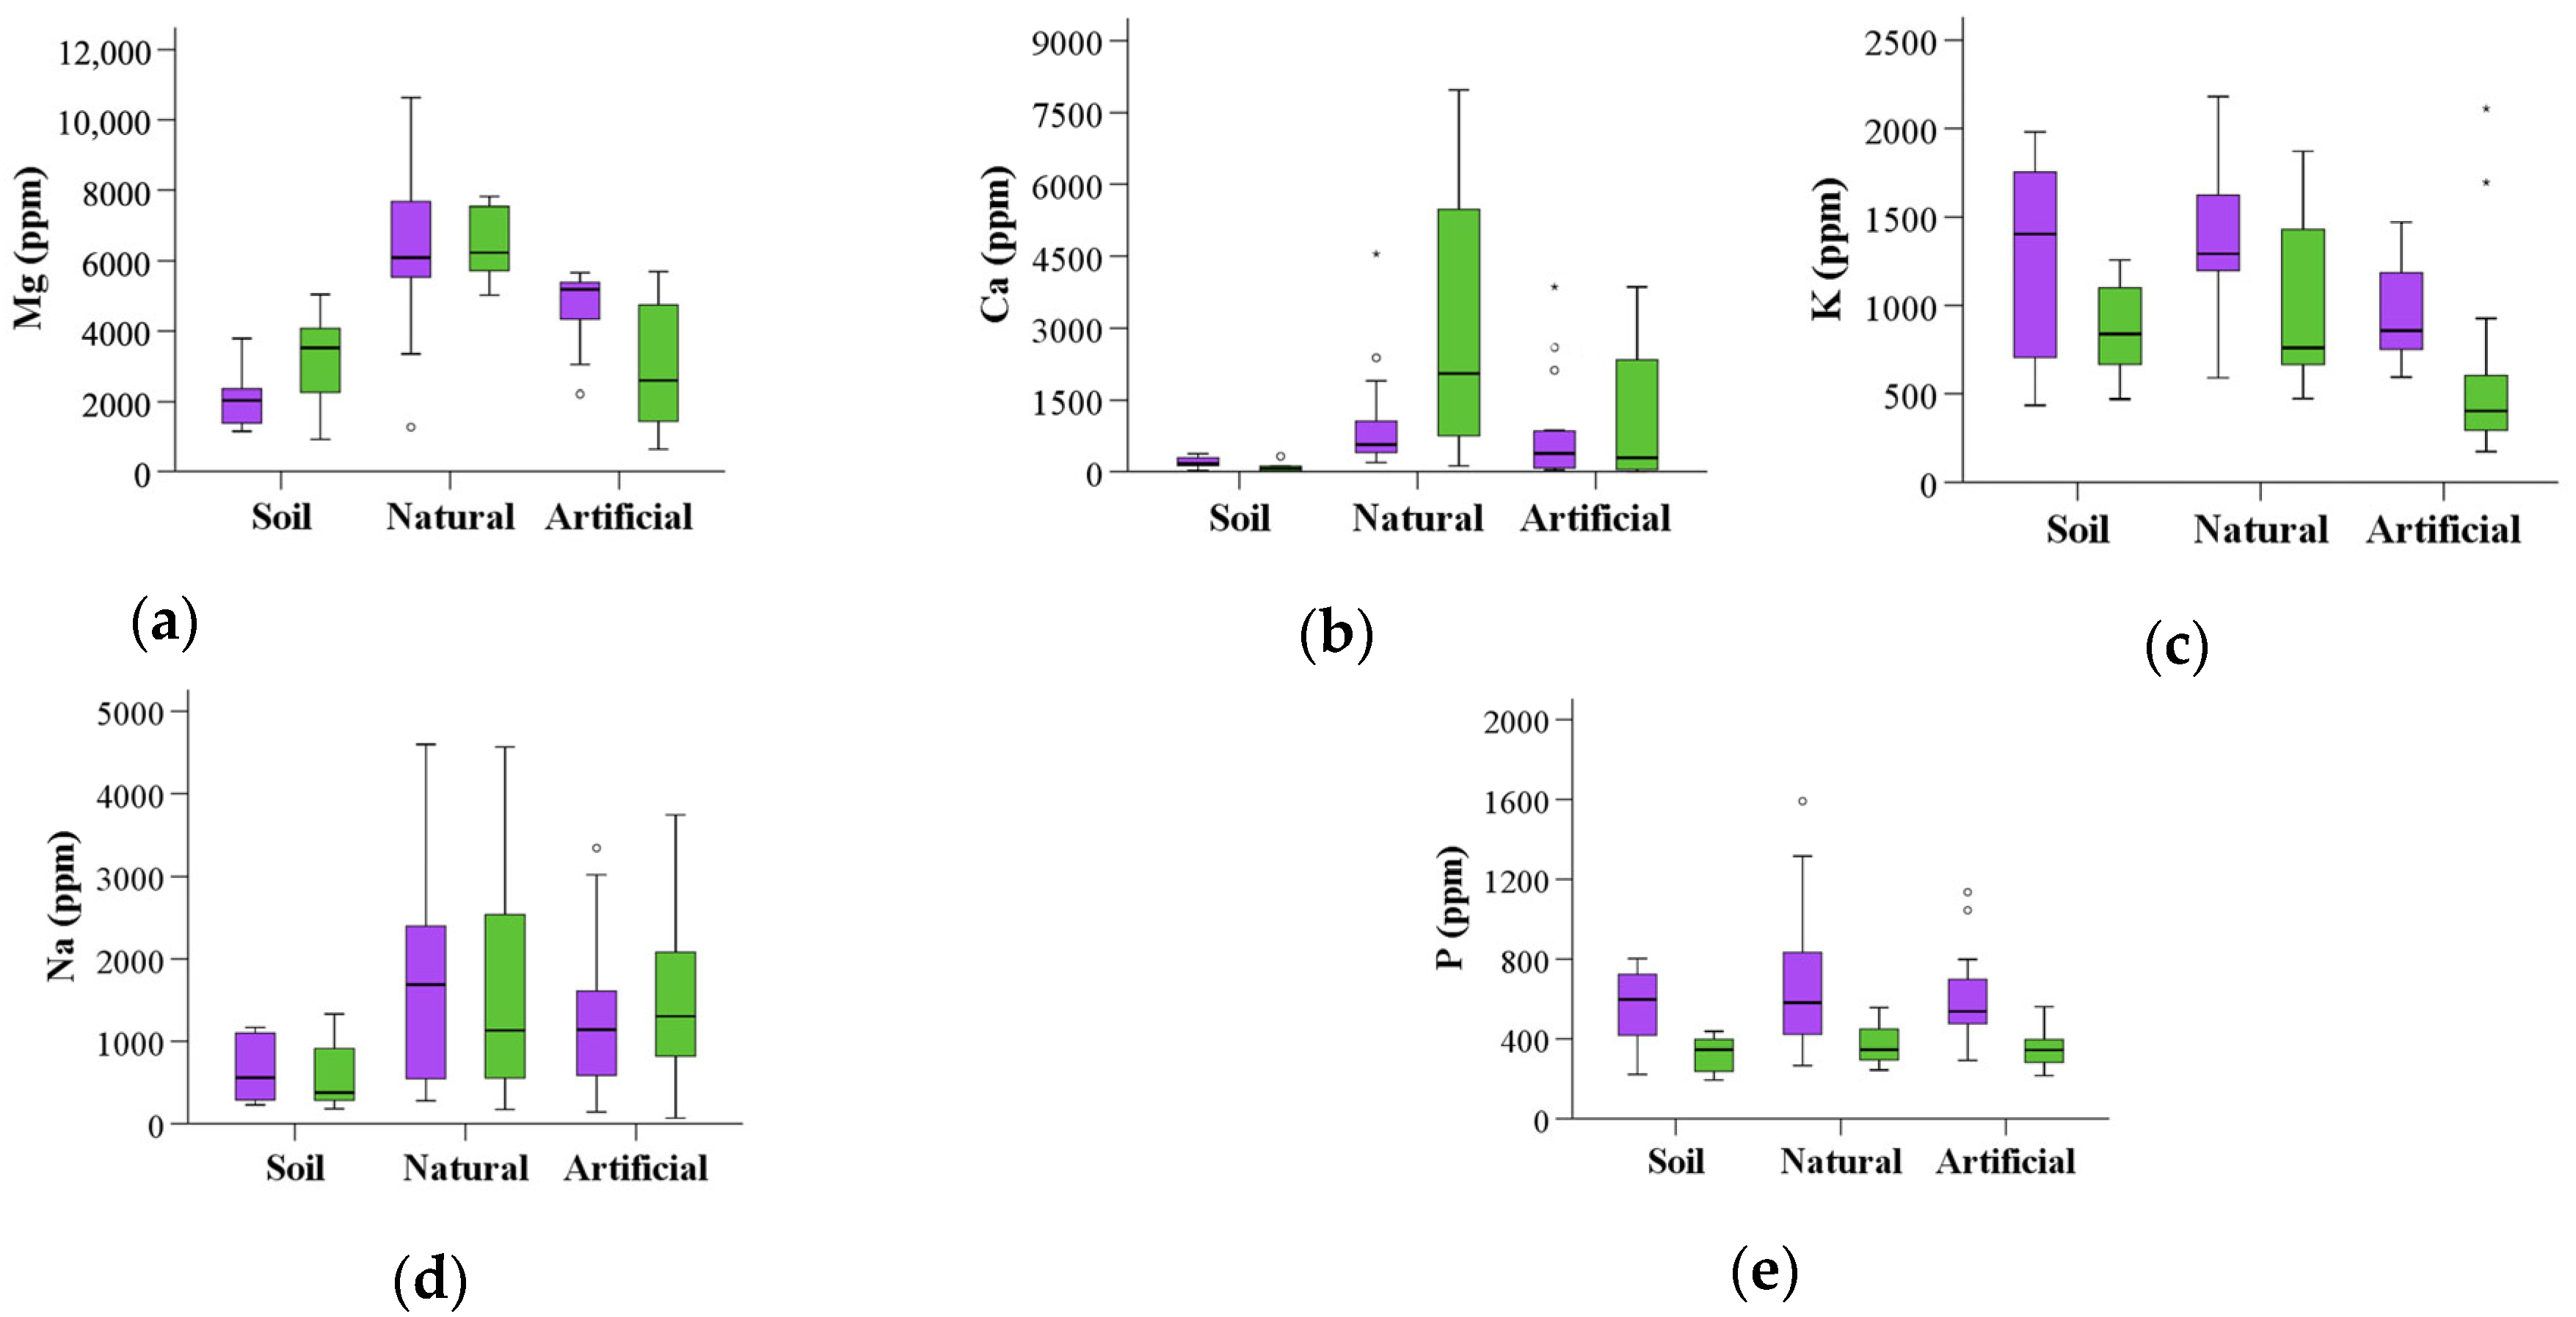
3.2. Macronutrient Composition

The concentration of Mg in SWS was significantly different among the experiments (F = 3.3, df1,2 = 5, 82, p = 0.009). The Mg was not significantly different among GSs in SWSs, GSs, and ASs in KNP (p > 0.05). The Mg was highest in NSs in KNP (p < 0.05) (Table 1 and Table 2, Figure 3).
Calcium in ASs, NSs, and GS were significantly different between AWS and KNP (F = 15.7, df1,2 = 5, 82, p < 0.001). In SWS, Ca was not significantly different between ASs, NSs, and GS (p > 0.05). In KNP, Ca in NSs was significantly different from all others (p < 0.05) (Table 1 and Table 2; Figure 3).
The concentrations of K between NSs, ASs, and GS were not significantly different in both areas (F = 2.2, df1,2 = 5, 82, p = 0.066). The K in NSs was significantly different from ASs in SWS (p < 0.05). Comparisons between ASs in SWS and NSs in KNP were not significantly different (p > 0.05) (Table 1 and Table 2; Figure 3).
The Na was significantly different between NSs and GS (F = 3.2, df1,2 = 5, 82, p = 0.011). The concentrations of Na were not significantly different between NSs and ASs in both areas (p > 0.05). The concentrations in these saltlicks were significantly higher than in GS in both areas (p < 0.05) (Table 1 and Table 2; Figure 3).
The concentrations of P in all treatments of SWS were high and significantly different from all treatments of KNP (F = 5.9, df1,2 = 5, 82, p < 0.001). However, NSs, ASs, and GS in both SWS and KNP were not that significantly different (p > 0.05). The p was the highest in NSs in SWS. In the NSs and GS in SWS, it was higher than in KNP (p < 0.05) (Table 1 and Table 2; Figure 3).

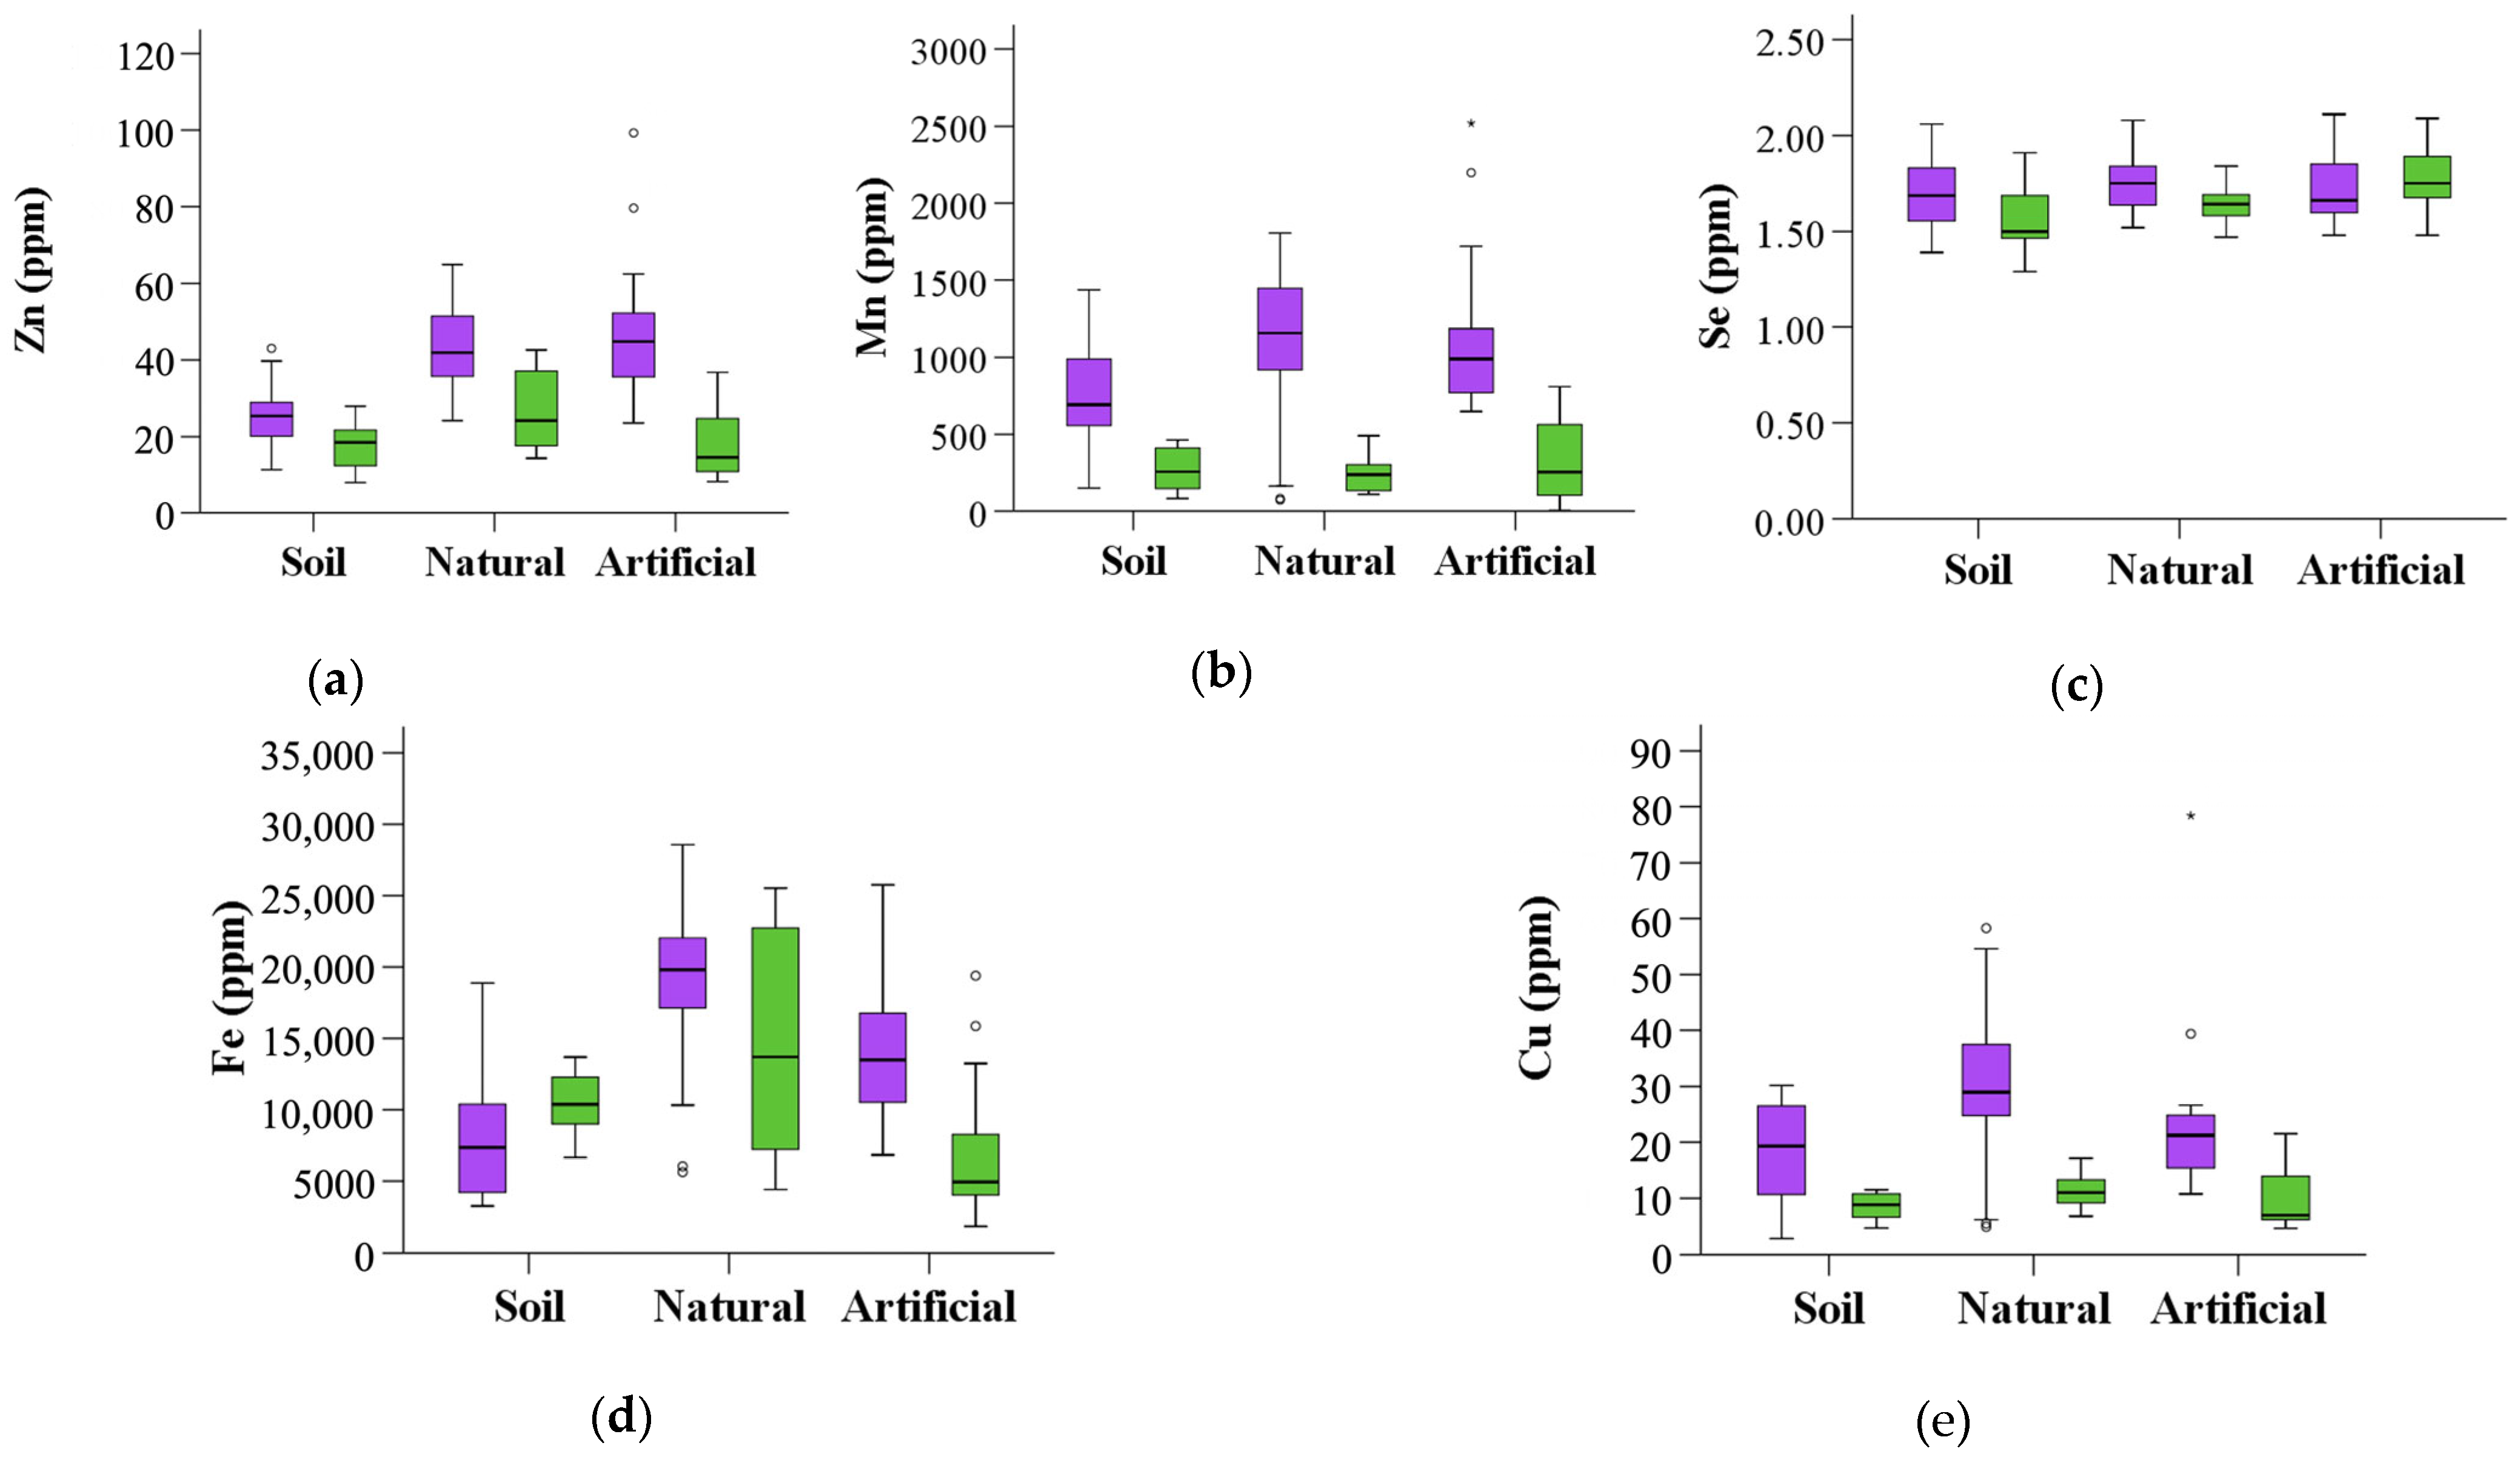
3.3. Micronutrient Composition

The concentrations of Zn between NSs, Ass, and GS in KNP were not significantly different (F = 2.1, df1,2 = 5, 82, p = 0.069). The concentration of Zn in ASs and NSs was significantly different from GS (p < 0.05) in SWS (Table 1 and Table 2; Figure 4).
The concentrations of Mn were significantly different between SWS and KNP (F = 3.5, df1,2 = 5, 82, p = 0.007). In KNP, there were no significant differences between NSs, ASs, and GS (p > 0.05). In SWS, the Mn concentration was not significantly different between ASs and NSs (p > 0.05) but was higher than in GS (p < 0.05) (Table 1 and Table 2; Figure 3).
The concentrations of Se between ASs, NSs, and GS were not significantly different (F = 1.4, df1,2 = 5, 82, and p = 0.252) (Table 1 and Table 2; Figure 4).
The concentrations of Fe in SWS were significantly different among NSs and ASs, as well as GS (F = 2.4, df1,2 = 5, 82, p = 0.041). In SWS, the Fe concentration among ASs, NSs, and GS was significantly different (p < 0.05), while in KNP, Fe concentration in ASs was lower than NSs and GS (p < 0.05) (Table 1 and Figure 4).
The concentrations of Cu were significantly different between SWS and KNP (F = 3.1, df1,2 = 5, 82, p = 0.014). The Cu concentration in ASs and NSs was higher than in GS in both areas (p < 0.05). The Cu concentration in ASs in KNP was the lowest compared to other saltlicks in both areas (p < 0.05) (Table 1 and Table 2; Figure 4).

3.4. Relationships between Natural Saltlicks, Artificial Saltlicks, and General Soils

The relationships between NSs, ASs, and GS, as well as the results of soil reactions, salinity, macronutrition composition, and micronutrition composition, were studied. The NSs in SWS (NSSWS) had a high pH and contained high levels of P, K, Zn, Fe, Cu, and Mn, while NSs in KNP (NSKNP) and GS in both areas (GSSWS and GSKNP) had a high level of salinity and contained high levels of Ca, Na, Mg, and Se (Table 2, Figure 5, Supplementary Table S1).

4. Discussion

Macronutrient (P, K, Ca, and Mg) and micronutrient (Zn, Mn, Fe, and Cu) concentrations in NSs in SWS were higher than in KNP, as well as than those in the NSs in Huai Kha Khaeng Wildlife Sanctuary [48], Phu Khieo Wildlife Sanctuary [49], and the NSs utilized by elephants in Mt. Elgon National Park (Table 2) [50]. These findings indicate that the NS nutrients in SWS are more suitable for elephants than those in KNP. Some nutrition supplements are required in KNP, unlike in SWS (Table 2).
The most common chemical components in soils in SWS and KNP were Fe and Mg (NS > AS > GS), which are commonly found in tropical soils [51,52]. The limitation of Se may affect the production, fertility, and disease prevention in elephants, as has been found in other animals [53]. These findings were similar to those in Huai Kha Khaeng Wildlife Sanctuary [54]. Minerals in NSs were discovered at a higher level than in GS, as found in the NSs of Huai Kha Khaeng Wildlife Sanctuary. To compare the mineral concentration, the different sources, methods, and analyses cannot use nutrition concentrations as baselines to illustrate the potential of improved ASs in the future, despite previous studies having used such a method. In previous studies, the nutrition concentrations in foods (Mg, Na, Zn, and Fe) in the zoo [46] were higher than the baseline levels of trace metals in the blood (Fe, Zn, Na, Mg, and Ca) of captive Asian elephants (Table 2) [47].
Higher concentrations of Mg, Ca, Mn, Fe, Zn, and Cu in NSs than in GS can, thus, represent an important nutrient supplement to wild elephants, enabling forage to sustain their body and health [55], especially the Ca required to support their bones and ivory [46]. Seidensticker and McNeely [54] also describe Na as an important driver of geophagy.
In GS, SWS and KNP differed in the amounts of minerals, with soil in SWS having a higher mineral content than in KNP due to SWS having been designated a protected area by the Royal Forest Department pursuant to the Wildlife Reservation and Protection Act, 2019 [56], and the soil not having been subjected to resource degradation over time, such as in KNP. The degradation of KNP was mostly caused by other land-use demands, as humans were unrestricted in converting forests to cropland and hunting wild animals for food. The Conservation and Restoration of Kui Buri National Forest Project under His Majesty the King’s Royal Initiation began in 1997 [34]. However, K, Na, and Se levels were similar in both study sites, while KNP had higher salinity levels in GS than in SWS. These results agreed with those of the study on the development scheme of lands with agricultural difficulties in the western area of Thailand, which reported that the soil series under soil salinity problems were the Tha Chin Series, founded in Prachuap Khiri Khun and the Nong Kae Series [57].
In NSs, P, K, Ca, Mg, Zn, and Cu are rich in both study areas, while Ca and Mg concentrations were lower in SWS than KNP. Na, Fe, and Se were not significantly different in both areas. Hence, SWS is not faced with mineral deficiencies in NSs, but KNP may need to supplement some minerals to enrich the AS, depending on the spatial condition and composition of soil in each area. This difference in mineral concentration may lead to differing mineral concentrations in the forage of elephants [35].
Artificial saltlicks were important in enriching the minerals in GS and, consequently, elephants, but, P, K, Mg, Mn, Ze, Fe, and Cu concentrations in SWS and KNP were different because of differences in historical land-use practices over time, as well as in the provision of ASs in each area [35]. Currently, providing ASs is not specifically formulated. Hence, each area should add minerals associated with the specific soil condition of the local area rather than merely providing ASs with salt that attract a few elephants and other wild animals for utilization [58].
Mineral compositions in NSs and GS in both areas were different. The mineral composition of the local area needs to be understood as a guideline for making cost-effective and suitable ASs for elephants and other geophagies to prepare future ASs.

5. Conclusions

The chemical results indicate that both macro- and micro-nutrient concentrations in the NSs in SWS and KNP were high and suitable for elephants, but they were lower in GS outside the saltlicks. In this situation, managers should provide ASs that are specifically formulated by adding minerals based on the local spatial distribution of nutrients found in the GS types of a specific area to make them suitable for wild elephants and other geophagous species. We recommend further studies on the relationships between wild elephants and spatial distributions, as well as the occurrences of NSs in the area. Forage samples should be investigated for their composition of minerals to ensure that the quantities are suitably available for elephants. Artificial saltlicks are important when low concentrations of mineral elements are found in forage or NSs. Finally, a long-term ecological monitoring program should also be established to provide information on the possible relationship between elephants movements and the mineral deficiency in the soil, as well as foliage-feeding habits.

Supplementary Materials

The following supporting information can be downloaded at: https://www.mdpi.com/article/10.3390/resources13010006/s1, Table S1: Factor loading eigenvalue, natural saltlicks (NS), artificial saltlicks (AS), general soil (GS), minerals and coordinates of sites of correlative coherence analysis (CCA) in Salakphra Wildlife Sanctuary (SWS), and Kui Buri National Park (KNP).

Author Contributions

Conceptualization, R.C., N.T. and M.Y.; methodology, R.C.; software, M.Y.; validation, R.C., N.T. and M.Y.; formal analysis, S.K.; investigation, R.C. and S.K.; resources, R.C.; data curation, S.K.; writing—original draft preparation, S.K.; writing—review and editing, R.C.; visualization, S.K.; supervision, R.C.; project administration, R.C.; funding acquisition, R.C. All authors have read and agreed to the published version of the manuscript.

Funding

This research received no external funding, and the APC was funded by Mahidol University.

Data Availability Statement

Data are unavailable due to privacy or ethical restrictions under the Department of National Parks, Wildlife and Plant Conservation, the Ministry of Natural Resources and Environment (MNRE 0907.4/4772).

Acknowledgments

We thank the Salakphra Wildlife Sanctuary and Kui Buri National Park, Department of National Parks, Wildlife and Plants for providing permission and assistance for data collection. Our appreciation and thanks to Thomas Neal Stewart, Mahidol University, Thailand, for editing the manuscript.

Conflicts of Interest

The authors declare no conflict of interest.

References

  1. Lameed, G.A.; Adetola, J. Species-diversity utilization of salt lick sites at Borgu Sector of Kainji Lake National Park. In Biodiversity Enrichment in a Diverse World; Books on Demand: Norderstedt, Germany, 2012; p. e51089. [Google Scholar]
  2. Ayotte, J.B.; Parker, K.L.; Arocena, J.M.; Gillingham, M.P. Chemical composition of lick soils: Functions of soil ingestion by four ungulate species. J. Mammal. 2006, 87, 878–888. [Google Scholar] [CrossRef]
  3. Ayeni, S.O. Utilization of water holes in natural parks. East Afr. Wildl. J. 1975, 13, 305–323. [Google Scholar] [CrossRef]
  4. Matsubayashi, H.; Majalap, P.L.N.; Tangah, J.; Sukor, J.R.A.; Kitayama, K. Importance of natural licks for the mammals in Bornean inland tropical rain forest. Ecol. Res. 2006, 22, 742–748. [Google Scholar] [CrossRef]
  5. Mills, A.; Milewski, A. Geophagy and nutrition supplementation in the Ngorongoro Conservation Area, Tanzania, with particular to selenium, cobalt and molybdenum. J. Zool. 2007, 271, 110–118. [Google Scholar] [CrossRef]
  6. Powell, L.L.; Powell, T.U.; Powell, G.V.N.; Brightsmith, D.J. Parrots take it with a grain of salt: Available sodium content may drive collpa (clay lick) selection in southeastern Peru. Biotropica 2009, 41, 279–282. [Google Scholar] [CrossRef]
  7. Montenegro, O.L. Natural Licks as Keystone Resources for Wildlife and People in Amazonia. Ph.D. Thesis, University of Florida, Gainesville, FL, USA, 2004. [Google Scholar]
  8. Tawa, Y.; Sah, S.A.M.; Kohshima, S. Mineral contents of salt-lick water and mammal visitation to salt-lick in tropical rainforests of Peninsula Malaysia. Eur. J. Wildl. Res. 2023, 69, 45. [Google Scholar] [CrossRef]
  9. Lim, W.S.; Mojiol, A.R.; Yip, P.M.; Goh, C.; Liau, P.; Liaw, Y.C.; John, S.V. Suitability for salt-lick tourism: A preliminary assessment on the natural salt-licks at Segaliud- Lokan Forest Reserve, Sandakan, Sabah. IOP Conf. Ser. Earth Environ. Sci. 2022, 1053, e012029. [Google Scholar] [CrossRef]
  10. Lazarus, B.A.; Che-Amat, A.; Abdul Halim Shah, M.M.; Hamdan, A.; Abu Hassim, H.; Kamal, F.M.; Azizan, T.R.P.T.; Noor, M.H.M.; Mustapha, N.M.; Ahmad, H. Impact of natural salt lick on the home range of Panthera tigris at the Royal Belum Rainforest, Malaysia. Sci. Rep. 2021, 11, e10596. [Google Scholar] [CrossRef]
  11. Buddhachat, K.; Klinhom, S.; Siengdee, P.; Brown, J.L.; Nomsiri, R.; Kaewmong, P.; Thitaram, C.; Mahakkanukrauh, P.; Nganvongpanit, K. Elemental analysis of bone, teeth, horn and antler in different animal species using non-invasive handheld x-ray fluorescence. PLoS ONE 2016, 11, e0155458. [Google Scholar] [CrossRef]
  12. Katole, S.B.; Das, A.; Saini, M.; Sharma, A.K. Effect of moderate work on intake and serum profile of minerals in semi-captive Asian elephants (Elephas maximus) fed sugarcane based diet. Indian J. Anim. Sci. 2015, 85, 1126–1129. [Google Scholar] [CrossRef]
  13. Nganvongpanit, K.; Brown, J.L.; Buddhachat, K.; Somgird, C.; Thitaram, C. Elemental analysis of Asian elephant (Elephas maximus) teeth using x-ray fluorescence and a comparison to other species. Biol. Trace Elem. Res. 2016, 170, 94–105. [Google Scholar] [CrossRef] [PubMed]
  14. Nganvongpanit, K.; Siengdee, P.; Buddhachat, K.; Brown, J.L.; Klinhom, S.; Pitakarnnop, T.; Angkawanish, T.; Thitaram, C. Anatomy, histology and elemental profile of long bones and ribs of the Asian elephant (Elephas maximus). Anatom. Sci. Int. 2017, 92, 554–568. [Google Scholar] [CrossRef] [PubMed]
  15. World Wide Fund for Nature Thailand Office. Action Plan for the Conservation of Asian Elephants in Thailand 1999–2001; Siam Thongkit Co., Ltd.: Bangekok, Thailand, 2000. (In Thai) [Google Scholar]
  16. Mosquera, D.; Vinueza-Hidalgo, G.; Blake, J.G. Patterns of mineral lick visitation by Linnaeus’s two-toed sloth Choloepus didactylus (Pilosa, Megalonychidae) in eastern Ecuador. Notas Sobre Mamíferos Sudam. 2019, 1, 1–11. [Google Scholar] [CrossRef]
  17. Simpson, B.K.; Nasaruddin, N.; Traeholt, C.; Nor, S.M. Mammal diversity at artificial saltlicks in Malaysia: A targeted use. Front. Environ. Sci. 2020, 16, e556877. [Google Scholar] [CrossRef]
  18. Williams, C.; Tiwari, S.K.; Goswami, V.R.; de Silva, S.; Kumar, A.; Baskaran, N.; Yoganand, K.; Menon, V. Elephas maximus. In The IUCN Red List of Threatened Species; e.T7140A45818198; 2020; Available online: https://www.iucnredlist.org/species/7140/45818198 (accessed on 25 June 2021).
  19. Sukumar, R. The Living Elephants: Evolutionary Ecology, Behavior, and Conservation; Oxford University Press: Oxford, UK, 2003. [Google Scholar]
  20. Van de Water, A.; Matteson, K. Human-elephant conflict in western Thailand: Socio-economic drivers and potential mitigation strategies. PLoS ONE 2018, 13, e0194736. [Google Scholar] [CrossRef]
  21. Chaiyarat, R.; Youngpoy, N.; Prempree, P. Wild Asian elephant Elephas maximus population in Salakphra Wildlife Sanctuary, Thailand. Endanger. Spec. Res. 2015, 29, 95–102. [Google Scholar] [CrossRef]
  22. Srikrachang, M.; Srikosamatara, S. Elephant crop raiding problems and their solutions at Kui Buri National Park, southwestern Thailand. Nat. His. Bull. Siam Soc. 2005, 53, 87–109. [Google Scholar]
  23. Srikrachang, M.; Kiatprajak, S.; Bidayabha, T.; Tanasarnpaiboon, S.; Sang-indra, C.; Saenthawee, D.; Wongsuwan, S. Wild elephant counting weeks in the King’s Project area, Kui Buri National Park, Southwestern Thailand. Gajah 2009, 31, 32–35. [Google Scholar]
  24. Sukumar, R. Ecology of the Asian elephant in southern India. I. Movement and habitat utilization patterns. J. Trop. Ecol. 1989, 5, 1–18. [Google Scholar] [CrossRef]
  25. Sianga, K.; Fynn, R. The vegetation and wildlife habitats of the Savuti-Mababe-Linyanti ecosystem, northern Botswana. Koedoe 2017, 59, a1406. [Google Scholar] [CrossRef]
  26. Chew, M.Y.; Hymeir, K.; Nosrat, R.; Shahfiz, M.A. Relation between grasses and large herbivores at the Ulu Muda salt licks, Peninsular Malaysia. J. Trop. For. Sci. 2014, 26, 554–559. [Google Scholar]
  27. Morales, M.A. The Importance of General Soil Licks to Wildlife and Humans in Subtropical Paraguay, South America. , University of Wisconsin, Madison, WI, USA, 2009. Ph.D. Thesis, University of Wisconsin, Madison, WI, USA, 2009. [Google Scholar]
  28. Sienne, J.M.; Buchwald, R.; Wittemyer, G. Differentiation in mineral constituents in elephant selected versus unselected water and soil resources at Central African bias (forest clearings). Eur. J. Wildl. Res. 2014, 60, 377–382. [Google Scholar] [CrossRef]
  29. Srisakdi, T. The Mineral Supplement to Cattles Releasing to in Grass Field. Master’s Thesis, Kasetsart University, Bangekok, Thailand, 1982. (In Thai). [Google Scholar]
  30. Kalumanga, E.; Mpanduji, D.G.; Cousins, S.A.O. Geophagic termite mounds as one of the resources for African elephants in Ugalla Game Reserve, Western Tanzania. Afr. J. Ecol. 2016, 55, 91–100. [Google Scholar] [CrossRef]
  31. Dethier, V.G. The taste of salt. Am. J. Sci. 1977, 65, 744–751. [Google Scholar]
  32. Kreulen, D.A.; Jager, T. The significance of soil ingestion in the utilization of arid rangelands by large herbivores, with special reference to natural licks on the Kalahari Pans. In Herbivore Nutrition in the Subtropics and Tropics; Gilchrist, F.M.C., Mackie, R.I., Eds.; Science Press: Craighall, South Africa, 1984; pp. 204–221. [Google Scholar]
  33. Salakphra Wildlife Sanctuary. Master Plan of Salakphra Wildlife Sanctuary, Kanchanaburi Province B.E. 2554–2558; Department of National Park, Wildlife and Plant Conservation, Protected Areas Regional Office 3: Ban Pong, Thailand, 2011. (In Thai) [Google Scholar]
  34. Kui Buri National Park. Summary Results for the Year 2003; Kui Buri National Park: Kui Buri, Thailand, 2003. (In Thai) [Google Scholar]
  35. Kanchanasakha, B.; Tanhikorn, S.; Vinitpornsawan, S.; Prayoon, U.; Phangbuppha, K. State of Large Mammals in Thailand; Wildlife Research Division, Department of Wildlife Conservation National Park, Wildlife and Plant Conservation: Bangkok, Thailand, 2010. [Google Scholar]
  36. Mahaney, W.C.; Krishnamani, R. Understanding geophagy in animals: Standard procedures for sampling soils. J. Chem. Ecol. 2003, 29, 1503–1523. [Google Scholar] [CrossRef]
  37. IGAC—Instituto Geográfico Agustin Codazzi. Métodos Analíticos del Laboratorio de Suelos; Imprenta Nacional de Colombia: Bogotá, Spain, 2006.
  38. Bouyoucos, G.J. Directions for making mechanical analysis of soils by the hydrometer method. Soil Sci. 1936, 4, 225–228. [Google Scholar] [CrossRef]
  39. Vocasek, F.F.; Friedericks, J.B. Soil micronutrient extraction by Mehlich-3 compared to CaCl2-DTPA. Commun. Soil Sci. Plant Anal. 1994, 25, 1583–1593. [Google Scholar] [CrossRef]
  40. McLeod, S. Studies on Wet Oxidation Procedures for the Determination of Organic Carbon in Soils; Notes on Soil Techniques; CSIRO Division of Soils: Melbourne, Australia, 1973. [Google Scholar]
  41. Badr, N.; Fawzy, M.; Al-Qahtani, K.M. Phytoremediation: An ecological solution to heavy-metal-polluted soil and evaluation of plant removal ability. World Appl. Sci. J. 2012, 16, 1292–1301. [Google Scholar]
  42. Chaiyarat, R.; Sakchan, P.; Panprayun, G.; Thongthip, N.; Nakbun, S. Monitoring of forage and nutrition before and after reintroduction of banteng (Bos javanicus d’ Alton, 1823) to Salakphra Wildlife Sanctuary, Thailand. Sci. Rep. 2020, 10, 11135. [Google Scholar] [CrossRef]
  43. Molina, E.; León, T.E.; Armenteras, D. Characteristics of natural salt licks located in the Colombian Amazon foothills. Environ. Geochem. Health 2014, 36, 117–129. [Google Scholar] [CrossRef] [PubMed]
  44. Brightsmitha, D.J.; Taylor, J.; Phillips, T.D. The roles of soil characteristics and toxin adsorption in avian geophagy. Biotropica 2008, 40, 766–774. [Google Scholar] [CrossRef]
  45. Brightsmith, D.J.; Muñoz-Najar, R.A. Avian geophagy and soil characteristics in southeastern Peru. Biotrop. 2004, 36, 534–543. [Google Scholar] [CrossRef]
  46. Lihong, W.; Liu, L.; Qian, H.; Jinguo, Z.; Li, Z. Analysis of nutrient components of food for Asian elephants in the wild and in captivity. Front. Biol. China 2007, 2, 351–355. [Google Scholar] [CrossRef]
  47. Wiedner, E.B.; Takeuchi, N.Y.; Isaza, R.; Barber, D. Baseline levels of trace metals in blood of captive Asian elephants (Elephas maximus). J. Zoo Wildl. Med. 2011, 42, 360–362. [Google Scholar] [CrossRef] [PubMed]
  48. Sukmasuang, R. Population density of Asian elephants in Huai Kha Khaeng Wildelife Sanctuary. Thail. J. For. 2009, 28, 40–50. (In Thai) [Google Scholar]
  49. Submee, A. The Use of Advantages from Natural Salt Licks and Artificial Salt Licks by Wildlife at Phu Kiew Wildlife Sanctuary, Chaiyaphum Province. Master’s Thesis, Kasetsart University, Bangkok, Thailand, 1986. (In Thai). [Google Scholar]
  50. Sitienei, A.J.; Ge, J.W.; Ngene, S.M.; de la Paix, M.J.; Waweru, F.K. Analysis in the concentration, determination and comparison of some mineral elements in the natural salt-licks utilized by elephants: Mt. Elgon National Park case study. Adv. Mater. Res. 2012, 356–360, 1796–1800. [Google Scholar] [CrossRef]
  51. Food and Agriculture Organization of the United Nations (FAO), the International Institute for Applied Systems Analysis (IIASA), ISRIC-World Soil Information, Institute of Soil Science—Chinese Academy of Sciences (ISSCAS) or Joint Research Centre of the European Commission (JRC). Harmonized World Soil Database (Version 1.2); FAO: Rome, Italy; IIASA: Laxenburg, Austria, 2012; Available online: http://www.fao.org/soils-portal/soil-survey/soil-maps-and-databases/harmonized-world-soil-database-v12/en/ (accessed on 15 December 2019).
  52. Aristizábal, E.; Roser, B.; Yokota, S. Tropical chemical weathering of hillslope deposits and bedrock source in the Aburrá Valley, northern Colombian Andes. Eng. Geol. 2005, 81, 389–406. [Google Scholar] [CrossRef]
  53. Hefnawy, A.; Tortora, J. The importance of selenium and the effects of its deficiency in animal health. Small Rum. Res. 2010, 89, 185–192. [Google Scholar] [CrossRef]
  54. Seidensticker, J.; McNeely, J. Observations on the use of natural licks by ungulates in the Huai Kha Khaeng Wildlife Sanctuary, Thailand. Nat. His. Bull. Siam Soc. 1975, 26, 25–34. [Google Scholar]
  55. Barboza, G.E.; Cantero, J.J.; Núñez, C.; Pacciaroni, A.; Espinar, L.A. Medicinal plants: A general review and a phytochemical and ethnopharmacological screening of the native Argentine Flora. Kurtziana 2009, 34, 7–365. [Google Scholar]
  56. Royal Thai Government Gazette. Wildlife Preservation and Protection Act, B.E. 2562 (2019) of Thailand. Available online: https://ratchakitcha.soc.go.th/ (accessed on 16 December 2019). (In Thai).
  57. Sutthawas, K. Guidelines for Developing Problem Soils for Agriculture in the Western Area of Thailand; Land Development Office District 10, Land Development Department: Bangkok, Thailand, 2014. (In Thai) [Google Scholar]
  58. Bhumpakphan, N. Ecological Characteristics and Habitat Utilization of Gaur (Bos gaurus H. Smith, 1827) in Different Climate Sites. Ph.D. Thesis, Kasetsart University, Bangkok, Thailand, 1997. [Google Scholar]
Figure 1. Salakphra Wildlife Sanctuary in Kanchanaburi province and Kui Buri National Park in Prachuap Khiri Khan Province.
Resources 13 00006 g001
Figure 2. Soil pH (a) and salinity (b) (mean ± SD) of general soils (Soil); natural saltlicks (Natural) and artificial saltlicks (Artificial) from Salakphra Wildlife Sanctuary (purple); and Kui Buri National Park (green); open circle is outside the inner fence.
Resources 13 00006 g002
Figure 3. Macronutrients: (a) Magnesium (Mg), (b) Calcium (Ca), (c) Potassium (K), (d) Sodium (Na), and (e) phosphorus (P) (mean ± SD) of general soils (Soil), natural saltlicks (Natural), and artificial saltlicks (Artificial) from Salakphra Wildlife Sanctuary (purple) and Kui Buri National Park (green); star is outside the outer fence, and open circle is outside the inner fence.
Resources 13 00006 g003
Figure 4. Micronutrients: (a) Zinc (Zn); (b) Manganese (Mn); (c) Selenium (Se); (d) Ion (Fe); and (e) Copper (Cu) (mean ± SD) of general soils (Soil), natural saltlicks (Natural), and artificial saltlicks (Artificial) from Salakphra Wildlife Sanctuary (purple) and Kui Buri National Park (green); star is outside the outer fence, and open circle is outside the inner fence.
Resources 13 00006 g004
Figure 5. Relationships of 10 minerals and environmental parameters (pH and salinity) (black triangle) among general soil, natural saltlicks, and artificial saltlicks in Salakphra Wildlife Sanctuary and Kui Buri National Park (GSSWS = general soil in Salakphra Wildlife Sanctuary; ASSWS = artificial saltlicks in Salakphra Wildlife Sanctuary; NSSWS = natural saltlicks in Salakphra Wildlife Sanctuary; GSKNP = general soil in Kui Buri National Park; ASKNP = artificial saltlicks in Kui Buri National Park; and NSKNP = natural saltlicks in Kui Buri National Park; black circle).
Resources 13 00006 g005
Table 1. Chemical composition (mean ± SD) among general soils (GS, n = 20), natural saltlicks (NS, n = 33), and artificial saltlicks (AS, n = 35) in Salakphra Wildlife Sanctuary and Kui Buri National Park.
ParameterSWSKNPF(1,2) = 5.82p-Value
GSASNSGSASNS
pH6.8 ± 0.5 c7.7 ± 0.6 b8.7 ± 0.5 a7.3 ± 1.4 bc7.2 ± 1.1 bc7.3 ± 0.8 bc14.7<0.001
Salinity372.6 ± 185.7 a8507.8 ± 8197.3 b1967.4 ± 881.1 a979.5 ± 895.6 a16,774.7 ± 9148.6 c9583.8 ± 6551.3 b7.1<0.001
P559.8 ± 196.6 b614.8 ± 236.2 b676.2 ± 342.8 b324.1 ± 91.3 a347.8 ± 86.9 a378.2 ± 107.2 a5.9<0.001
K1262.9 ± 580.6 cd963.6 ± 270.5 bc1378.6 ± 423.7954 ± 458.9566.8 ± 498.9954.3 ± 461.52.20.066
Ca191.7 ± 115.6 a850.3 ± 1135.1 a932.2 ± 977 a89.7 ± 104.9 a1054.7 ± 1298.5 a3021.7 ± 2793.5 b15.7<0.001
Mg2046 ± 758.1 a4693.5 ± 1035 b6643.3 ± 2315 c3212.4 ± 1337.1 a2879.5 ± 1728 a7377.5 ± 4084.2 c3.30.009
Na649.1 ± 390.5 a1282.3 ± 963.3 ab1745.6 ± 1189 b583.6 ± 444.6 a1500.5 ± 996.4 b1577.0 ± 1424.1 b3.20.011
Mn749.8 ± 378.8 b1148.8 ± 564.7 c1086.3 ± 494.6 c271.9 ± 144.9 a271.9 ± 144.9 a237.9 ± 116.8 a3.50.007
Zn25.6 ± 9.5 a47.7 ± 20.5 b43.9 ± 11.7 b17.6 ± 6.7 a17.8 ± 9 a27.1 ± 11.1 a2.10.069
Fe8006.1 ± 4511.5 a14,138.2 ± 5357.5 b18,890.1 ± 6279.9 c10,462.5 ± 2316.3 ab6796.9 ± 4629 a14,761.6 ± 78,999 bc2.40.041
Cu18.0 ± 9.3 bc24.7 ± 16.4 cd30.6 ± 14.3 d8.6 ± 2.6 a9.4 ± 5 ab11.3 ± 3.1 ab3.10.014
Se1.7 ± 0.21.7 ± 0.21.8 ± 0.21.6 ± 0.21.8 ± 0.21.7 ± 0.11.40.252
Mean ± SD with the same letter (a, b, c, d) are not significantly different from each other (p > 0.05 followed by post hoc multiple comparisons followed by Duncan’s testing for sites and treatments (NS, AS, GS)).
Table 2. Mineral composition of artificial saltlicks (AS), natural saltlicks (NS), and general soils (GS) in Salakphra Wildlife Sanctuary and Kui Buri National Park, Asian elephant (Elephas maximus) forages and bloods, as well as forage species.
LocalitypHSalinity (ppm)Macronutrient (ppm)Micronutrient (ppm)
PKCaMgNaMnZnFeCuSe
SWS
GS 6.8372.6559.81262.9191.72046649.1749.825.68006.118.01.7
AS 7.78507.8614.8963.6850.34693.51282.31148.847.714,138.224.71.7
NS 8.71967.4676.21378.6932.26643.31745.61086.343.918,890.130.61.8
Forage (WS) §--0.031.90.93---<0.010.03<0.01N/A
KNP
GS 7.3979.5324.1954.089.73212.4538.6271.917.610,462.58.61.6
AS 7.216,774347.8566.81054.72879.51500.5271.917.86796.99.41.8
NS 7.39583.8378.2954.33021.77377.51577237.927.114,761.611.31.7
SMRCD #6.5-278.542,5001,005,000397,500240,00017.82.2115.50.7-
TRC ¢8.7--36,000213,000213,000592,00016.92.31190.7-
TNRBZ £---27,000124,000459,000110,000-----
WF ¥--249415,915.529,989.53650145--60.9553.4--
BZF ¥--3226.5711811,563.52603.52181.3-27.3367.9--
AEB -------N/A6.1-0.80.4
SWS = Salakphra Wildlife Sanctuary; KNP = Kui Buri National Park, N/A = >70% of the sample were either non-detectable or below the limit of quantification and, therefore, at very low concentration, - = not analyzed; Reference: Modified from = This study; § = Chaiyarat et al. [42]; # = Molina et al. [43]; ¢ = Brightsmith et al. [44]; £ = Brightsmith and Muñoz-Najar [45]; ¥ = Lihong et al. [46]; = Wiedner et al. [47]; WS = the wet season; SMRCD = San Miguel Reservation Caqueta Department, Colombia; TRC = Tambopata Research Centre, Peru; TNRBZ = Tambopata Natural Reserve Buffer Zone, Peru; WF = Wild Forage, Beijing, China; BZF = Beijing Zoo Forage, China; AEB = Asian Elephant Blood.
Disclaimer/Publisher’s Note: The statements, opinions and data contained in all publications are solely those of the individual author(s) and contributor(s) and not of MDPI and/or the editor(s). MDPI and/or the editor(s) disclaim responsibility for any injury to people or property resulting from any ideas, methods, instructions or products referred to in the content.

