Article

Risks to Human Health from the Consumption of Water from Aquifers in Gold Mining Areas in the Coastal Region of Ecuador

by
Irene Passarelli
1,
Demmy Mora-Silva
2,3,
Carla Arguello Guadalupe
4,
Thalía Carrillo Arteaga
5,
Rogelio Ureta Valdez
6,
Luz María Orna Puente
7,
María Gabriela Tobar Ruiz
2,
Guicela Ati-Cutiupala
2,
Marcelo Sanchez-Salazar
2,
Salvatore Straface
1 and
Carlos Mestanza-Ramón
1,*
1
Department of Environmental Engineering, University of Calabria, 87036 Rende, Italy
2
Green Amazon, Research Center, Nueva Loja EC-210150, Ecuador
3
Programa de Doctorado en Ciencias y Tecnologías Marinas, Universidad de Cádiz, 11510 Puerto Real, Spain
4
Research Group Sustainability, Escuela Superior Politécnica de Chimborazo, Facultad de Recursos Naturales, Riobamba 060104, Ecuador
5
Escuela Superior Politécnica de Chimborazo, Facultad de Informática y Electrónica, Riobamba 060104, Ecuador
6
Research Group GIRMI, Escuela Superior Politécnica de Chimborazo, Sede Morona Santiago, Macas 140101, Ecuador
7
Research Group GEAA, Escuela Superior Politécnica de Chimborazo, Facultad de Ciencias, Riobamba 060104, Ecuador
*
Author to whom correspondence should be addressed.
Resources 2024, 13(4), 53; https://doi.org/10.3390/resources13040053
Submission received: 15 February 2024 / Revised: 21 March 2024 / Accepted: 29 March 2024 / Published: 8 April 2024
(This article belongs to the Special Issue Mine Ecological Restoration)

Abstract

:
Artisanal and Small-scale Gold Mining (ASGM) is a source of supply in many areas of the world, especially in developing countries. This is often carried out illegally using toxic substances such as mercury. Mercury, due to its chemical–physical properties and the transport factors involved between the different environmental matrices, can percolate through soil and from surface water to groundwater. The objective of this study was to conduct a human health risk assessment. For this purpose, a screening of mercury concentrations was carried out, collecting 67 water samples at selected points, and a risk assessment was performed applying both a deterministic and a probabilistic approach. A deterministic approach is a specific analysis based on determining the values of the risk quotient (HQ) and the risk index (HI) for each receptor category (adults and children) and scenario (residential and recreational) considered; a probabilistic approach is based on stochastic simulation techniques and the evaluation of the statistical quantities. There was found to be a discrepancy between the results provided by the two approaches, with the deterministic approach suggesting a more worrisome picture. However, in general, the results showed a greater exposure in the provinces of El Oro and Esmeraldas, and a greater vulnerability of child receptors.

1. Introduction

Mining is one of the oldest activities in the world. According to some sources, it was already practiced in prehistoric times, some four thousand years ago. Gold mining in Ecuador dates to the time of the Incas and was practiced with rudimentary techniques and means for a long time [1]. Over the past two decades, the demand for gold has increased exponentially, and consequently so has the price [2,3]. This has prompted a huge increase in investment in this economic activity, especially in developing countries such as Ecuador. Therefore, today the survival of millions of people and their families depends on gold mining [4]. Gold mining is conducted at different scales; some activities take place with greater compliance with administrative regulations, but inland there is widespread ASGM, which is often carried out as an illegal activity [1,5]. Thus, gold mining has a twofold significance: on the one hand, it has a positive potential, in the sense that it can foster job creation and economic growth in the country [6], while on the other hand, most of the extractive techniques adopted have a strong negative impact on the environment and on human health, and also have a negative effect from a social point of view by creating false expectations of well-being in the population and by fostering armed conflicts [2,7].
Some examples of the impact that illegal gold mining has on the affected regions are discrimination and social conflicts over gender inclusion, exploitation of black labor, and exploitation of child labor. Moreover, it is often associated with the activities of illicit associations, which adopt violence as a means of subjugation [2,8,9]. Indeed, this sector has recently been affected by a significant growth in illegal and informal activities, and this constitutes an obstacle to the country’s economic growth and development [9].
In addition, mining can cause a huge impact on the environment and human health, especially illegal gold mining activity because it is carried out without the aid of technologically advanced methods [10]. The consequence is that, in the areas surrounding mining activities, a large amount of chemical pollution is constantly produced, and substances such as zinc, nitric acid, cyanide, arsenic, cadmium, manganese and, above all, mercury infiltrate surface water bodies [2,3,11] and infiltrate the ground, from where they can reach the groundwater.
Mercury (Hg) is the most widespread element in artisan mining and it can easily trigger oxidative stress in biological systems [12]. Additionally, it has properties that make it one of the most toxic metals to the environment and human health, such as high volatility, persistence, and tendency to bioaccumulate [13]. As it is in the liquid state under standard conditions, when it is found in groundwater bodies it can easily move from soil to groundwater and vice versa. In particular, in extractive processes, it is used in the amalgam phase, during which it binds to the gold and then, by bringing the amalgam to very high temperatures, the two materials separate: the gold can then be recovered, and the mercury evaporates [14,15]. It is clear that carrying out such a process without taking appropriate precautionary measures and mercury capture systems inevitably results in the diffusion of mercury vapor into the atmosphere and subjects operators to inhalation [16].
Mercury is a heavy metal belonging to the transition group, and is the only metal found in nature in a liquid state at room temperature. Because of its particular behavior, mercury is very prone to dispersing and spreading rapidly, and is very difficult to recover since in its liquid state it separates into globules characterized by high speed of movement, and, furthermore, depending on external conditions it can easily evaporate and recondense [17]. Due to anthropogenic activities, mercury is often introduced into the environment in an inorganic form, but natural processes may intervene to convert it into an organic form; when it reaches aquatic environments, it interacts with the bacteria present, which convert it into methylmercury [CH3Hg]+, a compound that can persist in the environment for centuries [17]. Mercury can occur in three different forms: elemental mercury, inorganic mercury compounds, and organic mercury compounds. All have a toxicity rate, but organic mercury compounds, such as methylmercury or dimethylmercury, are considered the most toxic [18]. In laboratories, methylmercury salts aggregate to form solid crystals, but it is very difficult to detect their presence in the environment where they are formless [17].
The overall objective of a risk analysis is to assess the risk to the environment and human health from contamination by one or more pollutants. Accurate analysis requires the deployment of considerable resources in terms of economic, technical, and logistical resources. Therefore, it is always preceded by general analysis. First-level analyses are carried out from very conservative assumptions. Therefore, reference is made to total mercury as an analysis criterion, since potentially all mercury in the environment can be transformed into its most toxic form. Moreover, contamination becomes of greater concern the more vehicles exist in the environment for it to reach receptors. And this is all the more likely in an environment as rich in biodiversity as the Ecuadorian coast. The use of such a precautionary approach enables results for safety benefits, and easily identifies the most affected areas where institutions can provide the necessary resources to plan and conduct more detailed analyses.
The effects that mercury can have on human health vary depending on the concentration, the vulnerability of the individual and the duration of exposure to the contaminant, but in the case of prolonged exposure, the effects can be very serious: they range from cancer to malfunctioning of vital organs such as the liver, lungs and heart [19,20].
Human receptors in mining areas can be reached by contamination through different migration pathways, but in general this depends on the characteristics of the environment considered [2,21]. Since ASGM is often located in inhabited areas, both residential and recreational scenarios should be considered for the analysis. For both scenarios, the most frequent mode of exposure results as accidental ingestion of contaminated water. Added to this is the consumption of fish caught near mining areas, which can introduce organic mercury (methylmercury) into the human body [10,21]. Furthermore, in workplaces where mining is illegally conducted, and where amalgamation processes involving mercury are carried out, inhalation of elemental Hg vapors is the most frequent type of exposure [4]. A final mode of exposure worth mentioning is dermal contact: due to this phenomenon, a contaminant can be adsorbed through the skin. This depends on the chemical form of the metal [22]. Consistent with this picture, the population surrounding mining areas is subjected to multiple modes of exposure and therefore presents a high risk of developing adverse health effects [23].

Mining in Ecuador

Mining in Ecuador has ancient roots and has evolved over the years, influenced by many factors. According to some sources, most of the mining activities in the country originated from pre-Hispanic cultures, although there are not certain data on the techniques used. However, it is known that rudimentary tools were used in pre-colonial times [2,24]. It was not until the mid-16th century that the sighting of gold particles in the Zaruma and Portovelo areas prompted the prospectors to search for nuggets in the waterways [2]. Until the late 19th to mid-20th century, responsibility for the mining exploitation of the Portovelo areas lay with the South American Development Company—SADCO. Subsequently, responsibility passed to the Industrial Mining Associated Company (CIMA), which operated until the 1970s, only to give way to exploitation by small-scale miners and artisans [2,25]. From an administrative point of view, in the first phase of its existence, mining was not governed by any legal regulations. Later, with the growth of the mining industry, which also paralleled the creation of the state of Ecuador, the first interests arose in 1830 in establishing a regulatory system to regulate property rights and encourage foreign investment [2,26]. After a long epic of bills, approvals, and amendments, an amendment, known as the Organic Reformatory Law, was made to the Mining Law in order to establish more equity and the Internal Tax Regime [27]. However, it is essential to highlight that unique and specific legislative measures are sometimes implemented in some areas of the country in order to avoid disasters [12].
Historical evolution has led to the current situation: today, 264 gold mining concessions are legally registered in the coastal region, including artisanal mining, small-scale mining, medium-sized mining, large-scale mining, and a general regime. The most exploited province is El Oro with 213 gold mines, followed by Guayas with 24 mines, Esmeraldas with 16 mines, Los Ríos with 5 mines, and Santo Domingo de las Tsáchilas with 4 mines. However, the Minister of Energy and the National Police noted a worrying increase in illegal gold mining activities due to the lack of control during the COVID-19 pandemic [7]. Among the areas affected by this phenomenon, the El Oro province stands out, particularly the San Lorenzo canton, although a measure was introduced in 2011 to prohibit any kind of mining activity [12]. On 18 November 2020, a landslide occurred in an illegal mine, killing several people [28]. According to a National Institute of Statistics and Census of Ecuador—INEC report, the provinces in Ecuador’s coastal region have high poverty rates, despite the fact that some cantons such as Zaruma, Portovelo, and Camilo Ponce Enriquez produce around 86% of the gold exported throughout the country from small-scale mining [12]. The population is therefore induced to embrace illegal mining due to the conditions of extreme poverty and lack of other employment opportunities [29].
The objective of this study was to analyze mercury (Hg) concentrations in five provinces in the coastal region, in order to carry out a human health risk assessment of populations exposed to contamination. For this purpose, 67 water samples were taken, with the sampling points selected according to the distribution of mining activities in the region. The collected data were then processed, conducting a risk analysis using both the traditional deterministic approach and the more innovative probabilistic approach. Comparing the results of the two approaches provides a more complete overview of the situation.

2. Materials and Methods
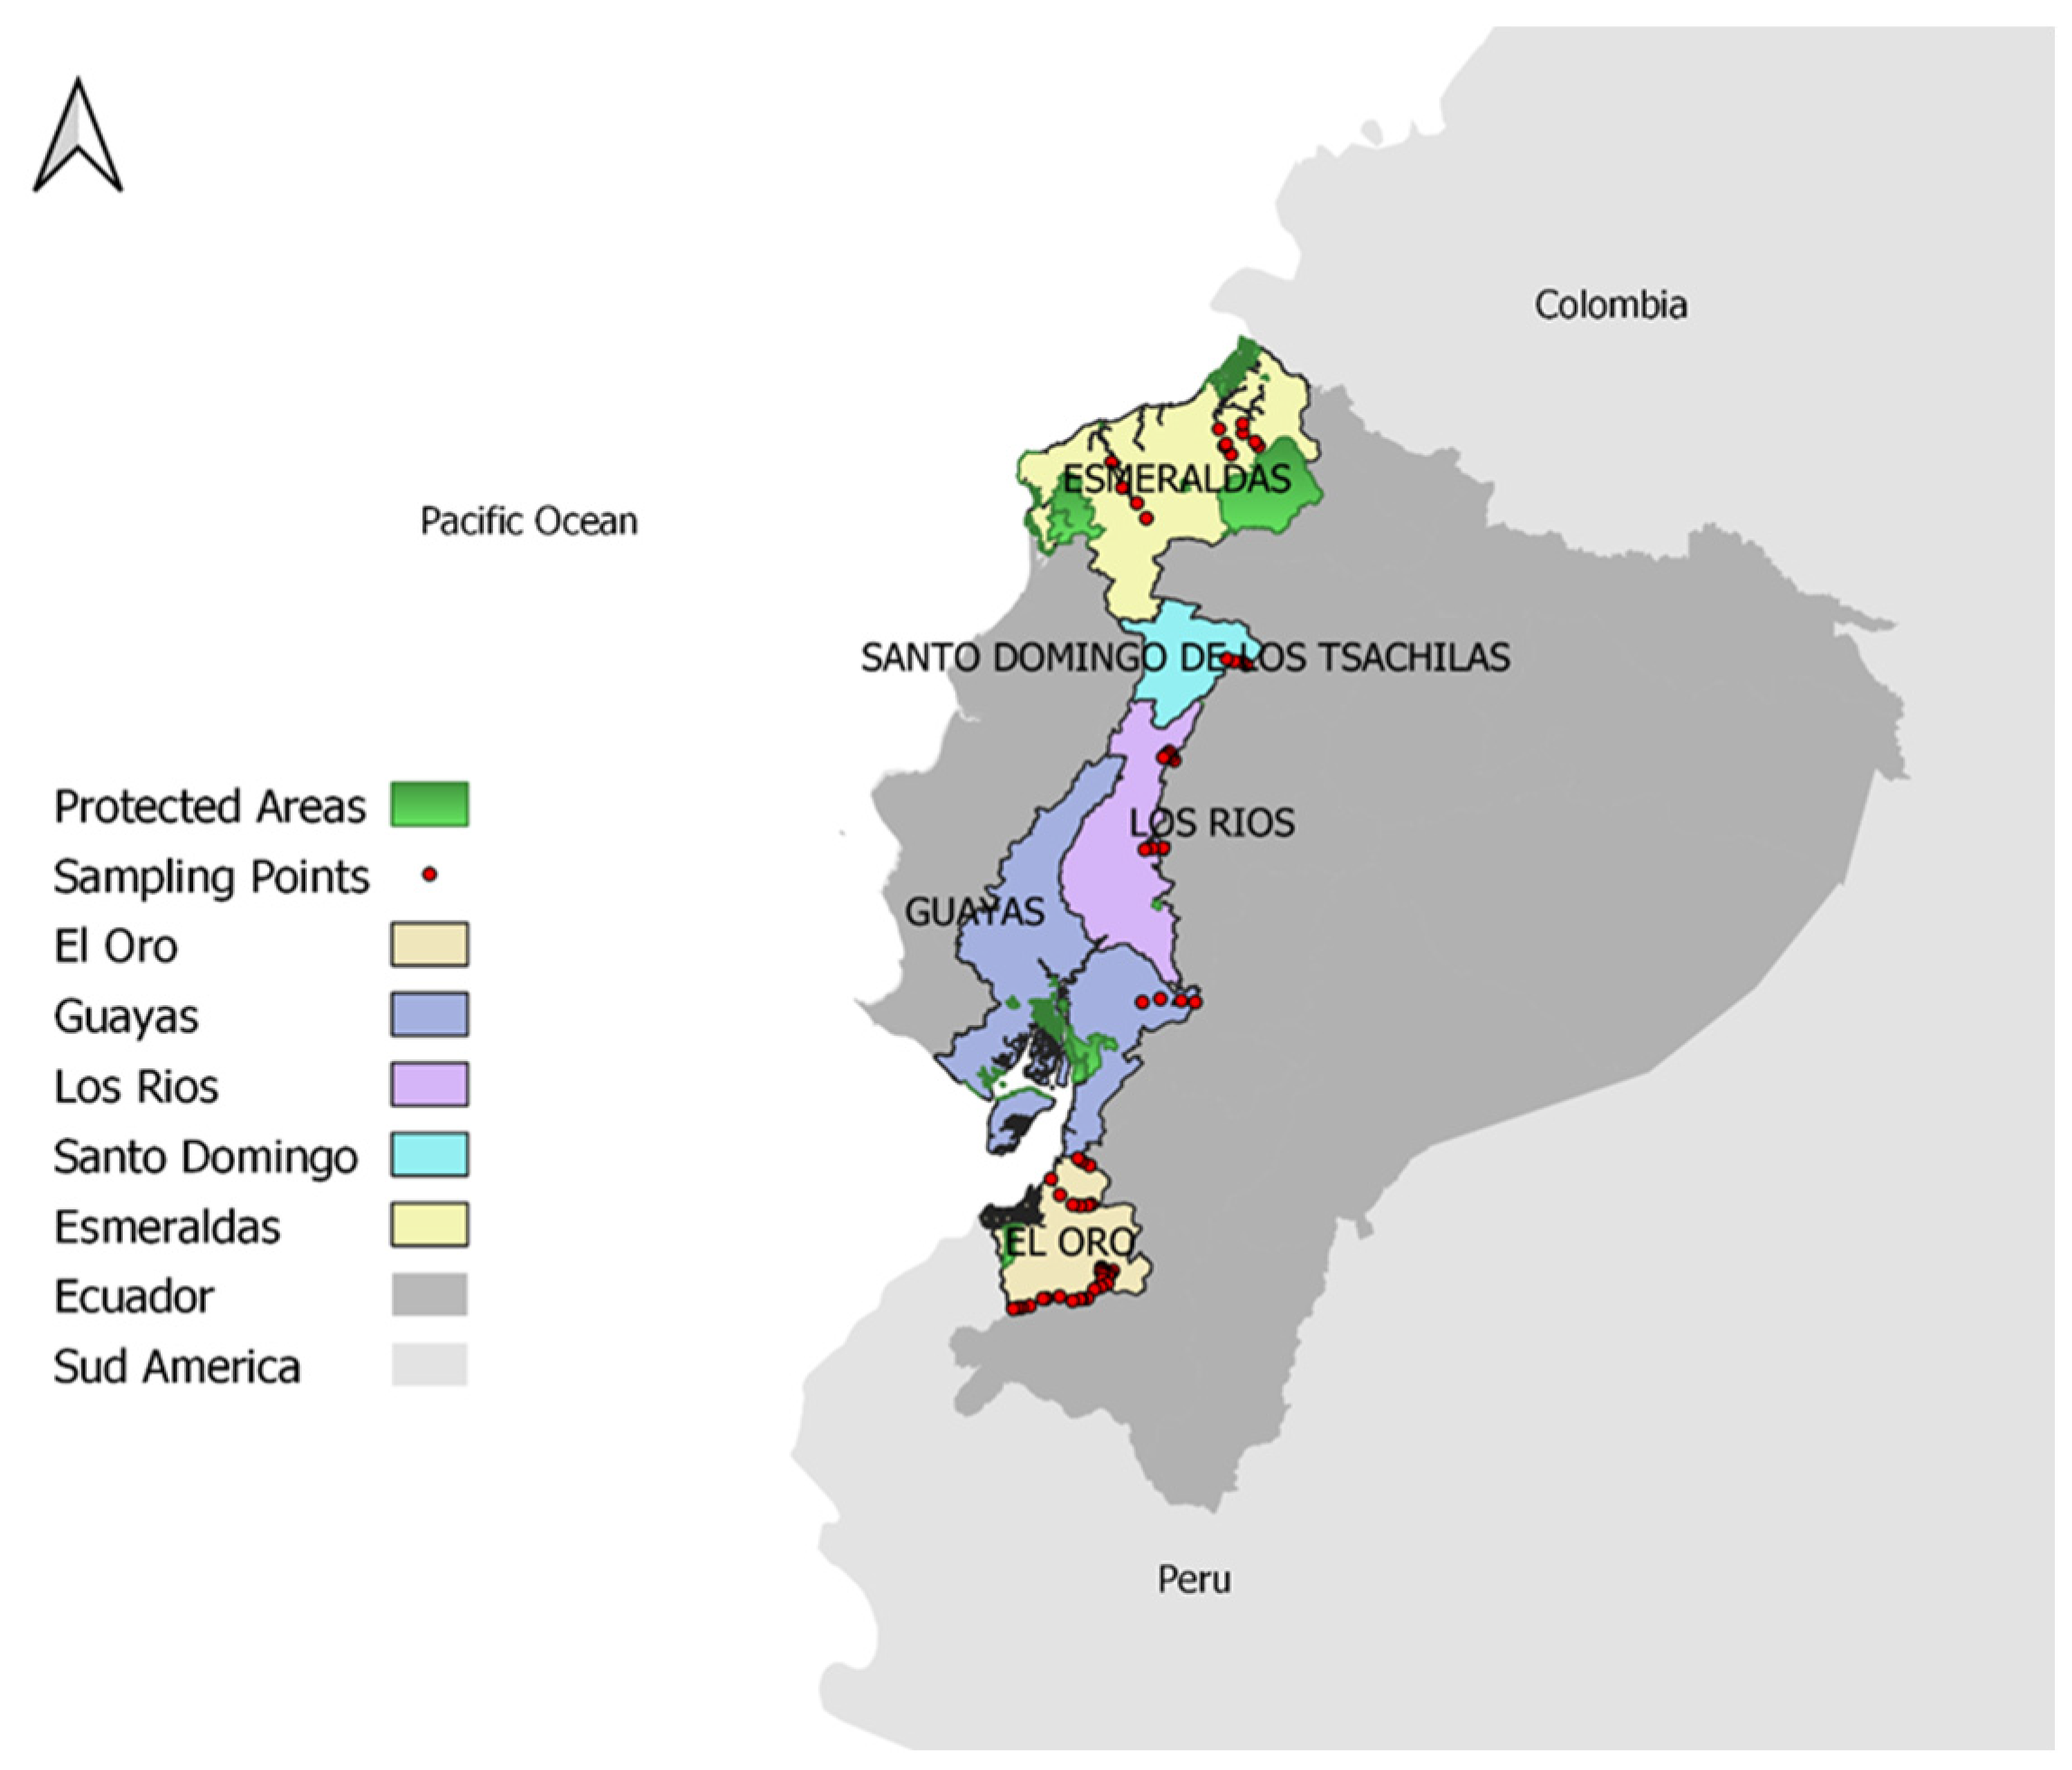
2.1. Study Area

This study concerns the following provinces of the Coast region of Ecuador: Guayas, Esmeraldas, El Oro, Los Ríos, and Santo Domingo de las Tsáchilas (Figure 1), which together correspond to an area of approximately 70,472 km2 and have a population of approximately 8.5 million inhabitants [30]. The coastal region is situated between the Andes Mountain range and the coastal profile. The climate is uniform on average, but there are significant differences between the northern and southern provinces. The northern provinces, especially Esmeraldas, are characterized by a high rainfall regime and dense vegetation. The southern provinces are characterized by an arid climate regime, with the presence of semi-desert plains. The province of Esmeraldas is covered by estuaries and rainforests, which also makes it extremely rich in biodiversity. From a geomorphological point of view, the coastal region has a varied layout, with a wide range of mountainous reliefs, plains, and wide coastlines [2,31]. All the higher and more moderate elevations of the coastal region are located west of the Guayaquil–Quinindé line and north and north-east of the city of Guayaquil. The central framework of the coastal region is formed by the so-called coastal mountains, a massif that crosses the area longitudinally. It is settled on a volcanic–cretaceous complex (rich in basalts, diabase, andesites and pyroxenites), which in turn is covered by discordant rocks of the volcanic–sedimentary complex (conglomerates, sandstones, greywackes, pillow lavas and silicified clays) [31]. The central–eastern and southern part of the coastal region is characterized by flat areas extending to the foothills of the plateaus. The morphological variety is reflected in an equal geological variety. The soil structure presents a rich assortment that can vary depending on the province in question with vertisols, alfisols, entisols, aridisols, molisols, andisols, and inceptisols [1].These characteristics make the soil particularly suitable for the development of geological processes that preside over the formation of mineral deposits [32]. The favorable climatic conditions combined with the wealth of natural resources are factors that have always made the coastal region one of the most suitable for the development of multiple economic activities, and therefore one of the most exploited [33]. The overall picture is one of a land rich in resources, biodiversity, and geological variety. These conditions also facilitate the potential spread of contamination. Indeed, the largest impact of gold mining on the environment is the contamination of soil and water resources through improper discharge and infiltration of toxic substances [2,34]. This implies that, in northern provinces covered by a dense hydrographic network (such as Esmeraldas), the presence of toxic substances in the environment can spread from watercourses to soil, groundwater, fish fauna and finally to humans. Similarly, contamination can spread rapidly in the soil in areas with medium to high permeability soils such as sands [35].
The coastal region has two main basins: the Manglaralto River Basin, to which the northern territories belong, and in the south the Guayas River Basin. The Manglaralto basin shows aquifer water levels varying between 1.72–23.1 m asl. The predominant grain sizes are gravel, sands, silts, and clays. Thus, these are soils with permeability varying between 1.6 and 5 m/day [36]. This area is characterized by a predominantly arid climate and is of considerable interest from the point of view of tourism, resulting in the presence of seasonal fluctuations in attendance. These factors contribute to overexploitation of aquifers, also promoting the intrusion of sea water into them, with limestone inputs from the marine environment. In addition, infiltration of stormwater can result in the dissolution of evaporitic materials, which can in turn reach the aquifers [37]. Therefore, the hydrogeological context is conducive to the potential infiltration of mercury into the soil.
Regarding the hydro-chemical footprint in groundwater, this is determined by multiple influencing factors, including rainfall regime, ion exchange, dilution, and anthropogenic activities. The study conducted by Carrión-Mero et al. (2021) found a chemical footprint of Ca-Na-Cl and Ca-Na-CHO3; in addition, in the recharge phases of the aquifer there was a cation exchange (Ca2+ to Na+). Finally, in the belt closest to the coast, a Ca-Cl chemical footprint was detected [38]. As far as the Guayas River Basin is concerned, it is compounded by an additional aggravating factor represented by the increasing population that has resulted in a significant intensification of anthropogenic activities, especially in land use, altering the ecological quality of the water [39]. These conditions favor the possibility that not only can mercury reach the groundwater, but it can also interact with other elements, worsening the situation.
Mercury methylation is the most significant reaction from the point of view of environmental impact. Numerous experimental investigations have revealed a number of factors that are capable of promoting mercury methylation, including the following: pH, Hg2+ concentration, redox potential, water temperature, nutrient, and sulfate concentration, and dissolved organic carbon concentration [40]. The presence of methylmercury in the environment poses a threat to ecosystems. Therefore, the threat becomes closer if it is introduced into river and lake environments, contaminating first fish populations and then humans. Several studies have found a higher presence of mercury in predatory fish; this is explained by the fact that mercury accumulates along food chains [36]. Part of the coastal population lives from fishing, and fish is an integral part of the local diet. Specifically, the World Health Organization (WHO) set the tolerable weekly dose of MeHg at 1.6 1.6 μg/kg human body weight/week [41].
In aquatic environments, the presence of particular microorganisms contained in the sediments deposited on the bottom facilitates the conversion of mercury into organic methylmercury (MeHg). Methylmercury is the main culprit in contaminating fish populations. However, the extent of contamination is also influenced by other factors. The first influencing factor is the concentration of available mercury, and the possible presence of other contaminants, but the age of the fish is also a factor since mercury accumulates inside their tissues according to their feeding habits. In particular, an increased presence of mercury was found in predatory fish [42].

2.2. Sampling and Laboratory Analysis

The analysis began with field work carried out between March and July 2022, a period characterized by rainfall values between 200 and 300 mm [43]. The sampling points were chosen with reference to the location of the mining concessions, so water samples were taken from wells for human consumption located in inhabited areas (mainly hamlets or rural communities) (Figure 1). This study focused on analyzing the concentration of Hg in water samples from aquifers. Regarding the procedure for taking and transporting the samples, 250 mL amber flasks were used, subjected to acidification with 0.10 mL of nitric acid. All the samples were transported under a rigorous chain of custody to the Science Laboratory of the Escuela Superior Politécnica de Chimborazo, Sede Orellana, Ecuador. The procedure to determine the Hg concentration was based on atomic absorption and hydride generation (atomic absorption spectrophotometry). The Hg measurement range was from 0.0005 to 10 mg/L; the reference method used was Standard Methods, Ed. 23. 2017, 3112B-Acid Digestion: EPA Method 3015, 2007. Samples were prepared according to the nitric acid digestion procedure described in EPA Method 7473 [44]. The entire process from sample collection to processing in the laboratory complied with international quality, confidentiality, and code of ethics policies.
In the samples analyzed, the total organic content averaged 7.5 mg/L. This value indicates the presence of organic contaminants. In order to avoid the interference of total organic content on the determination of mercury levels, a filtration process was performed and reduced the content to 2.1 mg/L. Minimizing the TOC is an essential step to avoid the formation of organic complexes with mercury. Evaporation losses were not quantified, as the TOC was reduced to a value within the range of uncontaminated water samples. In addition, water samples were acidified by adding nitric acid (HNO3) because it preserves mercury and inhibits microbial growth. Nitric acid is a strong oxidant that facilitates the conversion of volatile elemental mercury Hg0 to ionic mercury (Hg+2), thus minimizing the possible loss of the analyte (Hg) by volatilization.

2.3. Risk Assessment and Characterization

To carry out the health risk assessment, i.e., for human health, two possible scenarios were considered: the residential scenario and the recreational scenario. In both scenarios, the main modalities of exposure by which human receptors may come into contact with the contamination, and which must therefore be taken into account, are water ingestion and dermal contact. The potential risk associated with human health was assessed through the HQ calculated for non-carcinogenic substances, for each modality of exposure, defined as the ratio of the average daily dose ADD to the reference dose RfD. The average daily dose was determined using Equations (1) and (2) below, USEPA 2001 and 2004, respectively. Organic Hg was taken as the reference for RfD because it is the most water-soluble Hg compound, and its value was obtained as reported on the Risk Assessment Information System website [45]. Since two scenarios were considered, the risk was assessed in terms of cumulative risk, through the so-called HI Hazard Index, given by the sum of the HQs for the two scenarios. If one of the HQs or the HI tends to take values close to or even above unity, this means that the safe exposure threshold has been exceeded and, therefore, adverse effects related to Hg exposure may occur. In order to reduce the uncertainties involved in risk assessment, the analysis was conducted using the traditional deterministic approach, and in addition a probabilistic approach [14].
A D D i n g e s t i o n = C s w · E F · I R · E D A T · B W · C F
Equation (1)—Average daily dose by the route of ingestion, USEPA 2001.
A D D d e r m a l   c o n t a c t = C s w · E F · E T · E D · S A · k p A T · B W · C F
Equation (2)—Average daily dose by the route of dermal contact, USEPA 2004.
Where the meaning of the parameters is as follows:
C G w = H g   c o n c e n t r a t i o n   i n   w a t e r   ( m g L ) E F = e x p o s u r e   f r e q u e n c y   ( d a y s y e a r ) I R = i n g e s t i o n   r a t e   o f   w a t e r   L d a y E T = e x p o s u r e   t i m e   h o u r s e v e n t E D = l i f e t i m e   e x p o s u r e   d u r a t i o n   y e a r s S A = s k i n   s u r f a c e   a r e a   e x p o s e d   c m 2 k p = s k i n   p e r m e a b i l i t y   c o n s t a n t   c m h o u r A T = a v e r a g i n g   t i m e   d a y s B W = b o d y   w e i g h t   k g C F = c o n v e r s i o n   f a c t o r

2.3.1. Insight into the Significance of Parameters

  • CGW (Concentration): it represents the concentration of mercury detected at selected sampling points.
  • EF (Exposure Frequency): it is a representative parameter of the average number of days per year the receptor is considered to be exposed to contamination. Therefore, the value of EF varies depending on the scenario considered.
  • IR (Ingestion Rate): it represents on average the amount of contaminated water ingested daily by the receptor. Clearly, this quantity varies depending on both the scenario considered and the type of receptor.
  • ET (Exposure Time): it represents the duration of exposure with reference to the individual contamination event. Its value depends on the considered scenario.
  • ED (Exposure Duration): it represents the duration, expressed in years, over which, on average, the receptor is considered to be exposed to contamination. Therefore, the ED value varies depending on the type of receptor: adult or child.
  • SA (Skin Area): it is the average area of skin considered to be exposed to contamination through dermal contact. It varies depending on the type of receptor considered.
  • Kp (Skin permeability constant): it is the amount of contaminant absorbed per centimeter of skin exposed per hour.
  • AT (Averaging Time): it represents the period over which the exposure is averaged. This parameter’s value differs depending on whether toxic (non-carcinogenic) or carcinogenic substances are being considered. In the case of toxic substances, as with mercury, it is conventionally assumed that TA coincides with ED.
  • BW (Body Weight): it is the average body weight of the receptor, so it has a different value for adult and child receptors.
  • CF (Conversion Factor): it is used to standardize units of measurement. Therefore, it is assumed to be 365.
  • RfD (Chronic Reference Dose): it represents the maximum dose of toxic contaminant that can be accepted. In essence, it is the concentration value of the pollutant for which no adverse effects on human health have been found in the literature.

2.3.2. Calculation of HQ and HI

The risk for non-carcinogenic toxic substances is quantified by reference to the Hazard Quotient (HQ). When multiple scenarios are considered, the corresponding Hazard Quotients (HQs) are added together and the overall risk is quantified by their sum, which is called the Hazard Index (HI). The Hazard Quotient expresses how many times the maximum tolerable daily intake of contaminant, per unit of body weight, is exceeded. Indeed, HQ is calculated as the ratio between the Average Daily Dose and the Reference Dose, as follows:
H Q i n g e s t i o n / d e r m a l = A D D i n g e s t i o n / d e r m a l R f D i n g e s t i o n / d e r m a l
Equation (3)—Hazard Quotient.
The Hazard Index HI is calculated by cumulating the HQs of the considered receptors in each scenario. With regard to the Reference Dose, the following values were considered: RfDingestion = 0.0003 mg/kg day; RfDdermal = 0.000021 mg/kg day.
When the Hazard Quotient (HQ) or Hazard Index (HI) exceeds the unit value, it means that the Average Daily Dose (ADD) taken by receptors is higher than the Reference Dose (RfD). Since the RfD represents the threshold of the contaminant considered below which no adverse effects on human health have been found, if the ADD exceeds this threshold, the likelihood of such adverse effects increases. The more the Hazard Quotient (HQ) or the Hazard Index (HI) value exceeds unity, the greater the risk can be considered to be.
The opensource software QGis (version 3.16) was used to process spatial information and generate maps. The probabilistic calculations were developed using the R programming language [46], with which 10,000 iterations were performed to ensure greater reliability of the analysis. The table containing the values of the parameters used in the analysis is also shown below (Table 1).

3. Results

3.1. Hg Concentration in Water

The potential sources of mercury (Hg) contamination in the study area are manifold and can interact with receptors in many different ways. In the residential scenario, receptors may incur contamination through consumption of contaminated water from groundwater, or consumption of fish and vegetables that are themselves polluted. Moreover, mining operators can incur contamination at work, due to the lack of appropriate safety measures. In the recreational scenario, contact with contamination may occur as a result of carrying out recreational activities, through dermal contact with contaminated water and soil. The effects of mercury exposure on human health can vary from changes to the respiratory system to cancer and DNA mutations, and even death in the most severe cases.
The summary statistics of Hg concentration in the groundwater samples for each province are presented in Table 2. The Hg concentration for the 50th percentile (p50) decreased in the following order: El Oro > Esmeraldas > Los Rios > Santo Domingo de los Tsáchilas > Guayas. These results confirm, as do other studies [11], that the El Oro province is the one most affected by contamination. The MPL set by Ecuadorian legislation for the quality of water for human consumption is 1 µg/L (INEN 1108), and, in this region, 2.28% of the samples analyzed were above this threshold. Of the values measured during sampling, in the entire region, 34% were below the measurement threshold of the measuring equipment (LoD = 0.5 µg/L). In the other provinces, 100 per cent of the detected concentrations were below the MPL value.
Specifically, in the provinces of Santo Domingo de los Tsáchilas and Guayas, Hg concentrations could not be detected at any of the sampling points. This could indicate that the concentrations are below the instrument’s detection threshold. However, undetected values could also be caused by malfunctions in the instrumentation or accidental errors on the part of the operators. In such cases, it may be appropriate to repeat the measurements several times. Moreover, it is possible to consider constructing a new data set cleaned of non-detected values. In the present study, a Hg concentration of half the MPL was assumed at the points where the values were not detected. Percentiles express the minimum value below which a certain percentage of the observed data falls. Thus, p50 expresses the limit below which 50% falls. The Standard Deviation (S.D.) is a statistical parameter that expresses the deviation of observed values from the mean.
To date, there is no specific information on Hg concentrations in groundwater bodies in the Costa region of Ecuador. The studies conducted to date have reported Hg concentration values in surface water, sediments, and groundwater [14], soils, biological samples [52], and fish [53].Therefore, this study represents a baseline for future research on groundwater quality in the region.
A comparison with the results of studies that have assessed Hg concentrations in groundwater in different areas of the world with the presence of gold deposits shows that the values found in the coastal region of Ecuador are within the range of the values reported in these studies. In particular, mention may be made of the following: Dorleku et al. (2018) [54] reported Hg values for Ghana ranging from 1 µg/L to 13.2 µg/L. Al-Hobaib et al. (2013) [55], for Saudi Arabia, assessed the presence of Hg in groundwater in areas near the Mah Adh Dhahab gold mine, where Hg concentrations of up to 99.90 µg/L were recorded. Finally, Taiwo et al. (2017) [56] found average concentrations of 1 µg/L in gold areas in Nigeria.

3.2. Human Health Risk Assessment

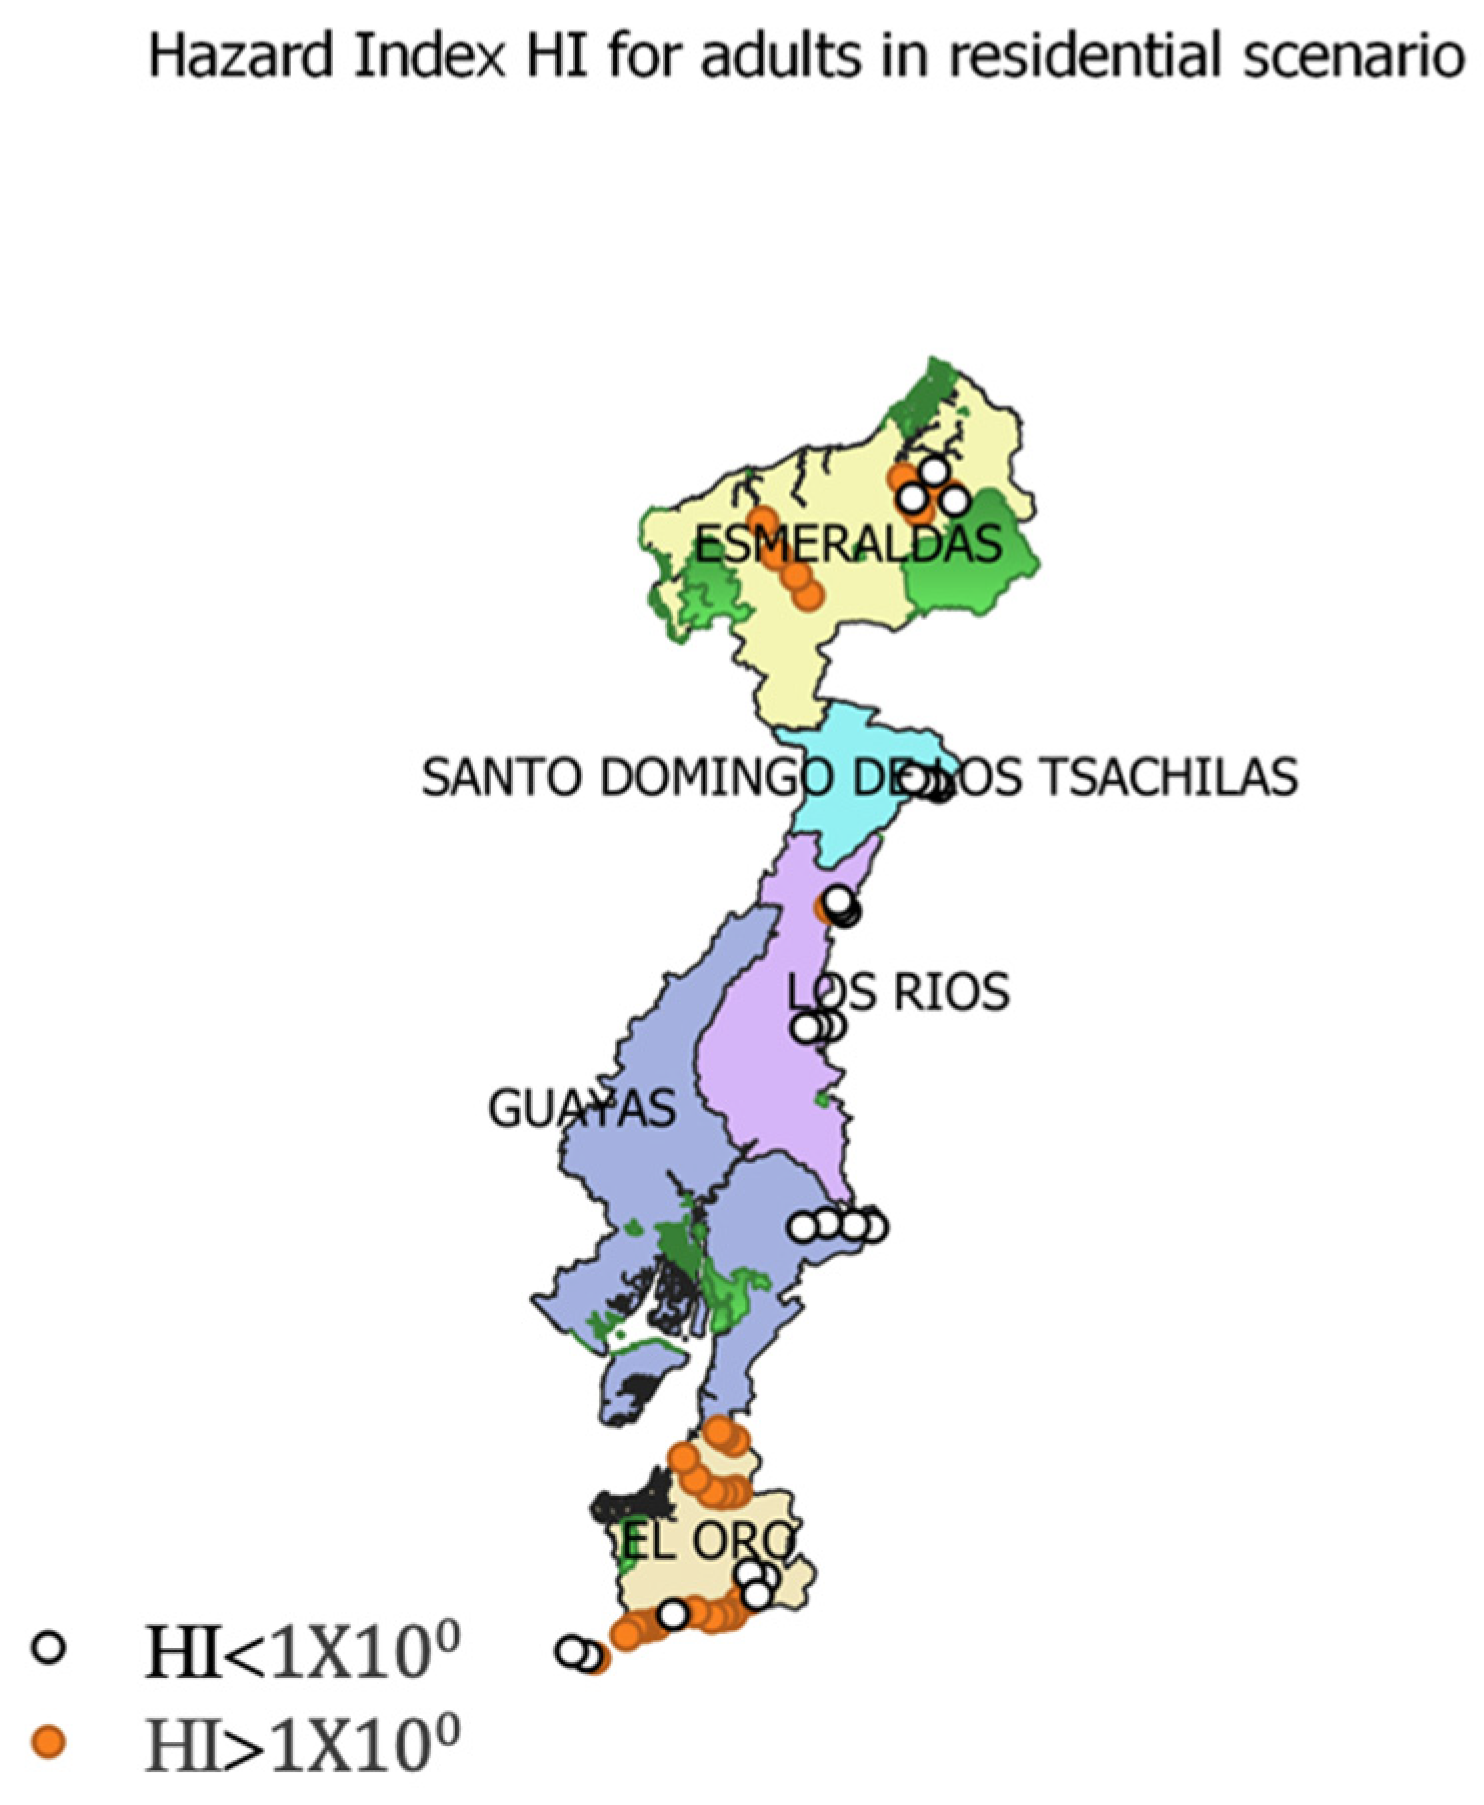
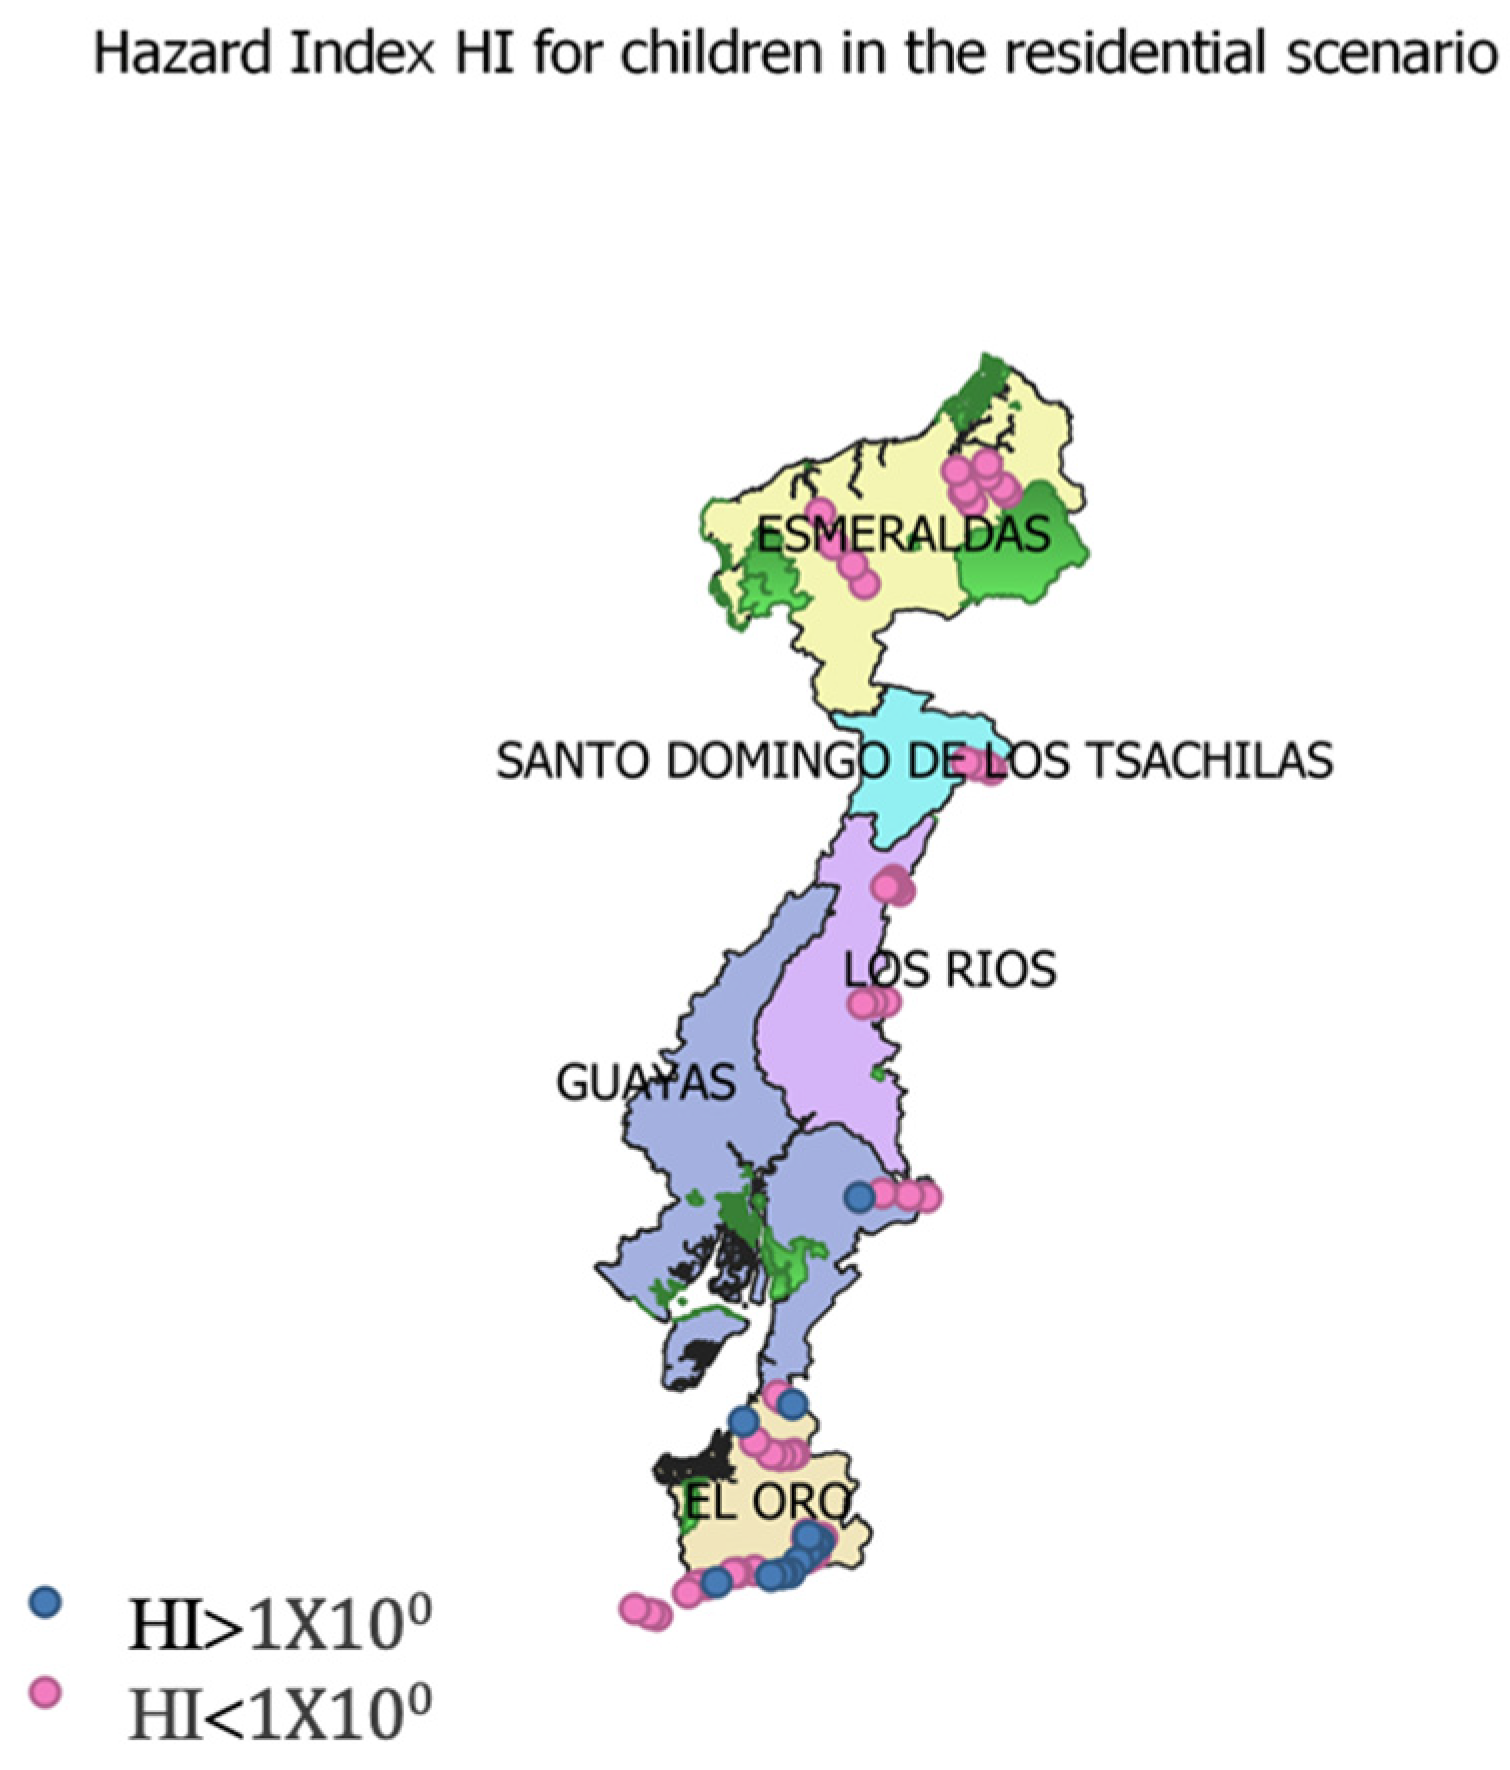
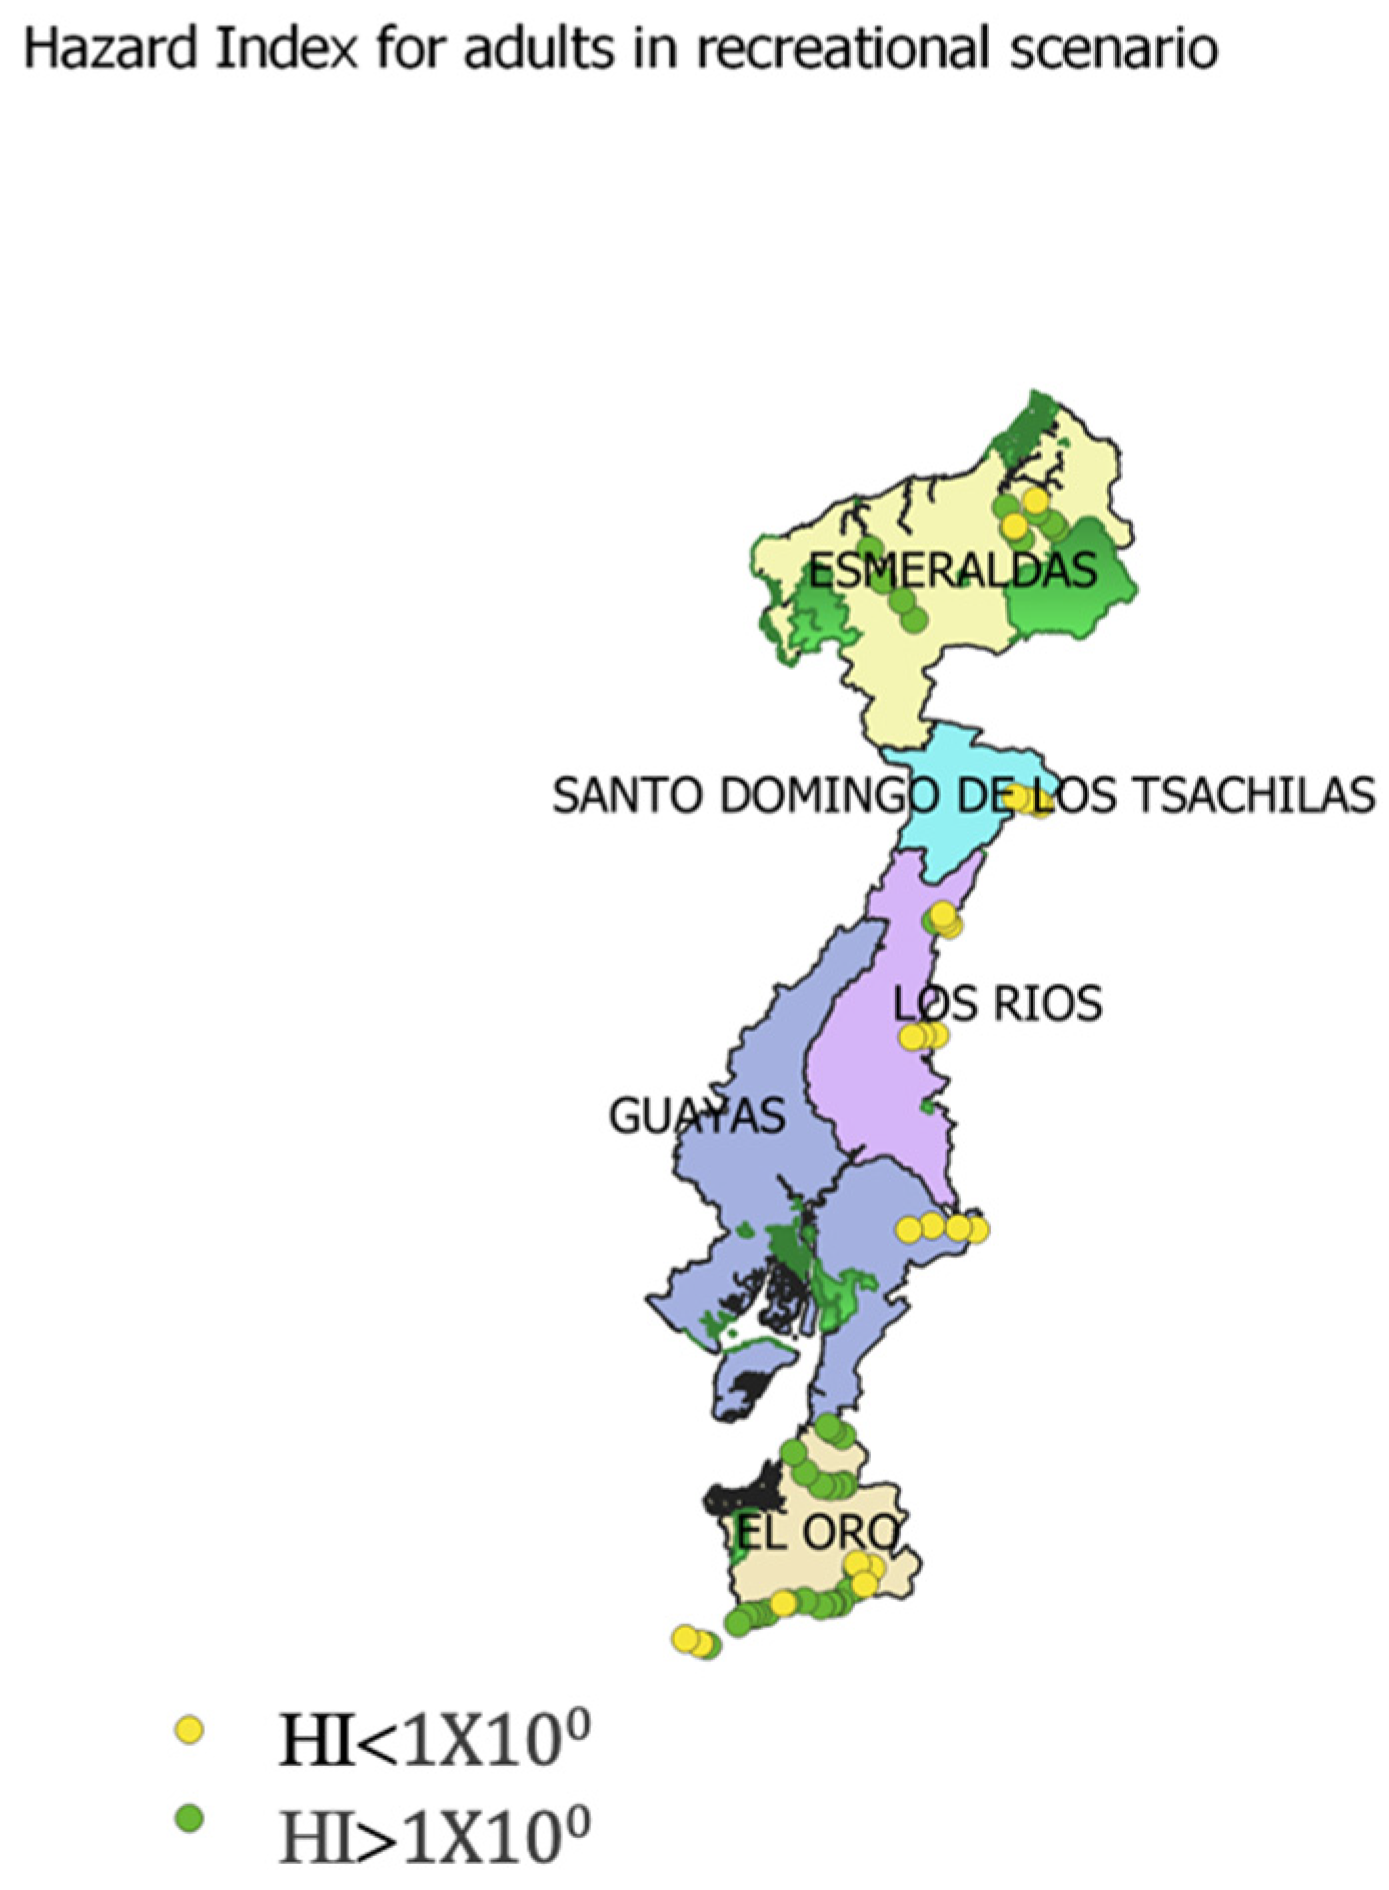
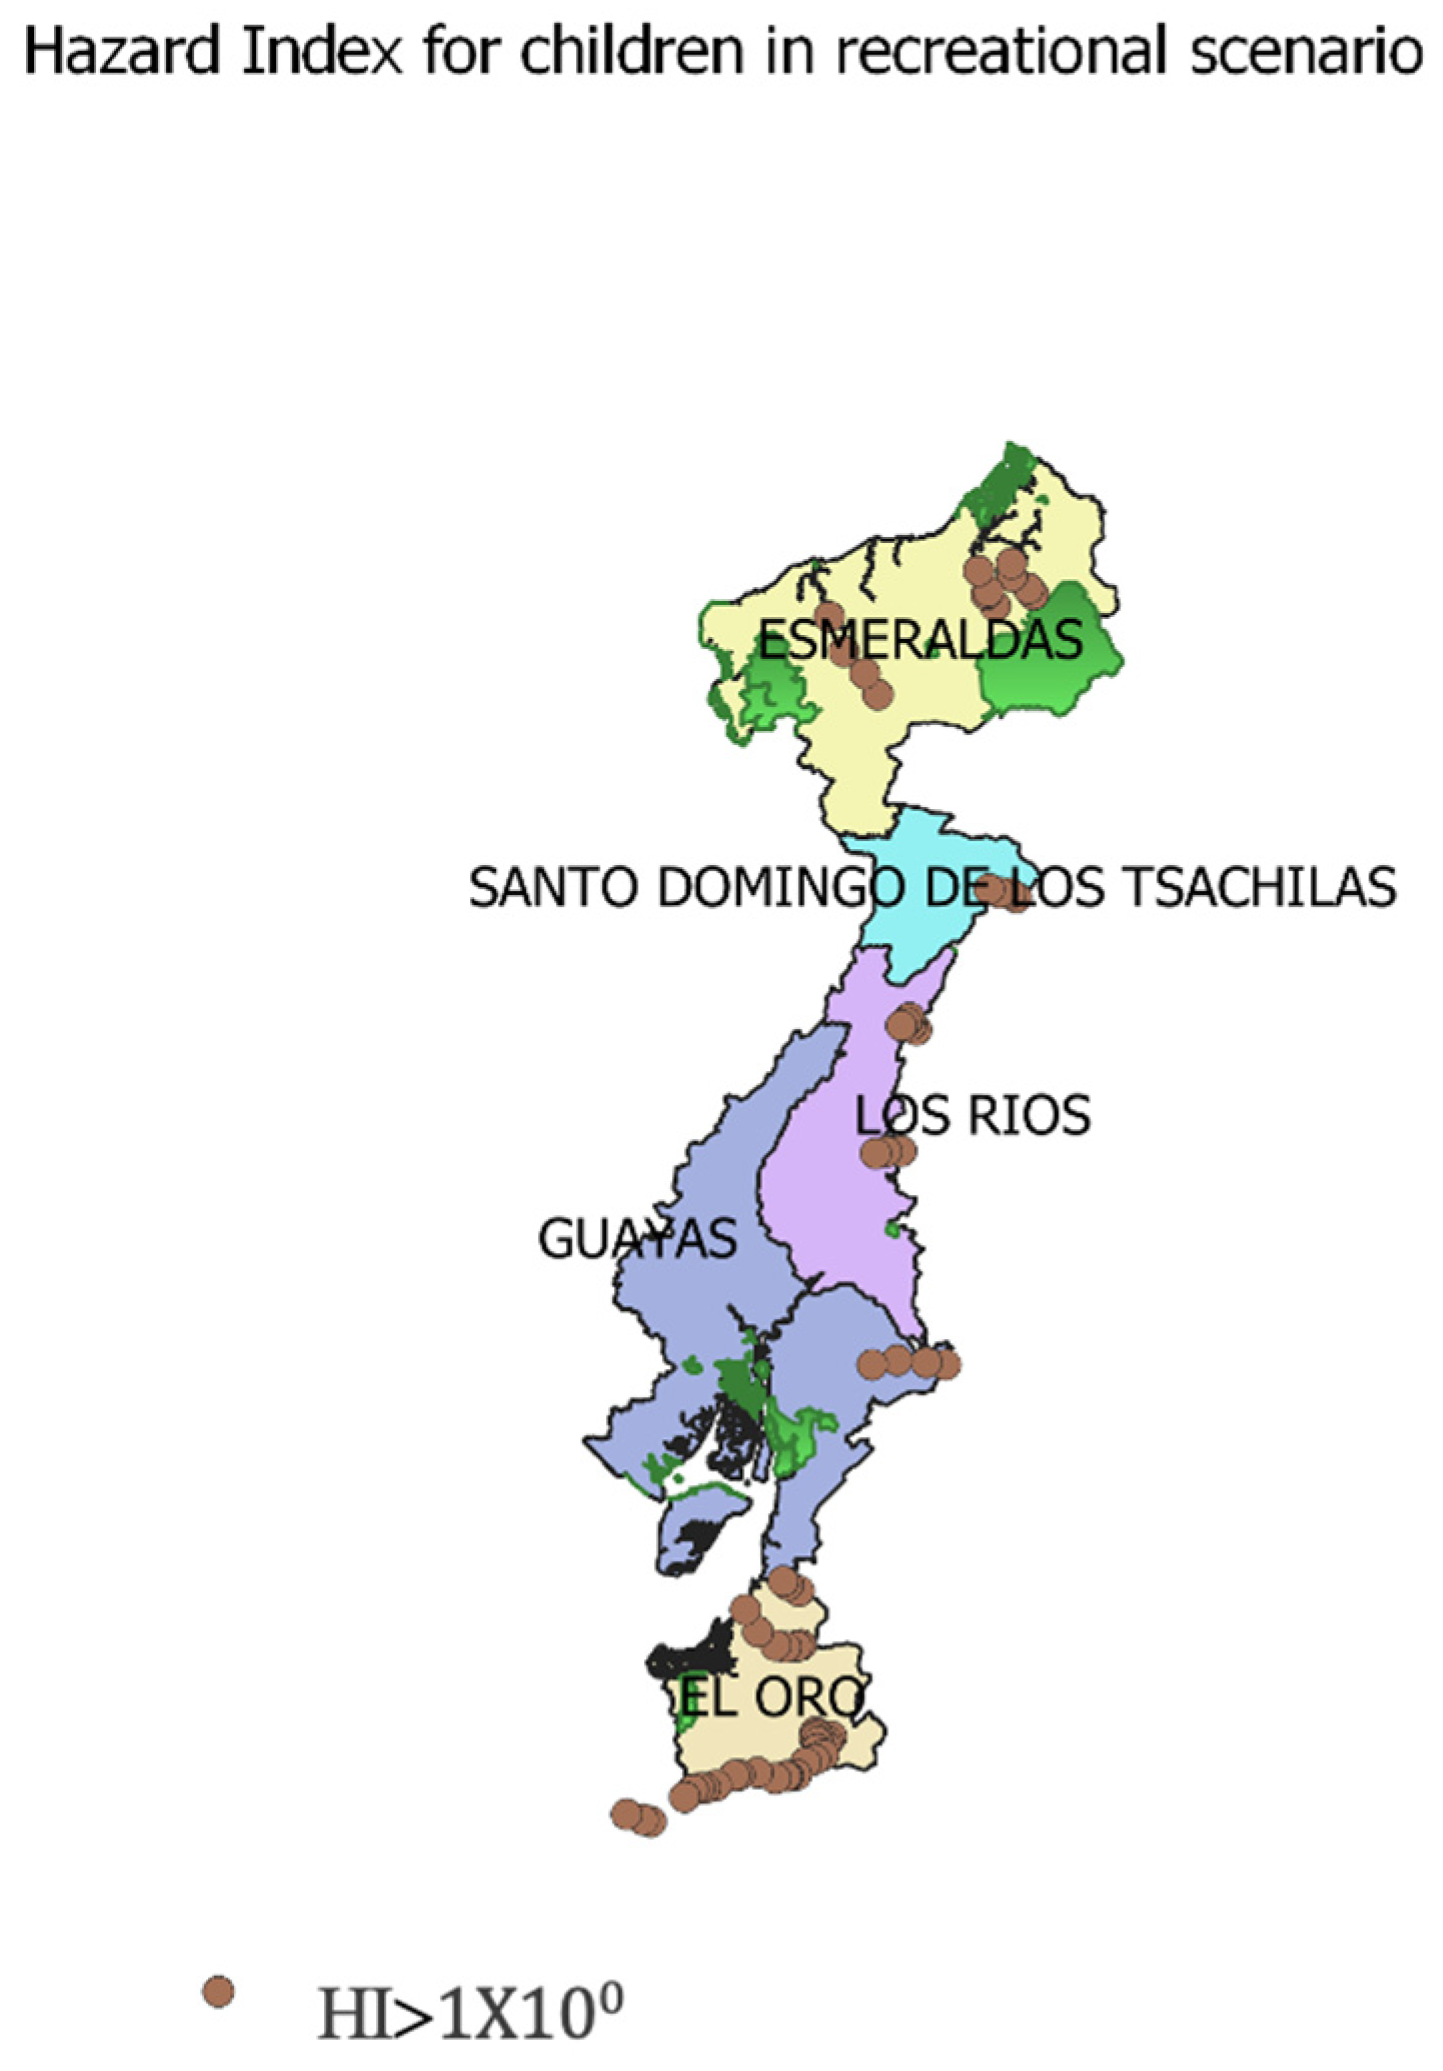
3.2.1. Deterministic Approach

The results of the risk analysis conducted using a deterministic approach are presented in Figure 2 as a point risk map. The numerical values of HI per province for the 95th percentile (p95) of the data (Table 3) followed the following decreasing order: El Oro > Esmeraldas > Los Rios > Santo Domingo > Guayas. Although the concentrations detected were, in many cases, below the MPL value established by Ecuadorian legislation, it cannot be said that the provinces analyzed are not at risk. This is because, clearly, in the risk analysis, in addition to concentrations, factors that increase the probability of contamination coming into contact with receptors are also taken into account. The provinces of Santo Domingo de las Tsáchilas and Guayas show concentration values below the instrument detection threshold at all sampling points. The most critical provinces were El Oro and Esmeraldas. In particular, the province of El Oro is at risk for adults with regard to ingestion in the residential scenario (84%), and the situation is even more worrying with regard to the recreational scenario, especially for the child population. The results for the province of Esmeralda are similar (75%). As for the Los Rios region, about 33% of the determined HI values exceeded unity in both the residential and recreational scenarios. In general, the child population resulted to be more exposed. A higher HQ value associated with dermal contact is also evident from this study. A similar result was obtained in a study carried out by Teixeira et al. (2021) [57].
Figure 2 shows the results of the point analysis for adult receptors in the residential scenario. At the points where sampling was conducted, the corresponding Hazard Index value was determined and depicted. A greater presence of the hazard was found in the provinces facing the coast at the extremes of the region: El Oro and Esmeraldas.
Figure 3 shows the results of the point analysis for the child receptors in the residential scenario. At the points where sampling was conducted, the corresponding hazard index value was determined and represented. A higher presence of the hazard was found mainly in the province of El Oro, and partly in the province of Guayas.
Figure 4 shows the results of the point analysis for adult receptors in the recreational scenario. At the points where sampling was conducted, the corresponding hazard index value was determined and represented. A situation similar to the residential scenario is found qualitatively, with a greater presence of the hazard in the provinces of El Oro and Esmeraldas.
Finally, Figure 5 shows the results of the point analysis for the child receptors in the recreational scenario. At the points where sampling was conducted, the corresponding hazard index value was determined and represented. In this case, receptors are found to be exposed throughout the region. The likely causes are the ease of contamination in play environments for children, and the ability of mercury to be adsorbed through dermal contact.
Percentiles express the minimum value below which a certain percentage of the observed data falls. Thus, p95 of a parameter expresses the limit below which 95% falls.

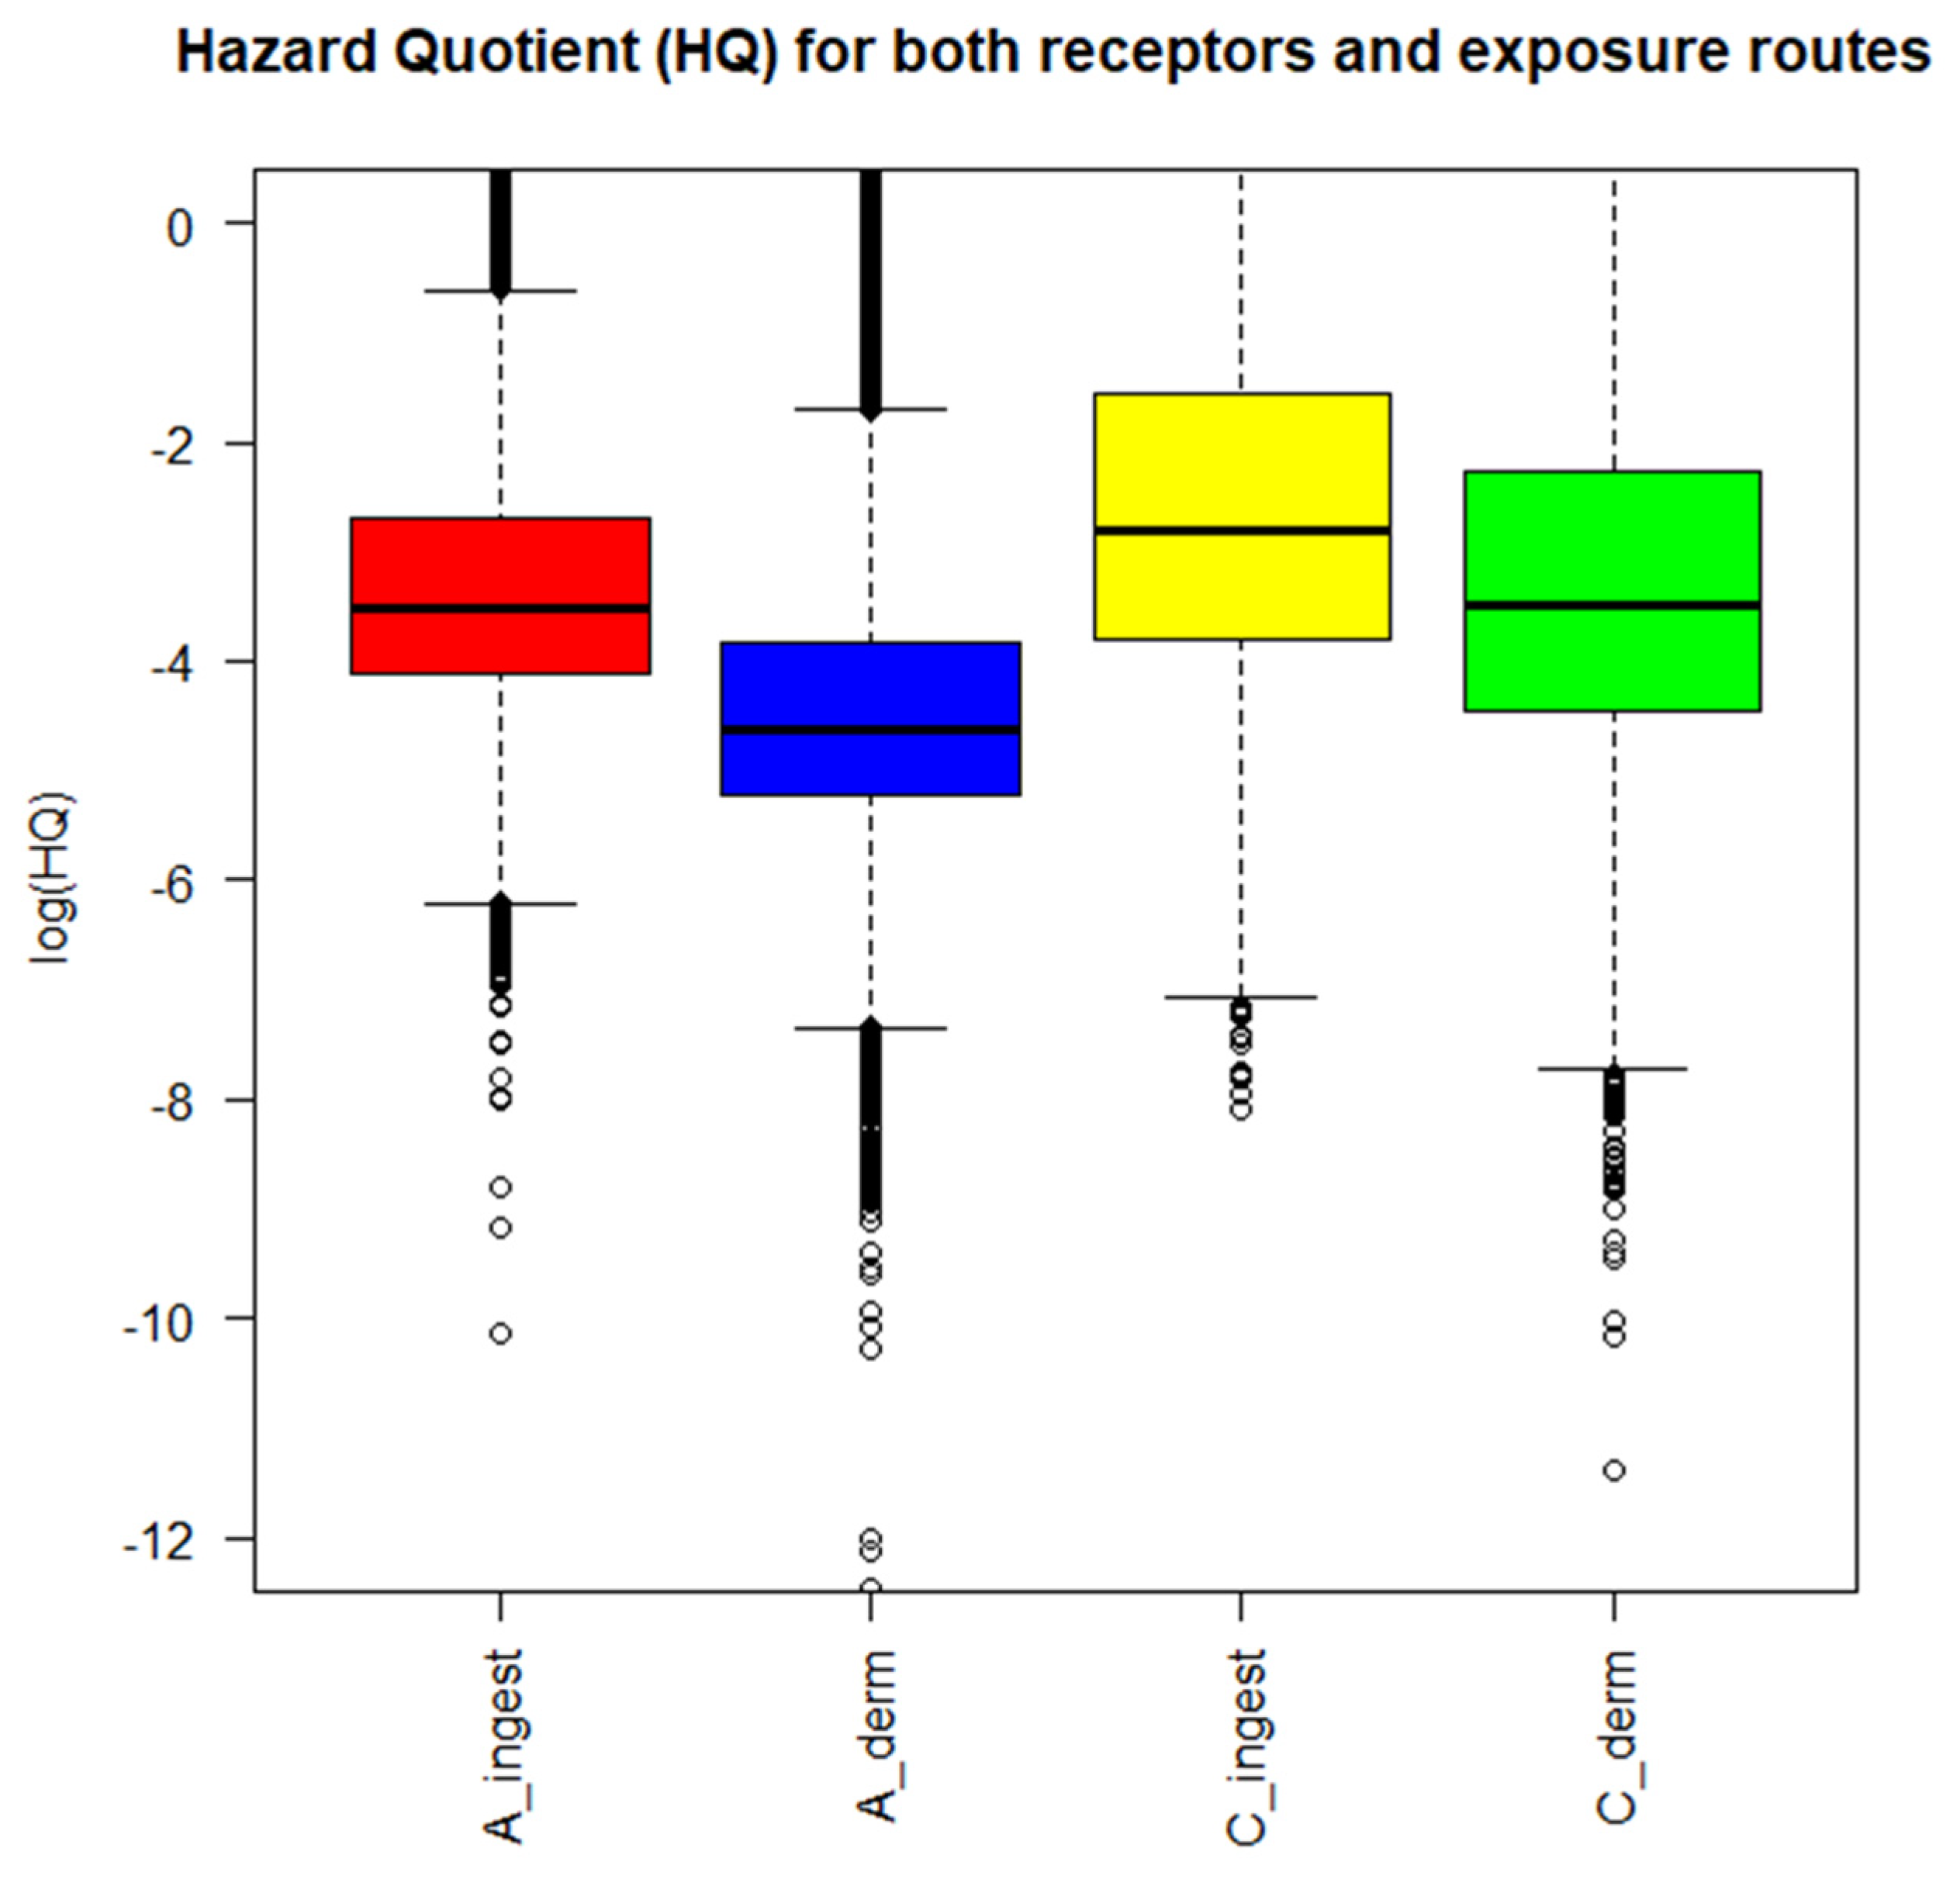
3.2.2. Probabilistic Approach

Risk analysis with a deterministic approach is a point-based analysis. Therefore, the more data are available, the more reliable the results are. However, it is possible to compensate for the lack of a large amount of data by also conducting the risk analysis using a probabilistic approach in order to compare the respective results. To this end, Monte Carlo simulation, a stochastic simulation technique, was applied. Stochastic simulation techniques are based on the principle that, by generating a particularly large number of random determinations, the corresponding frequencies can be assumed to be equivalent to the corresponding probabilities with good approximation. The quality of the results obtainable through the use of this technique increases as the magnitude of synthetic generation increases. Monte Carlo simulation, through the use of stochastic simulation techniques, provides a complete range of possible results [8]. This technique, along with others based on the same principle, has been widely used in human health risk assessment [10].
The risk analysis conducted using the probabilistic approach yielded parameter values below the safe exposure limit for both adult and child receptors. Therefore, the probabilistic analysis suggests that there are no exposure levels of concern. The results are presented in graphical form in Figure 3. The Hazard Quotient (HQ) values for children were in the range of 1.2 × 10⁻² to 8.66 × 10⁻¹ for ingestion and 2.65 × 10⁻⁴ to 2.71 × 10⁻² for skin contact. For adults, the risk was lower, ranging between 5.14 × 10⁻³ and 4.39 × 10⁻¹ for ingestion and between 8.55 × 10⁻⁵ and 7.42 × 10⁻³ for skin contact. From this point of view, the probabilistic analysis confirms an aspect already noted by the deterministic analysis, namely that the child population is more exposed. However, in both cases the safe exposure limit is not exceeded.
The boxplot graph (Figure 6) illustrates the results of the analysis conducted using a probabilistic approach. The graph shows that, according to the probabilistic approach, the highest risk scenario is residential, and the main mode of exposure is ingestion. It agrees with the deterministic approach in quantifying an increased vulnerability of childhood receptors. However, the results of the analysis using a probabilistic approach confirm that contamination does not result in a hazardous condition.
The results of the deterministic analysis differ from those of the probabilistic analysis; according to the probabilistic methodology, the residential scenario does not generate risk for adult and child receptors, whereas, according to the deterministic methodology, there are sites where exposure generates risk for minor receptors. This discrepancy in the results obtained from the two approaches has also been found in other studies, including the study on Hg concentrations in surface waters of the Ecuadorian Coast conducted by Mestanza-Ramón et al. in 2023. The same authors also found comparable results in the Amazon and Andean regions. The same discrepancy is also found in the study carried out by Jiménez-Oyola et al. in 2021, to assess the exposure to toxic elements in polluted rivers in the Ecuadorian Amazon. The discrepancy in the results of deterministic vs. probabilistic analysis reside in the fact that, while the deterministic analysis is a point-type analysis, the probabilistic analysis takes into account the variability of different quantities involved in the contamination phenomenon.
Monte Carlo simulation is a stochastic method; as such, it has the typical advantages of this class of methods: they are very flexible tools that allow realistic simulations to be carried out, provided that the probabilistic distributions to be assigned to the different variables involved in the process under consideration are chosen as truthfully as possible and that adequate computing power is available. However, it is a method that is based on calculating probabilities and not on certain data. The results that can be obtained from the application of this methodology are therefore to be considered an estimate of what may shape up in the future, and do not represent an accurate prediction. Therefore, the results of both analyses should be given due consideration and more context in order to obtain a more complete picture.
Thus, on the basis of a conservative criterion, the use of groundwater for domestic consumption is not recommended, especially in sites located in areas of mining activity that show signs of contamination, as the prolonged exposure of vulnerable populations to Hg could compromise their health. In order to arrive at a more conclusive definition of the actual risk to the population, a more detailed investigation should be carried out, for which a significant amount of in situ data on Hg concentrations in the various environmental matrices is required.

4. Discussion

The outcomes of the study show a concerning situation with regard to Hg concentrations in the coastal region of Ecuador. Since mining activities are not uniform across the territory, the choice of sampling points also followed this distribution, with the result that in the most affected provinces, such as El Oro, Esmeraldas, and Los Rios, the measurement network is denser. It can be concluded that the most affected areas of the region are in the south and north and partly in the center, where the average concentrations determined are still several times lower than the maximum allowed by Ecuadorian legislation for water intended for human consumption. However, the actual risk to the population also depends on other factors, such as the risk to exposed receptors. In fact, the analysis showed that the child population is most at risk.
The potential contamination of groundwater is among the most worrying factors, especially for possible consumption by receptors. According to some studies, the main source of contamination, especially for inorganic Hg, is accidental ingestion of contaminated water [10]. The consequences may vary depending on the duration of exposure and the concentration of mercury [1]; they are generally dangerous but become significantly more so with regard to vulnerable receptors, such as pregnant women, children, and people with previous illnesses. In the literature, some of the main clinical effects of mercury contamination include alterations in neurocognitive functions, blood diseases, and cardiovascular, respiratory, and gastrointestinal tract problems. In addition, several cross-sectional studies have been conducted to analyze the potential link with other negative effects on human health.
A cycle of cross-sectional studies conducted in Korea on children aged 6–11 years found that serum mercury levels had a positive correlation with the risk of atopic dermatitis and a high positive correlation with asthma. The latter result does not coincide with previous studies conducted in Germany and USA, in which no correlation with asthma was found; however, this can be explained by the higher average mercury (Hg) level in Korean children [58]. The average mercury levels in children in the cited study were 0.40 µg/L, higher than those in the US NHANES (2015–2016) (0.25 µg/L for 3–11-year-olds) and Germany GerES V (2014–2017) (0.068 µg/L for 5–9-year-olds) in similar periods and age groups. According to some studies, the higher mercury (Hg) levels in the Korean child population can be attributed partly to dietary habits (consisting of heavy consumption of grains and seafood) and partly to air pollution [58,59]. Regarding potential alterations in cognitive functions, a study based on the systematic review of 1573 articles observed concordant results indicating an association between heavy metal (HM) exposure and decreased neurocognitive function in adults. In particular, specific observations found a reduction in short-term memory capacity with increasing exposure to elemental Hg [60]. A study that analyzed the potential correlation between exposure to five heavy metals (HMs) and the development of hepatitis B virus (HBV), found with specific reference to mercury (Hg) that a high blood concentration (above 30.58 μg/L) is associated with an increased risk in hepatitis B virus (HBV) contraction [61]. Another two-cycle cross-sectional study, conducted in Korea with a total of 14,682 participants, found that the concentration of mercury (Hg) (along with other two metals) is strongly correlated with Alcoholic Liver Disease [62].

5. Conclusions

The present study measured Hg concentrations in groundwater in the coastal region of Ecuador. Although, in some cases, the samples analyzed do not exceed the maximum permissible limits imposed by Ecuadorian legislation, the results of the risk analysis illustrate a situation of serious concern. The risk analysis results obtained from the application of the two approaches used do not coincide with each other, in the sense that the deterministic approach suggests a more severe picture. It can be concluded that an accurate risk analysis is essential to reconstruct a model that takes into account not only the environmental aspect, but also the social and geological aspects. In fact, risk is intrinsically linked to the actual vulnerability of receptors, which depends on multiple factors. Knowledge of the characteristics of the different environmental compartments and the substance under consideration are fundamental requirements for defining the mechanisms of contaminant transport that may take place. On the other hand, knowledge of the uses and habits of the population living in the area makes it possible to trace the transport factors, and the most probable modes of contact. By combining the results of several searches, it is possible to plan more detailed research, monitoring, and risk mitigation activities.

Author Contributions

Conceptualization, I.P., C.M.-R. and S.S.; methodology I.P., C.M.-R. and S.S.; validation, I.P., D.M.-S., C.A.G., T.C.A., R.U.V., L.M.O.P., M.G.T.R., G.A.-C., M.S.-S., S.S. and C.M.-R.; formal analysis, I.P., D.M.-S., C.A.G., T.C.A., R.U.V., L.M.O.P., M.G.T.R., G.A.-C., M.S.-S., S.S. and C.M.-R.; investigation, I.P., D.M.-S., C.A.G., T.C.A., R.U.V., L.M.O.P., M.G.T.R., G.A.-C., M.S.-S., S.S. and C.M.-R.; resources, I.P., D.M.-S., C.A.G., T.C.A., R.U.V., L.M.O.P., M.G.T.R., G.A.-C., M.S.-S., S.S. and C.M.-R.; data curation, I.P., D.M.-S., C.A.G., T.C.A., R.U.V., L.M.O.P., M.G.T.R., G.A.-C., M.S.-S., S.S. and C.M.-R.; writing—original draft preparation, I.P., D.M.-S., C.A.G., T.C.A., R.U.V., L.M.O.P., M.G.T.R., G.A.-C., M.S.-S., S.S. and C.M.-R.; writing—review and editing, I.P., D.M.-S., S.S. and C.M.-R.; visualization, I.P., D.M.-S., C.A.G., T.C.A., R.U.V., L.M.O.P., M.G.T.R., G.A.-C., M.S.-S., S.S. and C.M.-R.; supervision, S.S. and C.M.-R.; project administration, S.S. and C.M.-R.; funding acquisition, S.S. and C.M.-R. All authors have read and agreed to the published version of the manuscript.

Funding

This research received no external funding.

Data Availability Statement

Data are available upon request.

Conflicts of Interest

The authors declare no conflicts of interest.

References

  1. Brown, K.W. A History of Mining in Latin America: From the Colonial Era to the Present; UNM Press: Albuquerque, NM, USA, 2012; ISBN 0826351077. [Google Scholar]
  2. Mestanza-Ramón, C.; Paz-Mena, S.; López-Paredes, C.; Jimenez-Gutierrez, M.; Herrera-Morales, G.; D’Orio, G.; Straface, S. History, Current Situation and Challenges of Gold Mining in Ecuador’s Litoral Region. Land 2021, 10, 1220. [Google Scholar] [CrossRef]
  3. Mestanza-Ramón, C.; Mora-Silva, D.; D’Orio, G.; Tapia-Segarra, E.; Gaibor, I.D.; Esparza Parra, J.F.; Chávez Velásquez, C.R.; Straface, S. Artisanal and Small-Scale Gold Mining (ASGM): Management and Socioenvironmental Impacts in the Northern Amazon of Ecuador. Sustainability 2022, 14, 6854. [Google Scholar] [CrossRef]
  4. Loza del Carpio, A.L.; Ccancapa Salcedo, Y. Mercurio en un arroyo altoandino con alto impacto por minería aurífera artesanal (la rinconada, Puno, Perú). Rev. Int. Contam. Ambient. 2020, 36, 33–44. [Google Scholar] [CrossRef]
  5. Ministerio del Ambiente del Ecuador Línea de Base Nacional. 2020; “Linea de Base Nacional para la Minería Artesanal y en Pequeña Escala de Oro en Ecuador, Conforme la Convención de Minamata sobre Mercurio”; United Nations Industrial Development Organization: UNIDO: Vienna, Austria, 2020; pp. 33–80.
  6. Akabzaa, T. Mining in Ghana: Implications for National Economic Development and Poverty Reduction. In Mining in Africa: Regulation and Development; Pluto Press: London, UK, 2009; pp. 25–65. [Google Scholar]
  7. Rea Toapanta, A.R. Política Minera y Sostenibilidad Ambiental En Ecuador. FIGEMPA Investig. Desarro. 2017, 4, 41–52. [Google Scholar] [CrossRef]
  8. Sánchez-Rodríguez, S.M.; Pascó-Font, A. La Socioeconomía de La Minería Del Oro. In El libro de Minería del Oro en Iberoamérica; CYTED: Madrid, Spain, 2001; pp. 53–81. [Google Scholar]
  9. Minería, M.D. Plan Nacional de Desarrollo Del Sector Minero; ARCOM: Quito, Ecuador, 2016; p. 8. [Google Scholar]
  10. Jiménez-Oyola, S.; Escobar Segovia, K.; García-Martínez, M.-J.J.; Ortega, M.; Bolonio, D.; García-Garizabal, I.; Salgado, B.; Segovia-Escobar, K.; García-Martínez, M.-J.J.; Ortega, M.; et al. Human Health Risk Assessment for Exposure to Potentially Toxic Elements in Polluted Rivers in the Ecuadorian Amazon. Water 2021, 13, 613. [Google Scholar] [CrossRef]
  11. Mestanza-Ramón, C.; Cuenca-Cumbicus, J.; D’Orio, G.; Flores-Toala, J.; Segovia-Cáceres, S.; Bonilla-Bonilla, A.; Straface, S. Gold Mining in the Amazon Region of Ecuador: History and a Review of Its Socio-Environmental Impacts. Land 2022, 11, 221. [Google Scholar] [CrossRef]
  12. Mestanza-Ramón, C.; Jiménez-Oyola, S.; Montoya, A.V.G.; Vizuete, D.D.C.; D’Orio, G.; Cedeño-Laje, J.; Straface, S. Assessment of Hg Pollution in Stream Waters and Human Health Risk in Areas Impacted by Mining Activities in the Ecuadorian Amazon. Environ. Geochem. Health 2023, 45, 7183–7197. [Google Scholar] [CrossRef] [PubMed]
  13. Goix, S.; Maurice, L.; Laffont, L.; Rinaldo, R.; Lagane, C.; Chmeleff, J.; Menges, J.; Heimbürger, L.-E.; Maury-Brachet, R.; Sonke, J.E. Quantifying the Impacts of Artisanal Gold Mining on a Tropical River System Using Mercury Isotopes. Chemosphere 2019, 219, 684–694. [Google Scholar] [CrossRef] [PubMed]
  14. Wongsasuluk, P.; Tun, A.Z.; Chotpantarat, S.; Siriwong, W. Related Health Risk Assessment of Exposure to Arsenic and Some Heavy Metals in Gold Mines in Banmauk Township, Myanmar. Sci. Rep. 2021, 11, 22843. [Google Scholar] [CrossRef]
  15. Smith, N.M. “Our Gold Is Dirty, but We Want to Improve”: Challenges to Addressing Mercury Use in Artisanal and Small-Scale Gold Mining in Peru. J. Clean. Prod. 2019, 222, 646–654. [Google Scholar] [CrossRef]
  16. Ovadje, L.; Calys-Tagoe, B.N.L.; Clarke, E.; Basu, N. Registration Status, Mercury Exposure Biomarkers, and Neuropsychological Assessment of Artisanal and Small-Scale Gold Miners (ASGM) from the Western Region of Ghana. Environ. Res. 2021, 201, 111639. [Google Scholar] [CrossRef] [PubMed]
  17. Oakley, P. Making Mercury’s Histories: Mercury in Gold Mining’s Past and Present. Ambix 2023, 70, 77–98. [Google Scholar] [CrossRef] [PubMed]
  18. Fuentes-Gandara, F.; Herrera-Herrera, C.; Pinedo-Hernández, J.; Marrugo-Negrete, J.; Díez, S. Assessment of human health risk associated with methylmercury in the imported fish marketed in the Carribean. Environ. Res. 2018, 165, 324–329. [Google Scholar] [CrossRef] [PubMed]
  19. Bjørklund, G.; Tinkov, A.A.; Dadar, M.; Rahman, M.M.; Chirumbolo, S.; Skalny, A.V.; Skalnaya, M.G.; Haley, B.E.; Ajsuvakova, O.P.; Aaseth, J. Insights into the Potential Role of Mercury in Alzheimer’s Disease. J. Mol. Neurosci. 2019, 67, 511–533. [Google Scholar] [CrossRef] [PubMed]
  20. Briffa, J.; Sinagra, E.; Blundell, R. Heavy Metal Pollution in the Environment and Their Toxicological Effects on Humans. Heliyon 2020, 6, e04691. [Google Scholar] [CrossRef] [PubMed]
  21. Rivera Grunauer, R.E. Características Físicas, Ubicación Geográfica y Calidad Del Suelo Agrícola de Las Provincias de La Costa Ecuatoriana; Universidad Técnica de Machala: Machala, Ecuador, 2019. [Google Scholar]
  22. Saha, N.; Rahman, M.S.; Ahmed, M.B.; Zhou, J.L.; Ngo, H.H.; Guo, W. Industrial Metal Pollution in Water and Probabilistic Assessment of Human Health Risk. J. Environ. Manag. 2017, 185, 70–78. [Google Scholar] [CrossRef] [PubMed]
  23. Li, Z.; Ma, Z.; van der Kuijp, T.J.; Yuan, Z.; Huang, L. A Review of Soil Heavy Metal Pollution from Mines in China: Pollution and Health Risk Assessment. Sci. Total Environ. 2014, 468, 843–853. [Google Scholar] [CrossRef] [PubMed]
  24. Frækaland Vangsnes, G. The Meanings of Mining: A Perspective on the Regulation of Artisanal and Small-Scale Gold Mining in Southern Ecuador. Extr. Ind. Soc. 2018, 5, 317–326. [Google Scholar] [CrossRef]
  25. Sandoval, F. Small-Scale Mining in Ecuador. Environ. Soc. Found. 2001, 75, 28. [Google Scholar]
  26. Mestanza-Ramón, C.; Ordoñez-Alcivar, R.; Arguello-Guadalupe, C.; Carrera-Silva, K.; D’Orio, G.; Straface, S. History, Socioeconomic Problems and Environmental Impacts of Gold Mining in the Andean Region of Ecuador. Int. J. Environ. Res. Public Health 2022, 19, 1190. [Google Scholar] [CrossRef] [PubMed]
  27. Vásconez Carrasco, M.; Torres León, L. Minería En El Ecuador: Sostenibilidad y Licitud. Rev. Estud. Desarro. Soc. Cuba. Am. Lat. 2018, 6, 83–103. [Google Scholar]
  28. Portilla Plaza, S.C. La Minería Artesanal Como Fuente de Identidad y Práctica Ancestral Cimarronera: Caso Telembí, Esmeraldas. Master’s Thesis, Flacso Ecuador, Quito, Ecuador, 2023. [Google Scholar]
  29. Sarmiento Bravo, D.V.; Carvajal Mediavilla, K.L. Estrategia de Regularización de Actividades Mineras En Los Cantones San Lorenzo y Eloy Alfaro, Como Alternativa a Mejorar Las Condiciones de Vida, Salud y Ambiente de Las Poblaciones de Influencia Directa. Bachelor’s Thesis, Universidad Técnica del Norte, Ibarra, Ecuador, 2018. [Google Scholar]
  30. Abril, P.F.E.F.M.; Octubre, M.J.J.A.S.; Diciembre, N. Características de Población y Vivienda: Censo Nacional de Población y Vivienda; Instituto Nacional de Estadística y Censos: Loja, Ecuador, 2010. [Google Scholar]
  31. Winckell, A. Relieve y Geomorfología Del Ecuador. Cent. Ecuat. Investig. Geogr. Guayaquil 1982, 3–19. [Google Scholar]
  32. Baker, T.; Bickford, D.; Juras, S.; Lewis, P.; Oztas, Y.; Ross, K.; Tukac, A.; Rabayrol, F.; Miskovic, A.; Friedman, R. The Geology of the Kişladağ Porphyry Gold Deposit, Turkey; Society of Economic Geologists: Littleton, CO, USA, 2016. [Google Scholar]
  33. Valente, T.; Grande, J.A.; De la Torre, M.L.; Gomes, P.; Santisteban, M.; Borrego, J.; Braga, M.A.S. Mineralogy and Geochemistry of a Clogged Mining Reservoir Affected by Historical Acid Mine Drainage in an Abandoned Mining Area. J. Geochem. Explor. 2015, 157, 66–76. [Google Scholar] [CrossRef]
  34. Calderón Robles, P.V. Estado Actual de La Minería de Oro En Ecuador: Gran Minería vs Minería Artesanal. Master’s Thesis, Universitat Politècnica de Catalunya, Barcelona, Spain, 2020. [Google Scholar]
  35. Ossai, I.C.; Ahmed, A.; Hassan, A.; Hamid, F.S. Remediation of Soil and Water Contaminated with Petroleum Hydrocarbon: A Review. Environ. Technol. Innov. 2020, 17, 100526. [Google Scholar] [CrossRef]
  36. Franco, G.H.; Quinchuela, T.G.; Macancela, N.A.; Mero, P.C. Participative analysis of socio-ecological dynamics and interactions. A case study of the Manglaralto coastal aquifer, Santa Elena-Ecuador. Malays. J. Sustain. Agric. 2017, 1, 19–22. [Google Scholar] [CrossRef]
  37. Park, S.-C.; Yun, S.-T.; Chae, G.-T.; Yoo, I.-S.; Shin, K.-S.; Heo, C.-H.; Lee, S.-K. Regional hydrochemical study on salinization of coastal aquifers, western coastal area of South Korea. J. Hydrol. 2005, 313, 182–194. [Google Scholar] [CrossRef]
  38. Carrión-Mero, P.; Montalván, F.J.; Morante-Carballo, F.; Heredia, J.; Elorza, F.J.; Solórzano, J.; Aguilera, H. Hydrochemical and Isotopic Characterization of the Waters of the Manglaralto River Basin (Ecuador) to Contribute to the Management of the Coastal Aquifer. Water 2021, 13, 537. [Google Scholar] [CrossRef]
  39. Damanik-Ambarita, M.N.; Boets, P.; Thi, H.T.N.; Forio, M.A.E.; Everaert, G.; Lock, K.; Musonge, P.L.S.; Suhareva, N.; Bennetsen, E.; Gobeyn, S.; et al. Impact assessment of local land use on ecological water quality of the Guayas river basin (Ecuador). Ecol. Inform. 2018, 548, 226–237. [Google Scholar] [CrossRef]
  40. Guzzi, L.; Martinotti, W.; Cardellicchio, N.; CESI; CNR. Il Mercurio in Ecosistemi Acquatici. In La Chimica e L’industria; Società Chimica Italiana: Roma, Italy, 2005. [Google Scholar]
  41. WHO. Evaluations of the Joint FAO/WHO Expert Committee on Food Additives (JECFA). Available online: https://apps.who.int/food-additives-contaminants-jecfa-database/search.aspx (accessed on 23 June 2022).
  42. Pavla, S.; Danka, H.; Premysl, M.; Denisa, M.; Kristyna, M.; Zdenka, S. Do the total mercury concentrations detected in fish from Czech ponds represent a risk for consumers? Nature 2022, 12, 553. [Google Scholar] [CrossRef]
  43. Ilbay-Yupa, M.; Lavado-Casimiro, W.; Rau, P.; Zubieta, R.; Castillón, F. Updating Regionalization of Precipitation in Ecuador. Theor. Appl. Climatol. 2021, 143, 1513–1528. [Google Scholar] [CrossRef]
  44. Mensh, M. Direct Mercury Analysis of Soil, Sediments and Waste Waters Using Method 7473. Soil Sediment Contam. 2004, 13, 150. [Google Scholar]
  45. United States Department of Energy. RAIS: Risk Assessment Information System; United States Department of Energy: Washington, DC, USA, 2018. [Google Scholar]
  46. R Core Team. A Language and Environment for Statistical Computing. R Foundation for Statistical Computing. 2023. Available online: https://www.R-project.org/ (accessed on 16 March 2022).
  47. Spence, L.R.; Walden, T. RISC User’s Manual Version 4. 0 463. 2001. Available online: https://www.researchgate.net/publication/353493146_HEAVY_METALS_IN_RIVERS_AFFECTED_BY_MINING_ACTIVITIES_IN_ECUADOR_POLLUTION_AND_HUMAN_HEALTH_IMPLICATIONS (accessed on 16 March 2022).
  48. USEPA (United States Environmental Protection Agency). Assessment Guidance for Superfund (RAGS) Volume III (Part A). Process for Conducting Probabilistic Risk Assessment; USEPA: Washington, DC, USA, 2011. [Google Scholar]
  49. Israeli, M.; Nelson, C.B. Distribution and Expected Time of Residence for U.S. Households. Risk Anal. 1992, 12, 65–72. [Google Scholar] [CrossRef] [PubMed]
  50. AIHC (American Industrial Health Council). Exposure Factors Sourcebook, Regulatory Toxicology and Pharmacology; AIHC: Orlando, FL, USA, 1994. [Google Scholar]
  51. Anderson, E.; Browne, N.; Duletsky, S.; Raming, J.; Warn, T. Development of Statistical Distribution or Ranges of Standard Factors used in Exposure Assessments; NTIS: Alexandria, VA, USA, 1985. [Google Scholar]
  52. González-Merizalde, M.V.; Menezes-Filho, J.A.; Cruz-Erazo, C.T.; Bermeo-Flores, S.A.; Sánchez-Castillo, M.O.; Hernández-Bonilla, D.; Mora, A. Manganese and Mercury Levels in Water, Sediments, and Children Living near Gold-Mining Areas of the Nangaritza River Basin, Ecuadorian Amazon. Arch. Environ. Contam. Toxicol. 2016, 71, 171–182. [Google Scholar] [CrossRef] [PubMed]
  53. Webb, J.; Coomes, O.T.; Mainville, N.; Mergler, D. Mercury Contamination in an Indicator Fish Species from Andean Amazonian Rivers Affected by Petroleum Extraction. Bull. Environ. Contam. Toxicol. 2015, 95, 279–285. [Google Scholar] [CrossRef] [PubMed]
  54. Dorleku, M.K.; Nukpezah, D.; Carboo, D. Efects of small-scale gold mining on heavy metal levels in groundwater in the Lower Pra Basin of Ghana. Appl. Water Sci. 2018, 8, 126. [Google Scholar] [CrossRef]
  55. Al-Hobaib, A.S.; Al-Jaseem, Q.K.; Baioumy, H.M.; Ahmed, A.H. Heavy metals concentrations and usability of groundwater at Mahd Adh Dhahab gold mine, Saudi Arabia. Saudi Arabia. Arab. J. Geosci. 2013, 6, 259–270. [Google Scholar] [CrossRef]
  56. Taiwo, A.M.; Awomeso, J.A. Assessment of trace metal concentration and health risk of artisanal gold mining activities in Ijeshaland, Osun State Nigeria. J. Geochem. Explor. 2017, 177, 1–10. [Google Scholar] [CrossRef]
  57. Teixeira, R.A.; da Silveira Pereira, W.V.; de Souza, E.S.; Ramos, S.J.; Dias, Y.N.; de Lima, M.W.; de Souza Neto, H.F.; de Oliveira, E.S.; Fernandes, A.R. Artisanal gold mining in the eastern Amazon: Environmental and human health risks of mercury from different mining methods. Chemosphere 2021, 284, 131220. [Google Scholar] [CrossRef] [PubMed]
  58. Lee, J.; Choi, Y.-H.; Choi, H.; Moon, K.W. Association between Environmental Mercury Exposure and Allergic Disorders in Korean Children: Korean National Environmental Health Survey (KoNEHS) Cycles 3–4 (2015–2020). Sci. Rep. 2024, 14, 1472. [Google Scholar] [CrossRef]
  59. Shin, Y.-Y.; Ryu, I.-K.; Park, M.-J.; Kim, S.-H. The Association of Total Blood Mercury Levels and Overweight among Korean Adolescents: Analysis of the Korean National Health and Nutrition Examination Survey (KNHANES) 2010–2013. Korean J. Pediatr. 2018, 61, 121. [Google Scholar] [CrossRef]
  60. Althomali, R.H.; Abbood, M.A.; Saleh, E.A.M.; Djuraeva, L.; Abdullaeva, B.S.; Habash, R.T.; Alhassan, M.S.; Alawady, A.H.R.; Alsaalamy, A.H.; Najafi, M.L. Exposure to Heavy Metals and Neurocognitive Function in Adults: A Systematic Review. Environ. Sci. Eur. 2024, 36, 18. [Google Scholar] [CrossRef]
  61. Li, X.; Bi, L.; Han, L. Associations of Five Blood Heavy Metals with Hepatitis B Virus Infection and Immunity in Adults: A Cross-Sectional Study. BMC Public Health 2024, 24, 266. [Google Scholar] [CrossRef] [PubMed]
  62. Kim, J.H.; Na, J.E.; Lee, J.; Park, Y.E.; Lee, J.; Choi, J.H.; Heo, N.Y.; Park, J.; Kim, T.O.; Jang, H.J. Blood Concentrations of Lead, Cadmium, and Mercury Are Associated With Alcohol-Related Liver Disease. J. Korean Med. Sci. 2023, 38, e412. [Google Scholar] [CrossRef] [PubMed]
Figure 1. Study area and location of the sampling points.
Resources 13 00053 g001
Figure 2. Point risk map of Hazard Index (HI) for adults in residential scenario.
Resources 13 00053 g002
Figure 3. Point risk map of Hazard Index (HI) for children in residential scenario.
Resources 13 00053 g003
Figure 4. Point risk map of Hazard Index (HI) for adults in recreational scenario.
Resources 13 00053 g004
Figure 5. Point risk map of Hazard Index (HI) for children in recreational scenario.
Resources 13 00053 g005
Figure 6. Figure shows four boxplots, one for each exposure mode and receptor type. In particular: red: ingestion, adults; blue: dermal contact, adults; yellow: ingestion, children; green: dermal contact, children. Each boxplot shows the distribution of HQ for the exposure mode and receptor considered. The bottom and top of the ‘box’ represent the 25th and 75th percentile respectively. The ‘whiskers’ extending from the box show the variation in the expected data. The circles that fall outside the whiskers represent the outliers.
Resources 13 00053 g006
Table 1. Parameters used in the risk assessment.
ParameterPoint Value
EFresidential (day/year) a350
EFrecreational (day/year) a120
ETredisential (h/event) b0.22
ETrecreational (h/event) a2.6
IRresidential (L/day) aA = 2.04; C = 1.28
IRrecreational (L/day) aA = 0.053; C = 0.090
ED (year) c,dA = 30; C = 6
SA (cm2) c,e,fA = 23,000; C = 7280
Bw (kg) e,fA = 72; C = 15.6
A = adults; C = children; a [10]; b [47]; c [48]; d [49]; e [50]; f [51].
Table 2. Hg concentration (µg/L) in groundwater samples.
ProvincenMin–Maxp50S.D.
Esmeraldas120.25–2.10.90.64
Santo Domingo4***
Los Rios90.25–1.10.250.329
Guayas4***
El Oro380.25–9.92.12.847
* Values below the detection limit of the measuring equipment (LoD = 0.5 µg (L); 1 µg/L = Hg limit for the protection of human health in drinking water (INEN 1108).
Table 3. Deterministic HI (p95) from exposure to Hg in groundwaters for both receptors.
ProvinceParameterResidential ScenarioRecreational Scenario
AdultsChildrenAdults Children
EsmeraldasHQingestion4.53 × 10−21.31 × 10⁻¹ 7.61 × 10−33.16 × 10−3
HQdermal contact1.60 × 1002.34 × 1006.50 × 1009.50 × 100
HI 1.65 × 1002.48 × 1006.51 × 1009.50 × 100
Santo Domingo de los TsáchilasHQingestion4.53 × 10−2 1.31 × 10⁻¹ 7.61 × 10−33.16 × 10−3
HQdermal contact1.60 × 1002.34 × 1006.50 × 1009.50 × 100
HI 1.65 × 1002.48 × 1006.51 × 1009.50 × 100
Los RiosHQingestion4.53 × 10−2 1.31 × 10⁻¹ 7.61 × 10−33.16 × 10−3
HQdermal contact1.60 × 1002.34 × 1006.50 × 1009.50 × 100
HI 1.65 × 1002.48 × 1006.51 × 1009.50 × 100
GuayasHQingestion4.53 × 10−2 1.31 × 10⁻¹ 7.61 × 10−33.16 × 10−3
HQdermal contact1.60 × 1002.34 × 1006.50 × 1009.50 × 100
HI 1.65 × 1002.48 × 1006.51 × 1009.50 × 100
El OroHQingestion1.72 × 10−1 4.98 × 10⁻¹ 2.89 × 10⁻² 1.20 × 10⁻²
HQdermal contact6.10 × 1008.91 × 1002.47 × 1013.61 × 101
HI 6.27 × 1009.41 × 1002.47 × 1013.61 × 101
Disclaimer/Publisher’s Note: The statements, opinions and data contained in all publications are solely those of the individual author(s) and contributor(s) and not of MDPI and/or the editor(s). MDPI and/or the editor(s) disclaim responsibility for any injury to people or property resulting from any ideas, methods, instructions or products referred to in the content.

