
The Circularity of Materials from the Perspective of the Product Life Cycle: A Case Study of Secondary Fence Board, Part 2 (Scenario Analysis)

 , and
, and
Abstract
:1. Introduction
- Closed-loop recycling, which occurs when a material from a product system is recycled and used in the same product system [5]. In this case, the material is recycled without changes to its inherent properties and is used for its original purposes, e.g., a used aluminium can is recycled into an identical aluminium can.
- Open-loop recycling, which occurs when a material from one product system is recycled into a different product system [5] and may be used for purposes other than the original purposes. Open-loop recycling can be undertaken in two ways:
- ➢
- Without changes to the material’s inherent properties: this happens when recycling in a product system involves contributing to product-independent material pools for recycled glass, steel, aluminium [5], and plastics, e.g., a used post-consumer aluminium can is reused to manufacture another food’s packaging.
- ➢
- With changes to the material’s inherent properties: this occurs when the recycled material, compared with the primary material, has a different structure (e.g., the length of fibres in recycled paper), a higher concentration of impurities, or a different chemical composition [6], e.g., a waste newspaper is reprocessed into toilet paper.
- (i)
- Is the choice of virgin production a key driver of the environmental impact in the life cycle of secondary fence board?
- (ii)
- Is the durability of the substituted products an influential quality indicator in the life cycle of the secondary fence board?
2. Materials and Methods
The Circular Footprint Formula
3. Life Cycle Assessment
3.1. Goal and Scope Definition
3.2. Allocation Scenarios
- Option 2: Recycling process I is debited with primary production of 14 kg of plastic and composite panels made of polyvinyl chloride (PVC). The secondary board and the market plastic board have the same durability of 15 years;
- Option 3: Recycling process I is debited with primary production of market fencing materials. The 10-year average market shares for fencing (by materials) have been used as follows: metal fencing 53%, wooden fencing 27%, plastic and composite fencing 15%, and concrete fencing 7% [39]. The secondary board analysed and all the market fence boards have the same durability of 15 years. In option 3, Recycling process I is debited with 46.39 kg of primary production per FU (1 m2);
- Option 4: Recycling process I is debited with a primary production of market fencing materials. The same market shares for fencing (by materials) have been used as presented for option 3. The secondary board analysed and all the market fence boards have different durabilities (steel fencing 40 years, wooden fencing 20 years, plastic and composite fencing 15 years, concrete fencing 40 years). In option 4, Recycling process I is debited with 8.04 kg of primary production, per FU (1 m2 of fencing).
- Option B: Recycling process II is credited with a primary production of 2.43 kg of plastic plant pots made of polyethylene (HDPE) with an assumed durability of 5 years;
- Option C: Recycling process II is credited with a primary production of market plant pot materials. The 10-year average market shares for plant pots (by materials) have been used as follows: pots made of refractory materials 47%, polymer pots 31%, metal pots 13%, and wooden pots 9% [40]. The pots have the same durability of 5 years. In option C, Recycling process II is credited with −5.84 kg of primary pot production per FU (1 m2 of fencing);
- Option D: Recycling process II is credited with a primary production of market plant pot materials. The same market shares for pots (by materials) have been used as presented for option C. The market pots have different durabilities (refractory pots 10 years, polymer pots 5 years, metal pots 10 years, wooden pots 8 years). In option D, Recycling process II is credited with −3.31 kg of primary pot production per FU (1 m2 of fencing).
3.3. Life Cycle Inventory
4. Results: Life Cycle Impact Assessment (LCIA)
5. Discussion
6. Conclusions
Supplementary Materials
Author Contributions
Funding
Data Availability Statement
Acknowledgments
Conflicts of Interest
References
- COM(2020) 98 Final Communication from the Commission to the European Parliament, the Council, the European Economic and Social Committee and the Committee of the Regions. A New Circular Economy Action Plan for a Cleaner and More Competitive Europe. Brussels, Belgium. Available online: https://eur-lex.europa.eu/resource.html?uri=cellar:9903b325-6388-11ea-b735-01aa75ed71a1.0017.02/DOC_1&format=PDF (accessed on 5 December 2023).
- Pouikli, K. Concretising the role of extended producer responsibility in European Union waste law and policy through the lens of the circular economy. ERA Forum. 2020, 20, 491–508. [Google Scholar] [CrossRef]
- Directive 2008/98/EC of the European Parliament and of the Council of 19 November 2008 on Waste and Repealing Certain Directives. Available online: https://eur-lex.europa.eu/legal-content/EN/TXT/PDF/?uri=CELEX:02008L0098-20180705 (accessed on 8 December 2023).
- Dostatni, E. Recycling-Oriented Eco-Design Methodology Based on Decentralised Artificial Intelligence. Manag. Prod. Eng. Rev. 2018, 9, 79–89. [Google Scholar] [CrossRef]
- ISO/TR 14049; Environmental Management—Life Cycle Assessment—Illustrative Examples on How to Apply ISO 14044 to Goal and Scope Definition and Inventory Analysis. The International Organisation for Standardization: Brussels, Belgium, 2012.
- ISO 14067; Greenhouse Gases—Carbon Footprint of Products—Requirements and Guidelines for Quantification. The International Organisation for Standardization: Brussels, Belgium, 2018.
- Ha, K.H. Open-loop recycling to apply refrigerator plastics from post-consumer waste polypropylene. Mater. Des. 2012, 35, 310–317. [Google Scholar] [CrossRef]
- Uekert, T.; Singh, A.; DesVeaux, J.S.; Ghosh, T.; Bhatt, A.; Yadav, G.; Afzal, S.; Walzberg, J.; Knauer, K.M.; Nicholson, S.; et al. Technical, Economic, and Environmental Comparison of Closed-Loop Recycling Technologies for Common Plastic. ACS Sustain. Chem. Eng. 2023, 11, 965–978. [Google Scholar] [CrossRef]
- Myrin, E.S.; Börjesson, P.; Ericsson, K. A case study on closed-loop recycling of co-polyester plates—Assessment of material quality and life-cycle energy and greenhouse gas performance. Clean. Environ. Syst. 2022, 6, 100091. [Google Scholar] [CrossRef]
- Panda, R.; Mishra, S.; Pant, K.K.; Bhaskar, T.; Naik, S.N. A closed loop recycling strategy for sustainable recovery of group 11 metals (Cu, Au, and Ag) from waste PCBs: An amalgamation of low-temperature NH4Cl roasting, HCl leaching and cementation. Sustain. Mater. Techno. 2023, 37, e00652. [Google Scholar] [CrossRef]
- Ha, K.H.; Kim, M.S. Application to refrigerator plastics by mechanical recycling from polypropylene in waste-appliances. Mater. Des. 2012, 34, 252–257. [Google Scholar] [CrossRef]
- Kasmi, N.; Backström, E.; Hakkarainen, M. Open-loop recycling of post-consumer PET to closed-loop chemically recyclable high-performance polyimines. Resour. Conserv. Recycl. 2023, 193, 106974. [Google Scholar] [CrossRef]
- Khoshnevisan, B.; Rafiee, S.; Tabatabaei, M. Waste Management Strategies: Life Cycle Assessment (LCA) Approach. In Biogas Fundamentals, Process, and Operation, 1st ed.; Tabatabaei, M., Ghanavati, H., Eds.; Springer International Publishing AG: Cham, Switzerland, 2018; pp. 305–332. [Google Scholar]
- Koci, V.; Trecakova, T. Mixed municipal waste management in the Czech Republic from the point of view of the LCA method. Int. J. Life Cycle Assess 2011, 16, 113–124. [Google Scholar] [CrossRef]
- den Boer, J.; Obersteiner, G.; Gollnow, S.; den Boer, E.; Bodnárné Sándor, R. Enhancement of Food Waste Management and Its Environmental Consequences. Energies 2021, 14, 1790. [Google Scholar] [CrossRef]
- Manfredi, S.; Pant, R. Improving the environmental performance of bio-waste management with life cycle thinking (LCT) and life cycle assessment (LCA). Int. J. Life Cycle Assess 2013, 18, 285–291. [Google Scholar] [CrossRef]
- Ekvall, T.; Björklund, A.; Sandin, G.; Jelse, K. Modeling Recycling in Life Cycle Assessment; Report Number: 2020:05; Swedish Life Cycle Centre: 2020, p. 138. Available online: https://www.lifecyclecenter.se/wp-content/uploads/2020_05_Modeling-recyling-in-life-cycle-assessment-1.pdf (accessed on 6 December 2023).
- The Guide to PAS 2050:2011 How to Carbon Footprint Your Products, Identify Hotspots and Reduce Emissions in Your Supply Chain; British Standards Institution: London, UK, 2011; p. 79. Available online: https://www.wkcgroup.com/wp-content/uploads/2023/02/PAS-2050-Assessment-of-the-life-cycle-greenhouse-gas-emissions-of-goods-and-services.pdf (accessed on 12 February 2024).
- Greenhouse Gas Protocol Technical Guidance for Calculating Scope 3 Emissions Supplement to the Corporate Value Chain (Scope 3) Accounting & Reporting Standard. World Resources Institute & World Business Council for Sustainable Development: Geneva, Switzerland, 2013; p. 182. Available online: https://ghgprotocol.org/sites/default/files/2023-03/Scope3_Calculation_Guidance_0%5B1%5D.pdf (accessed on 12 February 2024).
- Zampori, L.; Pant, R. Suggestions for Updating the Product Environmental Footprint (PEF) Method; Publications Office of the European Union: Luxemburg, 2019; p. 248. Available online: https://eplca.jrc.ec.europa.eu/permalink/PEF_method.pdf (accessed on 12 February 2024).
- Recommendation 2021/2279/EU Commission Recommendation (EU) of 15 December 2021 on the Use of the Environmental Footprint Methods to Measure and Communicate the Life Cycle Environmental Performance of Products and Organisations. Available online: https://eur-lex.europa.eu/legal-content/EN/TXT/PDF/?uri=CELEX:32021H2279 (accessed on 5 December 2023).
- Tinz, J.; de Ancos, T.; Volker, F.; Rohn, H. Application of allocation methods in open-loop recycling systems: The carbon footprint of injection molded products based on ABS, PA66GF30, PC and POM. Resour. Conserv. Recycl. 2023, 19, 200176. [Google Scholar] [CrossRef]
- Klöpffer, W.; Grahl, B. Life Cycle Assessment (LCA): A Guide to Best Practice, 1st ed.; Wiley-VCH: Weinheim, Germany, 2000; pp. 1–440. [Google Scholar]
- Guinée, J.B.; Gorrée, M.; Heijungs, R.; Huppes, G.; Kleijn, R.; Koning, A.; de Oers, L.; van Wegener Sleeswijk, A.; Suh, S.; Udo de Haes, H.A.; et al. Handbook on Life Cycle Assessment. Operational Guide to the ISO Standards. III: Scientific Background, 1st ed.; Kluwer Academic Publishers: Dordrech, The Netherlands, 2002; pp. 1–314. [Google Scholar]
- European Commission; Joint Research Centre; Institute for Environment and Sustainability. ILCD International Reference Life Cycle Data System (ILCD) Handbook—General guide for Life Cycle Assessment—Detailed Guidance, 1st ed.; Office of the European Union: Luxembourg, 2010; pp. 1–417. Available online: https://eplca.jrc.ec.europa.eu/uploads/ILCD-Handbook-General-guide-for-LCA-DETAILED-GUIDANCE-12March2010-ISBN-fin-v1.0-EN.pdf (accessed on 5 December 2023).
- ISO 14040; Environmental Management—Life Cycle Assessment—Principles and Framework. The International Organisation for Standardization: Brussels, Belgium, 2006.
- ILCD Handbook: Recommendations for Life Cycle Impact Assessment in the European Context; Publication office of the European Commission: Luxemburg. 2011, p. 230. Available online: https://eplca.jrc.ec.europa.eu/uploads/ILCD-Handbook-Recommendations-for-Life-Cycle-Impact-Assessment-in-the-European-context.pdf (accessed on 12 February 2024).
- SimaPro Database Manual. Methods Library. Available online: https://simapro.com/wp-content/uploads/2022/07/DatabaseManualMethods.pdf (accessed on 8 December 2023).
- Sala, S.; Cerutti, A.K.; Pant, R. Development of a Weighting Approach for the Environmental Footprint; JRC Technical Report; Publication office of the European Commission: Luxemburg, 2018; p. 146. Available online: https://op.europa.eu/en/publication-detail/-/publication/6c24e876-4833-11e8-be1d-01aa75ed71a1/language-en (accessed on 12 February 2024).
- Allacker, K.; Mathieux, F.; Pennington, D.; Pant, R. The search for an appropriate end-of-life formula for the purpose of the European Commission Environmental Footprint initiative. Int. J. Life Cycle Assess 2017, 22, 1441–1458. [Google Scholar] [CrossRef]
- PAS 2050—Specification for the Assessment of the Life Cycle Greenhouse Gas Emissions of Goods and Services; The British Standards Institution: London, UK, 2008; pp. 1–43. Available online: http://www.carbonconstruct.com/pdf/pas_2050.pdf (accessed on 5 December 2023).
- Product Life Cycle Accounting and Reporting Standard; World Resources Institute and World Business Council for Sustainable Development: Washington, DC, USA, 2011; p. 148. Available online: https://ghgprotocol.org/sites/default/files/standards/Product-Life-Cycle-Accounting-Reporting-Standard_041613.pdf (accessed on 12 February 2024).
- Lindfors, L.G.; Christiansen, K.; Hoffman, L.; Virtanen, Y.; Juntilla, V.; Hanssen, O.J.; Rønning, A.; Ekvall, T.; Finnveden, G. Nordic Guidelines on Life-Cycle Assessment; Nord 1995:20; Nordic Council of Ministers: Copenhagen, Denmark, 1995; p. 226. ISBN 92 9120 692 X. [Google Scholar]
- Ekvall, T. A market-based approach to allocation at open-loop recycling. Resour. Conserv. Recycl. 2000, 29, 91–109. [Google Scholar] [CrossRef]
- Schrijvers, D.L.; Loubet, F.; Weidema, B.P. To what extent is the Circular Footprint Formula of the Product Environmental Footprint Guide consequential? J. Clean Prod. 2021, 320, 128800. [Google Scholar] [CrossRef]
- Mengarelli, M.; Neugebauer, S.; Finkbeiner, M.; Germani, M.; Buttol, P.; Reale, F. End-of-life modelling in life cycle assessment—Material or product-centred perspective? Int. J. Life Cycle Assess 2017, 22, 1288–1301. [Google Scholar] [CrossRef]
- COM(2007) 59 final Communication from the Commission to the Council and the European Parliament on the Interpretative Communication on Waste and By-Products. Available online: https://eur-lex.europa.eu/LexUriServ/LexUriServ.do?uri=COM:2007:0059:FIN:EN:PDF (accessed on 12 February 2024).
- Environmental Footprint Reference Packages. Annex C Transition Phase. Available online: https://view.officeapps.live.com/op/view.aspx?src=https%3A%2F%2Feplca.jrc.ec.europa.eu%2Fpermalink%2FAnnex_C_V2.1_May2020.xlsx&wdOrigin=BROWSELINK (accessed on 12 February 2024).
- Grandviewresearch Fencing Market Size, Share & Trends Analysis Report By Material, Grandviewresearch Report ID: 978-1-68038-526-7. Available online: https://www.grandviewresearch.com/industry-analysis/fencing-market (accessed on 19 November 2020).
- Grandviewresearch Gardening Pots Market Size, Share & Trends Analysis Report By Product (Refractory Material, Polymer), Grandviewresearch Report ID: GVR-3-68038-552-6. Available online: https://www.grandviewresearch.com/industry-analysis/gardening-pots-market (accessed on 19 November 2020).
- Civancik-Uslu, D.; Puig, R.; Ferrer, L.; Fullana-i-Palmer, P. Influence of end-of-life allocation, credits and other methodological issues in LCA of compounds: An in-company circular economy case study on packaging. J. Clean Prod. 2019, 212, 925–940. [Google Scholar] [CrossRef]


| Life Cycle Stage | Description | |
|---|---|---|
| Production | Auxiliary inputs and outputs needed to manufacture 1 m2 of secondary fence board with Recycling process I. |
| Materials | Materials constituting the final fence board. Modelled differently, depending on the option. | |
| Materials needed for installation. Steel (screws and bolts), softwood (wooden posts), and wood preservative. | |
| Load: 25 kg fence board + 4 kg auxiliary materials. Distance: 100 km. Means of transport: freight, lorry 3.5–7.5 metric tons, euro6. | |
| Electricity for drilling and screwdriving (modelled with a low-voltage electricity mix appropriate for Poland). Tap water for cleaning the fence board (one cleaning per lifetime). Wood preservative for the preservation of the wooden posts (3 times per lifetime). | |
| Transport of waste fence board (distance 100 km, freight, lorry 7.5–16 metric ton, euro6), landfilling, incineration, and—in alternative scenarios—recycling with Recycling process II. | |
| Transport of waste auxiliary materials (distance 100 km, freight, lorry 7.5–16 metric ton, euro6), landfilling, incineration, and recycling. | |
| Life cycle stages included in the system boundary | Full life cycle (6 stages of the life cycle) |
| Life cycle stages/processes under allocation | Recycling at the cradle stage (Recycling process I) Recycling at the end of life stage (Recycling process II) |
| Type of recycling | Open-loop |
| Processes under substitution | Virgin production increased through recycling at the cradle (debit) Virgin production decreased (avoided) through recycling at the end of life (credit) |
| Quality indicator | Durability of products (reflected by functional unit and reference flows) |
| Considering recyclable material | As a waste |
| The allocation approach | The circular footprint formula |
| Scenario | Life Cycle Stage: Modelling Options | |
|---|---|---|
| Materials and production: secondary fence board (after allocation made with the CFF formula) | End of life: secondary fence board (after allocation made with the CFF formula) | |
| Scenario 1A (baseline) | Option 1 Recycling process I: recycling of 11.75 kg of packaging waste allocated to secondary board. Recycling at the cradle is debited with 10.625 kg of primary production of packaging materials. | Option A No recycling; 24.75 kg of waste board for landfill; 0.245 kg of waste board for incineration. |
| Scenario 2A | Option 2 Recycling process I: recycling of 12.5 kg of packaging waste allocated to secondary board. Recycling at the cradle is debited with 14 kg of primary production of plastic fencing materials made of PVC. They have the same durability. | |
| Scenario 3A | Option 3 Recycling process I: recycling of 12.5 kg of packaging waste allocated to secondary board. Recycling at the cradle is debited with 46.39 kg of primary production of market fencing panels (mix). They have the same durability. | |
| Scenario 4A | Option 4 Recycling process I: recycling of 12.5 kg of packaging waste allocated to secondary board. Recycling at the cradle is debited with 8.04 kg of primary production of market fencing panels (mix). Different durabilities. | |
| Scenario 1B | Option 1 Recycling process I: recycling of 11.75 kg of packaging waste allocated to secondary board. Recycling at the cradle is debited with 10.625 kg of primary production of packaging materials. | Option B Recycling process II (recycling of 12.48 kg of waste secondary fence board allocated to the secondary board. The secondary fencing is credited at EoL with −2.43 kg of primary HDPE pot production); 12.375 kg of waste board for landfill; 0.125 kg of waste board for incineration. |
| Scenario 2B | Option 2 Recycling process I: recycling of 12.5 kg of packaging waste allocated to secondary board. Recycling at the cradle is debited with 14 kg of primary production of plastic fencing panels made of PVC. They have the same durability. | |
| Scenario 3B | Option 3 Recycling process I: recycling of 12.5 kg of packaging waste allocated to the secondary board. The recycling at the cradle is debited with 46.39 kg of primary production of market fencing panels (mix). They have the same durability. | |
| Scenario 4B | Option 4 Recycling process I: recycling of 12.5 kg of packaging waste allocated to the secondary board. Recycling at the cradle is debited with 8.04 kg of primary production of market fencing panels (mix). They have different durabilities. | |
| Scenario 1C | Option 1 Recycling process I: recycling of 11.75 kg of packaging waste allocated to secondary board. Recycling at the cradle is debited with 10.625 kg of primary production of packaging materials. | Option C Recycling process II (recycling of 12.48 kg of waste secondary fence board allocated to secondary board. |
| Scenario 2C | Option 2 Recycling process I: recycling of 12.5 kg of packaging waste allocated to secondary board. Recycling at the cradle is debited with 14 kg of primary production of plastic fencing panels made of PVC. They have the same durability. | |
| Scenario 3C | Option 3 Recycling process I: recycling of 12.5 kg of packaging waste allocated to secondary board. Recycling at the cradle is debited with 46.39 kg of primary production of market fencing panels (mix). They have the same durability. | |
| Scenario 4C | Option 4 Recycling process I: recycling of 12.5 kg of packaging waste allocated to secondary board. Recycling at the cradle is debited with 8.04 kg of primary production of market fencing panels (mix). They have different durabilities. | |
| Scenario 1D | Option 1 Recycling process I: recycling of 11.75 kg of packaging waste allocated to secondary board. Recycling at the cradle is debited with 10.625 kg of primary production of packaging materials. | Option D Recycling process II (recycling of 12.48 kg of waste secondary fence board allocated to secondary board). The secondary fencing is credited at EoL with −3.31 kg of primary market pot (mix) production. They have different durabilities; 12.375 kg of waste board for landfill; 0.125 kg of waste board for incineration; The secondary fencing is credited at EoL with −5.84 kg of primary market pot (mix) production. They have the same durability; 12.375 kg of waste board for landfill; 0.125 kg of waste board for incineration. |
| Scenario 2D | Option 2 Recycling process I: recycling of 12.5 kg of packaging waste allocated to secondary board. The recycling at the cradle is debited with 14 kg of primary production of plastic fencing panels made of PVC. They have the same durability. | |
| Scenario 3D | Option 3 Recycling process I: recycling of 12.5 kg of packaging waste allocated to secondary board. Recycling at the cradle is debited with 46.39 kg of primary production of market fencing panels (mix). They have the same durability. | |
| Scenario 4D | Option 4 Recycling process I: recycling of 12.5 kg of packaging waste allocated to secondary board. Recycling at the cradle is debited with 8.04 kg of primary production of market fencing panels (mix). They have different durabilities. | |
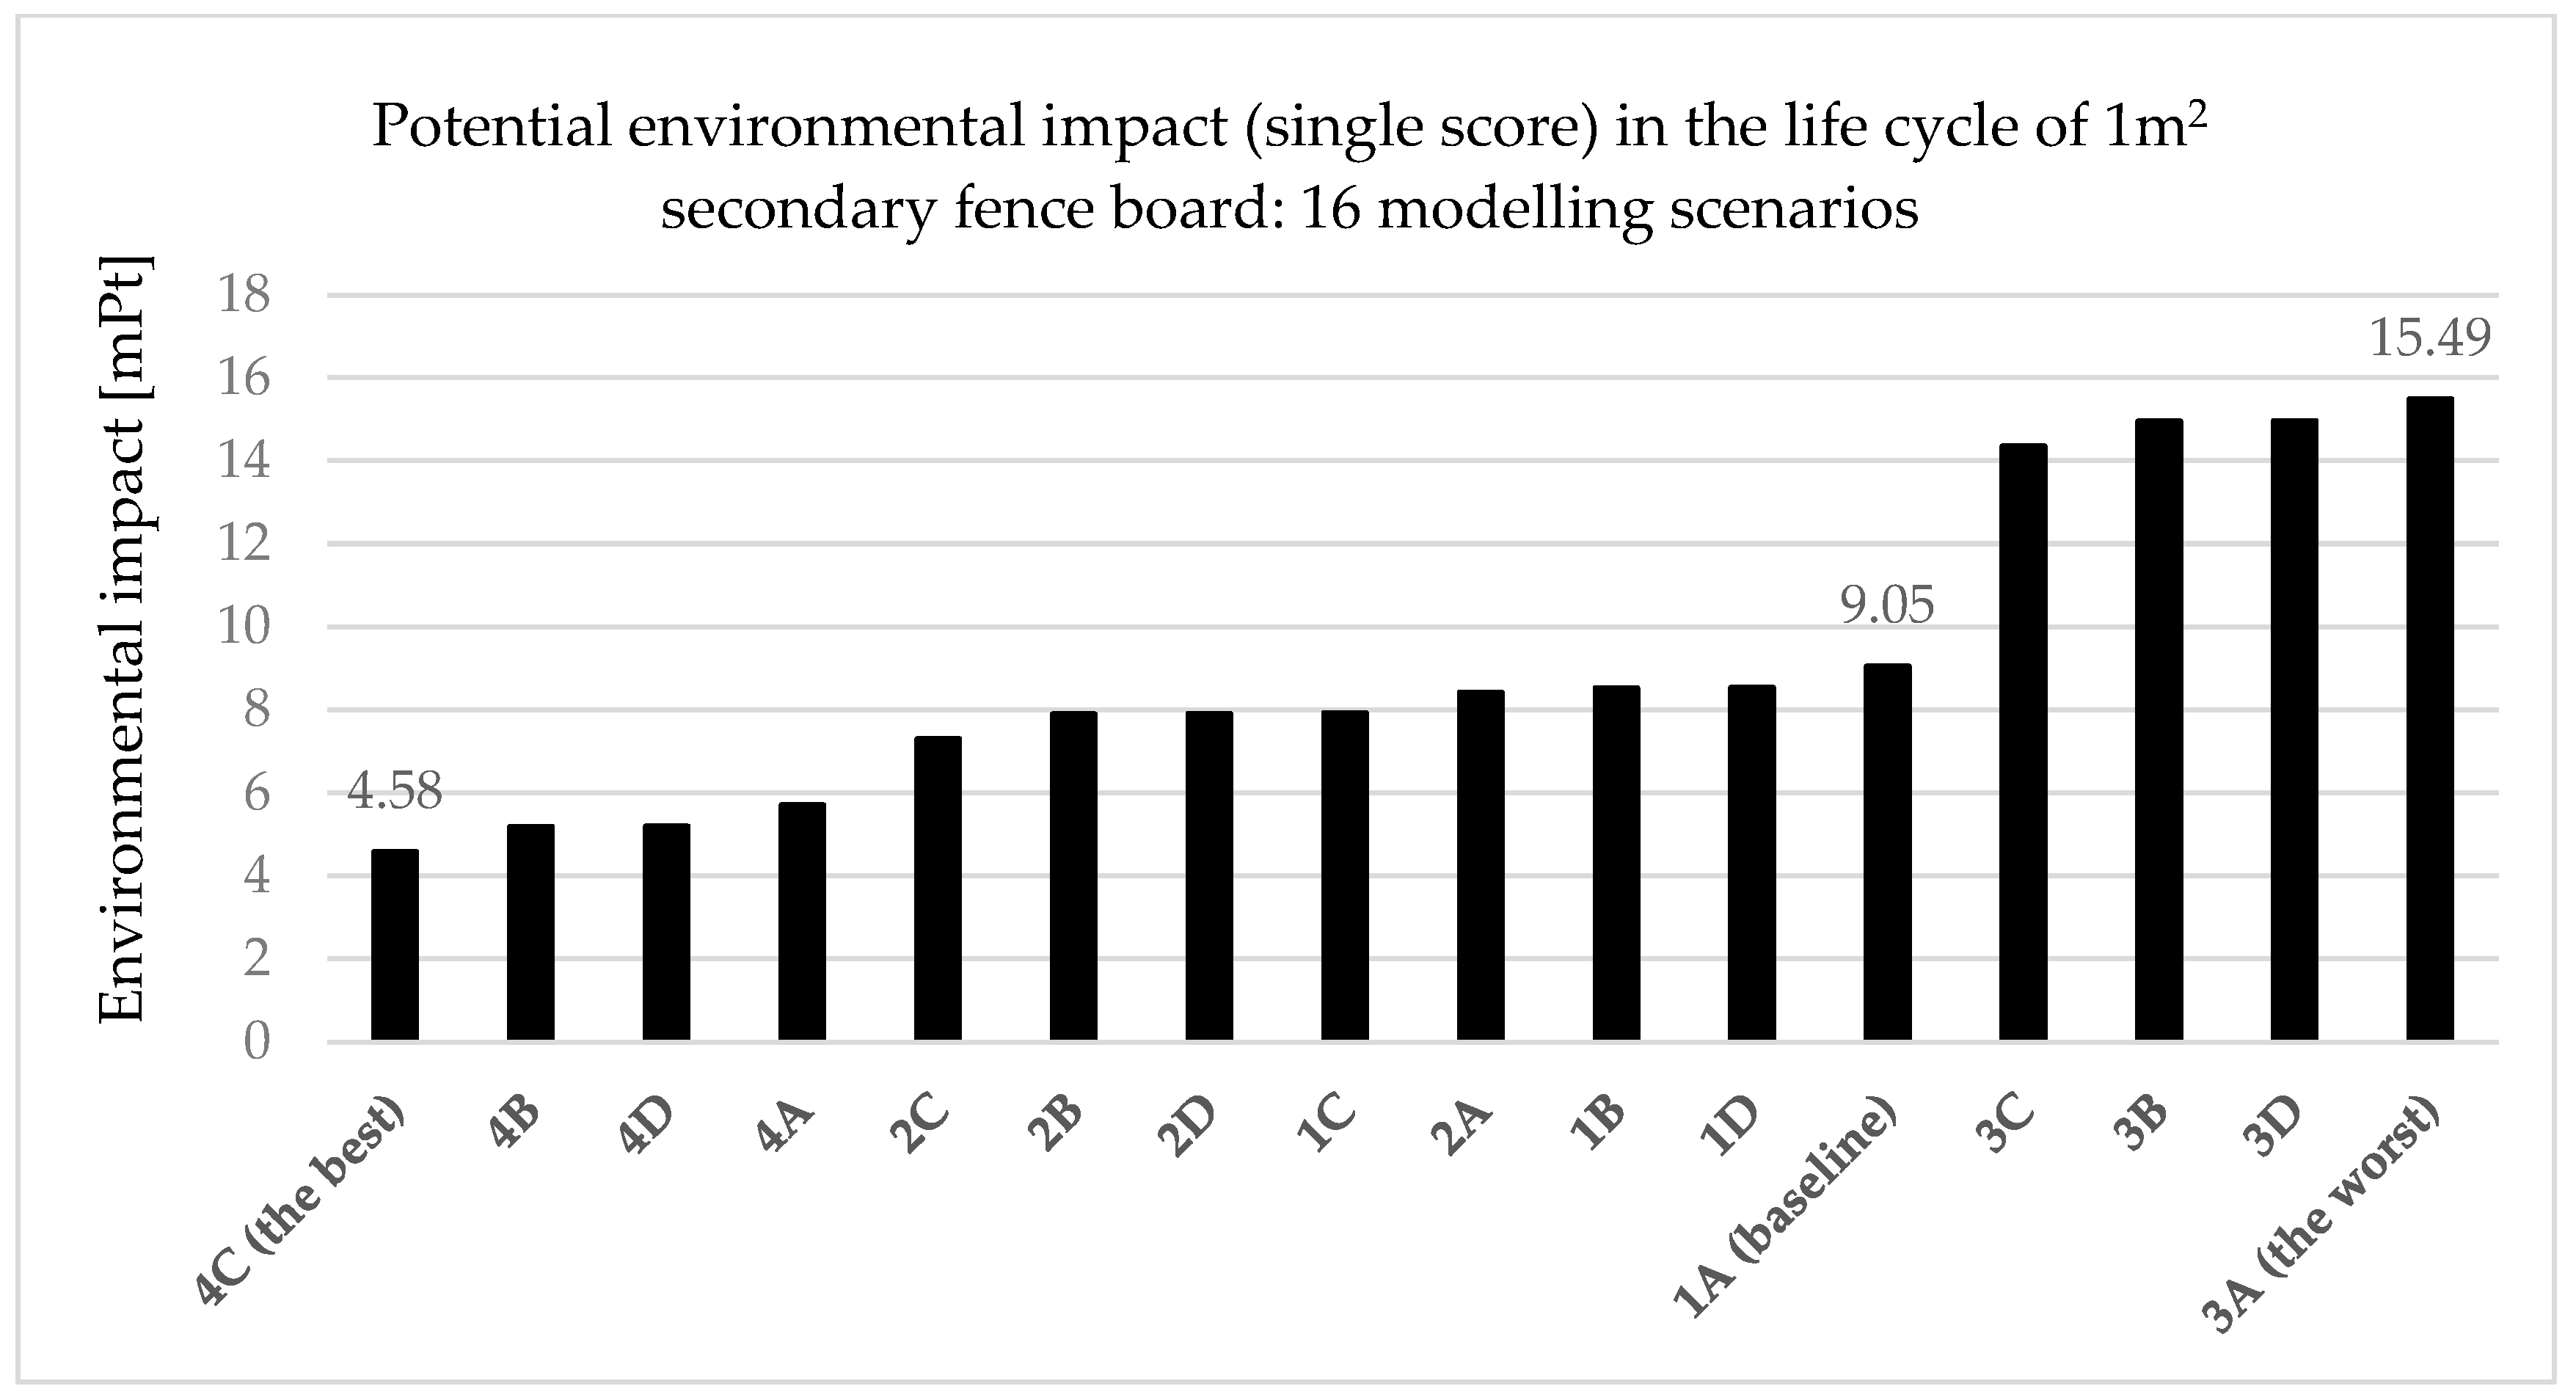
| Environmental Impact (Single Score) | Ranking (1: the Best Scenario, 16: the Worst Scenario) | Scenarios | |||||
|---|---|---|---|---|---|---|---|
| EF 3.0 Adapted (Ecoinvent 3.8) | EF 3.0 Adapted (Ecoinvent 3.8) | EF 3.0 Adapted (Ecoinvent 3.9) | IPCC 2021 GWP100 (Ecoinvent 3.9) | AWARE (Ecoinvent 3.9) | IMPACT World+ Endpoint (Ecoinvent 3.9) | ||
| 4.58 | mPt | 1 | 4C | 4C | 4C | 2B | 4B |
| 5.18 | mPt | 2 | 4B | 4B | 4B | 2C | 4C |
| 5.19 | mPt | 3 | 4D | 4D | 4A | 2A | 4D |
| 5.71 | mPt | 4 | 4A | 4A | 4D | 2D | 4A |
| 7.30 | mPt | 5 | 2C | 2C | 2C | 4B | 1B |
| 7.90 | mPt | 6 | 2B | 2B | 2B | 4C | 1C |
| 7.90 | mPt | 7 | 2D | 2D | 2A | 4A | 1D |
| 7.93 | mPt | 8 | 1C | 2A | 2D | 4D | 2B |
| 8.42 | mPt | 9 | 2A | 1C | 1C | 3B | 2C |
| 8.53 | mPt | 10 | 1B | 1B | 1B | 3C | 1A (baseline) |
| 8.53 | mPt | 11 | 1D | 1D | 1A (baseline) | 3A | 2D |
| 9.05 | mPt | 12 | 1A (baseline) | 1A (baseline) | 1D | 3D | 2A |
| 14.36 | mPt | 13 | 3C | 3C | 3C | 1B | 3C |
| 14.96 | mPt | 14 | 3B | 3B | 3B | 1C | 3B |
| 14.97 | mPt | 15 | 3D | 3D | 3A | 1A (baseline) | 3D |
| 15.48 | mPt | 16 | 3A | 3A | 3D | 1D | 3A |
Disclaimer/Publisher’s Note: The statements, opinions and data contained in all publications are solely those of the individual author(s) and contributor(s) and not of MDPI and/or the editor(s). MDPI and/or the editor(s) disclaim responsibility for any injury to people or property resulting from any ideas, methods, instructions or products referred to in the content. |
© 2024 by the authors. Licensee MDPI, Basel, Switzerland. This article is an open access article distributed under the terms and conditions of the Creative Commons Attribution (CC BY) license (https://creativecommons.org/licenses/by/4.0/).
Share and Cite
Kulczycka, J.; Lewandowska, A.; Joachimiak-Lechman, K.; Kurczewski, P. The Circularity of Materials from the Perspective of the Product Life Cycle: A Case Study of Secondary Fence Board, Part 2 (Scenario Analysis). Resources 2024, 13, 52. https://doi.org/10.3390/resources13040052
Kulczycka J, Lewandowska A, Joachimiak-Lechman K, Kurczewski P. The Circularity of Materials from the Perspective of the Product Life Cycle: A Case Study of Secondary Fence Board, Part 2 (Scenario Analysis). Resources. 2024; 13(4):52. https://doi.org/10.3390/resources13040052
Chicago/Turabian StyleKulczycka, Joanna, Anna Lewandowska, Katarzyna Joachimiak-Lechman, and Przemysław Kurczewski. 2024. "The Circularity of Materials from the Perspective of the Product Life Cycle: A Case Study of Secondary Fence Board, Part 2 (Scenario Analysis)" Resources 13, no. 4: 52. https://doi.org/10.3390/resources13040052