Article

Production and Quality Characteristics of Royal Jelly in Relation to Available Natural Food Resources

by
Dimitrios Kanelis
,
Vasilios Liolios
,
Maria-Anna Rodopoulou
,
Fotini Papadopoulou
and
Chrysoula Tananaki
*
Laboratory of Apiculture-Sericulture, Aristotle University of Thessaloniki, Aristotle Farm, 57001 Thermi, Greece
*
Author to whom correspondence should be addressed.
Resources 2024, 13(4), 55; https://doi.org/10.3390/resources13040055
Submission received: 13 February 2024 / Revised: 29 March 2024 / Accepted: 7 April 2024 / Published: 8 April 2024

Abstract

:
Royal jelly is a secretion produced from the hypopharyngeal glands of worker bees, which requires significant pollen reserves to stimulate gland secretion. The natural sources of food available to the hive during beekeeping season can greatly affect the quantity and quality of produced royal jelly. In this study, samples of royal jelly were collected throughout the beekeeping season, and their physical and chemical characteristics were analyzed to understand how natural variations in bee diet affect royal jelly production. Before each sample collection, the bees’ food reserves were removed from the experimental colonies so that the royal jelly was produced solely from natural sources. The results showed that the production was significantly lower during the summer months compared with spring and autumn. Additionally, the moisture, protein, fructose, and glucose content of fresh royal jelly also showed significant changes in the summer, and all physical and chemical characteristics decreased when the fresh samples were converted into dry matter. It seems that the quality of pollen entering the hives has a direct impact on the physical and chemical properties of the final product, highlighting the crucial role of available resources in stimulating bees to produce royal jelly.

1. Introduction

Royal jelly (RJ) is a beehive product highly prized in many countries due to its consistent production, even in challenging environmental conditions, and high market value, making it a profitable asset for beekeepers. Produced by the mandibular and hypopharyngeal (cephalic) glands of young worker bees of Apis mellifera L., this creamy, viscous, white, and highly acidic substance has the unique ability to transform an ordinary female worker larva into a queen bee with an extended lifespan and egg-laying capabilities [1]. RJ is also widely used as a dietary supplement and pharmaceutical product, with extensive research demonstrating its positive effects on the immune system, metabolism, vascular and glandular function, skin health, heart function, as well as cholesterol and lipid control in humans [2,3,4,5].
In addition to honey, RJ has the potential to greatly increase beekeeper’s profits. The specific beekeeping practices commonly employed by beekeepers, combined with increasing consumer demand and a high market price, contribute to RJ being a promising trade opportunity, as it is consistently produced even in adverse weather conditions. However, challenges in its marketing arise due to the absence of a legislative framework to authenticate and guarantee its quality [6]. The development of legislation for RJ requires an understanding of its chemical composition and the factors that influence it. According to Sabatini et al. [7], this chemical composition varies significantly due to different sampling methods, production conditions, and various analytical approaches. Additionally, other factors, such as storage conditions, can significantly impact the sugar composition of RJ, as noted by Chen and Chen [8] and Kanelis [9].
RJ is primarily composed of water (50–70%), proteins (9–18%), carbohydrates such as fructose, glucose, and sucrose (7–18%), as well as lipids and fatty acids (3–8%) in smaller amounts. It also contains water-soluble vitamins, nucleobases, nucleotides, polyphenols, hormones, and sterols [9,10,11,12]. Several studies have assessed the composition of RJ, including the determination of its botanical and geographical origin [13,14,15], using modern techniques such as nuclear magnetic resonance (NMR) metabolomics [14]. Indeed, the identification and labeling of a product’s origin are directly linked to its quality control and significantly influence consumer perception [16]. However, most of these studies are based on small sample sizes, and there is a lack of well-established feeding experiments.
In order to produce RJ, bees need to consume large amounts of proteins, which they can only obtain from pollen [17]. The production of RJ outside of the honeycomb and in artificial queen cells began in 1889 when Doolittle developed a production method for making artificial queen cells with wax and transferring a worker bee larva into them [18]. Commercially, large quantities of pure and high-quality RJ are needed, requiring a substantial number of artificial queen cells to be grafted. Beekeepers who produce RJ may provide supplementary foods to their bees to develop and maintain the colonies with optimal populations, extend the yielding season, and improve RJ yields [19], but these beekeeping practices may influence RJ’s composition [7,12,20]. Beekeepers believe that providing food to bees during RJ production stimulates workers to increase the quantity of the product and the acceptance of artificial queen cells. However, this belief has not been scientifically proven [21]. The acceptance of artificial queen cells by bees is influenced by various factors, including the season of RJ production and genetic factors like the breed [22,23]. Also, the availability of food supplies, particularly pollen and nectar, fluctuates throughout the year, affecting the stimulation of bee glands. This raises the question of whether and how the available resources can affect the production and physicochemical characteristics of RJ.
For all the reasons above, the purpose of the present study was to produce RJ samples throughout the beekeeping season and investigate how the available resources influence its yield and physicochemical characteristics. The objective is to comprehend the natural variations in RJ linked to the composition of the food consumed by the bees.

2. Materials and Methods

2.1. Preparation of Bee Colonies and Collection of RJ Samples

For the experiments, three bee colonies of the experimental apiary of Laboratory of Apiculture-Sericulture, AUTH, were used, in each of which a total of 60 artificial queen cells were grafted. RJ samples were collected every 15 days over nine graftings from the beginning of May to mid-October, resulting in a total of 27 RJ samples (3 samples in each collection day). No feeding was carried out, and consistent beekeeping treatments were applied across all three apiaries. The collected samples were stored in the freezer until their analysis.
To produce the RJ samples, graftings occurred for three days using a 48-h-old larva in each queen cell. The procedure was conducted in a controlled environment within the laboratory using a custom-designed workbench and a specialized stainless steel tool. The grafted larvae were then transferred to the artificial queen cells embedded on grooved bars using a water solution with RJ for safe deposition at the base of each queen cell. After the grafting, the artificial queen cells were placed in the center of the queenless hives. After three days, the bars with the cells containing RJ were removed from the hives for collection. The waxy extension of the queen cell was removed to access the larva inside, and the RJ was collected using a wooden spatula and placed in special dark-colored jars. The acceptance of each bee colony was recorded, and the RJ was weighed using an analytical balance. Prior to re-grafting, the artificial queen cells were steam cleaned to remove debris from previous sampling. Before each grafting session, the pollen frames present in the experimental hives were removed to ensure that the production of RJ relied solely on natural resources.

2.2. Physicochemical Analyses

The levels of moisture, protein, sugar, and 10-hydroxy-2-decenoic acid (10-HDA) were analyzed following the methods described by Kanelis et al. [9].
Moisture content (%): The drying oven method was used to determine the moisture content of the samples, where 1 g of RJ was weighed in porcelain-evaporating dishes, and the weight of each sample was recorded. The samples were then placed in an oven and kept at 120 °C for 60 min. The moisture was calculated based on the formula:
Moisture content (%) = (M − M2)/(M − M1) × 100
M: The weight of the dish and the sample before drying
Μ1: The initial weight of the dish
Μ2: The weight of the dish after the drying
Protein content (%): The Kjeldahl method was used to determine the total nitrogen content of the samples. An amount of each RJ sample (0.5 g) was mixed with 25 mL of concentrated sulphuric acid (Merck, Darmstadt, Germany) and a catalyst (Thompson & Capper Ltd., Cheshire, UK) in a digestion tube to convert amine nitrogen to ammonium ions. The mixture was heated until it turned light blue, then cooled and placed in a Kjeflex K-360 steam distillation unit (Buchi, Flawil, Switzerland). During distillation, the ammonium ions were converted into ammonia gas in the presence of NaOH (30.0%, w/v) (Chem-Lab., Zedelgem, Belgium), which was then transferred into a trapping solution of H3BO3 (4.0%, w/v) (Merck, Darmstadt, Germany), dissolved, and converted back to ammonium ion. Titration was performed using a 0.1 mol L−1 HCl solution added with a MettlerTolledoT50 titrator (Schweiz, Switzerland). The crude protein content (%, w/w) was determined using a factor of 6.25.
Sugar content (%): For the quantification of the levels of fructose, glucose, and sucrose in RJ samples, a high-performance liquid chromatography (HPLC) system with a refractive index detector (RID) (Agilent Technologies 1200, Tokyo, Japan) was applied. A 0.5 g sample of RJ was combined with C6FeK4N6 × 3H2O (Sigma-Aldrich, St. Louis, MO, USA) and (CH3COO)2Zn × 2H2O (Merck, Darmstadt, Germany) reagents and then transferred to volumetric flasks, which were then filled with 5 mL methanol/water solution (25:75, v/v). Prior to injection, the mixture was filtered through a 0.25 μm disposable syringe filter. The sugars were then separated using a Zorbax Carbohydrate Analysis Column (4.6 mm × 150 mm × 5 μm) (Agilent Technologies 1200) with a mobile phase consisting of a mixture of acetonitrile (Sigma-Aldrich, St. Louis, MO, USA) and water (80:20, v/v) at a flow rate of 1.3 mL min−1. The injection volume was 10 μL, and for the quantification, we used a 5-point calibration curve for each sugar. The selection of these points’ concentrations was based on the values identified in the global literature and the instrument’s level of sensitivity and set at 0.2, 2.0, 8.0, 15.0, and 20.0 mg mL−1 for fructose and glucose and at 0.1, 1.0, 2.0, 3.5, and 5.0 mg mL−1 for sucrose, respectively. The calibration curves for each sugar were:
For fructose: y = 58,419.6x – 9949.9 with R = 0.999 and LOD = 0.02 mg mL−1, LOQ = 0.074 mg mL−1
For glucose: y = 74,249x−12,506.2 with R = 0.999 and LOD = 0.03 mg mL−1, LOQ = 0.099 mg mL−1
For sucrose: y = 30,512.2x + 9160.3 with R = 0.991 and LOD = 0.017 mg mL−1, LOQ = 0.058 mg mL−1
From the values of the correlation coefficients of all the curves, the method exhibited very good linearity. Also, the method presented low prices for limit of detection (LOD) and limit of quantification (LOQ).
10-HDA content (%): The 10-HDA content was measured using HPLC system with diode array detection (DAD) (Agilent Technologies 1200, Tokyo, Japan). Samples of 0.2 g of RJ were mixed with 1.0 mL of ultrapure water from a Simplicity 185 system (Millipore, Molsheim, France), 0.6 mL of HCl (1 mol mL−1) (Chem-Lab., Zedelgem, Belgium), and 0.4 mL of methyl-4-hydroxybenzoate (1.0 mg mL−1) (Sigma-Aldrich, St. Louis, MO, USA) as internal standard. The volume was adjusted to 10.0 mL with ethanol HPLC grade (Merck, Darmstadt, Germany). It was then subjected to ultrasonic treatment for 10 min and filtered through a 0.22 μm disposable syringe filter (Merck, Darmstadt, Germany) before injection. For the separation, we used an Athena C18-WP column (3 μm × 150 mm × 4.6 mm) at a temperature of 30 °C. The mobile phase consisted of a mixture of methanol (Chem-Lab., Zedelgem, Belgium), ultrapure water, and orthophosphoric acid (Chem-Lab., Zedelgem, Belgium) (50:50:0.3, v/v/v). The injection volume, flow rate, and detector wavelength were 10 μL, 1.0 mL min−1, and 210 nm, respectively. For the quantification, we used a 5-point calibration curve at concentrations of 0.002, 0.100, 0.225, 0.375, and 0.500 mg mL−1. The calibration curve was:
For 10-HDA: y = 19,906x–740 with R = 0.998 and LOD = 0.0002 mg mL−1, LOQ = 0.0006 mg mL−1
From the values of the correlation coefficient of the curve, the method exhibited very good linearity. Also, the method presented low prices for limit of detection (LOD) and limit of quantification (LOQ).
Calculation of dry matter: To evaluate the RJ’s composition without the diluting effect of its moisture content and compare our findings with studies that analyzed lyophilized RJ, we computed a dry basis weight using the equation:
X × 100/(100 − W)
where ‘X’ represents the measured wet weight of a component of RJ;
‘W’ the moisture content of this sample.

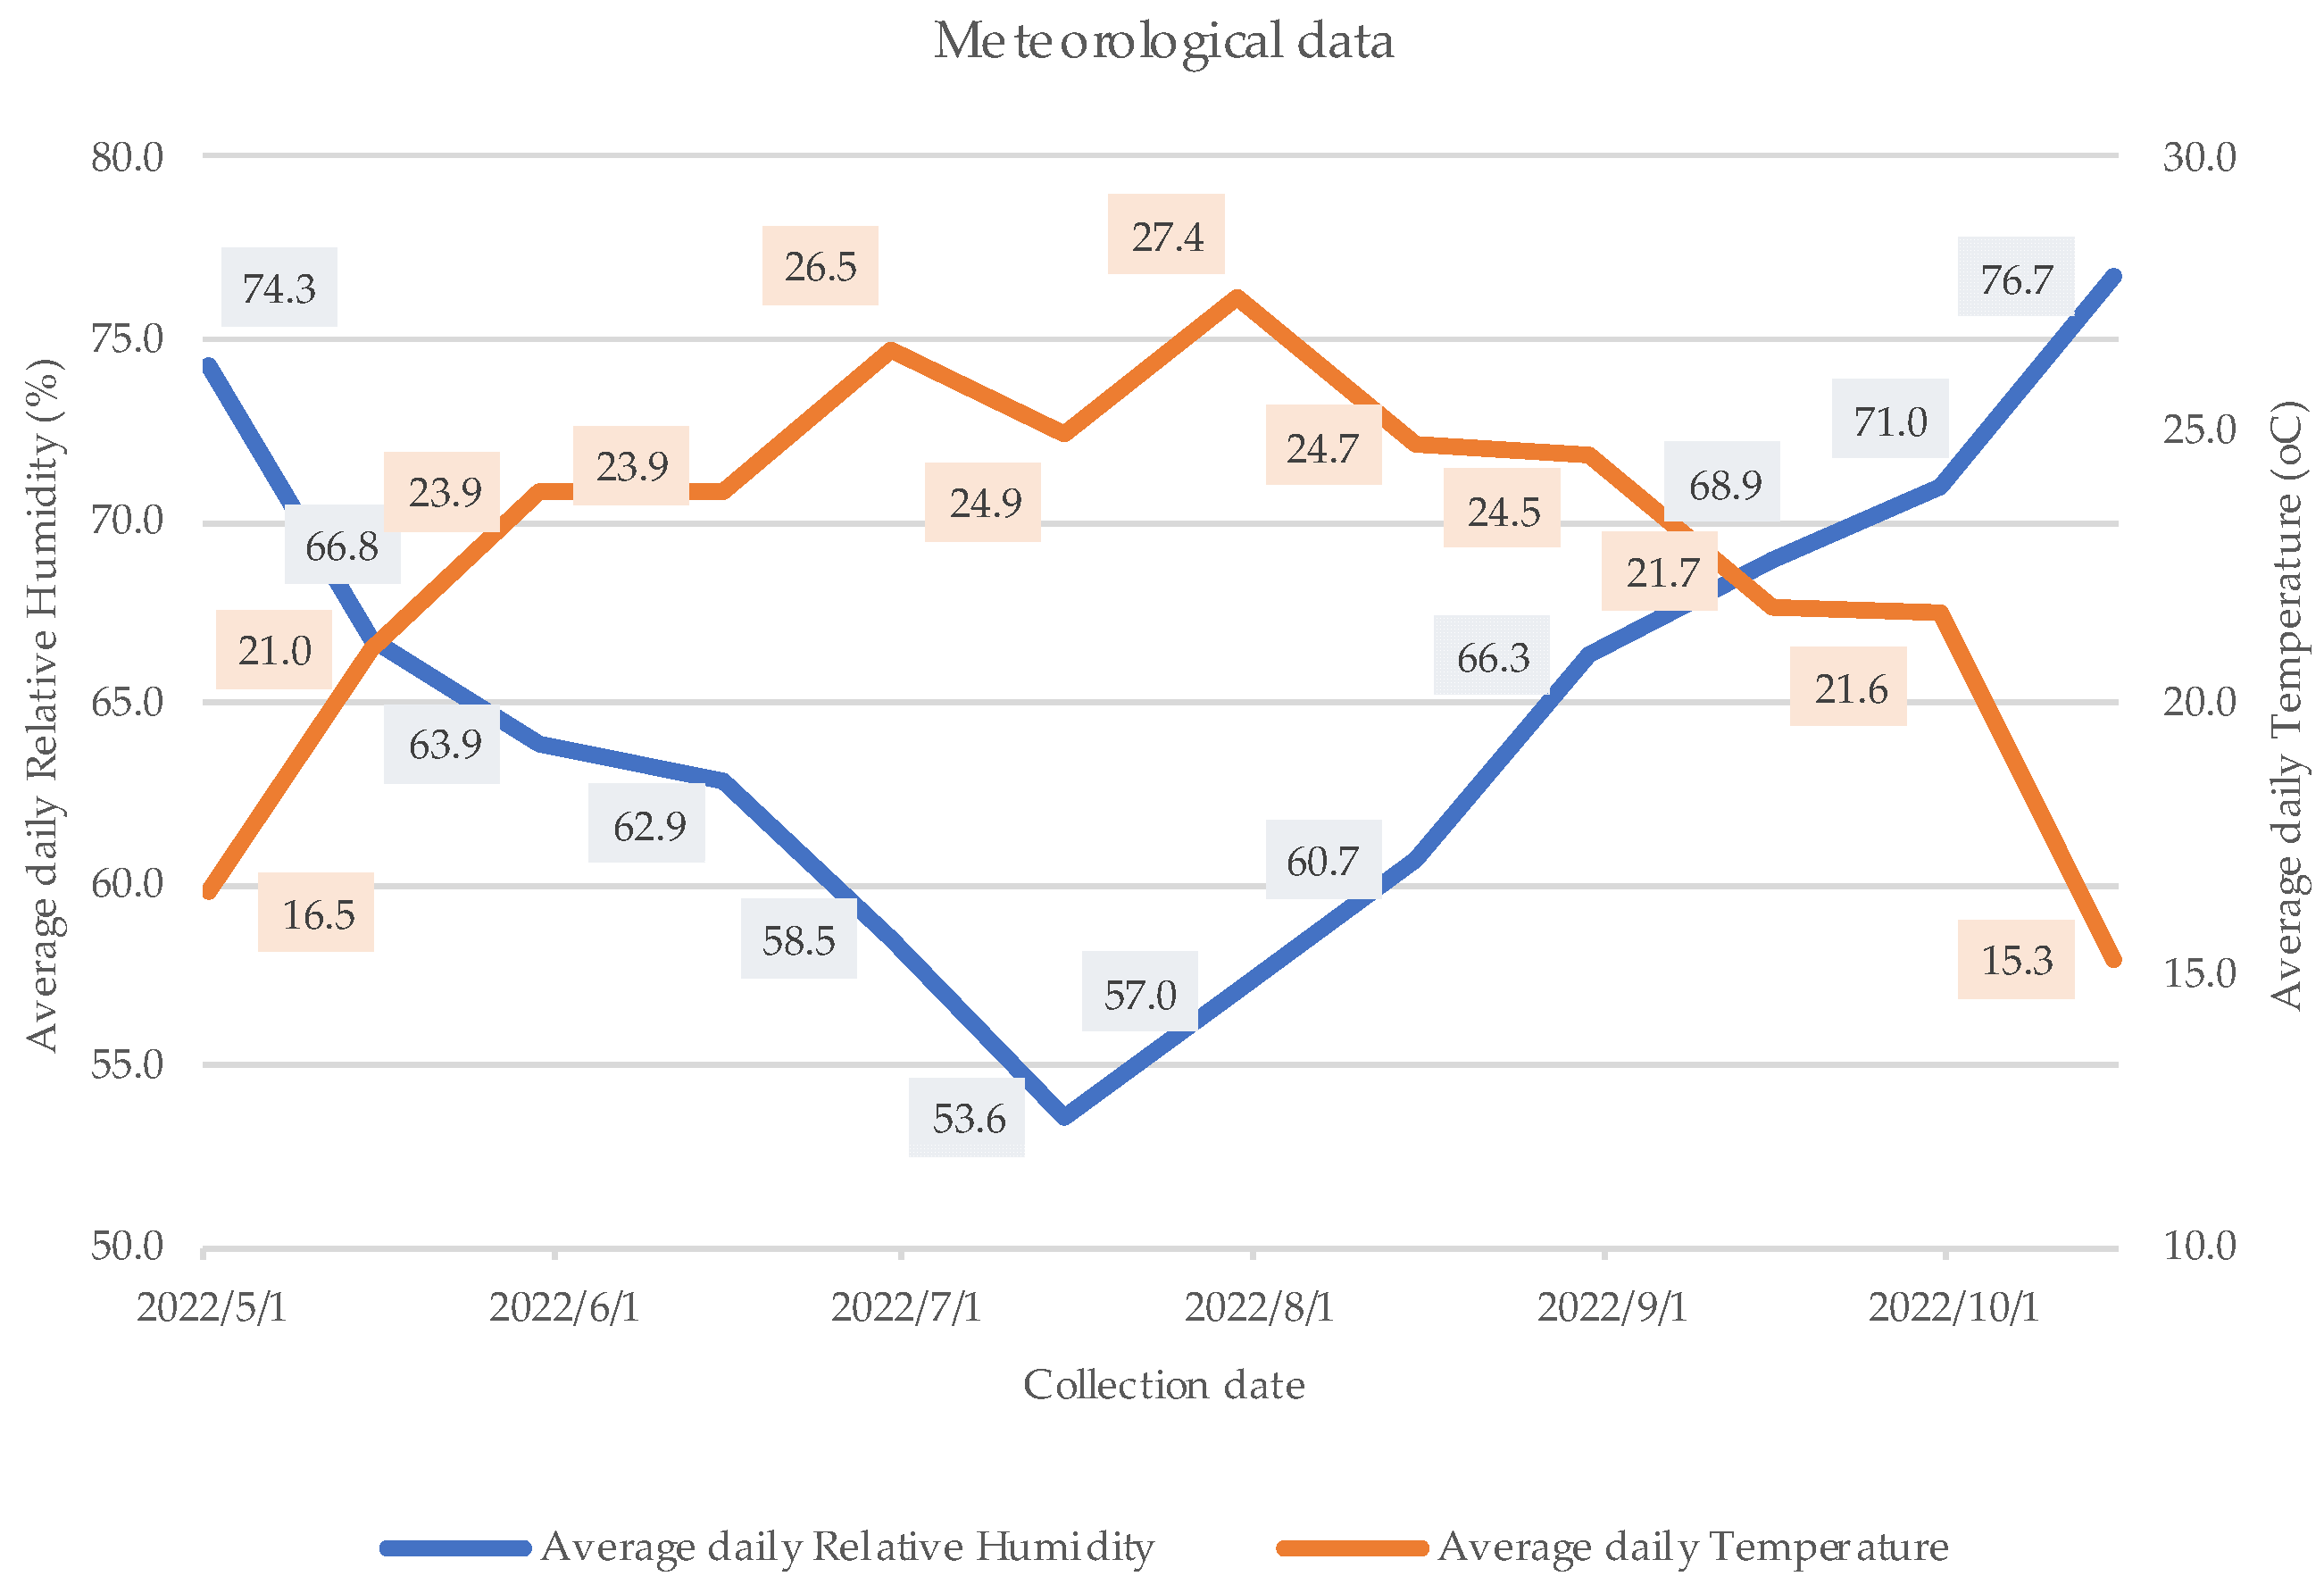
2.3. Meteorological Measurements

Daily measurements were collected from a meteorological station (Adcon Telemetry) located at the experimental apiary of the Laboratory of Apiculture-Sericulture, AUTH. The station recorded and computed various parameters such as wind speed, wind direction, air temperature, relative atmospheric humidity, precipitation, solar radiation, etc. The station was equipped with software (Software advantage Pro 6.8) for analyzing the data.

2.4. Statistical Analysis

Moisture, total protein, sugar, and 10-HDA content were compared between the groups with one-way analysis of variance (ANOVA) using the IBM SPSS statistics software (ver. 19) (New York, NY, USA), and the significance level of the test was set at 0.05 (α = 0.05). In order to check the values distribution, we applied the Kolmogorov–Smirnov test and Levene’s test for homogeneity, as well, before performing the ANOVA test. In the case of Kolmogorov–Smirnov test, all the exported p-values (range: 0.08–0.200) were greater than the 0.05 significance level, showing that the data were normally distributed. Also, the skewness and kurtosis were between the acceptable range of −1 and 1, and the points did not deviate much from the line in the Q–Q plot. As for Levene’s test, all the p-values (range: 0.053–0.965) exported were greater than the 0.05 significance level, meeting the homogeneity of variance.

3. Results and Discussion

Honeybees rely primarily on pollen as their source of protein [24]. Various plants bloom throughout the year, each offering pollen with different compositions of lipids, proteins, and vitamins that bees collect [25,26], while the protein content of pollen in mixed samples varies significantly throughout the year [27]. Due to these fluctuations in pollen composition and its importance as a unique source of amino acids and proteins, it was deemed necessary to investigate whether the physicochemical properties of RJ change over the seasons, depending on the availability of natural food sources. Thus, RJ samples were harvested from three beehives every 15 days, without any supplementary feeding, from spring to autumn.

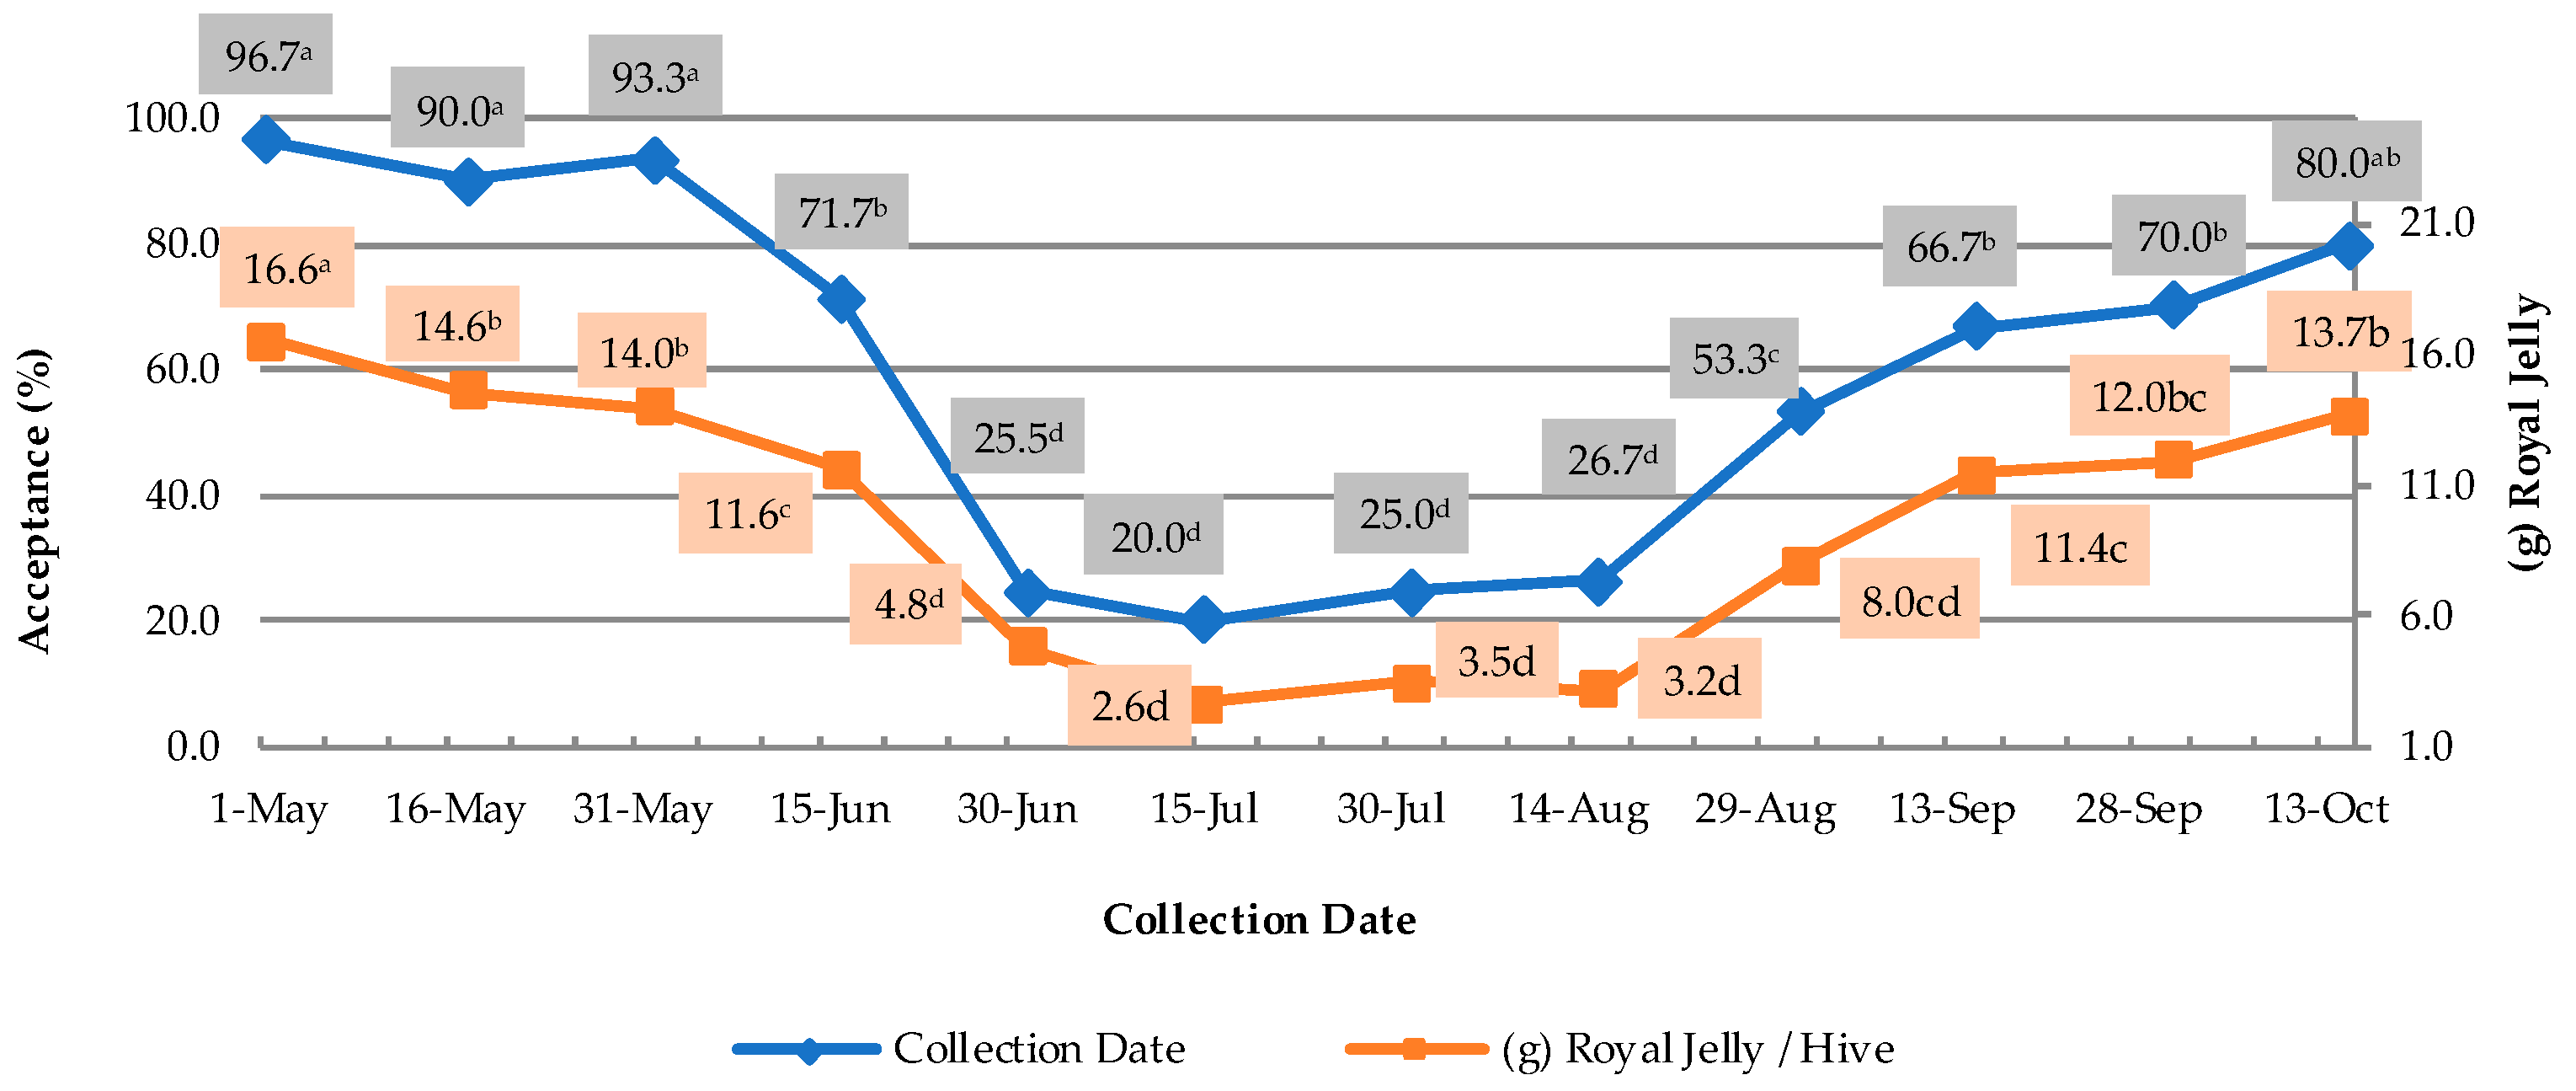
3.1. Production–Acceptance Rate

The successful production of high-yield RJ requires honeybee colonies with a queen of good quality, a large population, and appropriate temperatures [1,28]. Food reserves, however, restrict the production of RJ and the acceptance of artificial queen cells by honeybee workers, as illustrated in Figure 1.
As reported by Liolios et al. [27], in the same study area, bees collected minimal amounts of pollen during the period from the 30th of June to the 14th of August. This resulted in a major decrease in the acceptance of queen cells and in the production of RJ. The average yield of RJ during the summer months was between 2.6 and 4.8 g per grafting, while during the spring and autumn months, it ranged from 14.0 to 16.6 g and from 11.4 to 13.7 g, respectively. The reduced acceptance of queen cells and RJ yield may be attributed to the bees’ instinct to conserve energy and reserves when there is a shortage of pollen and nectar in the hive or when food supply from nature is limited. Therefore, it is advisable for beekeepers to avoid producing queens during periods of low pollen input, as these queens may receive less RJ and have lower success rates.

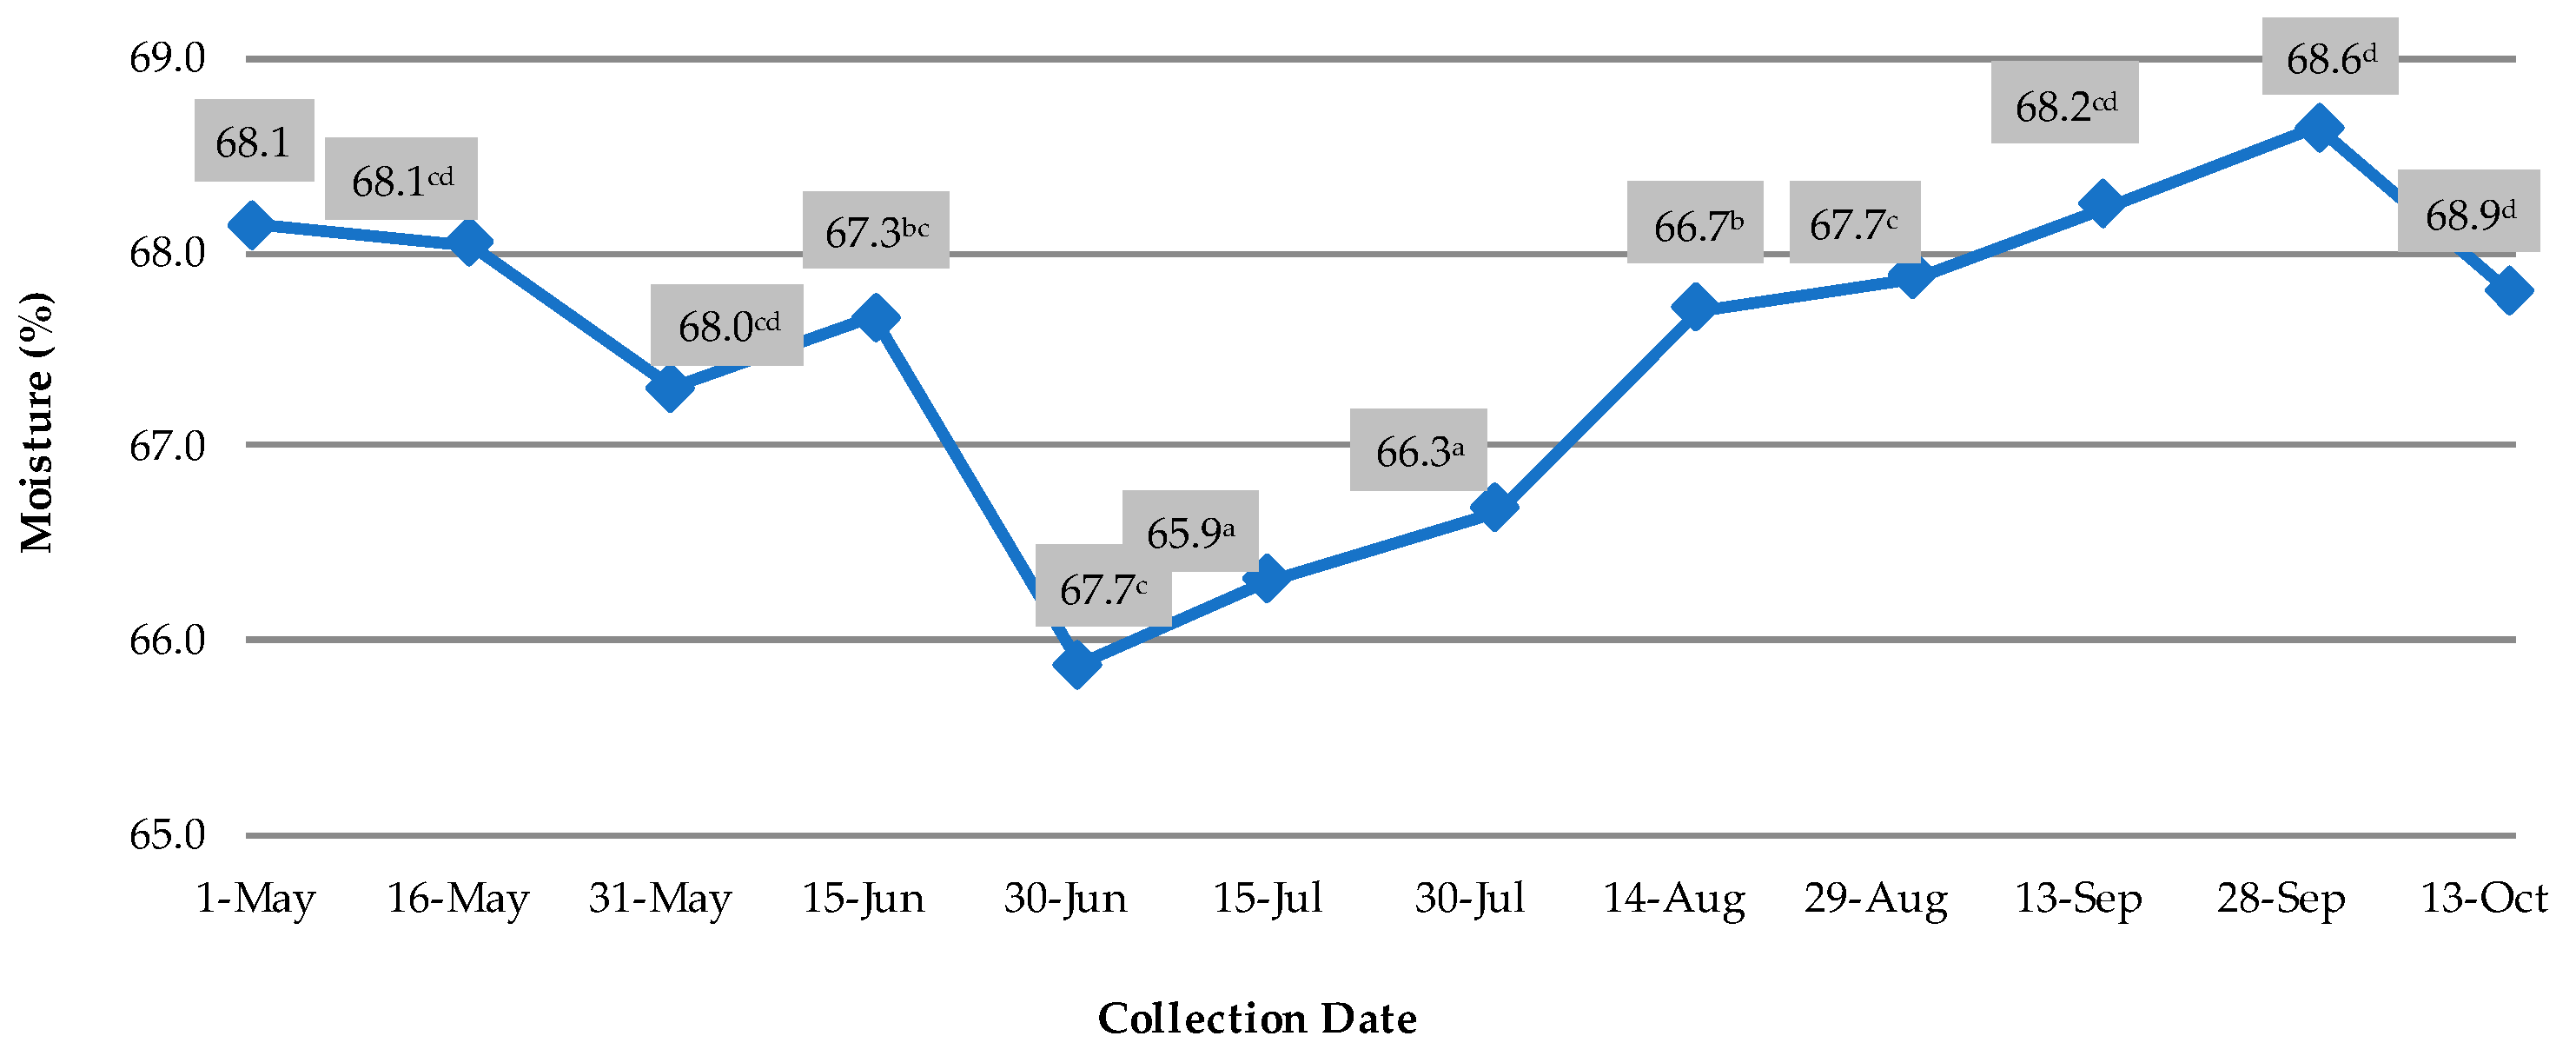
3.2. Determination of Moisture Content

The study initially focused on analyzing the moisture content of the collected RJ samples in order to determine the moisture levels of the product across the beekeeping year. The sample averages of the three bee colonies on each date and the comparison between the averages on different dates are depicted in Figure 2.
Based on the data provided, it is evident that the moisture content of RJ varies significantly depending on the season of production. Samples produced in the summer months had notably lower moisture content compared with those produced in autumn and spring. This difference could be influenced by the low average daily relative humidity (%) and high average daily temperature (°C) in the experimental area during RJ production (Figure 3).
Interestingly, there was no notable difference in moisture content between samples produced in spring and autumn. The statistical analysis indicated a significant variation in moisture content throughout the beekeeping year, with a p-value of 0.004, <a = 0.05. The minimum mean value (65.9%) was recorded on the 30th of June, while the maximum (68.9%) was observed on the 28th of September.
The low moisture content in the summer months can be attributed either to the increased environmental temperature, leading to the dehydration of RJ, or to the reduced access of the bees to water sources. However, even in the summer, the moisture levels of the samples were consistent with the values reported in the existing literature [24,29,30].
Since RJ is a product with high moisture, the rest of the physical–chemical parameters were expressed in dry matter, as well. However, given that RJ is mostly traded in fresh form and for the comparison of the results with the international literature, the fresh values were also included.

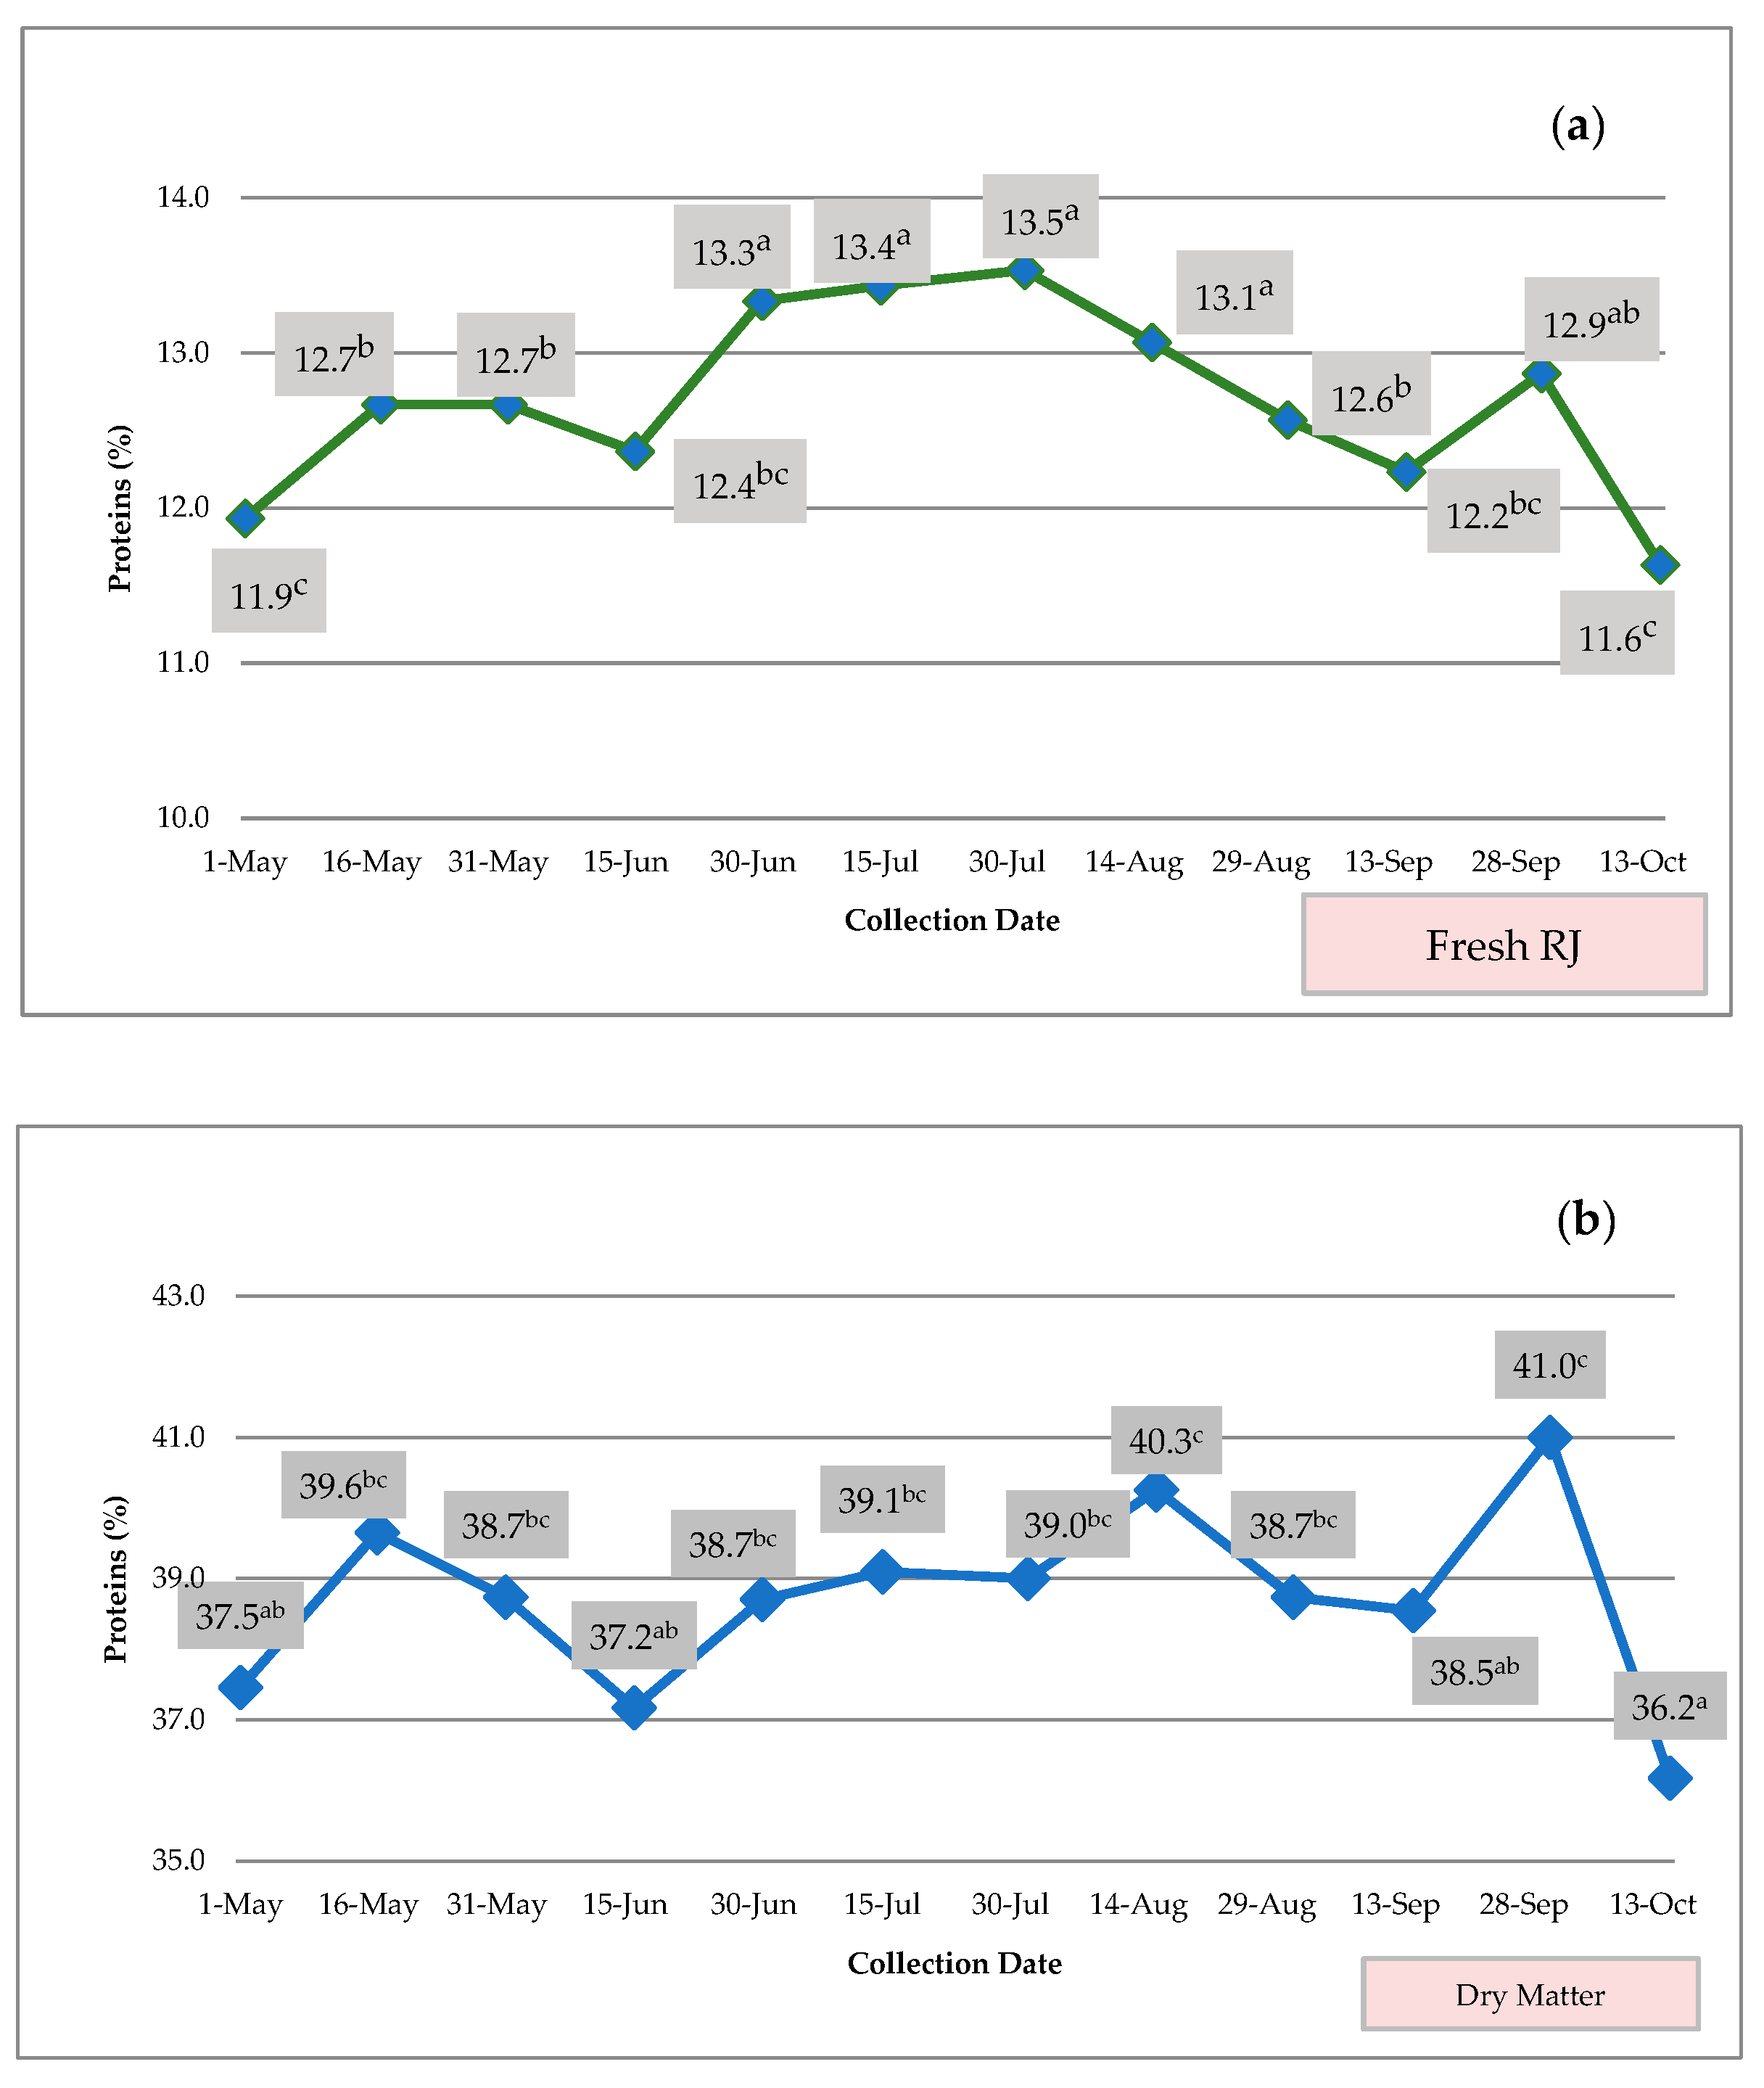
3.3. Determination of Protein Content (%)

The changes in protein content (%) on fresh RJ and on its dry matter across the beekeeping year were also examined. The results are presented in Figure 4.
The samples showed slightly significant variations in terms of dry matter proteins (p = 0.049, <a = 0.05). The lowest mean protein value (36.2%) was recorded on the 13th of October, while the highest (41.0%) was found on the 28th of September. It seems that protein levels begin at lower values, rise in the middle of spring, decrease gradually in the early summer, and exhibit a slight increase in late summer–autumn. Similar behavior was observed in the protein content of fresh RJ, with the lowest mean value (11.6%) on the 13th of October and the highest (13.5%) on the 30th of July.
These findings align with previous studies on fresh RJ samples by Nabas et al. [30] and Zheng et al. [31]. Similarly, in bee pollen, as noted by Liolios et al. [27], protein levels reached a peak during spring, decreased in summer, and then rose again in the autumn. It should be noted that both the pollen study and the current study were carried out in the same location during the same beekeeping year. When comparing the protein content of RJ with that of pollen, it is evident that when the protein content in pollen typically rises in the following 2 weeks, there is a noticeable increase in the protein content of RJ, as well.

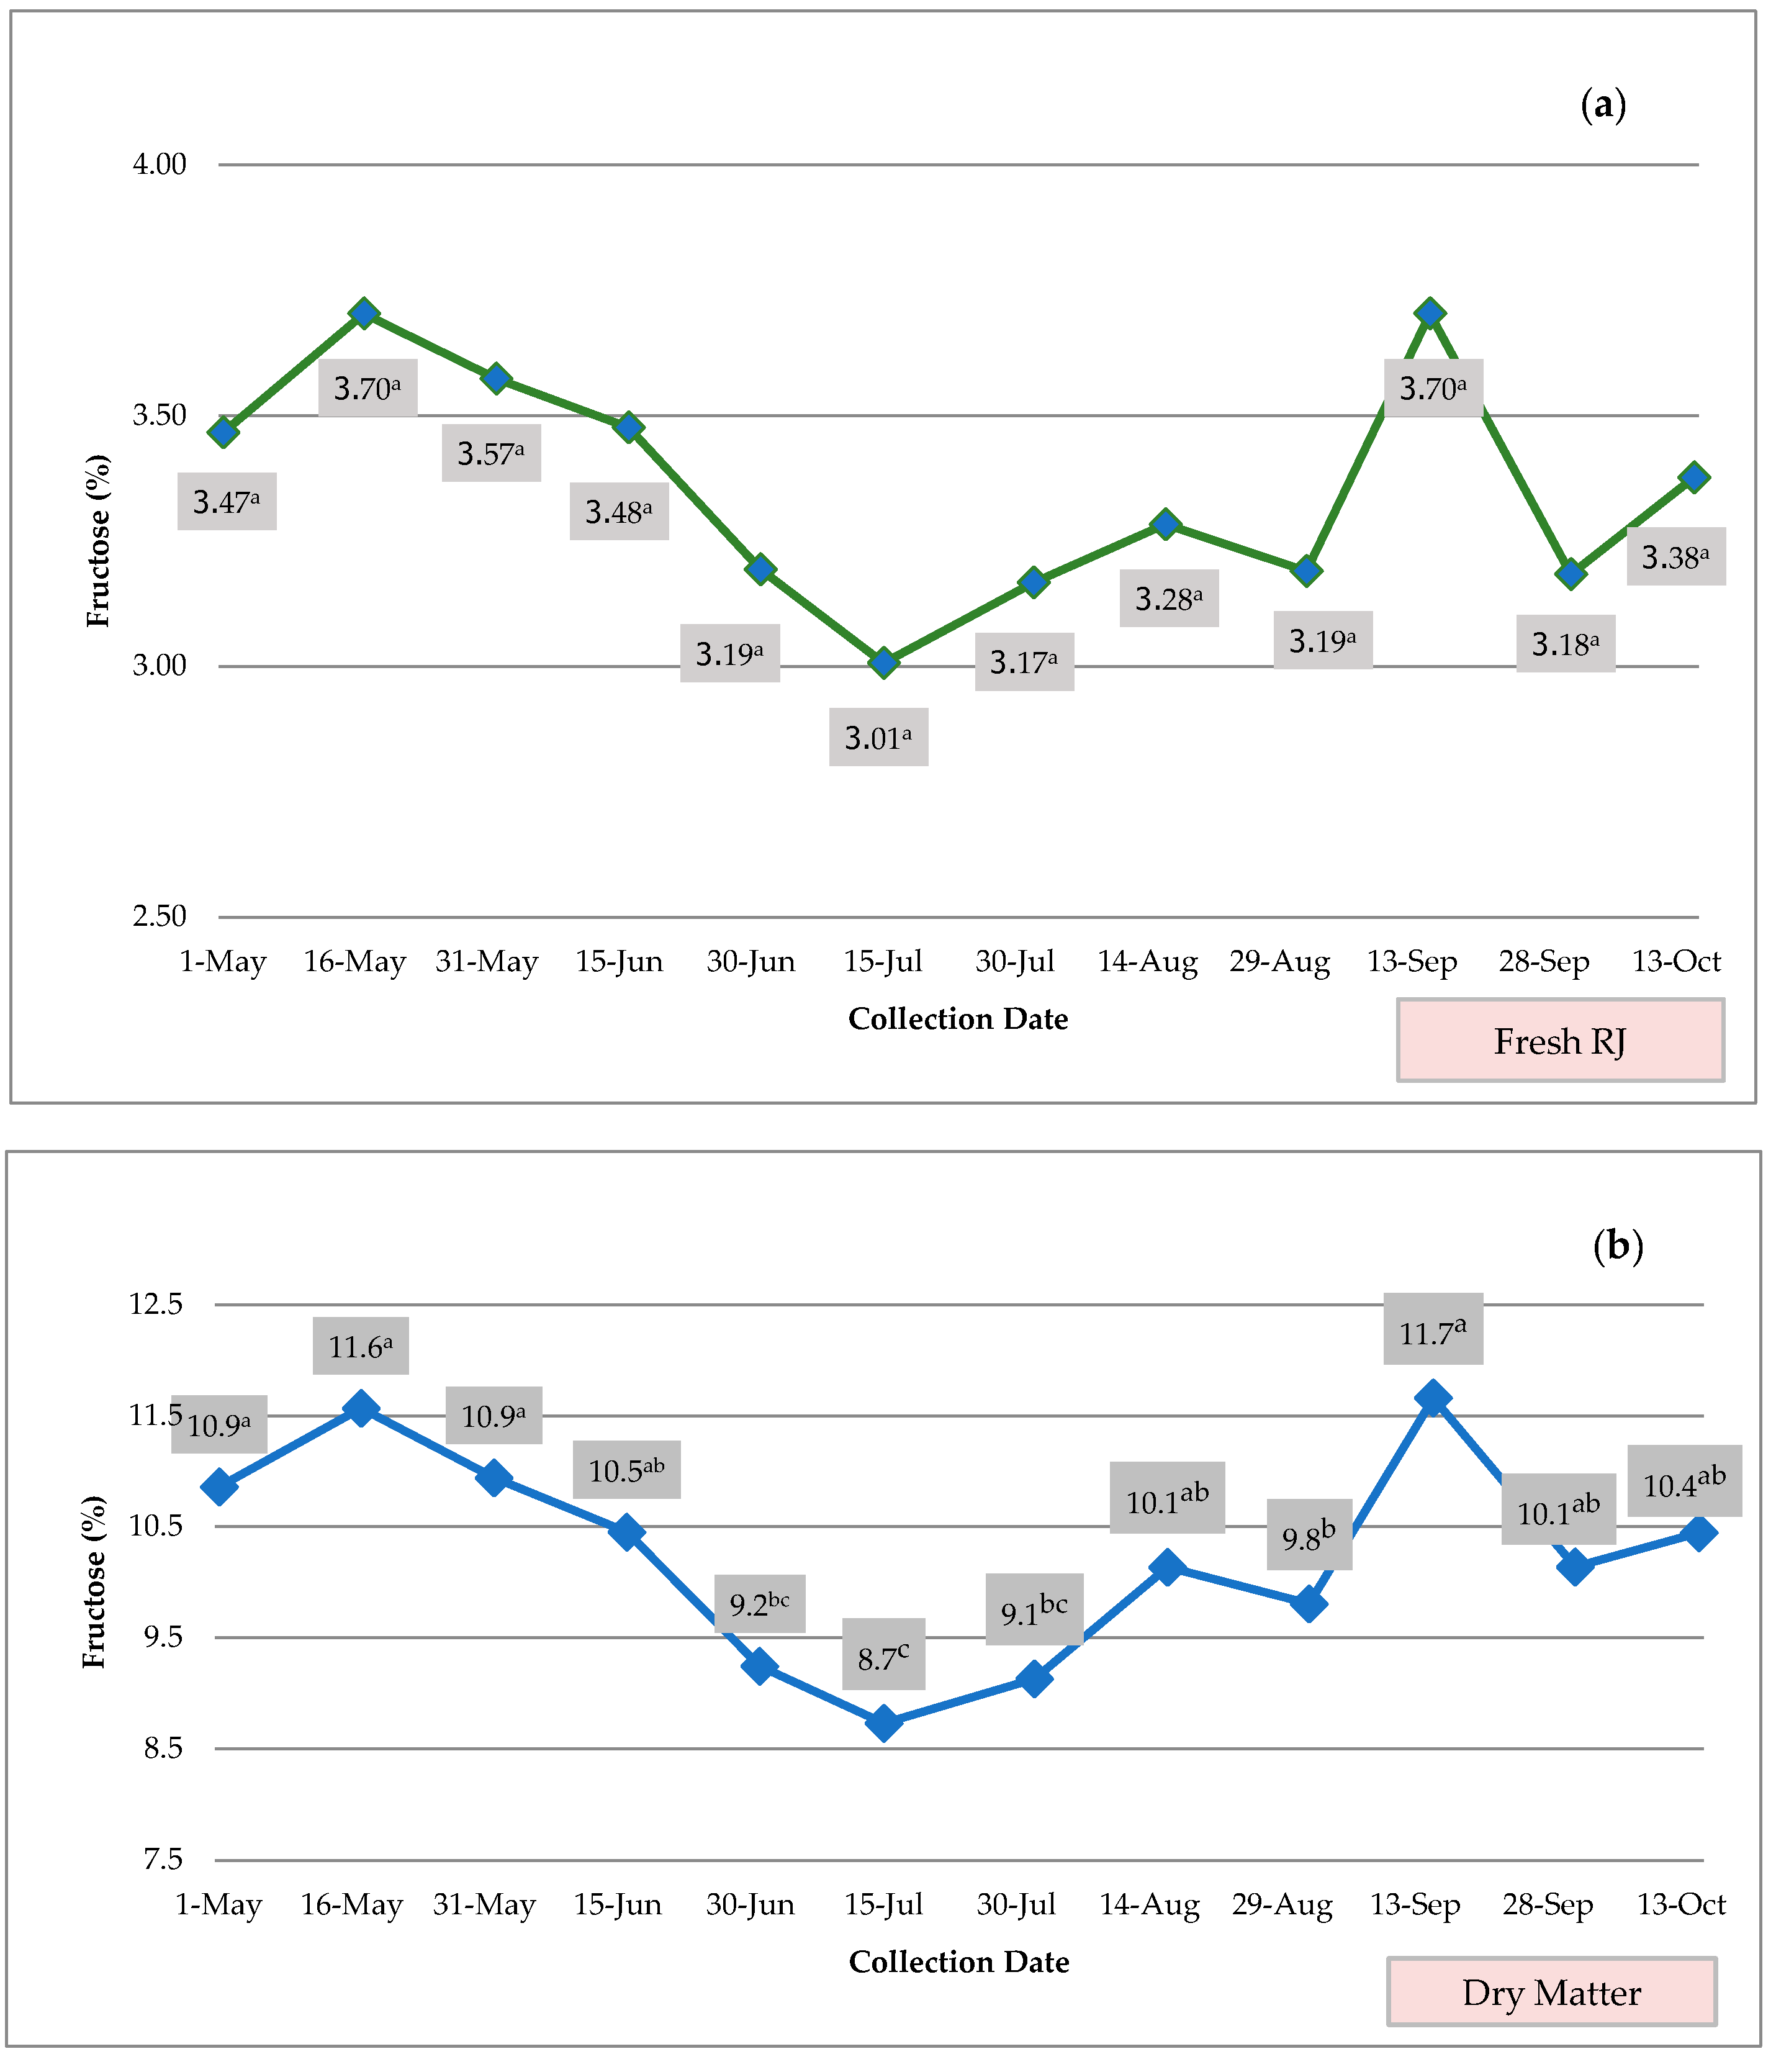
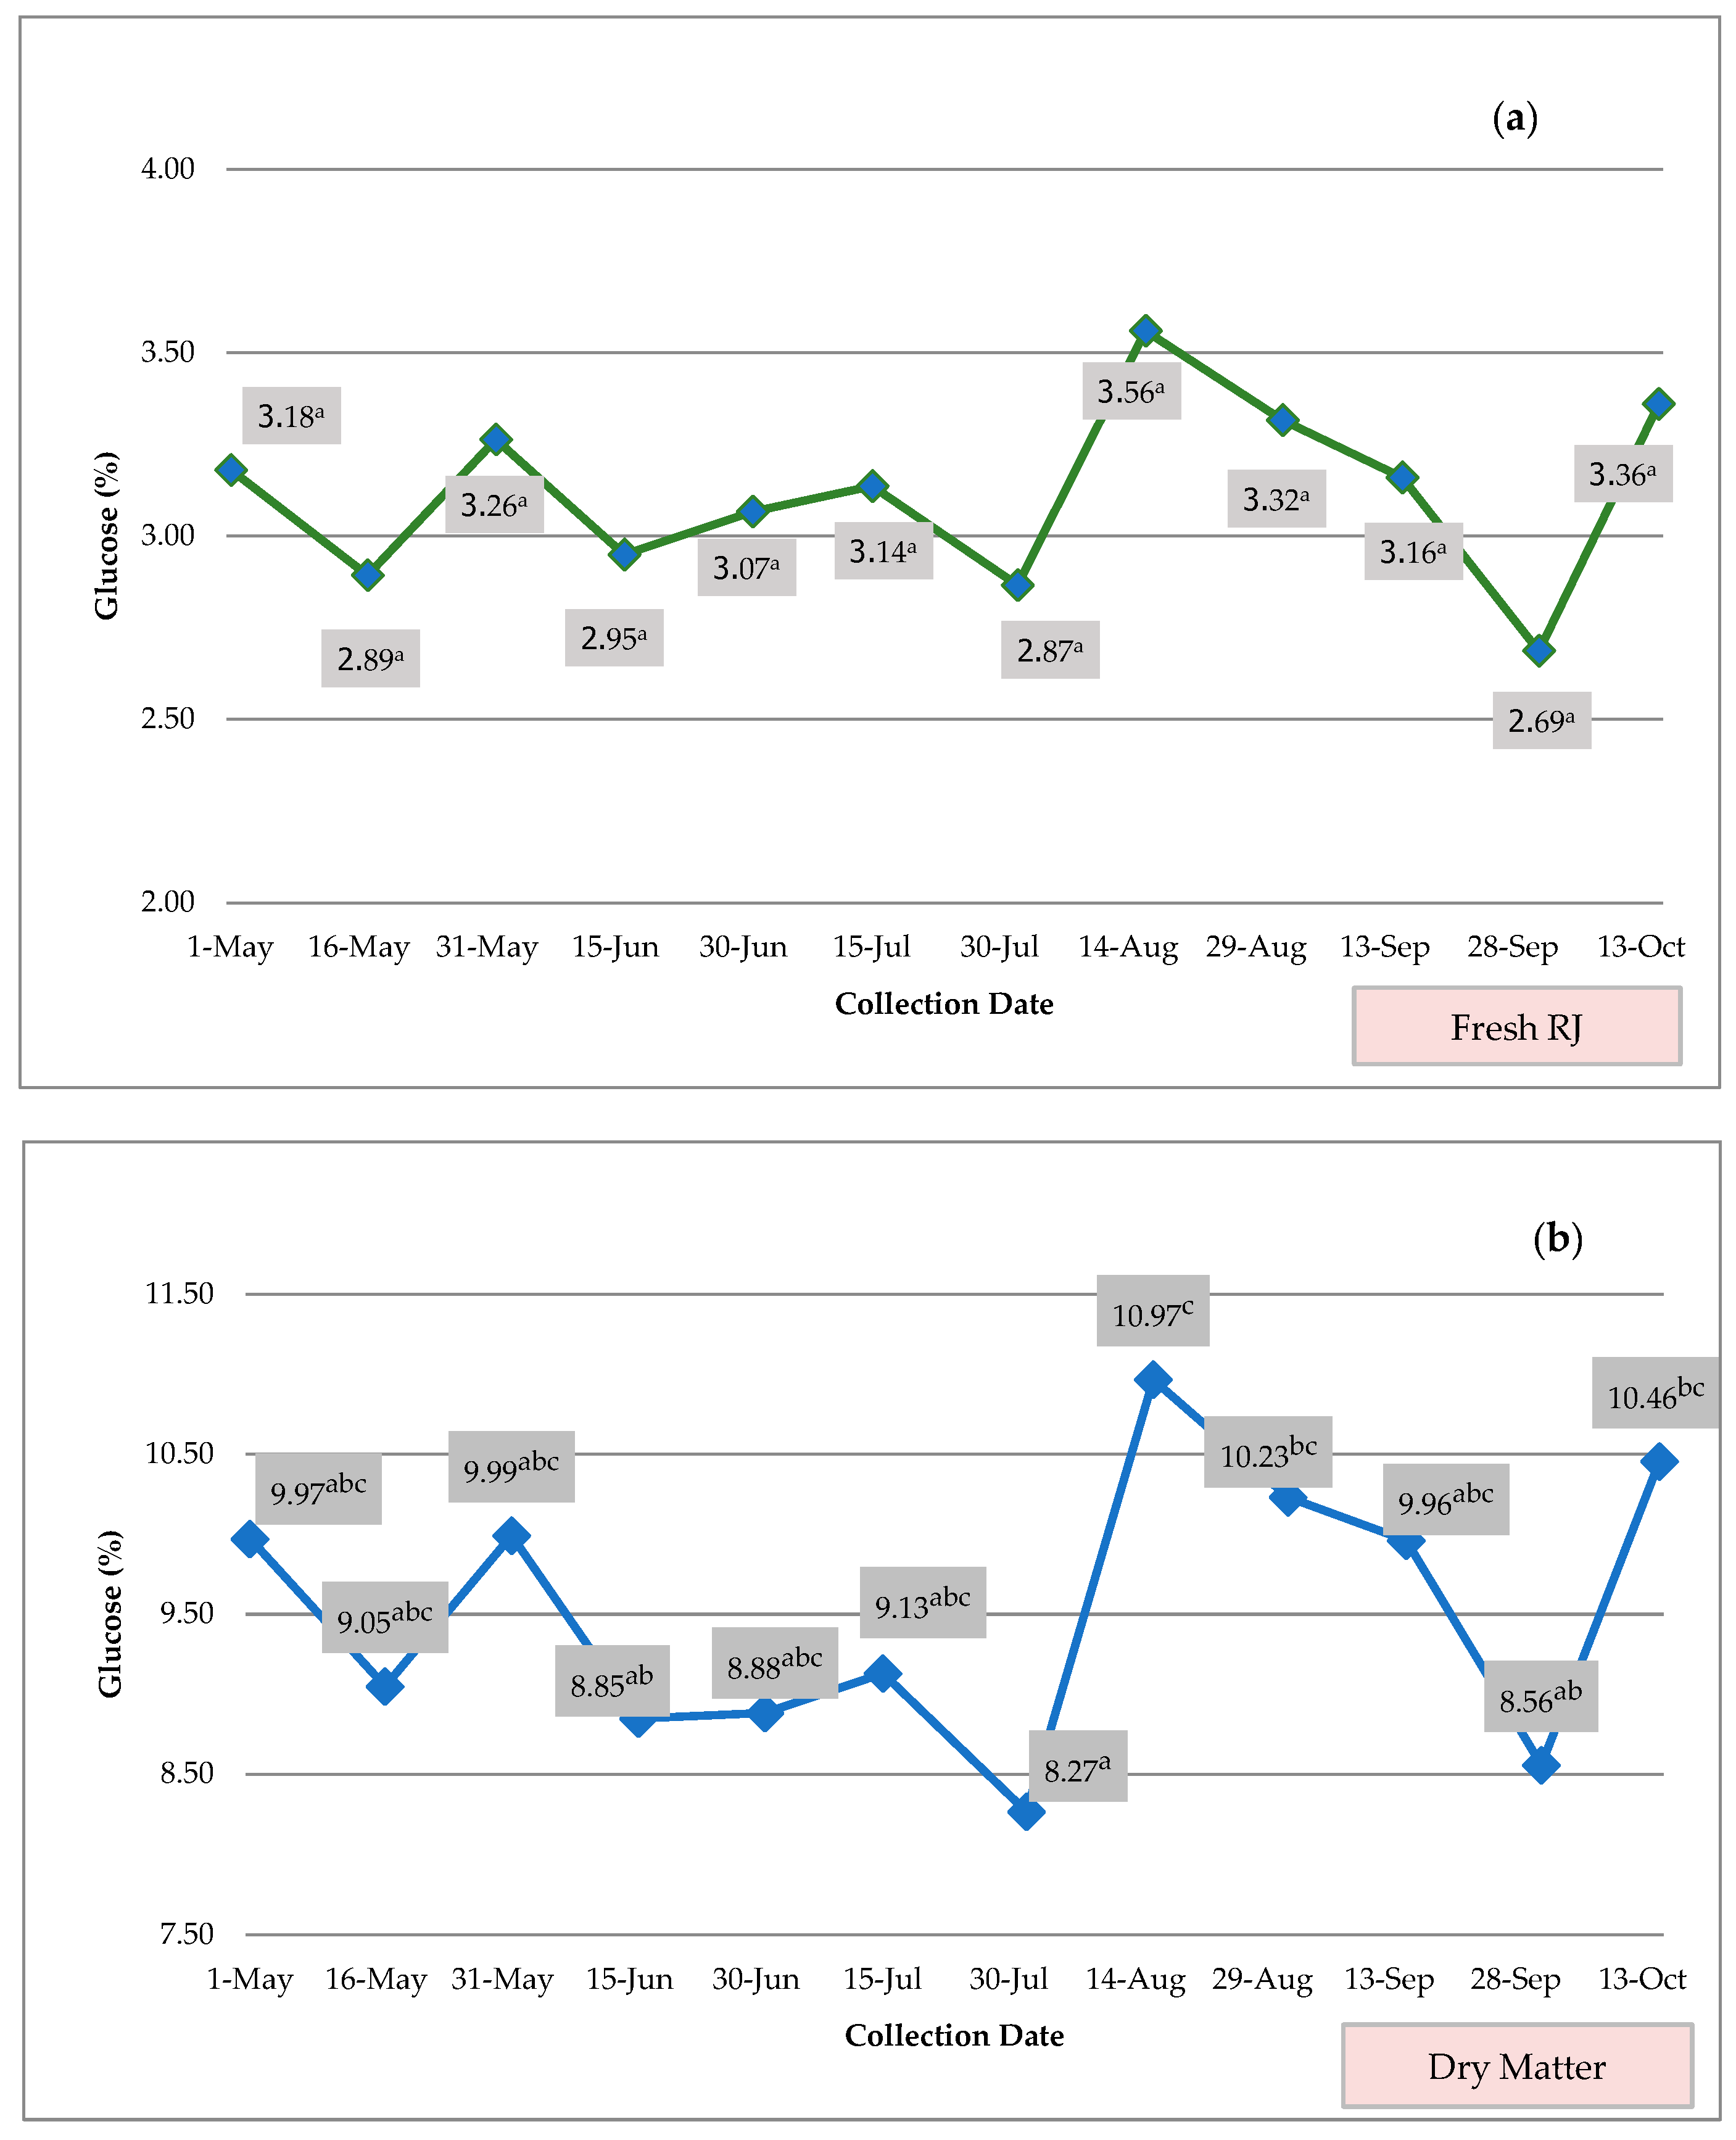
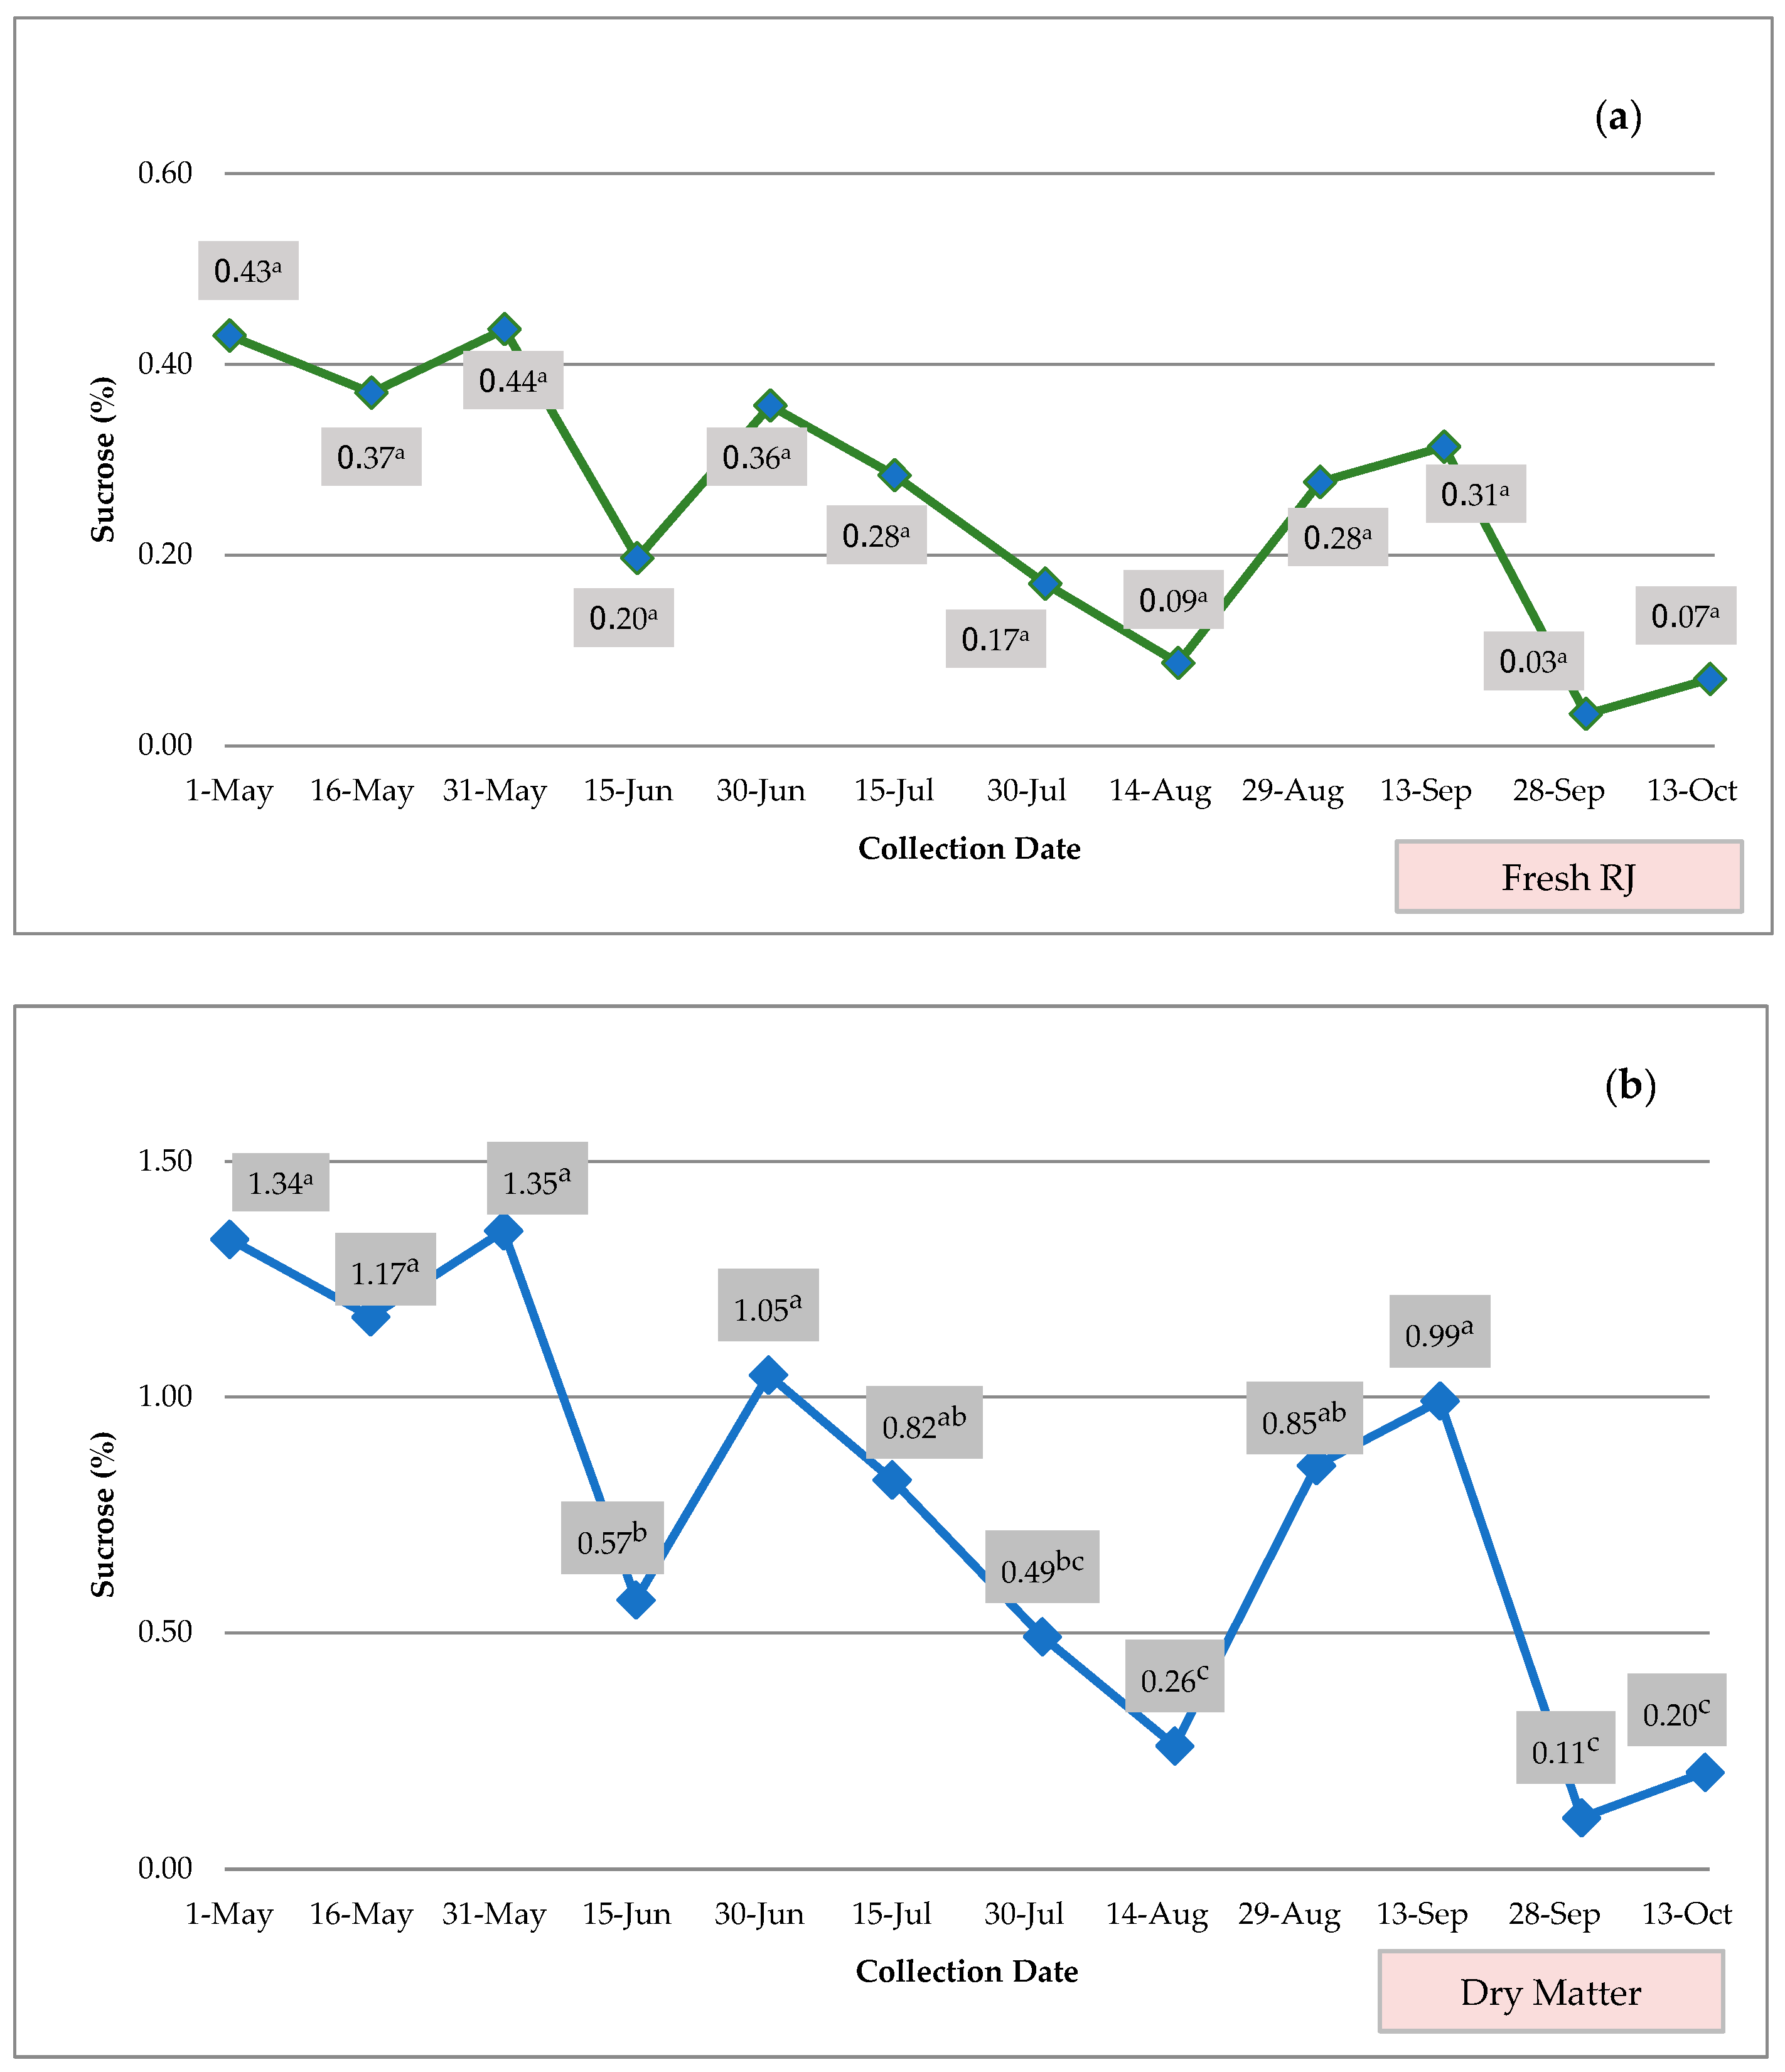
3.4. Determination of Sugars Concentration (%)

The research also focused on the analysis of the two main sugars, fructose and glucose, and on the disaccharide sucrose. The diagrams in Figure 3, Figure 4 and Figure 5 illustrate the average values of the examined sugars in both fresh RJ and its dry matter. Specifically, mean fructose values in fresh RJ ranged between 3.01% and 3.70% (Figure 5).
No significant changes were observed in the fructose content of RJ over time (p = 0.858, >a = 0.05). However, when the values were converted to dry matter, there seemed to be a slight but significant change over time (p = 0.041, <a = 0.05), with fructose decreasing during the summer months. The fructose levels align with the pattern of plant flowering throughout the year. The high fructose content in spring samples is likely due to the abundance of nectar-producing plants in bloom. During the summer, fructose levels are minimized as flowering decreases but then peak at the beginning of autumn. When plant secretion decreases, bees rely on honey reserves in hives to produce RJ.
Similar to fructose, the glucose levels of fresh RJ did not show any significant changes during the experiment (p = 0.229, >a = 0.05), unlike the glucose values of RJ dry matter, which displayed marginally significant fluctuations over time (p = 0.045, <a = 0.05). The lowest mean concentration was observed on the 29th of August (2.69%), while the highest was recorded on the 14th of August (3.56%) (Figure 6).
The glucose levels in RJ samples remained consistent during the spring months, decreased to a minimum in the summer, and then rose again in mid-August before gradually declining until the end of the study.
In terms of sucrose content, the levels varied at low concentrations (<0.98%) and showed seasonal fluctuations with no significant changes throughout the year (pmax = 0.721, >a = 0.05) (Figure 7).
The sucrose values found in the present study were similar to those found in RJ samples produced without feeding [9]. However, the highest mean concentration in the current experiment (0.99%) was notably lower compared with the 3.59% reported by other researchers who produced RJ without feeding [32]. On the other hand, the sucrose levels aligned more closely with the findings of Daniele and Casabianca [10], who observed a maximum sucrose value of 1.70% in unfed samples.
Liolios et al. [33] mentioned that certain plants, like Sisymbrium irio, in the study area may have two separate periods of flowering, providing a valuable source of nectar and pollen for bees. Specifically, for S. irio, the first flowering wave occurs during spring (April–June), and the second is observed from mid-August onward. The increase in fructose and glucose levels in the RJ samples of the present research from mid-August (14/8) to the 13th of September coincides with the flowering of this plant. On the other hand, the decrease in both sugars (fructose and glucose) in mid-September corresponds to the secretion of pine honeydew during that time [34], which contains lower concentrations of fructose and glucose compared with flower nectar [35,36]. It is possible that bees collected pine honeydew from the area and incorporated it into the final product during honey production. Meanwhile, the percentage of sucrose remained consistent in the RJ samples, indicating that bees did not have access to sucrose-rich food sources.

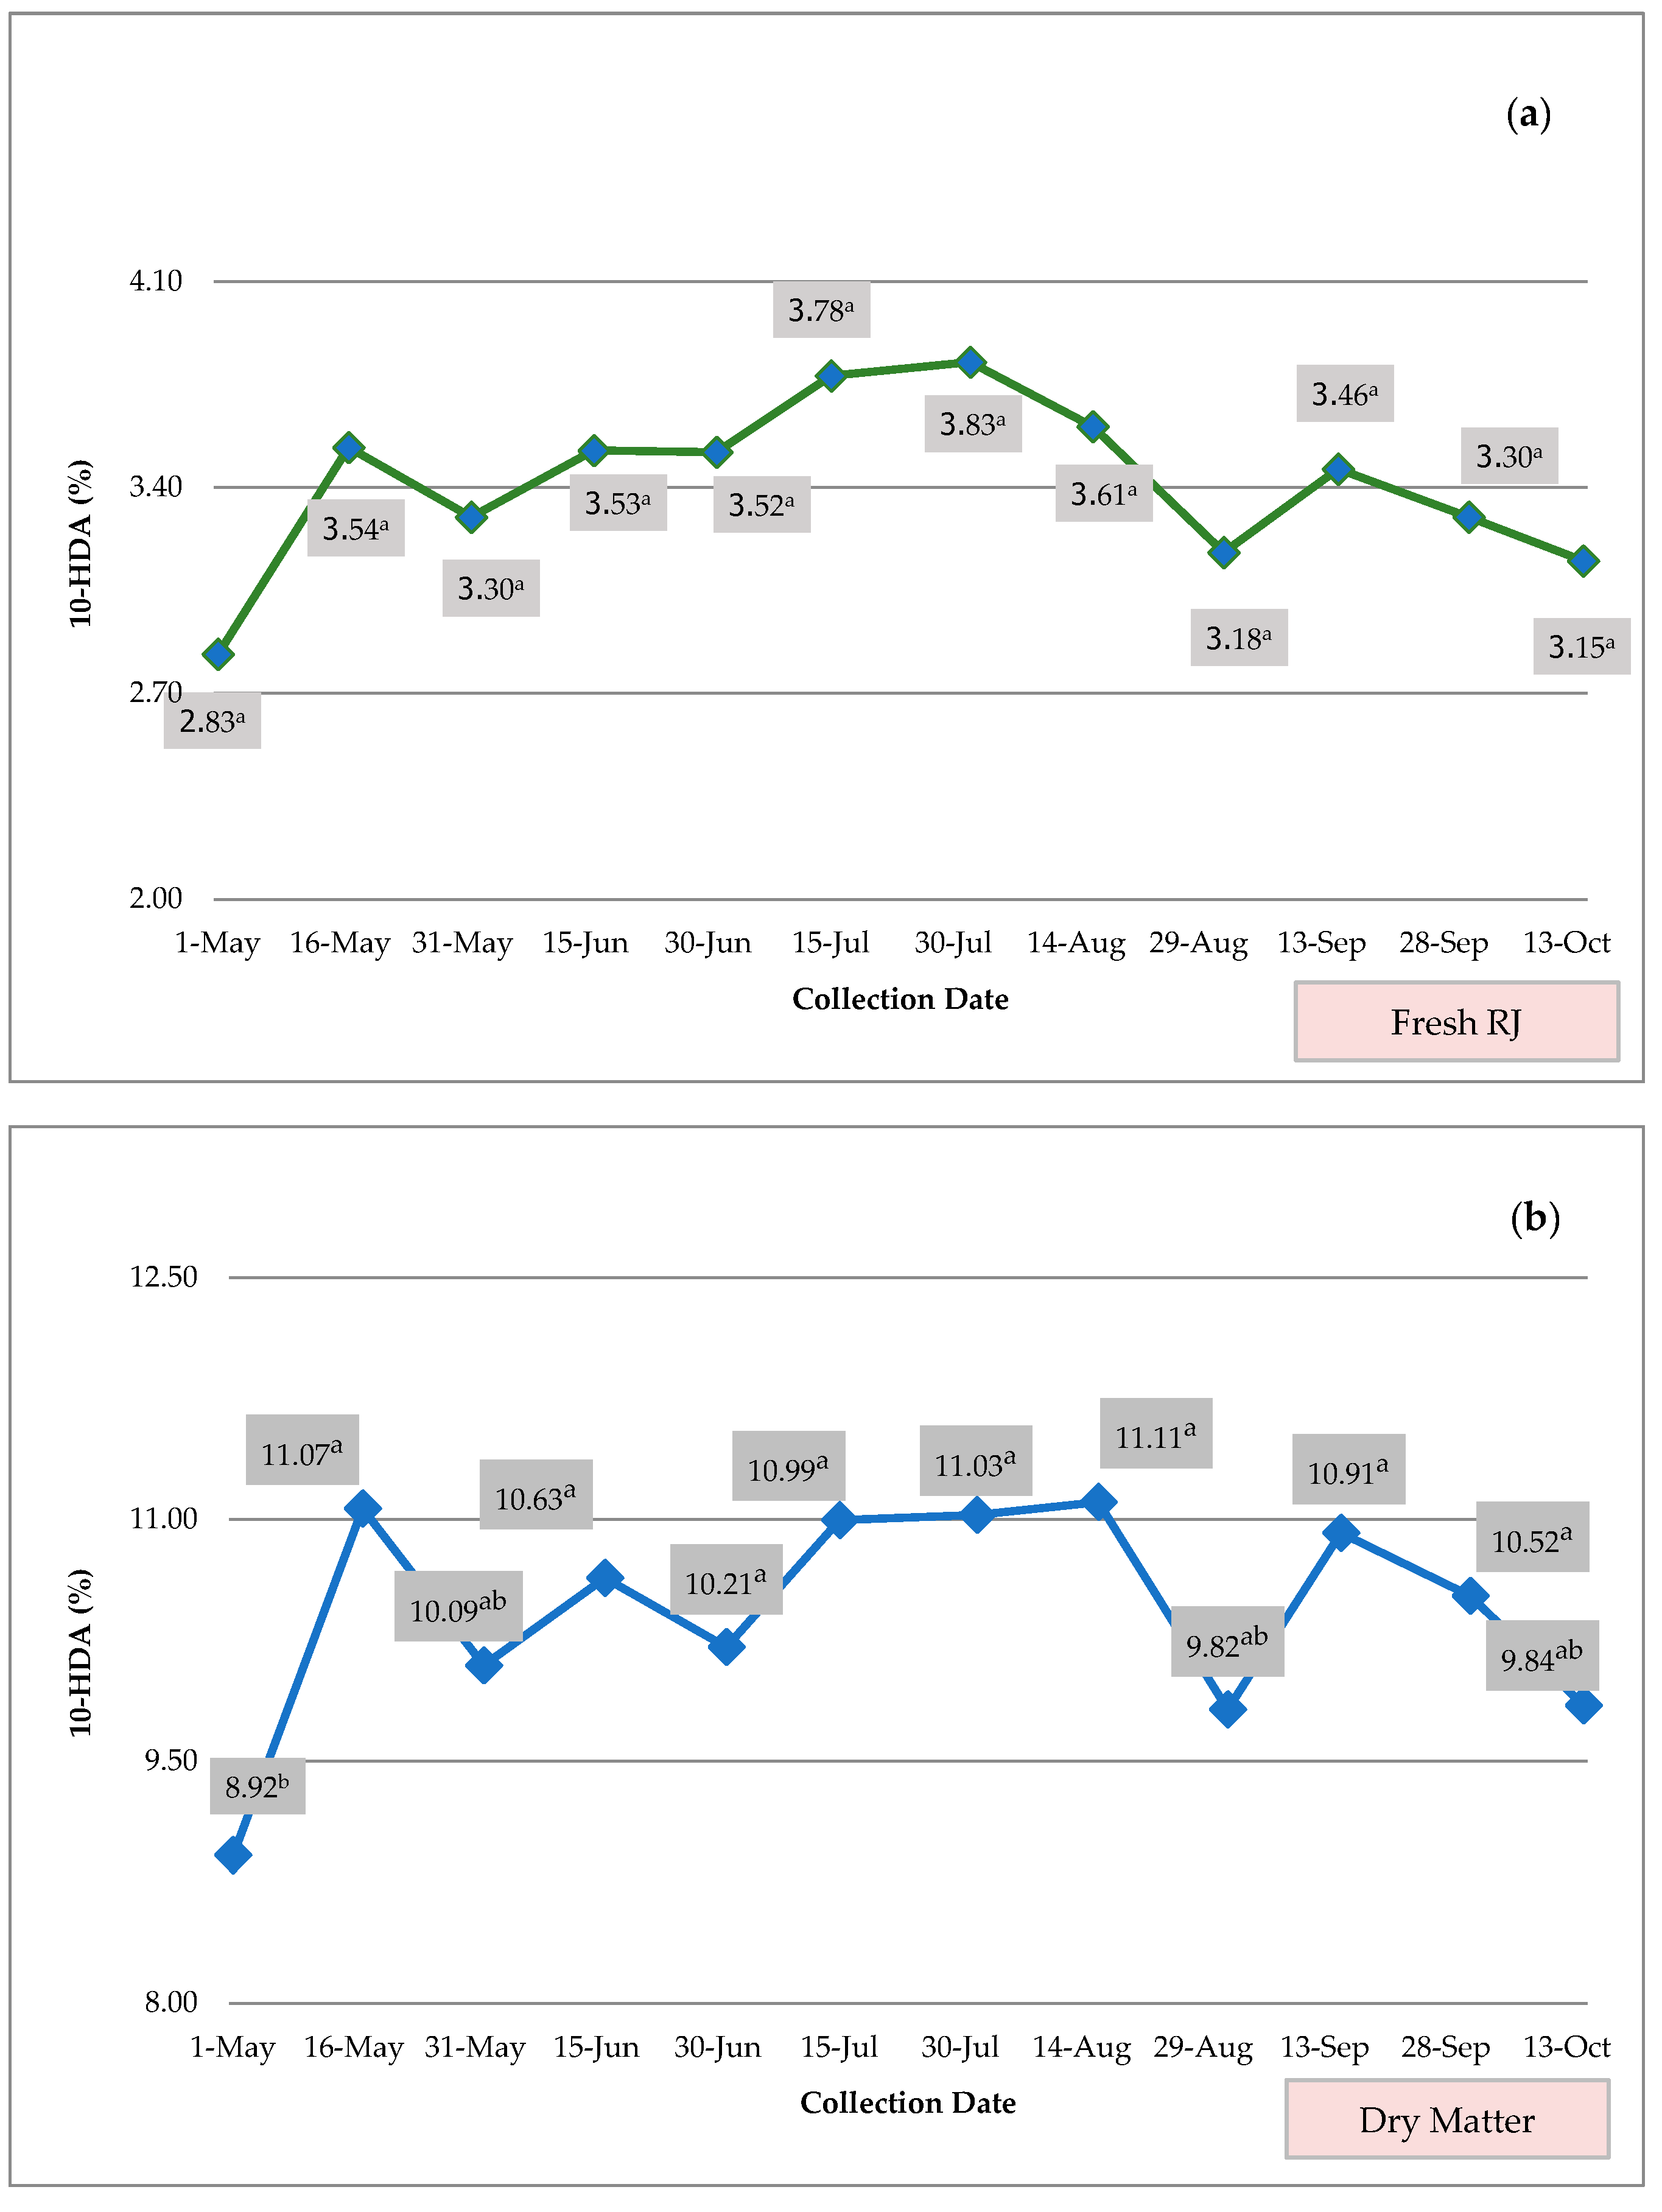
3.5. Determination of 10-HDA (%)

The final parameter examined in this study was the trend of the 10-HDA content in the samples throughout the beekeeping year. Figure 8 displays the average percentage values of 10-HDA in samples taken from three bee colonies on different dates.
Statistical analysis revealed no significant changes in the 10-HDA content of fresh RJ samples over time (pmax = 0.693, >a = 0.05). The lowest mean value was recorded on the 1st of May (2.83%), while the highest was on the 30th of July (3.83%). The results were relatively high compared with values reported in the previous literature [37,38], with only one source reporting a content of 3.8% [39]. Additionally, the minimum value obtained in this experiment (2.46%) was about two percentage points higher than the lowest value reported in the international literature [37] (0.3%).
The values of physical–chemical characteristics are presented in detail in Table 1.
According to Table 1, the physical–chemical characteristics mostly align with values found in the international literature. The average humidity in this study ranged from 65.9% to 68.6%, falling within the range reported in other works, which can go up to 73.0% [9,40]. The mean average protein content ranged from 11.6% to 13.5%, closely matching with values from other countries (12.0–15.0%) [7,9,40,41,42,43]. In contrast to moisture and protein content, the sugars in the royal jelly produced were lower compared with other works, with sucrose ranging from 0.0 to 0.4%. The higher prices reported in the international literature [9,10,40,44,45] may be attributed to different production methods or varying access to resources by the bees during production [20,46]. Lastly, the 10-HDA ranged in mean values from 2.8% to 3.8%, slightly higher than values found in other countries such as Turkey and France [5,9,40,42,47,48,49]. It is very important to know the method and the feeding conditions followed during production since, as shown from the findings of the present study, the available food sources (natural or supplementary feeding) can significantly affect the quality characteristics of the final product.

4. Conclusions

The current research findings suggest that the production and physicochemical properties of RJ undergo significant changes when food reserves are lacking in the hive. Throughout the year, the quantity and quality of RJ are at their highest levels in spring and lowest in summer, similar to bee pollen. The available resources play a crucial role in stimulating bees to produce RJ, while the quality of pollen has a significant impact on the physicochemical properties of the final product. Beekeepers are advised to avoid queen production during periods of limited flowering, as poor acceptance of queen cells and inadequate rearing can lead to difficulties in establishing a colony in the hive.

Author Contributions

Conceptualization, D.K. and C.T.; methodology, D.K. and C.T.; investigation, D.K., V.L. and F.P.; writing—original draft preparation, D.K. and M.-A.R.; writing—review and editing, C.T., D.K. and M.-A.R.; visualization, D.K. and M.-A.R.; supervision, C.T. All authors have read and agreed to the published version of the manuscript.

Funding

This research received no external funding.

Data Availability Statement

Data supporting the reported results are stored at the Laboratory of Apiculture-Sericulture, AUTH.

Conflicts of Interest

The authors declare no conflicts of interest.

References

  1. Hu, F.L.; Bíliková, K.; Casabianca, H.; Daniele, G.; Salmen Espindola, F.; Feng, M.; Guan, C.; Han, B.; Kraková, T.K.; Li, J.-K.; et al. Standard methods for Apis mellifera royal jelly research. J. Apic. Res. 2019, 58, 1–68. [Google Scholar] [CrossRef]
  2. Erem, C.; Deger, O.; Ovali, E.; Barlak, Y. The effects of royal jelly on autoimmunity in Graves’ disease. Endocrine 2006, 30, 175–183. [Google Scholar] [CrossRef] [PubMed]
  3. Ibrahim, A.A.E.-M. Immunomodulatory effects of royal jelly on aorta CD3, CD68 and eNOS expression in hypercholesterolaemic rats. J. Basic Appl. Zool. 2014, 67, 140–148. [Google Scholar] [CrossRef]
  4. Pa, Y.; Xu, J.; Chen, C.; Chen, F.; Jin, P.; Zhu, K.; Hu, C.W.; You, M.; Chen, M.; Hu, F. Royal jelly reduces cholesterol levels, ameliorates aβ pathology and enhances neuronal metabolic activities in a rabbit model of alzheimer’s disease. Front. Aging Neurosci. 2018, 10, 50. [Google Scholar] [CrossRef]
  5. Collazo, N.; Carpena, M.; Nuñez-Estevez, B.; Otero, P.; Simal-Gandara, J.; Prieto, M.A. Health Promoting Properties of Bee Royal Jelly: Food of the Queens. Nutrients 2021, 13, 543. [Google Scholar] [CrossRef] [PubMed]
  6. Bansal, S.; Singh, A.; Mangal, M.; Mangal, A.K.; Kumar, S. Food adulteration: Sources, health risks, and detection methods. Crit. Rev. Food Sci. Nutr. 2017, 57, 1174–1189. [Google Scholar] [CrossRef] [PubMed]
  7. Sabatini, A.G.; Marcazzan, G.L.; Caboni, M.F.; Bogdanov, S.; Almeida-Muradian, L.B. Quality and standardisation of Royal Jelly. J. ApiProd. ApiMed. Sci. 2009, 1, 16–21. [Google Scholar] [CrossRef]
  8. Chen, C.; Chen, S.Y. Changes in protein components and storage stability of Royal Jelly under various conditions. Food Chem. 1995, 54, 195–200. [Google Scholar] [CrossRef]
  9. Kanelis, D.; Tananaki, C.; Liolios, V.; Dimou, M.; Goras, G.; Rodopoulou, M.A.; Karazafiris, E.; Thrasyvoulou, A. A suggestion for royal jelly specifications. Arh. Hig. Rada Toksikol. 2015, 66, 275–284. [Google Scholar] [CrossRef] [PubMed]
  10. Daniele, G.; Casabianca, H. Sugar composition of French royal jelly for comparison with commercial and artificial sugar samples. Food Chem. 2012, 134, 1025–1029. [Google Scholar] [CrossRef]
  11. Pina, A.; Begou, O.; Kanelis, D.; Gika, H.; Kalogiannis, S.; Tananaki, C.; Theodoridis, G.; Zotou, A. Targeted profiling of hydrophilic constituents of royal jelly by hydrophilic interaction liquid chromatography-tandem mass spectrometry. J. Chromatogr. A 2018, 153, 53–63. [Google Scholar] [CrossRef] [PubMed]
  12. Virgiliou, C.; Kanelis, D.; Pina, A.; Gika, H.; Tananaki, C.; Zotou, A.; Theodoridis, G. A targeted approach for studying the effect of sugar bee feeding on the metabolic profile of Royal Jelly. J. Chromatogr. A 2020, 1616, 460783. [Google Scholar] [CrossRef]
  13. Dimou, M.; Tananaki, C.; Goras, G.; Kanelis, D.; Thrasyvoulou, A. The effect of pollen supplements on the determination of the geographical origin of royal jelly. J. Apic. Res. 2014, 53, 124–128. [Google Scholar] [CrossRef]
  14. Mazzei, P.; Piccolo, A.; Brescia, M.; Caprio, E. Assessment of geographical origin and production period of royal jelly by NMR metabolomics. Chem. Biol. Technol. Agric. 2020, 7, 24. [Google Scholar] [CrossRef]
  15. Yan, S.; Wang, X.; Sun, M.; Wang, W.; Wu, L.; Xue, X. Investigation of the lipidomic profile of royal jelly from different botanical origins using UHPLC-IM-Q-TOF-MS and GC-MS. LWT 2022, 169, 113894. [Google Scholar] [CrossRef]
  16. Bernués, A.; Olaizola, A.; Corcoran, K. Labelling information demanded by European consumers and relationships with purchasing motives, quality and safety of meat. Meat Sci. 2003, 65, 1095–1106. [Google Scholar] [CrossRef]
  17. Wang, Y.; Ma, L.; Zhang, W.; Cui, X.; Wang, H.; Xu, B. Comparison of the nutrient composition of royal jelly and worker jelly of honey bees (Apis mellifera). Apidologie 2016, 47, 48–56. [Google Scholar] [CrossRef]
  18. Rehman, N.U.; Anjum, S.I.; Qureshi, N.A.; Khan, M.H.; Albasher, G.; Kaleem, M.; Kamal, A. The effect of larval age, and wet and dry grafting, on the rearing of queen bees using the Doolittle grafting method. Entomol. Res. 2024, 54, e12700. [Google Scholar] [CrossRef]
  19. Taber, S.; Polle, H.K. Rearing and mating of queen and drone honey bees in winter. Am. Bee J. 1974, 114, 18–19. [Google Scholar]
  20. Wang, Y.; Ma, L.; Wang, H.; Liu, Z.; Chi, X.; Xu, B. Effects of sucrose feeding on the quality of royal jelly produced by honeybee Apis mellifera L. Insects 2023, 14, 742. [Google Scholar] [CrossRef]
  21. Kanelis, D.; Tananaki, C.; Liolios, V.; Rodopoulou, M.A.; Goras, G.; Argena, N.; Thrasyvoulou, A. Investigating the effect of supplementary feeding on carbohydrate composition and quantity of royal jelly. Open J. Appl. Sci. 2018, 8, 141–149. [Google Scholar] [CrossRef]
  22. Hussain, A.R.E.; Abied, M.K.; Abo Laban, G.F.; Badwy, A. Effect of Different Seasons on the Royal Jelly production Under Nasr City Conditions—Cairo-Egypt. Egypt. Acad. J. Biol. Sci. A Entomol. 2020, 13, 197–205. [Google Scholar] [CrossRef]
  23. Fahad Raza, M.; Anwar, M.; Husain, A.; Rizwan, M.; Li, Z.; Nie, H.; Hlaváč, P.; Ali, M.A.; Rady, A.; Su, S. Differential gene expression analysis following olfactory learning in honeybee (Apis mellifera L.). PLoS ONE 2022, 17, e0262441. [Google Scholar] [CrossRef]
  24. Portman, Z.M.; Orr, M.C.; Griswold, T. A review and updated classification of pollen gathering behavior in bees (Hymenoptera, Apoidea). J. Hymen. Res. 2019, 71, 171–208. [Google Scholar] [CrossRef]
  25. Stanley, R.G.; Linskens, H.F. Storage. In Pollen Biology, Biochemistry, Management, 1st ed.; Stanley, R.G., Linskens, H.F., Eds.; Springer: Berlin/Heidelberg, Germany, 1974; pp. 56–66. [Google Scholar]
  26. Yang, K.; Wu, D.; Ye, X.; Liu, D.; Chen, J.; Sun, P. Characterization of chemical composition of bee pollen in China. J. Agric. Food Chem. 2013, 61, 708–718. [Google Scholar] [CrossRef] [PubMed]
  27. Liolios, V.; Tananaki, C.; Dimou, M.; Kanelis, D.; Goras, G.; Karazafiris, E.; Thrasyvoulou, A. Ranking pollen from bee plants according to their protein contribution to honey bees. J. Apic. Res. 2015, 54, 582–592. [Google Scholar] [CrossRef]
  28. Cao, L.F.; Zheng, H.Q.; Pirk, C.W.; Hu, F.L.; Xu, Z.W. High Royal Jelly-Producing Honeybees (Apis mellifera ligustica) (Hymenoptera: Apidae) in China. J. Econ. Entomol. 2016, 109, 510–514. [Google Scholar] [CrossRef] [PubMed]
  29. Popescu, O.; Mǎrghitaş, L.A.; Dezmirean, D.S. A study about physicochemical composition of fresh and lyophilized royal jelly. Zooteh. Si Biotehnol. 2008, 41, 328–332. [Google Scholar]
  30. Nabas, Z.; Haddadin, M.S.; Haddadin, J.; Nazer, I.K. Chemical Composition of Royal Jelly and effects of synbiotic with two different locally isolated probiotic strains on antioxidant activities. Polish J. Food Nutr. Sci. 2014, 64, 171–180. [Google Scholar] [CrossRef]
  31. Zheng, H.Q.; Hu, F.L.; Dietemann, V. Changes in composition of royal jelly harvested at different times: Consequences for quality standards. Apidologie 2011, 42, 39–47. [Google Scholar] [CrossRef]
  32. Balkanska, R.; Zhelyazkova, I.; Ignatova, M.; Kashamov, B. Effect of supplementary honey and artificial sugar feeding of bees on the composition of royal jelly. Agric. Sci. Technol. 2013, 5, 335–338. [Google Scholar]
  33. Liolios, V.; Tananaki, C.; Dimou, M.; Kanelis, D.; Rodopoulou, M.A.; Thrasyvoulou, A. Exploring the sugar profile of unifloral bee pollen using high performance liquid chromatography. J. Food Nutr. Res. 2018, 57, 341–350. [Google Scholar]
  34. Bacandritsos, N.; Saitanis, C.; Papanastasiou, I. Morphology and life cycle of Marchalina hellenica (Gennadius) (Hemiptera: Margarodidae) on pine (Parnis Mt.) and fir (Helmos Mt.) forests of Greece. Ann. Soc. Entomol. 2004, 40, 169–176. [Google Scholar] [CrossRef]
  35. Thrasyvoulou, A.; Tananaki, C.; Goras, G.; Karazafiris, E.; Dimou, M.; Liolios, V.; Kanelis, D.; Gounari, S. Legislation of honey criteria and standards. J. Apic. Res. 2018, 57, 88–96. [Google Scholar] [CrossRef]
  36. Tsavea, E.; Vardaka, F.-P.; Savvidaki, E.; Kellil, A.; Kanelis, D.; Bucekova, M.; Grigorakis, S.; Godocikova, J.; Gotsiou, P.; Dimou, M.; et al. Physicochemical characterization and biological properties of pine honey produced across Greece. Foods 2022, 11, 943. [Google Scholar] [CrossRef]
  37. Genç, M.; Aslan, A. Determination of trans-10-hydroxy-2-decenoic acid content in pure royal jelly and royal jelly products by column liquid chromatography. J. Chromatogr. A 1999, 839, 265–268. [Google Scholar] [CrossRef] [PubMed]
  38. Ferioli, F.; Marcazzan, G.L.; Caboni, M.F. Determination of (E)-10-hydroxy-2-decenoic acid content in pure royal jelly: A comparison between a new CZE method and HPLC. J. Sep. Sci. 2007, 30, 1061–1069. [Google Scholar] [CrossRef]
  39. Mărghitaş, L.A.; Morar, O.; Bobiş, O.; Bonta, V.; Dezmirean, D.S. Comparative evaluation of chemical composition for three categories of royal jelly. J. Agroalim. Proc. Technol. 2010, 16, 399–401. [Google Scholar]
  40. Kolayli, S.; Sahin, H.; Can, Z.; Yildiz, O.; Malkoc, M.; Asadov, A. A Member of Complementary Medicinal Food: Anatolian Royal Jellies, Their Chemical Compositions, and Antioxidant Properties. J. Evid. Based Complement. Altern. Med. 2016, 21, NP43–NP48. [Google Scholar] [CrossRef]
  41. Ramadan, M.F.; Al-Ghamdi, A. Bioactive compounds and health-promoting properties of royal jelly: A review. J. Funct. Foods. 2012, 4, 39–52. [Google Scholar] [CrossRef]
  42. Wytrychowski, M.; Chenavas, S.; Daniele, G.I.; Casabianca, H.; Batteau, M.; Guibert, S.; Brion, B. Physicochemical characterisation of French royal jelly: Comparison with commercial royal jellies and royal jellies produced through artificial bee-feeding. J. Food Comp. Anal. 2013, 29, 126–133. [Google Scholar] [CrossRef]
  43. Kamyab, S.; Gharachorloo, M.; Honarvar, M.; Ghavami, M. Quantitative analysis of bioactive compounds present in Iranian royal jelly. J. Apic. Res. 2020, 59, 42–52. [Google Scholar] [CrossRef]
  44. Sesta, G. Determination of sugars in royal jelly by HPLC. Apidologie 2006, 37, 84–90. [Google Scholar] [CrossRef]
  45. Wang Wang, X.L.; Lin, H.; Ren, S.Y.; Ding, T.; Wang, Y.; Liu, Y.; Zhang, P.X.; Deng, X.; Yi, X.H.; Han, F. Determination of the 6 kinds of sugars content in royal jelly by high performance liquid chromatograph. J. Food Saf. Qual. 2021, 12, 4474–4479. [Google Scholar]
  46. Karlidag, S.; Koseman, A.; Akyol, A.; Saatcioglu, G.; Seker, I.; Uyumlu, A.B.; Yilmaztekin, M.; Erdogan, S. The effect of different industrial sugars on royal jelly production. J. Hell. Vet. Med. Soc. 2022, 73, 4989–4996. [Google Scholar] [CrossRef]
  47. Kim, J.; Lee, J. Quantitative analysis of trans-10-hydroxy-2-decenoic acid in rojal jelly products purshased in USA by high performance liqued chromatography. J. Apic. Sci. 2010, 54, 77–85. [Google Scholar]
  48. Yang, X.; Li, Y.; Wang, L.; Liqunm, L.; Guo, L.; Yang, M.; Huang, F.; Zhao, H. Determination of 10-HDA in royal jelly by ATR-FTMIR and NIR spectral combining with data fusion strategy. Optik 2020, 203, 164052. [Google Scholar] [CrossRef]
  49. Keskin, M.; Ozkok, A.; Karahalil, F.Y.; Kolayli, S. What should be the amount of 10-Hydroxi-2-Decanoic Acid (10-HDA) in royal jelly? Mediterr. Agric. Sci. 2020, 33, 347–350. [Google Scholar] [CrossRef]
Figure 1. Average production of royal jelly (g) and acceptance rate of queen cells (%) in three bee colonies for each grafting on different dates from the beginning of May to mid-October. Note: Different letters in each group show statistically significant differences according to Duncan’s multiple range test, a = 0.05.
Resources 13 00055 g001
Figure 2. Average moisture content (%) of royal jelly produced in different time periods on different dates from the beginning of May to mid-October. Note: Different letters in each group show statistically significant differences according to Duncan’s multiple range test, a = 0.05.
Resources 13 00055 g002
Figure 3. Average daily relative humidity (%) and temperature (°C) throughout the duration of the experiment on different dates from the beginning of May to mid-October.
Resources 13 00055 g003
Figure 4. Average values of protein content (%) in fresh (a) royal jelly samples and dry matter (b) produced in different time periods on different dates from the beginning of May to mid-October. Note: Different letters in each group show statistically significant differences according to Duncan’s multiple range test, a = 0.05.
Resources 13 00055 g004
Figure 5. Average fructose content (%) in fresh (a) royal jelly samples and dry matter (b) produced in different time periods on different dates from the beginning of May to mid-October. Note: Different letters in each group show statistically significant differences according to Duncan’s multiple range test, a = 0.05.
Resources 13 00055 g005
Figure 6. Average glucose content (%) in fresh (a) royal jelly samples and dry matter (b) produced in different time periods on different dates from the beginning of May to mid-October. Note: Different letters in each group show statistically significant differences according to Duncan’s multiple range test, a = 0.05.
Resources 13 00055 g006
Figure 7. Average sucrose content (%) in fresh (a) royal jelly samples and dry matter (b) produced in different time periods on different dates from the beginning of May to mid-October. Note: Different letters in each group show statistically significant differences according to Duncan’s multiple range test, a = 0.05.
Resources 13 00055 g007
Figure 8. Average 10-HDA content (%) in fresh (a) royal jelly samples and dry matter (b) produced in different time periods on different dates from the beginning of May to mid-October. Note: Different letters in each group show statistically significant differences according to Duncan’s multiple range test, a = 0.05.
Resources 13 00055 g008
Table 1. Average values (±sd) of each characteristic on fresh royal jelly and on its dry matter.
Fresh Royal Jelly
Collection DateMoisture
(%)
Protein
Content (%)
Fructose (%)Glucose (%)Sucrose (%)10-HDA (%)
1-May68.1 ± 0.711.9 ± 0.43.5 ± 1.23.2 ± 0.90.4 ± 1.32.8 ± 1.7
17-May68.0 ± 0.612.7 ± 3.03.7 ± 1.12.9 ± 0.90.4 ± 1.73.5 ± 1.2
1-June67.3 ± 1.012.7 ± 1.23.6 ± 1.63.3 ± 1.60.4 ± 0.23.3 ± 1.4
16-June67.7 ± 0.612.4 ± 2.23.5 ± 0.73.0 ± 0.90.2 ± 0.83.5 ± 1.8
1-July65.9 ± 0.813.3 ± 1.33.2 ± 1.73.1 ± 1.20.4 ± 0.83.5 ± 0.6
15-July66.3 ± 1.113.4 ± 1.03.0 ± 1.93.1 ± 0.40.3 ± 0.53.8 ± 0.4
1-August66.7 ± 0.813.5 ± 1.63.2 ± 2.52.9 ± 1.60.2 ± 0.33.8 ± 0.2
16-August67.7 ± 0.813.1 ± 1.73.3 ± 1.33.6 ± 1.20.1 ± 0.43.6 ± 0.1
1-September67.9 ± 0.912.6 ± 1.53.2 ± 1.23.3 ± 1.10.3 ± 0.53.2 ± 1.3
15-September68.2 ± 0.712.2 ± 2.63.7 ± 1.03.2 ± 1.00.3 ± 0.53.5 ± 1.6
1-October68.6 ± 0.612.9 ± 1.63.2 ± 0.82.7 ± 0.70.0 ± 0.23.3 ± 0.6
15-October67.8 ± 2.211.6 ± 1.13.4 ± 2.23.4 ± 0.70.1 ± 0.33.2 ± 2.6
Dry Matter of Royal Jelly
Collection DateMoisture
(%)
Protein
Content (%)
Fructose (%)Glucose (%)Sucrose (%)10-HDA (%)
1-May-37.5 ± 0.210.9 ± 0.410.0 ± 0.31.3 ± 0.48.9 ± 0.5
17-May-39.6 ± 0.811.6 ± 0.49.0 ± 0.31.2 ± 0.511.1 ± 0.4
1-June-38.7 ± 0.610.9 ± 0.510.0 ± 0.51.4 ± 0.410.1 ± 0.5
16-June-37.2 ± 0.310.5 ± 0.18.8 ± 0.30.6 ± 0.310.6 ± 0.5
1-July-38.7 ± 0.29.2 ± 0.68.9 ± 0.51.0 ± 0.310.2 ± 0.3
15-July-39.1 ± 0.38.7 ± 0.79.1 ± 0.10.8 ± 0.211.0 ± 0.2
1-August-39.0 ± 0.69.1 ± 0.98.3 ± 0.50.5 ± 0.211.0 ± 0.1
16-August-40.3 ± 0.610.1 ± 0.311.0 ± 0.40.3 ± 0.111.1 ± 0.1
1-September-38.7 ± 0.29.8 ± 0.510.2 ± 0.30.9 ± 0.39.8 ± 0.3
15-September-38.5 ± 0.611.7 ± 0.310.0 ± 0.31.0 ± 0.310.9 ± 0.5
1-October-41.0 ± 0.710.1 ± 0.38.6 ± 0.30.1 ± 0.010. 5 ± 0.2
15-October-36.2 ± 0.510.4 ± 0.810.5 ± 0.20.2 ± 0.19.8 ± 0.7
Disclaimer/Publisher’s Note: The statements, opinions and data contained in all publications are solely those of the individual author(s) and contributor(s) and not of MDPI and/or the editor(s). MDPI and/or the editor(s) disclaim responsibility for any injury to people or property resulting from any ideas, methods, instructions or products referred to in the content.

