Article

Hg Pollution in Groundwater of Andean Region of Ecuador and Human Health Risk Assessment

by
Irene Passarelli
1,*,
Demmy Mora-Silva
2,
Mirian Jimenez-Gutierrez
3,
Santiago Logroño-Naranjo
3,
Damaris Hernández-Allauca
4,
Rogelio Ureta Valdez
5,
Victor Gabriel Avalos Peñafiel
3,
Luis Patricio Tierra Pérez
6,
Marcelo Sanchez-Salazar
3,
María Gabriela Tobar Ruiz
3,
Katherin Carrera-Silva
3,
Salvatore Straface
1 and
Carlos Mestanza-Ramón
7,*
1
Department of Environmental Engineering, University of Calabria, 87036 Rende, Italy
2
Departamento de Ciencias de la Tierra, Facultad de Ciencias del Mar y Ambientales, Universidad de Cádiz, 11510 Puerto Real, Spain
3
Green Amazon, Research Center, Nueva Loja 210150, Ecuador
4
Research Group Sustainability, Escuela Superior Politécnica de Chimborazo, Facultad de Recursos Naturales, Riobamba 060104, Ecuador
5
Research Group GIRMI, Escuela Superior Politécnica de Chimborazo, Sede Morona Santiago, Macas 140101, Ecuador
6
Grupo de Investigación Innovación y Tecnología Morona Santiago (IITMS), Escuela Superior Politécnica de Chimborazo, Sede Morona Santiago, Macas 140101, Ecuador
7
Research Group YASUNI-SDC, Escuela Superior Politécnica de Chimborazo, Sede Orellana, El Coca 220001, Ecuador
*
Authors to whom correspondence should be addressed.
Resources 2024, 13(6), 84; https://doi.org/10.3390/resources13060084
Submission received: 13 March 2024 / Revised: 16 May 2024 / Accepted: 13 June 2024 / Published: 19 June 2024
(This article belongs to the Special Issue Mine Ecological Restoration)

Abstract

:
In Ecuador, illegal gold mining has led to significant environmental impacts, with the release of harmful elements such as mercury (Hg) into the environment. Mercury, due to its physical–chemical characteristics and the transport elements involved between different environmental matrices, can easily percolate through the soil and reach groundwater. The purpose of this study was to evaluate the mercury concentration levels in the Andean region in order to perform a human health risk assessment. For this purpose, 175 water samples were analyzed, of which 9.71% exceeded the maximum permissible limit (MPL) established for drinking water in accordance with Ecuadorian regulations. The risk analysis was conducted by applying two approaches: deterministic and probabilistic. The deterministic approach involves a specific analysis based on the calculation of the risk quotient (HQ) and risk index (HI) for both receptors (adults and children) and scenarios (residential and recreational) considered; the probabilistic approach is based on the use of stochastic simulation techniques. The results obtained from the two approaches show a discrepancy, with the deterministic analysis providing more conservative results; however, they coincide in showing higher risk for the child population; decision-makers could use these results to identify areas to be monitored and plan more detailed investigation plans.

1. Introduction

Mining is the main source of precious metals and minerals worldwide [1]. Currently, the world market is experiencing exponential growth, so the quantities extracted have increased exponentially [2]. In particular, gold (Au) is one of the metals most in demand in global trade and is, therefore, the most exploited metal in mining production on a global scale [3]. Gold mining can be conducted at multiple scales, but ASGM is widespread in developing countries. In fact, many South American countries are significant producers and exporters of gold in the world. Among them are Colombia, Peru, Chile, Brazil, and Argentina. In recent years, Ecuador has also become competitive in this sector as a result of a strategy to diversify its production output [4,5]. In 2018, gold (Au) production in Ecuador reached 11.5 tons, placing it in tenth place for production among South American countries [6].
The central problem with ASGM is that it is often carried out outside the existing regulations and applies unsafe techniques that involve the use of Hg in Au recovery processes [7], despite such techniques being banned in 2010 [8]. The extensive use of Hg for the extraction of precious metals can be traced to the ease with which it amalgamates with them; in particular, in Au mining processes, Hg allows its separation from other heavy minerals: in Au mining, Hg is spread on its surface, forming a substrate that is removed at a later stage, allowing Au of high purity to be obtained via distillation. In terms of its general properties, Hg is classified in the category of transition metals, is a water-insoluble heavy metal, is the only one known to date that occurs in a liquid state under standard conditions, and tends to bioaccumulate, and is therefore significantly persistent. The World Health Organization (WHO) and US EPA [9], such as other states and federal agencies, have defined Hg as one of the most harmful metals for human health and the environment; although it is an element that occurs naturally in the Earth’s crust, it is estimated that between 50 and 75% of Hg found in the environment comes from anthropogenic sources [10,11,12]. Hg exists in three different forms: elemental Hg, organic Hg compounds, and inorganic Hg compounds; each form is toxic and can result in different types of human health effects. Although it often enters the environment in inorganic form from anthropogenic sources, natural processes can occur that can convert it into an organic form, among which methylmercury and dimethylmercury are considered the most dangerous to human health [13].
According to the methodology of risk analysis, the possible migration routes by which a contaminant may reach receptors are influenced by the characteristics of the analyzed environment, and also by the dominant species present there [14]. In addition, the reference scenario also has an influence. The scenarios that are considered in a risk analysis make it possible to identify the types of human receptors present according to land use and the main exposure routes according to the activities/uses and habits that are carried out. The residential scenario refers to living contexts and home environments, where both adult and child human receptors are present. In the residential scenario, receptors are in frequent contact with the contaminants, so exposure is daily and long-term.
The main activities that can bring receptors into contact with the contaminant, in a residential-type scenario, are therefore the accidental ingestion of contaminated water [15] and also the consumption of some particular fish species. The recreational scenario identifies all those spaces intended for playful activities such as hunting, fishing, sports, etc. These are activities that can, in general, be considered occasional. Therefore, the human receptors present in these environments, which may be either adults or children, are exposed to contamination for limited intervals of time. All these activities involve contact with the environment, so one of the most significant modes of exposure is dermal contact. However, the recreational scenario encompasses a wide range of different activities, so a more specific analysis could detect, with reference to some of these activities, a higher and more frequent exposure of the child population. Finally, it should be noted that with reference to work contexts in which Hg amalgam processes take place, the most frequent route of exposure is inhalation of Hg vapors [13,14].
The Andean region of Ecuador has historically been one of the most exploited for mining. Taking into account current mining concessions and ongoing projects, it is estimated that more than 28% of the territory could be occupied for mining activities in the near future [8]. Currently, the Andean region has around 797 gold mining concessions distributed in nine provinces, as registered in the Mining Cadastre Web Geoportal of the Mining Regulation and Control Agency (ARCOM), a company that operates in the mining and metals sector, and in Ecuador manages operations related to regulation, mining concessions, production, and illegal mining. These concessions correspond to different levels of activity: artisanal, small, medium, and large-scale mining, and there are also mining activities belonging to the general regime. However, in the Andean region of Ecuador, there is a marked presence of illegal mining operations. Following several complaints, between January and October 2019, the ARCOM, in collaboration with the Mining Crimes Unit of the National Police and the Armed Forces, carried out a total of 418 operations to combat illegal mining, achieving a 60 percent reduction compared to 2018. However, the health emergency from COVID-19 diverted the government’s attention from this issue [2]. From a social point of view, the Andean population shows a divide between people in favor and people against; in fact, the region’s economy is based on activities such as agriculture, livestock, trade, and fishing, so gold mining is still a mainstay of the economy [15]. The purpose of this study was to investigate the concentration of (Hg) in groundwater in the Andean region of Ecuador to assess the potential risks to the environment and human health by applying an assessment approach that combined deterministic and probabilistic methods.

2. Materials and Methods

2.1. Study Area

The research focused on the provinces of Carchi, Imbabura, Pichincha, Cotopaxi, Chimborazo, Bolívar, Cañar, Azuay, and Loja (Figure 1), the populations of which amount to approximately 6,081,342 inhabitants. The economy in this region is mainly based on primary production (agriculture, livestock, etc.) and mining. According to the Mining Cadaster prepared by ARCOM, mining is the main source of contamination in the region because of the uncontrolled use of Hg in gold mining [2]. The Andean region takes its name from the Andes, an imposing mountain barrier characterized by extremely steep slopes and altitudes of up to 3500–4000 m, decreasing from the north of the region to the south. In the north, the landscape consists of two parallel mountain ranges with average altitudes between 4000 and 4500 m, separated by a depression with altitudes between 1600 and 3000 m. The Western Cordillera consists of the Cretaceous volcanic complex, while the Eastern Cordillera develops on metamorphic facies formed by the Andean orogeny. These chains are crowned by two parallel rows of large volcanoes that form the “Avenue of Volcanoes”, culminating in the active Cotopaxi at 5897 m and the extinct Chimborazo at 6310 m [16]. Due to its great geomorphological variety, along with the presence of volcanoes, the region has great advantages in terms of mineral deposits [8].

2.2. Sampling and Laboratory Analysis

The analysis started with field data collection work performed by researchers along the territory during the period between March and July 2022, and the choice of sampling points was based on the distribution, along the territory, of mining activities. For this reason, the sampling network is denser in some areas than in others, in particular, the provinces with the most sampling were Azuay with just under 26 percent and Loja with just under 22 percent. For the purpose of the analysis, water samples were taken from wells intended for human consumption, and then the study focused on the analysis of Hg concentrations in groundwater in the region. To collect and transport samples, 250 mL amber flasks were used and acidified with 0.10 mL of nitric acid. The samples were then delivered to the scientific laboratory at the Escuela Superior Politécnica de Chimborazo in Orellana, Ecuador, adhering to a strict custody protocol. Mercury concentrations were measured using Atomic Absorption Spectrophotometry, with a precision of ±5 and a measurement range of 0.0005 to 10 mg/L. The analysis followed the Standard Methods, 23rd Edition, 2017, 3112B-Acid Digestion: EPA Method 3015, 2007 [17,18]. Samples were prepared using the nitric acid digestion procedure outlined in EPA Method 7473 [19]. The entire workflow, from sample collection to laboratory processing, adhered to international standards for quality, confidentiality, and ethical practices.
Application of the method for Hg concentration determination was preceded by a quality assurance and quality control procedure in accordance with EPA Method 7473 [20]. Analyses were carried out with scrupulous use of the appropriate safety devices to avoid any possible contact between operators and Hg compounds, and quality control of the water samples was also carried out to detect organic content. Initially, the laboratory demonstrated its competence by following the sample preparation and analysis procedures according to the established method. For each group of samples processed, a sample blank and a laboratory control sample were carried out. The method blank is prepared with reagent water in the specified volume and processed according to the appropriate steps. If the method blank does not contain the target analyte in an amount that affects the quality of the design, it is considered acceptable. In the absence of concrete evidence, this implies that a maximum level of 10% of the lowest concentration in the sample is considered acceptable. Laboratory control sampling should be performed at the project level for each analyte of interest.
The application of the method for the determination of the concentration of (Hg) was carried out through the quality assurance process and a quality control protocol according to EPA Method 7473 [16]. The operators performed the measurements while wearing the necessary safety equipment to prevent any form of potential contact with mercury compounds (ingestion, inhalation, and skin contact). In addition, a quality check was carried out on the samples to be analyzed to detect any samples with high organic content, as these require special attention during analysis and need to be reduced in size to avoid ignition in the decomposition tube. The laboratory initially demonstrated its competence by adhering to the sample preparation and analysis procedures as per the established method. For each batch of processed samples, a method blank and a laboratory control sample were included. The method blank was prepared using a reagent in water at the specified volume and was considered acceptable if it did not contain the target analyte at a level that would compromise analysis quality. In the absence of specific guidelines, a maximum level of 10% of the lowest sample concentration was deemed acceptable. Generally, it is necessary to collect laboratory control samples for each analyte of interest at the project level. Acceptance criteria can be based on historical data or, if such data are unavailable, the limit can be set at ±20% of the spiked value. Finally, for quality assurance/quality control (QA/QC) blanks, standards, and duplicated samples were analyzed. The recovery rates were in the range of 75–110%.

2.3. Risk Assessment and Characterization

For the health risk assessment, specifically for human health, two possible scenarios were considered: residential and recreational. In both scenarios, the main ways in which people can come into contact with contamination that should be considered are water consumption and direct skin contact. The potential risk associated with human health was assessed through the Hazard Quotient (HQ), which is a risk parameter used for non-carcinogenic substances and expresses how many times the maximum tolerable daily intake of contaminant, per unit of body weight, is exceeded. For each form of exposure, it is estimated and is defined as the ratio of the average daily dose ADD to the reference dose RfD. The average daily dose was determined using Equations (1) and (2) below, USEPA 2001 and 2004, respectively. Organic Hg is taken as the reference for RfD because it is the most water-soluble Hg compound and its value was obtained as reported on the Risk Assessment Information System website [16]. Since two scenarios were considered, the risk was assessed in terms of cumulative risk through the so-called HI Hazard Index, given by the sum of the HQs for the two scenarios. If one of the HQs or the HI tends to take values close to or even above unity, this means that the safe exposure threshold has been exceeded and, therefore, adverse effects related to Hg exposure may occur. To mitigate the uncertainties inherent in the risk assessment, the analysis was carried out using the traditional deterministic method [21] and a probabilistic approach [22].
  • Equation (1)—Average daily dose by the route of ingestion, USEPA 2001
A D D i n g e s t i o n = C G w · E F · I R · E D A T · B W
where CGW (mg/L) is the concentration of Hg detected in the analyzed samples; EF (days/year) is the frequency of exposure; IR (L/days) is the ingestion rate; and ED (years) is the duration of exposure. The parameter “AT” represents the average exposure time. For non-carcinogenic toxic substances, the AT value is considered to coincide with the exposure duration (ED). The latter is expressed in years, while AT is expressed in days. Therefore, AT is obtained by multiplying ED by the number of days present in the year (365). In this way, the ADDingestion that is obtained is expressed in (mg/kg-day). Finally, BW (kg) is the individual’s body weight.
  • Equation (2)—Average daily dose by the route of dermal contact, USEPA 2004
A D D d e r m a l c o n t a c t = C G w · E F · E T · E D · S A · k p A T · B W
where CGW (mg/L) is the concentration of Hg detected in the analyzed samples; EF (days/year) is the frequency of exposure; ET (hours/event) is the exposure time; ED (years) is the exposure time; SA (cm2) is the exposed skin area of the individual; and kp (cm/hours) is the skin permeability constant. AT (days) is the average exposure time, which for non-carcinogenic toxic substances can be assumed to be equivalent to the exposure duration ED (years). Therefore, AT is obtained by converting ED from years to days, multiplying it by the number of days present in the year, i.e., 365. BW (kg) represents the body weight of the individual.
The meaning of each parameter is summarized below:
C G w = H g   c o n c e n t r a t i o n   i n   g r o u n d w a t e r   ( m g L ) E F = e x p o s u r e   f r e q u e n c y   ( d a y s y e a r ) I R = i n g e s t i o n   r a t e   o f   w a t e r   L d a y E T = e x p o s u r e   t i m e   h o u r s e v e n t E D = l i f e t i m e   e x p o s u r e   d u r a t i o n   y e a r s S A = s k i n   s u r f a c e   a r e a   e x p o s e d   c m 2 k p = s k i n   p e r m e a b i l i t y   c o n s t a n t   c m h o u r A T = a v e r a g i n g   t i m e   d a y s B W = b o d y   w e i g h t   k g

2.3.1. Insight into the Significance of Parameters

  • CGW (Concentration) represents the concentration of Hg measured at the selected sampling points;
  • Exposure Frequency (EF): This parameter indicates the average number of days per year that the receptor is assumed to be exposed to contamination. Thus, EF varies depending on the specific scenario;
  • Ingestion Rate (IR) signifies the average daily amount of contaminated water ingested by the receptor. This quantity fluctuates based on both the scenario and the receptor type;
  • Exposure Time (ET): This denotes the duration of exposure relative to the contamination event experienced by the individual. Its value is scenario-dependent;
  • Exposure Duration (ED) represents the number of years, on average, during which the receptor is considered to be exposed to contamination. Consequently, the ED value varies depending on the receptor type: adult or child;
  • Skin Area (SA): This refers to the average skin area exposed to contamination through dermal contact, varying based on the receptor type;
  • Skin Permeability Constant (Kp) indicates the amount of contaminant absorbed per centimeter of exposed skin per hour;
  • Averaging Time (AT): This parameter represents the period over which exposure is averaged. Its value differs depending on whether toxic (non-carcinogenic) or carcinogenic substances are being assessed. For toxic substances such as Hg, it is conventionally assumed that AT aligns with ED;
  • Body Weight (BW) signifies the average body weight of the receptor and thus varies accordingly;
  • Chronic Reference Dose (RfD): This represents the maximum dose of toxic contaminant considered acceptable. Essentially, it is the concentration value of the pollutant for which no adverse health effects have been documented in the literature. Specifically, for the purposes of this analysis, reference was made to RfD values for elemental mercury (metallic). In reality, the reference dose (RfD) is the result of a rough estimate and may have an uncertainty of up to an order of magnitude. The value of the reference dose (RfD) is decisive for the outcome of the analysis results. The reference dose (RfD) is usually determined, for different compounds and exposure modes according to the following equation:
R f D = N O A E L / ( U F · M F )
where:
  • NOAEL stands for “No Observed Adverse Effect Level”, and among several possible values, the most conservative one is chosen. In the absence of the NOAEL, the LOAEL is used;
  • UF is the uncertainty factor;
  • MF is the modifying factor. This section may be divided by subheadings. It should provide a concise and precise description of the experimental results, their interpretation, as well as the experimental conclusions that can be drawn;
  • For the purpose of this analysis, the EPA-recommended values were used for all the parameters indicated [23].

2.3.2. Calculation of Hazard Quotient (HQ) and Hazard Index (HI)

The Hazard Quotient HQ is calculated as the ratio between the Average Daily Dose and the Reference Dose, as follows:
  • Equation (3)—Hazard Quotient (HQ)
H Q i n g e s t i o n / d e r m a l = A D D i n g e s t i o n / d e r m a l R f D i n g e s t i o n / d e r m a l
Spatial data processing and map creation were conducted using the open-source software QGIS (version 3.16). Probabilistic calculations were executed using the R programming language, involving 10,000 iterations to enhance the reliability of the analysis. The parameters utilized in the analysis, along with their probabilistic distributions, are presented in Table 1.

3. Results

3.1. Mercury (Hg) Accumulation in Groundwater

Table 2 shows a statistical summary of samples with mercury accumulation in groundwater present in selected provinces.
Of the total number of samples studied, 54.8% were below the permissible limit according to the equipment used. (LoD of 0.0005 mg/L). For the purpose of the analysis, a concentration of half of the same instrument detectability threshold, or 0.00025 mg/L, was assumed at these points. On the other hand, 9.71 percent of the samples exhibited concentrations of 0.006 mg/L imposed by Ecuadorian regulations with reference to standards for safe drinking water. Of the data exceeding the Maximum Permissible Limit (MPL) value, 32.60% were found in Azuay province alone, and 7.69% in Loja province. In Chimborazo province, 100% of the tests studied exhibited Hg concentrations under the instrument’s identification threshold (LoD = 0.0005 mg/L). This is followed by the provinces of Cotopaxi at 88.23%, Imbabura at 68.42%, Bolivar at 62.50%, Loja at 61.53%, Pichincha at 45.45%, Azuay at 36.95%, and Carchi, and Cañar at the same value of 28.57%. Figure 2 below shows the Hg concentrations at the locations where the samples were taken.

3.2. Harm to People’s Wellbeing

3.2.1. Spontaneous Perspective

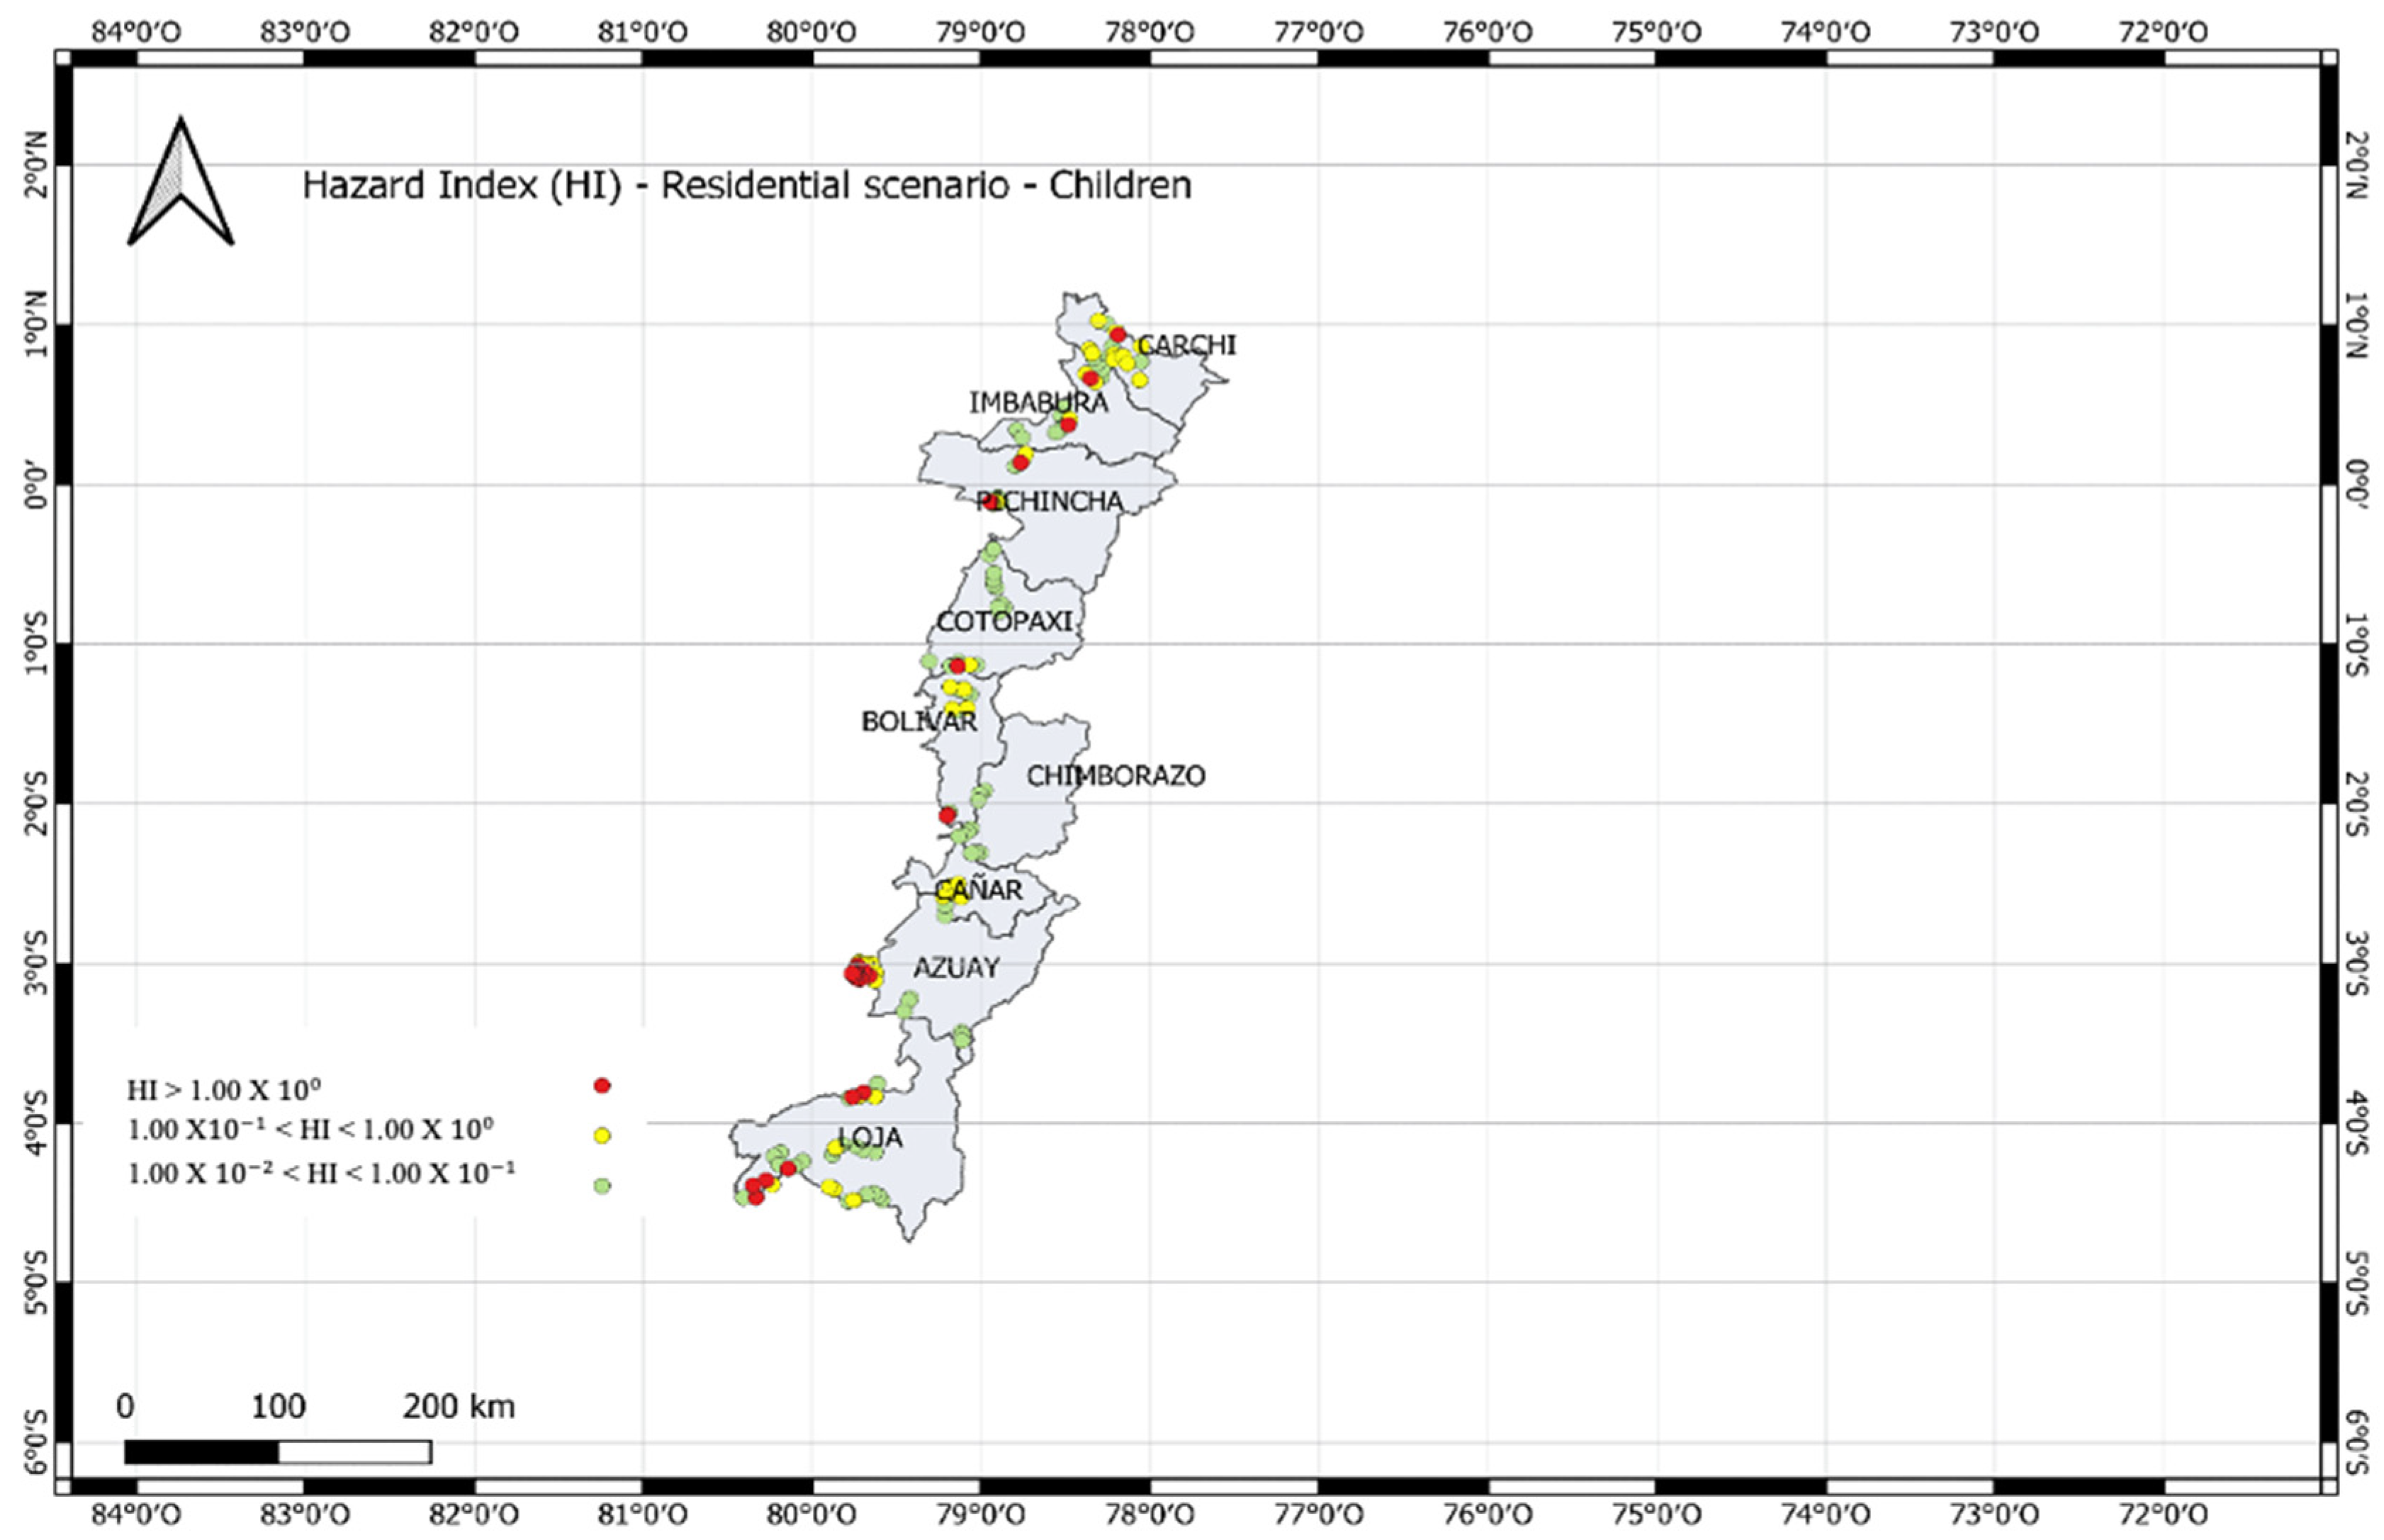
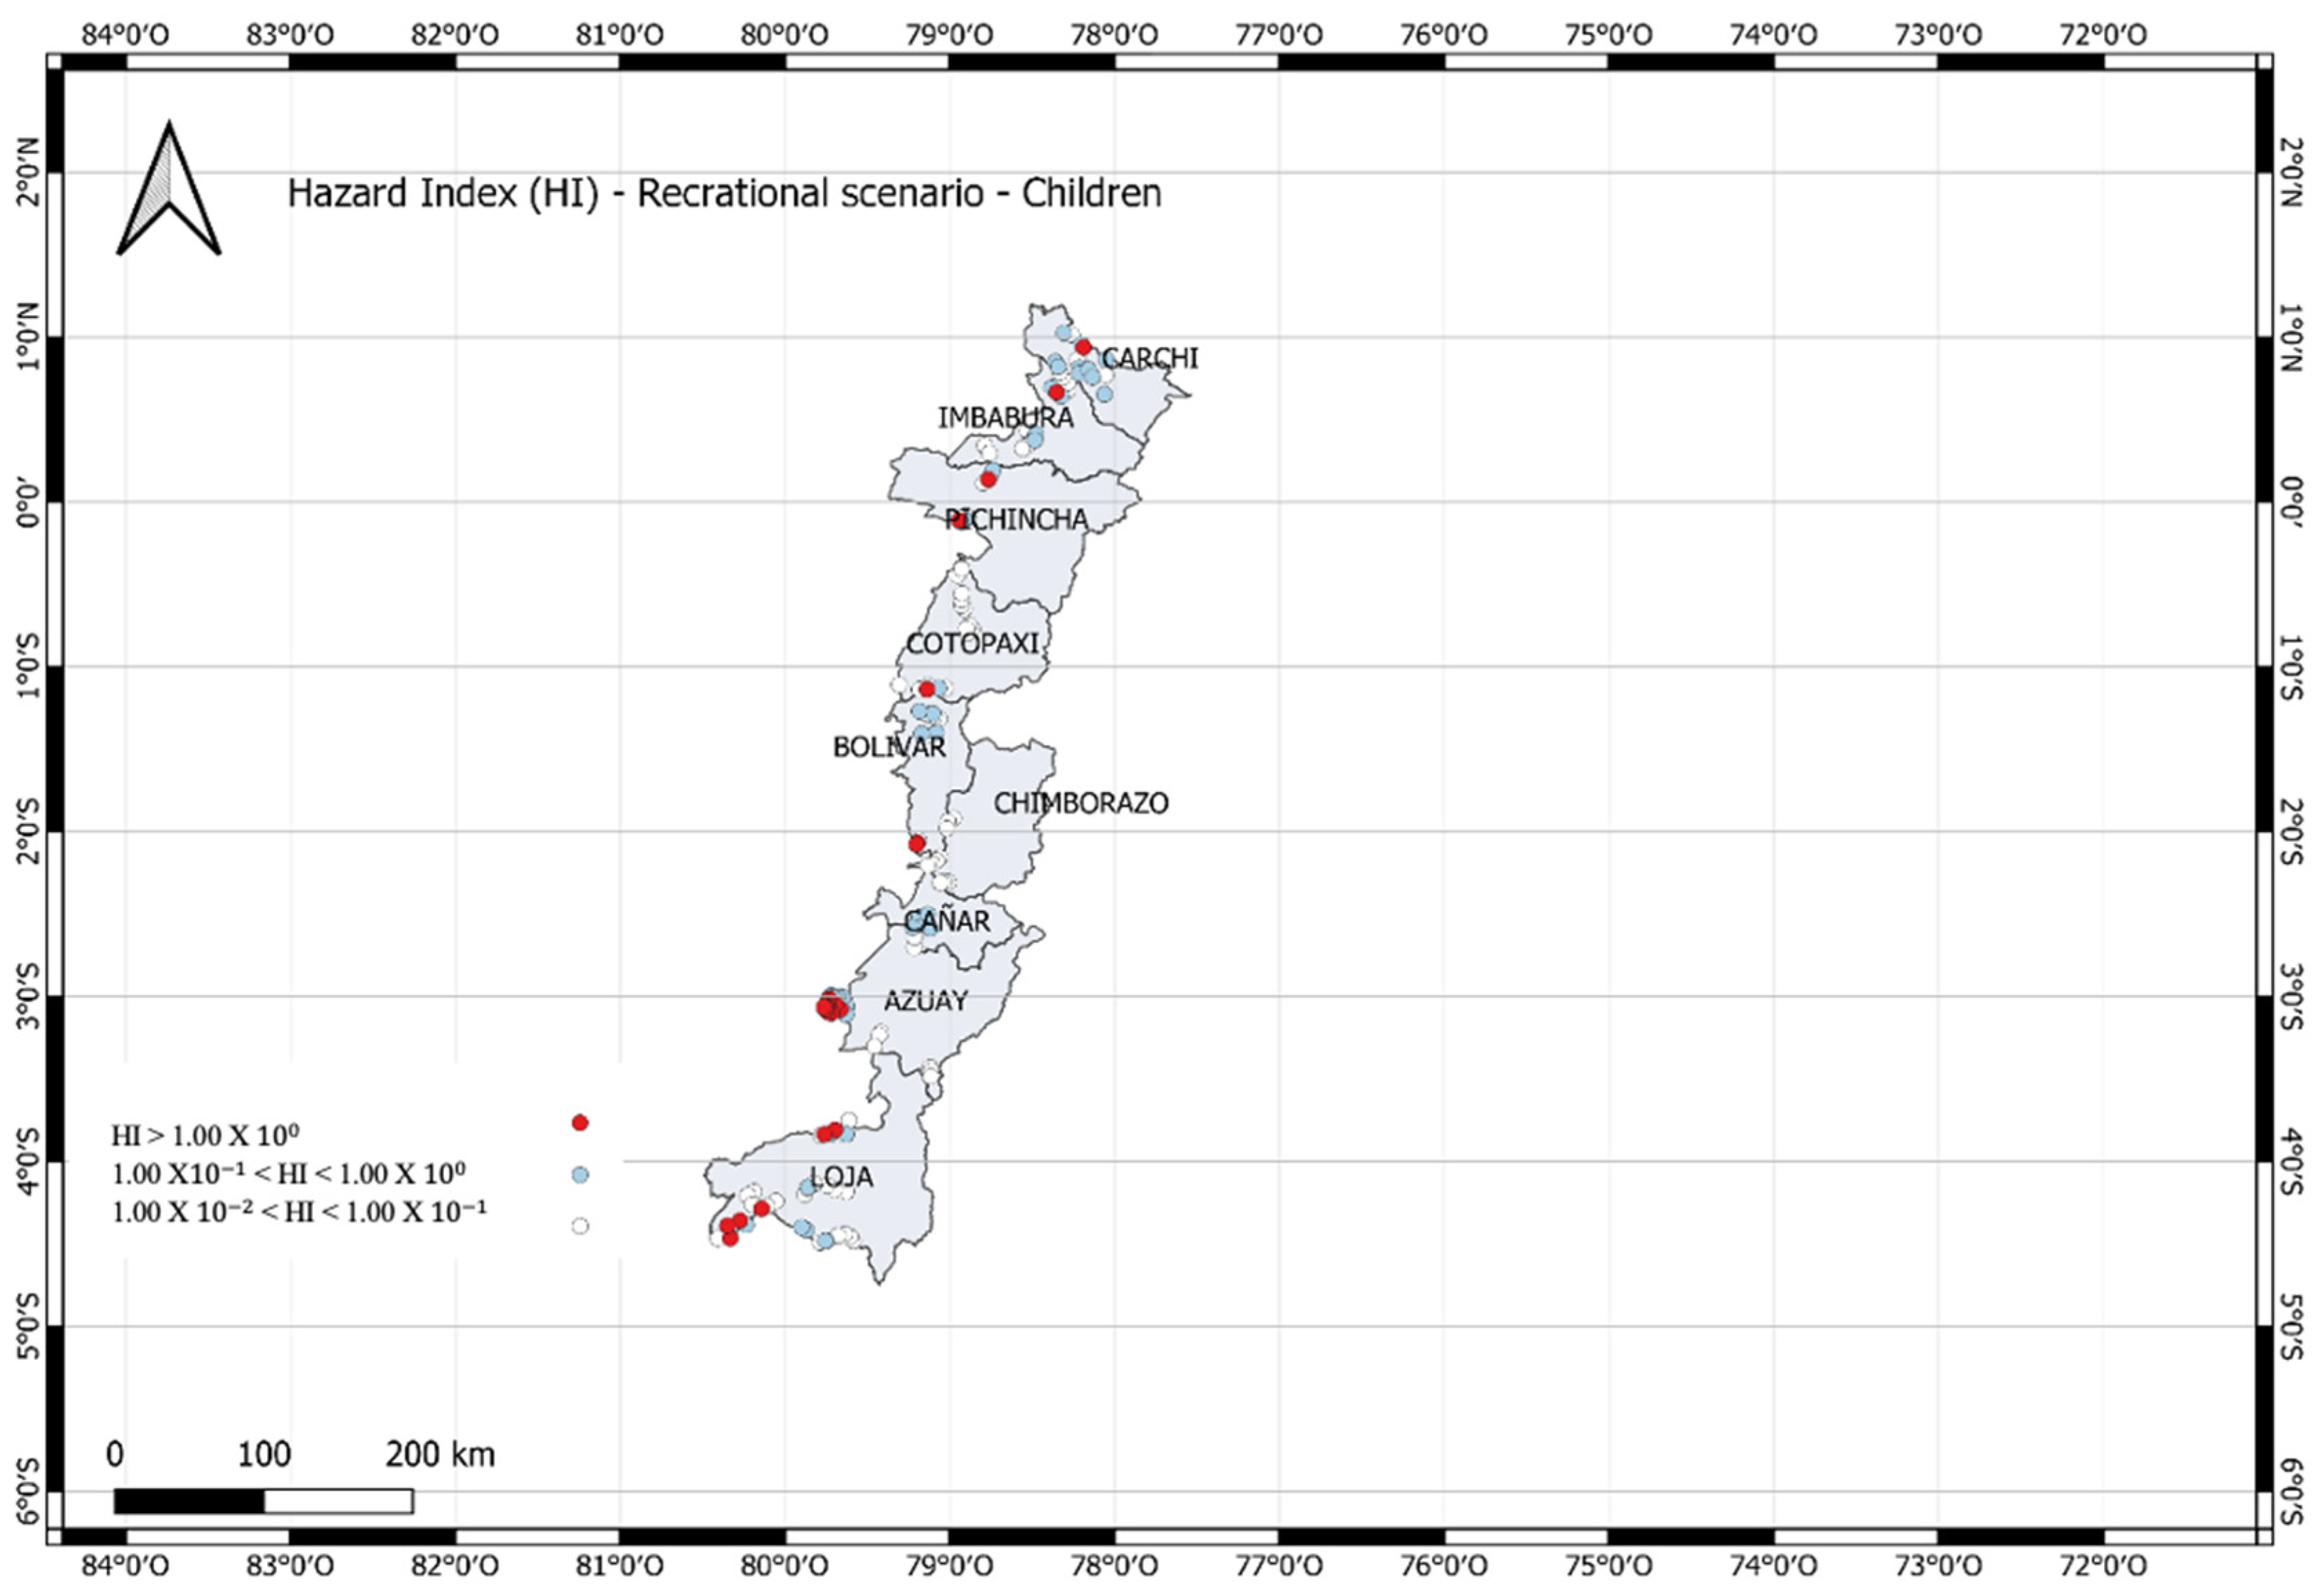
Taking into account the philosophical doctrine of determinism, the impacts on human welfare are cataloged in Figure 3, Figure 4, Figure 5 and Figure 6 by means of a punctual damage map. The numerical data of HI by sector (Table 3) are presented below: Loja > Azuay > Bolivar > Imbabura > Cotopaxi > Pichincha > Cañar > Chimborazo > Carchi. The risk analysis performed using the traditional deterministic approach showed a risk of 7.43% for the adult population in the residential scenario and 10.86% in the recreational scenario. Meanwhile, for the child population, a risk of 18.29% and 17.71% respectively emerged according to the above scenarios. The risk analysis makes it possible to estimate the risk associated with different receptors, according to their vulnerability. The latter is influenced, among other factors, by age. In risk analysis, unless specific data are provided, all individuals aged 0–6 years are considered ‘children’. In a more detailed risk analysis, surveys are carried out to allow more accurate quantification of the type of targets present in the survey area. Therefore, the results of the analysis suggest a higher vulnerability in both scenarios for the child population, which is more exposed. Finally, thanks to the results obtained from the residential context, the main route of exposure was found to be ingestion. On the other hand, the following result demonstrates that the highest risk mode of exposure is dermal contact.
To evaluate the determination of mercury (Hg) concentration in groundwater in different regions, a detailed analysis was carried out considering different receptors and scenarios. This study was carried out in order to identify mercury levels that could represent a risk to public health and the environment. Table 4 below shows the determinism values (p95) of Hg in groundwater, broken down by the different receptors and scenarios evaluated. This information is crucial for understanding variations in Hg concentration and for developing appropriate mitigation strategies.
Figure 3 shows the danger index for adults in the residential scenario, where the highest index was found in the provinces of Azuay and Loja.
The figure provides a detailed overview of the Hazard quotient (HQ) for children in residential areas. It highlights that the provinces of Azuay and Loja show the most significant levels of risk. This crucial analysis provides a clear understanding of the areas where children may face the greatest dangers in their residential environment. The evidence underscores the need for targeted interventions in these regions to ensure the safety and well-being of the very young.
The analysis of the Hazard Index (HQ) for adults in recreational settings reveals significant concerns, particularly in the provinces of Azuay and Loja, where the maximum permissible limit is exceeded.
Analysis of the Danger Index (Hq) in recreational settings for children reveals areas of concern, particularly in the provinces of Carchi, Pichincha, Cotopaxi, Bolivar, Azuay, and Loja. These results highlight the urgency of addressing the specific risks faced by children in these recreational settings. It is crucial to implement preventive measures and effective safety policies to ensure their protection during their recreational activities.

3.2.2. Probability Perspective

Process hazard studies use the perspective of traditional determinism under a regime of unwanted events; in analyses of this type, the larger the sample of data available, the greater the reliability of the results. However, it may also be useful to conduct a risk analysis using a different approach, in particular a probability of comparing corresponding responses. In particular, with the help of the R programming language [28]. This technique makes it possible to assess the risk associated with a given process or phenomenon through the construction of a series of simulated scenarios. The construction of the simulated scenarios consists of generating sequences of random numbers using a special algorithm, according to a given probabilistic distribution law, to be assigned to the variables of the phenomenon to be analyzed. The application of the method first requires the preliminary definition of a mathematical model suitable for representing the phenomenon under analysis. Then, all the variables, their probability distribution, and the relationships between them must be identified and defined. Based on the constructed model, using a suitable software tool, sequences of random numbers can be generated and assigned to the variables involved: That is, the more simulations, the more precise the final risk assessment will be.
By applying the Monte Carlo simulation, a number of manifestations of the phenomenon (process) analyzed can be determined. In the present study, the random determinations of the phenomenon under investigation were obtained by synthetically generating random numbers by writing a special algorithm in R. In particular, 10,000 iterations were performed for each simulated quantity. Accurate modeling of a process with the Monte Carlo method requires the generation of high-quality pseudo-random numbers. The main limitation of generating pseudo-random numbers with a computer is that the values begin to repeat themselves after a certain generation sequence. However, due to the great interest in the development of the Monte Carlo technique, many scientists have developed algorithms to solve this problem. In particular, R implements the Mersenne-Twister algorithm by default. The Mersenne-Twister algorithm, developed by Matsumoto and Nishimura, guarantees a sequence of 219937−1 elements before repetition and this property has been proven by its developers and more, this algorithm is faster than most other algorithms and has passed many statistical tests.
Monte Carlo simulation offers a full range of possible outcomes by implementing these stochastic simulation techniques [24]. This type of method is considered valid by many scholars for the analysis of problems requiring risk evaluation or in decision-making problems involving many variables [29]. Once the random sample has been determined, it is possible to determine the quantities of interest and obtain very explanatory graphical representations. The probability distributions and intervals used for each parameter are shown in Table 5. The R software (version 4.4.1) has special libraries that allow sequences to be generated in accordance with each probability distribution.
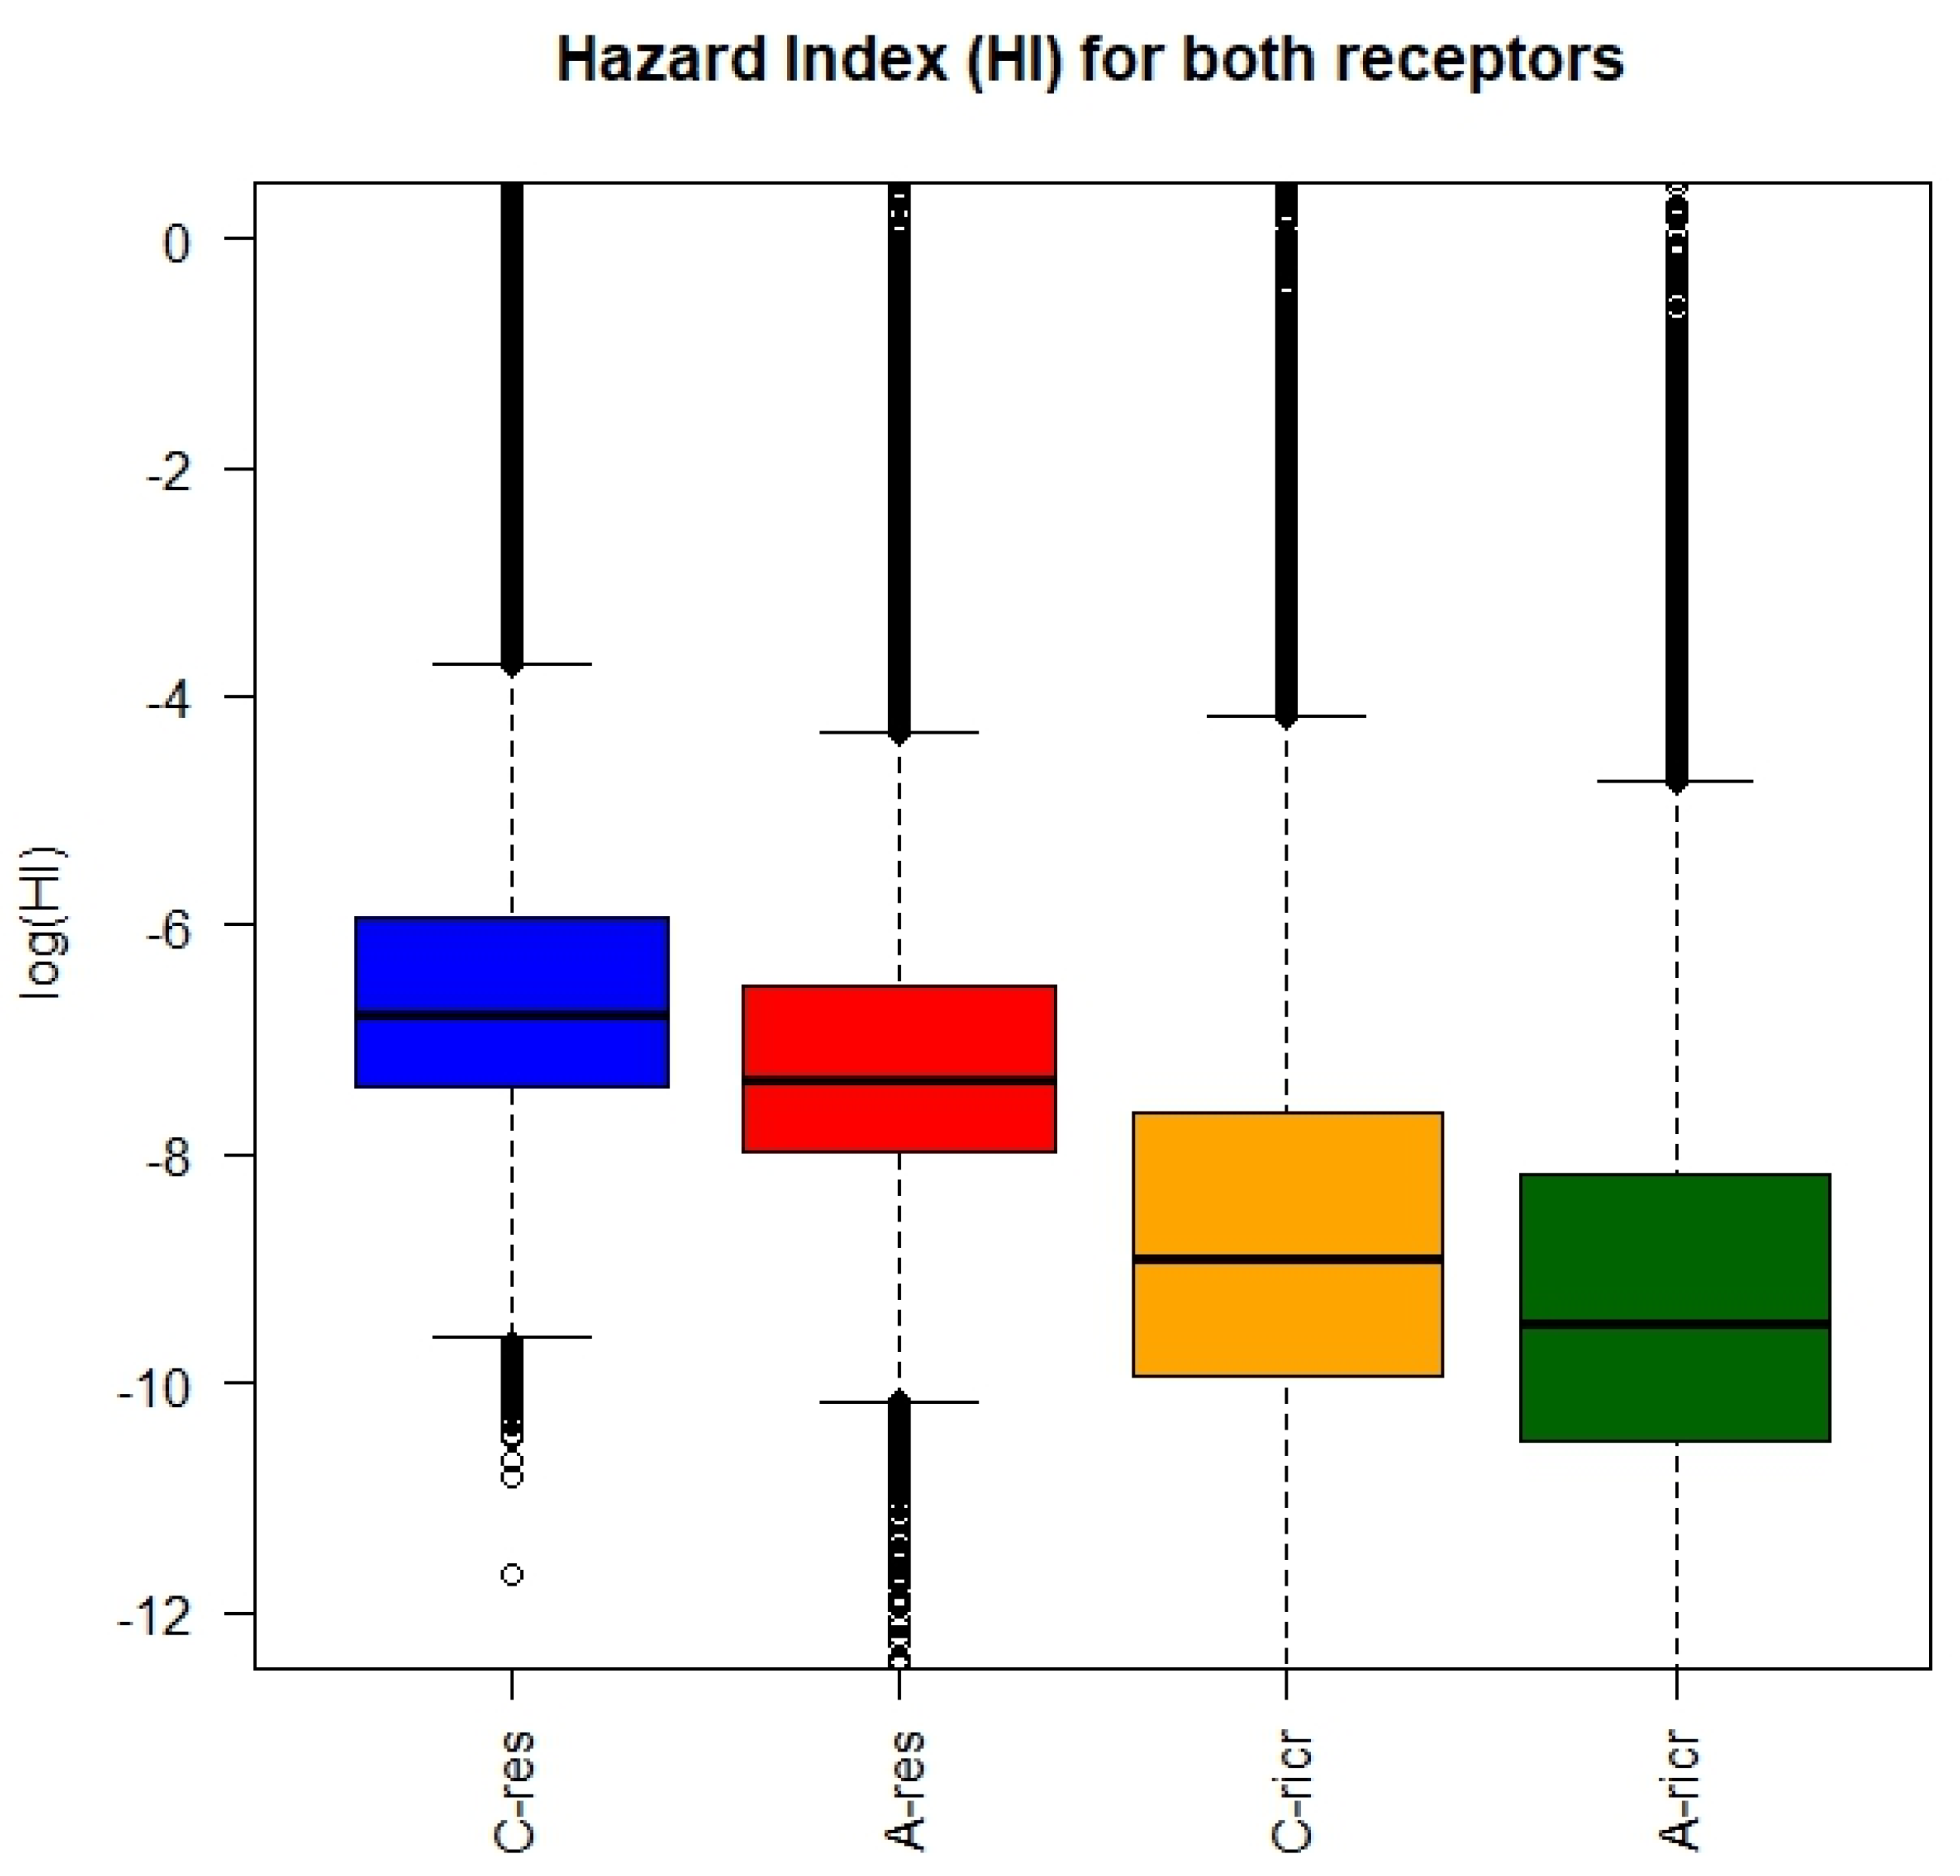
Figure 7 presents four box-and-whisker plots, corresponding to each exposure route and receptor category. Each of these plots illustrates the distribution of the Hazard Quotient (HQ) for the exposure pathway and receptor type analyzed. The lower and upper boundaries of the ‘box’ symbolize the 25th and 75th percentiles, respectively. The ‘lines’ or ‘whiskers’ that extend from the box display the variability in the expected data. The points located outside these whiskers constitute atypical or extreme observations.
Figure 8 similarly shows the development of the probability density function for the different scenarios and receptors. Specifically, the x-axis shows the values of HI on a logarithmic scale, and the corresponding probability densities are shown on the y-axis.

4. Discussion

The study’s findings paint a troubling picture regarding Hg pollution in groundwater in the Andean region of Ecuador. A discrepancy was found between the results obtained by applying the two approaches; based on the deterministic approach, certain locations present risks associated with exposure. This inconsistency in the findings derived from the two methodologies has been observed in other research as well, such as a study by Mestanza-Ramón et al. in 2023 that analyzed mercury levels in superficial water bodies within the Andean area and encountered similar discrepancies in the results obtained through the different techniques applied [22]. This divergence lies in the inherent methodology of each of the two approaches considered, since the deterministic approach involves a specific and concrete assessment, whereas the probabilistic perspective consists of a stochastic-type analysis that considers the variability of all the parameters involved in the phenomenon. However, in qualitative terms, both approaches suggest greater exposure to the child population.
There was a non-uniform distribution of Hg concentrations across the samplings, and with a wide range of variability: in some places concentrations were at levels below the minimum detectable limit of the measuring device, in others they exceeded the levels surpassed the maximum permissible limit by Ecuadorian standards for water intended for human consumption. This spatial pattern may be influenced by depends on multiple variables, only some of which are described below. First, the sampling points were chosen according to “reasoned location”, that is, based on the location of the mining areas and the information collected in the field. Nevertheless, the mining activities that have the most significant impact on Hg contamination are illegal activities, so they are not easy to track. In addition, one must consider the particular inclination of mercury to disperse very rapidly: when in its liquid form, it fractionates into tiny spheres that exhibit a significant ability to move, and additionally, contingent upon environmental conditions, it has the potential to evaporate and subsequently condense again with swiftness. These particular characteristics mean that mercury can disperse very rapidly by diffusing from its point of origin.
In any case, it appears that the most affected provinces are those located in the south of the region: Loja and Azuay. The network of sampling points is not uniformly distributed over the territory but was determined according to a “reasoned location”. In other words, based on the information collected, sampling sites were selected in the areas closest to mining activities. At mining locations, especially ASGM, other potentially toxic substances are used in addition to Hg, such as arsenic (As), cadmium (Cd), chromium (Cr), copper (Cu), nickel (Ni), lead (Pb), tin (Sn) and aluminum (Al). It should be considered that multiple toxic substances in combination can dramatically exacerbate potentially hazardous conditions, and additionally, as mining activities continue to increase, Hg (and also of any other toxic substances) concentrations could continue to rise over time, resulting in a higher risk status for populations in these areas.
Figure 9 shows the choice of sampling points and the locations where pollution from mining activities has been officially recognized in the Andean region. It is possible to see that most of the sampling points fall in the vicinity of the points where pollution was detected. The prospect of contamination affecting groundwater makes the overall picture even more worrisome. Indeed, from groundwater, the chances of the contaminant reaching human receptors or entering the food chain are very high. Actually, underground aquifers constitute the primordial water resource for supplying the population. Previous research maintains that a primary means of mercury exposure is the unintentional consumption of contaminated water. In addition, from groundwater, contamination can reach surface water bodies (especially during lean periods), contaminating the fish population. In particular, as attested by the “Exposure to Mercury” document prepared by WHO (2021), the foremost source of contact with this organometallic form of mercury is through the dietary intake of aquatic animals such as finfish and shellfish, especially for populations where the diet is based on the consumption of predatory fish [27]. A more specific analysis of the dietary habits of the populations inhabiting the analyzed area could allow a more accurate assessment of the impact of this source of contamination. Contamination can also accumulate on the ground, both shallow and deep, posing a danger, especially to children in recreational scenarios.
The essential purpose of a risk analysis consists of offering an estimation of the danger posed to the health of the population and ecosystems by the presence of one or more contaminants in different environmental components. Accurate risk analysis requires very thorough site-specific investigations, which require a significant deployment of financial funds, specialized knowledge, and support infrastructure. Consequently, it is invariably advisable for such analyses to be preceded by general analyses, which, considering vast territories (such as the entire Andean region), allow one to identify which areas are most affected by the presence of the contaminant(s) in question, and therefore potentially contaminated. For these reasons, first-level risk analyses are conducted on the basis of very conservative assumptions. Therefore, total mercury was used as the analysis criterion because potentially all mercury in the environment could potentially be transformed into its most toxic form. In fact, mercury introduced into the environment by anthropogenic activities often occurs in an inorganic form, however, if favorable conditions are established, natural processes may occur that lead to its conversion into methylmercury [CH3Hg]+, which has a high persistence capacity that allows it to bioaccumulate in the environment even for centuries [10]. By applying this precautionary approach, results can be obtained to the benefit of safety and the most affected areas can be easily identified, enabling decision-makers to plan and conduct more detailed analyses.
A research based on the thorough analysis of 1573 scientific publications found consistent results regarding the relationship between exposure to heavy metallic elements (HM) and the repercussions on neurocognitive abilities in adult individuals [28]. The conclusions indicated a correlation between contact with HM and the deterioration of neurocognitive functions in the adult population. Specifically, certain observations have detected a decrease in the aptitude to retain information in the short term as exposure to mercury in its elemental form increases [29]. Likewise, another two-cycle cross-sectional study, carried out in Korea with a total sample of 14,682 participants, discovered that Hg levels (together with two other metals) showed a strong association with alcohol-related liver disease [30].

5. Conclusions

This research focused on analyzing Hg levels within the Andean area of Ecuador. The provinces located in the southern region were found to be the most impacted. However, in certain zones, the identified levels of concentration were lower than the maximum permissible limit set by Ecuador’s standards for water meant for human use. The results from the two approaches applied, deterministic and probabilistic, show different results: the deterministic approach provided higher levels of risk. Nevertheless, both showed an increased vulnerability of the child population compared to adults. Therefore, it might be appropriate to carry out a more detailed analysis, especially in the areas most at risk. In fact, in order to conduct a more detailed risk analysis, it is necessary to dispose of a set of data to contextualize the risk to the territories of reference.
The contaminant in the pathway from the source to the point of exposure may be partially attenuated, depending on the transport processes involved. To take these aspects into account, it is necessary to have a complete mapping of the structure and physical characteristics of the individual site analyzed. However, the aim of this study is to realize a general screening of concentrations; generally, in studies of this type, the analysis is carried out with very conservative assumptions, so transport mechanisms are neglected, and the detected concentrations are assumed to be valid. Where decision-makers deem it appropriate, they may use the results summarized in this study as a guide and proceed to gather more information to conduct a more detailed analysis.

Author Contributions

Conceptualization, I.P., S.S. and C.M.-R.; methodology, I.P., S.S. and C.M.-R.; software, I.P., S.S. and C.M.-R.; validation, I.P., S.S., D.M.-S. and C.M.-R.; formal analysis, I.P., D.M.-S., M.J.-G., S.L.-N., D.H.-A., R.U.V., V.G.A.P., L.P.T.P., S.S. and C.M.-R.; investigation, I.P., D.M.-S., M.J.-G., S.L.-N., S.S., M.S.-S., M.G.T.R., K.C.-S. and C.M.-R.; writing—original draft preparation, I.P., D.M.-S., S.S. and C.M.-R.; writing—review and editing, I.P., D.M.-S., S.S. and C.M.-R.; visualization, I.P., D.M.-S., S.S. and C.M.-R.; supervision, S.S. and C.M.-R. All authors have read and agreed to the published version of the manuscript.

Funding

The researchers are grateful for the financial support of the Escuela Superior Politécnica de Chimborazo and the University of Calabria.

Data Availability Statement

The data presented in this study are available upon request from the corresponding author.

Conflicts of Interest

The authors declare no conflicts of interest.

References

  1. Mestanza-Ramón, C.; Cuenca-Cumbicus, J.; D’Orio, G.; Flores-Toala, J.; Segovia-Cáceres, S.; Bonilla-Bonilla, A.; Straface, S. Gold Mining in the Amazon Region of Ecuador: History and a Review of Its Socio-Environmental Impacts. Land 2022, 11, 221. [Google Scholar] [CrossRef]
  2. Mestanza-Ramón, C.; Ordoñez-Alcivar, R.; Arguello-Guadalupe, C.; Carrera-Silva, K.; D’Orio, G.; Straface, S. History, Socioeconomic Problems and Environmental Impacts of Gold Mining in the Andean Region of Ecuador. Int. J. Environ. Res. Public Health 2022, 19, 1190. [Google Scholar] [CrossRef] [PubMed]
  3. Lalander, R.; Eguiguren-Riofrío, M.B.; Vera, A.K.; Espinosa, G.; Reyes, M.; Lembke, M. Indigenous Gold Mining in the Kenkuim Shuar Community: A Decolonial and Postcapitalist Approach to Sustainability. Rev. Iberoam. Estud. Desarro. Iberoam. J. Dev. Stud. 2021, 10, 178–202. [Google Scholar] [CrossRef]
  4. Svampa, M.; Bottaro, L.; Sola Álvarez, M. La Problemática de La Minería Metalífera a Cielo Abierto: Modelo de Desarrollo, Territorio y Discursos Dominantes; Universidad Nacional de La Plata: La Plata, Argentina, 2009. [Google Scholar]
  5. Carvalho, P.C.S.; Neiva, A.M.R.; Silva, M.; Santos, A.C.T. Human Health Risks in an Old Gold Mining Area with Circum-Neutral Drainage, Central Portugal. Environ. Geochem. Health 2017, 39, 43–62. [Google Scholar] [CrossRef] [PubMed]
  6. González-Vicente, R. Development Dynamics of Chinese Resource-Based Investment in Peru and Ecuador. Lat. Am. Polit. Soc. 2013, 55, 46–72. [Google Scholar] [CrossRef]
  7. Niane, B.; Guédron, S.; Feder, F.; Legros, S.; Ngom, P.M.; Moritz, R. Impact of Recent Artisanal Small-Scale Gold Mining in Senegal: Mercury and Methylmercury Contamination of Terrestrial and Aquatic Ecosystems. Sci. Total Environ. 2019, 669, 185–193. [Google Scholar] [CrossRef] [PubMed]
  8. Mestanza-Ramón, C.; Mora-Silva, D.; D’Orio, G.; Tapia-Segarra, E.; Gaibor, I.D.; Esparza Parra, J.F.; Chávez Velásquez, C.R.; Straface, S. Artisanal and Small-Scale Gold Mining (ASGM): Management and Socioenvironmental Impacts in the Northern Amazon of Ecuador. Sustainability 2022, 14, 6854. [Google Scholar] [CrossRef]
  9. EPA/600/8-85/010; Development a Statistical Distributions or Ranges of Standard Factors Used in Exposure Assessments. Environmental Protection Agency: Washington, DC, USA, 1985.
  10. Teaf, C.M.; Garber, M. Mercury Exposure Considerations: Evaluating the Chemical Form and Activities of the Individual. In Proceedings of the Annual International Conference on Soils, Sediments, Water and Energy, Amherst, MA, USA, 15–18 October 2012; Volume 17, p. 5. [Google Scholar]
  11. Dooyema, C.A.; Neri, A.; Lo, Y.-C.; Durant, J.; Dargan, P.I.; Swarthout, T.; Biya, O.; Gidado, S.O.; Haladu, S.; Sani-Gwarzo, N. Outbreak of Fatal Childhood Lead Poisoning Related to Artisanal Gold Mining in Northwestern Nigeria, 2010. Environ. Health Perspect. 2012, 120, 601–607. [Google Scholar] [CrossRef] [PubMed]
  12. Davidson, S.C.; Banfield, A.F. Geology of the Beattie Gold Mine, Duparquet, Quebec. Econ. Geol. 1944, 39, 535–556. [Google Scholar] [CrossRef]
  13. Fuentes-Gandara, F.; Herrera-Herrera, C.; Pinedo-Hernández, J.; Marrugo-Negrete, J.; Díez, S. Assessment of Human Health Risk Associated with Methylmercury in the Imported Fish Marketed in the Caribbean. Environ. Res. 2018, 165, 324–329. [Google Scholar] [CrossRef] [PubMed]
  14. Risk Assessment Information System RAIS. Available online: https://rais.ornl.gov/ (accessed on 12 October 2020).
  15. Jiménez-Oyola, S.; García-Martínez, M.-J.; Ortega, M.F.; Chavez, E.; Romero, P.; García-Garizabal, I.; Bolonio, D. Ecological and Probabilistic Human Health Risk Assessment of Heavy Metal (Loid) s in River Sediments Affected by Mining Activities in Ecuador. Environ. Geochem. Health 2021, 43, 4459–4474. [Google Scholar] [CrossRef] [PubMed]
  16. Mestanza-Ramón, C.; Jiménez-Oyola, S.; Montoya, A.V.G.; Vizuete, D.D.C.; D’Orio, G.; Cedeño-Laje, J.; Straface, S. Assessment of Hg Pollution in Stream Waters and Human Health Risk in Areas Impacted by Mining Activities in the Ecuadorian Amazon. Environ. Geochem. Health 2023, 10, 7183–7197. [Google Scholar] [CrossRef]
  17. Avcı, D.; Fernández-Salvador, C. Territorial Dynamics and Local Resistance: Two Mining Conflicts in Ecuador Compared. Extr. Ind. Soc. 2016, 3, 912–921. [Google Scholar] [CrossRef]
  18. Winckell, A. Relieve Y Geomorfologia Del Ecuador; Centro Ecuatoriano de Investigacion Geografica Guayaquil: Guayaquil, Ecuador, 1982. [Google Scholar]
  19. Environmental Protection Agency. EPA METHOD 3015A. Available online: https://www.epa.gov/sites/default/files/2015-12/documents/3015a.pdf (accessed on 15 May 2024).
  20. U.S. Environmental Protection Agency. EPA Method 7473 (SW-846): Mercury in Solids and Solutions by Thermal Decompostion, Amalgamation, and Atomic Absorption Spectrophotometry; U.S. Environmental Protection Agency: Washington, DC, USA, 2011.
  21. Mestanza-Ramón, C.; Jiménez-Oyola, S.; Gavilanes Montoya, A.V.; Vizuete, D.D.C.; D’Orio, G.; Cedeño-Laje, J.; Urdánigo, D.; Straface, S. Human health risk assessment due to mercury use in gold mining areas in the Ecuadorian Andean region. Chemosphere 2023, 344, 140351. [Google Scholar] [CrossRef] [PubMed]
  22. Epa, U. Integrated Risk Information System Division. I. Chronic Health Hazard Assessments for Noncarcinogenic Effects I.A. Reference Dose for Chronic Oral Exposure (RfD); U.S. Environmental Protection Agency: Washington, DC, USA, 1987.
  23. R Core Team. A Language and Environment for Statistical Computing; R Foundation for Statistical Computing: Vienna, Austria, 2023; Available online: https://www.R-project.org/ (accessed on 15 May 2024).
  24. Jiménez-Oyola, S.; Chavez, E.; García-Martínez, M.-J.; Ortega, M.F.; Bolonio, D.; Guzmán-Martínez, F.; García-Garizabal, I.; Romero, P. Probabilistic Multi-Pathway Human Health Risk Assessment Due to Heavy Metal(Loid)s in a Traditional Gold Mining Area in Ecuador. Ecotoxicol. Environ. Saf. 2021, 224, 112629. [Google Scholar] [CrossRef]
  25. Chen, G.; Wang, X.; Liu, G. Health risk assessment of potential harmful elements in subsidence water bodies using a Monte Carlo approach: An exemple from the Huainan coal mining area. Ecotoxicol. Environ. Saf. 2019, 171, 737–745. [Google Scholar] [CrossRef]
  26. World Health Organization (WHO). Exposure to Mercury: A Major Public Health Concern, 2nd ed.; WHO: Geneva, Switzerland, 2021; Available online: https://www.who.int/publications/i/item/9789240023567 (accessed on 15 May 2024).
  27. Oakley, P. Making Mercury’s Histories: Mercury in Gold Mining’s Past and Present. ambix 2023, 20, 77–98. [Google Scholar] [CrossRef] [PubMed]
  28. Althomali, R.H.; Abbood, M.A.; Saleh, E.A.M.; Djuraeva, L.; Abdullaeva, B.S.; Habash, R.T.; Alhassan, M.S.; Alawady, A.H.R.; Alsaalamy, A.H.; Najafi, M.L. Exposure to heavy metals and neurocognitive function in adults: A systematic review. Environ. Sci. Eur. 2024, 36, 18. [Google Scholar] [CrossRef]
  29. Kim, J.H.; Na, J.E.; Lee, J.; Park, Y.E.; Lee, J.; Choi, J.H.; Heo, N.Y.; Park, J.; Kim, T.O.; Jang, H.J.; et al. Blood Concentrations of Lead, Cadmium, and Mercury Are Associated With Alcohol-Related Liver Disease. J. Korean Med. Sci. 2023, 38, e412. [Google Scholar] [CrossRef] [PubMed]
  30. Anderson, E.; Browne, N.; Duletsky, S.; Raming, J.; Warn, T. Development of Statistical Distributions or Ranges of Standard Factors Used in Exposure Assessments 1985, 59. Available online: https://nepis.epa.gov/Exe/ZyPDF.cgi/91007IEM.PDF?Dockey=91007IEM.PDF (accessed on 12 March 2024).
  31. Budnik, L.T.; Casteleyn, L. Mercury Pollution in Modern Times and Its Socio-Medical Consequences. Sci. Total Environ. 2019, 654, 720–734. [Google Scholar] [CrossRef] [PubMed]
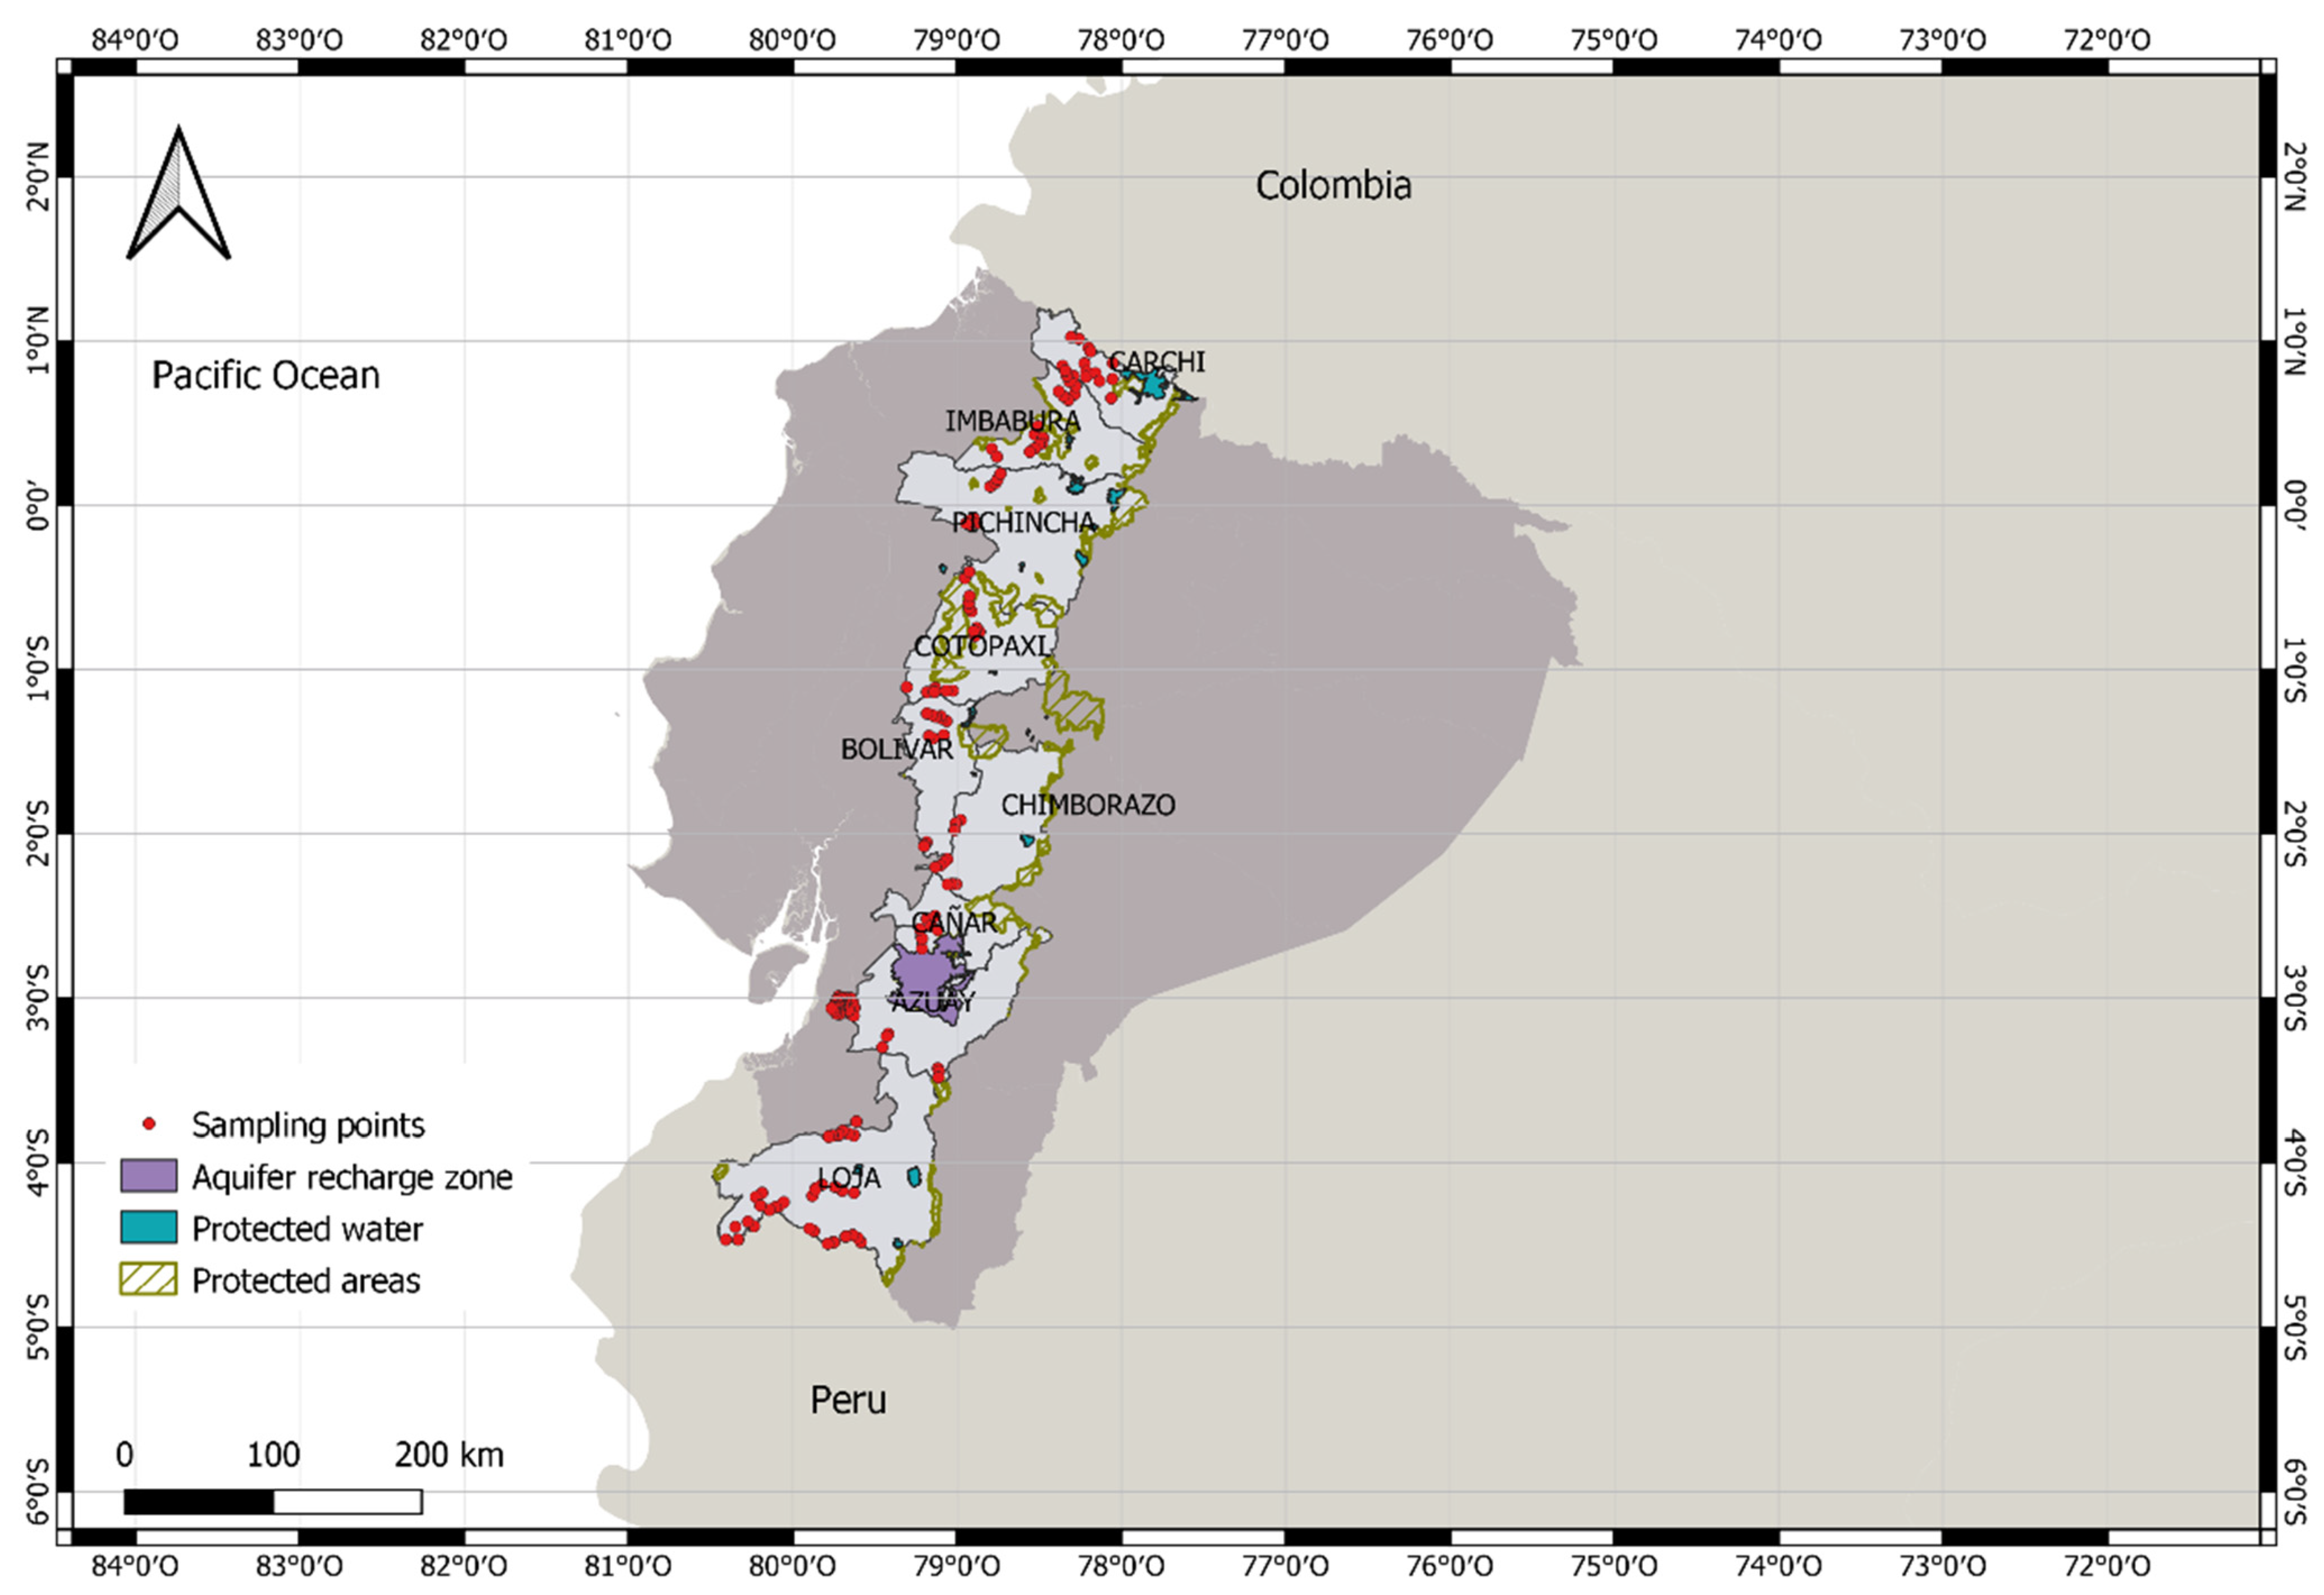
Figure 1. Study area and location of the sampled sites.
Resources 13 00084 g001
Figure 2. Hg concentrations at the sampled sites.
Resources 13 00084 g002
Figure 3. Hazard quotient (HQ) intended for adults in recurrence scenarios.
Resources 13 00084 g003
Figure 4. Hazard quotient (HQ) intended for children in recurrence scenarios.
Resources 13 00084 g004
Figure 5. Hazard quotient (HQ) for adults in recreational scenarios.
Resources 13 00084 g005
Figure 6. Hazard index (HI) for children in recreational scenarios.
Resources 13 00084 g006
Figure 7. Boxplots of the hazard index (HI) for both receptors. The prefixes C and A refer to children and adult receptors respectively, while the suffixes -res and -ricr refer to the residential and recreational scenarios.
Resources 13 00084 g007
Figure 8. Histograms of probability densities for different receptors and scenarios.
Resources 13 00084 g008
Figure 9. Location of sampling points with respect to areas contaminated by mining activities (general pollution).
Resources 13 00084 g009
Table 1. Parameters used in the risk assessment.
ParameterPoint Value
EFresidential (day/year) a350
EFrecreational (day/year) a120
ETresidential (hour/event) b0.22
ETrecreational (hour/event) a2.6
IRresidential (L/day) aA = 2.04; C = 1.28
IRrecreational (L/day) aA = 0.053; C = 0.090
ED (year) b,dA = 30; C = 6
SA (cm2) b,e,fA = 23,000; C = 7280
Bw (kg) e,fA = 72; C = 15.6
a [24]; b [25]; d [26]; e [27]; f [10]. Where ‘A’ indicates values used for adult receptors and ‘C’ indicates values used for child receptors.
Table 2. Hg accumulation (mg/L) in groundwater samples.
ProvincenMin–Maxp50S.D.
Charchi140.00025–0.00450.00110.00115
Imbabura190.00025–0.00430.000250.00115
Pichincha110.00025–0.00430.00110.00137
Cotopaxi170.00025–0.00330.000250.00087
Bolivar160.00025–0.00410.000250.00129
Chimborazo6***
Cañar70.00025–0.00220.00110.00081
Azuay460.00025–0.00890.00110.00317
Loja390.00025–0.00890.000250.00286
*: Data with minimum results according to the measuring device (LoD = 0.0005 mg/L) are presented below; for analysis purposes, a so-called present value (LoD/2 = 0.00025 mg/L) was assumed. Percentiles are referred to as minimum data over a certain percentage present. That is to say, p50 translates as a maximum value below which 50% falls.
Table 3. Analysis performed using the traditional Deterministic Risk Index (p95) for Hg in groundwater for receptors and human welfare scenarios.
ProvinceParameterResidential ScenarioRecreational Scenario
AdultsChildrenAdults Children
CharchiHQ_ingestion3.08 × 10−18.92 × 10−12.74 × 10−32.15 × 10⁻²
HQ_dermal contact8.62 × 10−31.26 × 10−23.49 × 10−25.10 × 10⁻²
HI 3.17 × 10−19.04 × 10−13.77 × 10−27.25 × 10−2
ImbaburaHQ_ingestion3.89 × 10−11.13 × 1002.02 × 10−41.58 × 10⁻³
HQ_dermal contact3.37 × 10−24.92 × 10−21.37 × 10−11.99 × 10⁻¹
HI 4.23 × 10−11.18 × 1001.37 × 10−12.01 × 10⁻¹
PichinchaHQ_ingestion3.44 × 10−19.97 × 10−13.07 × 10−32.40 × 10⁻²
HQ_dermal contact2.98 × 10−24.35 × 10−21.21 × 10−11.76 × 10⁻¹
HI 3.74 × 10−11.04 × 1001.24 × 10−12.00 × 10⁻¹
CotopaxiHQ_ingestion2.54 × 10−17.34 × 10−12.26 × 10−31.77 × 10⁻²
HQ_dermal contact2.19 × 10−23.21 × 10−28.89 × 10−21.30 × 10⁻¹
HI 2.76 × 10−17.66 × 10−19.12 × 10−21.48 × 10−1
BolivarHQ_ingestion2.90 × 10−18.39 × 10−12.58 × 10−32.02 × 10⁻²
HQ_dermal contact2.51 × 10−23.66 × 10−21.02 × 10−11.48 × 10⁻¹
HI 3.15 × 10−18.76 × 10−11.04 × 10−11.69 × 10−1
ChimborazoHQ_ingestion2.26 × 10−26.56 × 10−22.02 × 10−41.58 × 10⁻³
HQ_dermal contact1.96 × 10−32.86 × 10−37.94 × 10−31.16 × 10⁻²
HI 2.46 × 10−26.84 × 10−28.14 × 10−31.32 × 10−2
CañarHQ_ingestion1.99 × 10−15.77 × 10−11.77 × 10−31.39 × 10⁻²
HQ_dermal contact1.72 × 10−22.52 × 10−26.99 × 10−21.02 × 10⁻¹
HI 2.16 × 10−16.02 × 10−17.16 × 10−21.16 × 10−1
AzuayHQ_ingestion7.53 × 1002.18 × 1016.70 × 10−25.25 × 10⁻¹
HQ_dermal contact6.51 × 10−19.51 × 10−12.64 × 1003.85 × 100
HI 8.18 × 1002.27 × 1012.71 × 1004.38 × 100
LojaHQ_ingestion6.81 × 1001.97 × 1016.07 × 10−24.75 × 10⁻¹
HQ_dermal contact5.89 × 10−18.61 × 10−12.39 × 1003.49 × 100
HI 7.40 × 1002.06 × 1012.45 × 1003.96 × 100
Table 4. Determinism values (p95) of Hg in groundwater broken down by the different receptors and scenarios evaluated.
ProvinceParameterResidential ScenarioRecreational Scenario
AdultsChildrenAdults Children
CharchiHQ_ingestion9.96 × 10−22.88 × 10−18.87 × 10−46.95 × 10⁻³
HQ_dermal contact8.62 × 10−31.26 × 10−23.49 × 10−25.10 × 10⁻²
HI 1.08 × 10−13.01 × 10−13.58 × 10−25.80 × 10−2
ImbaburaHQ_ingestion2.26 × 10−26.56 × 10−21.05 × 10−38.22 × 10⁻³
HQ_dermal contact1.96 × 10−32.86 × 10−37.94 × 10−31.16 × 10⁻²
HI 2.46 × 10−26.84 × 10−28.99 × 10−31.98 × 10−2
PichinchaHQ_ingestion6.11 × 10−21.77 × 10−15.45 × 10−44.27 × 10⁻³
HQ_dermal contact5.29 × 10−37.73 × 10−32.14 × 10−23.13 × 10⁻²
HI6.64 × 10−21.85 × 10−12.20 × 10−23.56 × 10⁻²
CotopaxiHQ_ingestion2.26 × 10−26.56 × 10−22.02 × 10−41.58 × 10⁻³
HQ_dermal contact1.96 × 10−32.86 × 10−37.94 × 10−31.16 × 10⁻²
HI2.46 × 10−26.84 × 10−28.14 × 10−31.32 × 10⁻²
BolivarHQ_ingestion2.26 × 10−26.56 × 10−22.02 × 10−41.58 × 10⁻³
HQ_dermal contact1.96 × 10−32.86 × 10−37.94 × 10−31.16 × 10⁻²
HI2.46 × 10−26.84 × 10−28.14 × 10−31.32 × 10⁻²
ChimborazoHQ_ingestion2.26 × 10−26.56 × 10−22.02 × 10−41.58 × 10⁻³
HQ_dermal contact1.96 × 10−32.86 × 10−37.94 × 10−31.16 × 10⁻²
HI2.46 × 10−26.84 × 10−28.14 × 10−31.32 × 10⁻²
CañarHQ_ingestion9.06 × 10−22.62 × 10−18.07 × 10−46.32 × 10⁻³
HQ_dermal contact7.84 × 10−31.14 × 10−23.18 × 10−24.64 × 10⁻²
HI9.84 × 10−22.74 × 10−13.26 × 10−25.27 × 10⁻²
AzuayHQ_ingestion9.96 × 10−12.88 × 1008.87 × 10−36.95 × 10⁻²
HQ_dermal contact8.62 × 10−21.26 × 10−13.49 × 10−15.10 × 10⁻¹
HI1.08 × 1003.01 × 1003.58 × 10−15.80 × 10⁻¹
LojaHQ_ingestion2.26 × 10−16.56 × 10−12.02 × 10−31.58 × 10⁻²
HQ_dermal contact1.96 × 10−22.86 × 10−27.94 × 10−21.16 × 10⁻¹
HI2.46 × 10−16.84 × 10−18.14 × 10−21.32 × 10⁻¹
Table 5. Parameters used in probabilistic risk assessment.
ParameterUnitsPoint EstimateDistributionReference
EFresidentialday/year350Triangular: 345 (180–365)a
EFrecreationalday/year Triangular: 120 (26–260)a
ETresidentialhour/event0.22 a
ETrecreationalhour/event2.6Triangular: 2.6 (0.5–6)b
IRresidentialL/dayA = 2.04; C = 1.28 a
IRrecreationalL/dayA = 0.053; C = 0.090 c
EDadultsyear30Lognormal: 11.36 ± 13.72d
EDchildrenyear6Uniform: 1–6b
SAadultscm223,000Normal: 18,400 ± 2300e; f; b
SAchildrencm27280Normal: 6800 ± 600
BWadultskg Normal: 72 ± 15.9e; f
BWchildrenkg15.6Normal: 15.6 ± 3.7
a [24]; b [30]; c [31]; d [26]; e [27]; f [10].
Disclaimer/Publisher’s Note: The statements, opinions and data contained in all publications are solely those of the individual author(s) and contributor(s) and not of MDPI and/or the editor(s). MDPI and/or the editor(s) disclaim responsibility for any injury to people or property resulting from any ideas, methods, instructions or products referred to in the content.