1. Introduction
In 2023, Brazil secured its position as the 15th largest wine producer worldwide, yielding 2.9 million hectoliters, or 1.1% of the global wine output [
1]. Data from the Brazilian Institute of Geography and Statistics [
2] showed that as of February 2022, Brazil had 75,440 hectares dedicated to vineyards. Notably, 62.5% of these vineyards, encompassing 47,062 hectares, were situated in Rio Grande do Sul. Research from EMBRAPA [
3] reveals that Rio Grande do Sul contributes over 90% of the nation’s wine production and 85% of its sparkling wines. Moreover, the state reached its highest grape production in 2021, harvesting 11.2 million tons [
2].
Most vineyards in Rio Grande do Sul are family owned, with an average size of 17.07 hectares per property, in 2015 [
3]. By October 2023, according to SEBRAE [
4], the state boasted 702 wineries, primarily concentrated in the municipalities of Flores da Cunha, Bento Gonçalves, and Caxias do Sul, with counts of 131, 84, and 83 wineries, respectively. Most of these establishments are classified as microenterprises or small businesses, highlighting their crucial role in local economies. These municipalities not only lead in the number of wineries but are also in grape producers within the Caxias do Sul Microregion (MR Caxias do Sul).
MR Caxias do Sul stands out as the main grape-producing region in Rio Grande do Sul, hosting 79.7% (11,488) of the properties and covering 63% (158,857 hectares) of the vineyard area. As a result, grape-producing properties occupy 32.73% of the microregion’s territory [
5]. This concentration underscores the region’s pivotal role in the viticulture sector of Rio Grande do Sul, shaping its agricultural landscape and economic output.
Over the past decade, the global wine industry has actively engaged with the challenges posed by climate change. Through the International Organization of Vine and Wine (OIV), the industry has adopted three key resolutions aimed at reducing greenhouse gas emissions: OIV-CST 431/2011 [
6], which sets out general principles for the GHG protocol; OIV-CST 503AB/2015 [
7], which pertains to emissions inventory; and the OIV Collective Expertise Document 2017 [
8]. This engagement is further evidenced by the prevalence of at least 12 specific environmental labels for viticulture, as reported by Moscovidi and Reed [
9].
Despite these global efforts and the significant market potential for sustainably certified wines, Brazil’s wine industry currently lacks targeted sustainability certifications. This gap is underscored by a notable absence of environmental studies within the sector, as multiple Life Cycle Assessment (LCA) studies have failed to identify any research conducted in Brazil [
10,
11,
12,
13].
In our research, we have found only three LCA studies related to wine production in Brazil, but none of these studies analyze the production process itself. Dal Molin [
14] focused on evaluating grape production activities in Bento Gonçalves and Flores da Cunha to develop a Life Cycle Inventory (LCI) for Brazil’s National Database of Life Cycle Inventories (SICV Brasil). Silva et al. [
15] conducted a review of global LCA studies in viticulture. Additionally, Dicezare [
16] assessed the life cycle of wine bottles in São Paulo using the CES Edupack 2019 software.
Thus, among the studies identified, one is an undergraduate thesis [
16], another is a review study [
15], and the third contributes data for an LCI [
14], but none constitute a peer reviewed LCA. Consequently, there are no LCA studies specifically developed for the Brazilian wine industry. This represents a critical research gap that we need to address to enhance the environmental stewardship of Brazil’s wine sector.
Broadening our examination to encompass the entire South American region, we discovered only one relevant Life Cycle Assessment (LCA) study within the wine sector, conducted by Letamendi, Sevigne-Itoiz, and Mwabonje [
17] in Chile. This study specifically focused on an organic winery, highlighting the scarcity of comprehensive LCA research in the regional wine industry. This singular finding highlights a broader regional limitation in LCA research within Latin America, contrasting sharply with the numerous studies available from other continents.
This scarcity of regional studies is particularly striking given Brazil’s ambitious environmental commitments regarding climate change. The country has pledged to reduce its greenhouse gas emissions by 37% by 2025 and 43% by 2030 from 2005 levels [
18]. The formalization of this commitment began with the National Policy on Climate Change (Federal Law No. 12.187/09), which set projected emission reductions at 36.1% to 38.9% by 2020 [
19]. Subsequent regulation under Decree No. 9.578/18 further detailed these targets, estimating 2020 emissions at 3,239 million tons CO
2e, with agriculture contributing 730 million tons CO
2e (22.5%) and industrial processes and waste treatment adding another 234 million tons CO
2e (7.2%) [
20].
While Greenhouse Gas Inventories are crucial for evaluating the environmental impacts of industries, including the wine sector, they are not without limitations. Lauret, Olsen, and Hauschild [
21] examined these limitations, particularly the risks associated with relying solely on the carbon footprint as an environmental indicator. They caution that such focused assessments can inadvertently skew decision-making processes toward interventions that only mitigate greenhouse gas emissions, potentially neglecting other environmental impacts like the use of ecotoxic products. This critique underlines the need for a more holistic approach to environmental impact assessments within industries, especially those as integral as viticulture.
In our study, we utilize Life Cycle Assessment (LCA) as a comprehensive method for evaluating the environmental impacts associated with the entire life cycle of a product. As outlined by ISO 14040, LCA systematically compiles and evaluates the inputs, outputs, and environmental impacts of a product system from inception to end of life [
22]. Recognized by the European Commission as the premier tool for assessing the potential environmental impacts of products, LCA not only appraises current impacts but also aids in identifying strategies for impact reduction [
23,
24].
Our research specifically addresses the noticeable gap in LCA studies within Brazil’s wine industry, with a focus on identifying critical environmental hotspots and significant flows throughout the wine production process. Despite the availability of numerous studies on wine production globally [
12,
25,
26,
27], research detailing the vinification stage remains sparse, often treating it as a monolithic process without distinguishing between its constituent steps [
28].
To address this deficiency, we conducted a Life Cycle Assessment for the wine production industry in the Serra Gaúcha region, which examined the environmental impacts associated with the production of both red and white wines. The focus of our study, a prominent national enterprise, stands as the largest winery in Brazil [
29]. Since 2005, this company has been the leading producer of Brazilian sparkling wines [
30]. In 2021, it distributed 24.5 million bottles, including sparkling wines, wines, and non-alcoholic beverages, and extended its market reach to 30 countries [
30]. This comprehensive LCA aims to provide a clearer understanding of the environmental footprint of wine production and offers insights into potential areas for environmental improvement within the industry.
2. Wine Production LCA Review
Life Cycle Assessment (LCA) studies on wine production are prominent in the scientific literature, making this one of the most extensively studied areas within the agri-food sector, as evidenced by numerous cradle-to-grave LCAs [
27]. In our analysis, we reviewed 40 articles on wine production published between 2010 and 2022. The majority of these studies were conducted in Europe, with Italy leading with 14 articles, followed by Spain with 7, the USA with 5, and Portugal with 3.
Further corroborating our findings, Ferrara and De Feo [
12] analyzed 33 articles up to 2017 concerning grape and wine production. They noted that 61% of the studies were concentrated on Italian wine systems, 12% on Spanish, and the remaining 27% spanned other regions including Australia, Canada, New Zealand, Cyprus, and the USA. Additionally, their review revealed that 52% of the studies focused on specific types of wine, 23% on the viticulture phase, and 9% on peripheral aspects such as packaging production or waste treatment.
Jourdaine et al. [
26] reviewed 10 wine LCA studies with the goal of seeking methodological harmonization due to the significant discrepancies observed. A notable discord among these studies included the omission of compost transport during the viticulture phase and the exclusion of passenger travel in the consumption phase, both of which Vázquez-Rowe et al. [
31] and Point, Tyedmers, and Naugler [
32] identified as having substantial impacts. Moreover, Jourdaine et al. [
26] found that the predominant environmental impact categories, accounting for 90% of total impacts, were climate change, particulate matter, fossil depletion, terrestrial ecotoxicity, and occupation of agricultural land.
Another vital element of our research involves analyzing the varying environmental impacts produced by different types of wines. Lannone et al. [
28] examined the environmental impacts of four wine types: High-Quality Red, Medium-Quality Red, High-Quality White, and Medium-Quality White. Their study revealed that High-Quality Red Wine exhibited the most significant environmental impact, attributed primarily to its prolonged maturation period of 24 months in a controlled temperature environment. This finding underscores the importance of considering production techniques and their environmental implications in the assessment of wine’s life cycle impacts.
Building on this understanding of how production techniques influence environmental outcomes, Martins et al. [
33] conducted a comparative analysis of the environmental impacts associated with the production of brand wine and terroir wine. Their findings revealed that, although terroir wine generally exhibited a slightly higher environmental impact—less than 10% across most categories—the brand wine had more than double the impact in terms of water consumption and effluent generation. This variance highlights how different practices in wine production can significantly influence LCA outcomes.
Pizzigallo, Granai, and Borsa [
34] applied LCA to evaluate emissions differences between an organic wine farm and a semi-industrial one, discovering that the semi-industrial farm’s emissions were two to three times higher than those of the organic farm. Similarly, Villanueva-Rey et al. [
35] observed a substantially lower environmental impact across all assessed categories, except land use, when comparing biodynamic to conventional viticulture.
Conversely, Falcone et al. [
36] integrated Life Cycle Assessment (LCA) with Life Cycle Costing (LCC) to evaluate a conventional grape plantation against an organic one, finding both economic and environmental advantages in the conventional system, primarily due to higher productivity. However, the authors cautioned that this assessment was not comprehensive, noting significant impacts not captured by the LCA, such as increases in local biodiversity and improvements in soil quality and organic content.
Furthermore, according to the PEFCR 2.0 method [
37], grape production is identified as the primary contributor to environmental impacts in categories such as terrestrial and aquatic acidification (42%), land use (75%), and the use of mineral resources and metals (84%). In the broader scope of wine production, the combined stages of wine production and packaging are the main contributors to climate change (52%), use of fossil resources (58%), and Particulate Matter (49%). This breakdown underlines the importance of each stage in the wine production process in terms of its environmental footprint.
Cichelli, Pattara, and Petrella [
38], who studied a wine produced in the mountains of Italy, also concluded that the viticulture phase was responsible for 88% of CO
2e emissions between viticulture and wine production, excluding packaging. These emissions primarily stemmed from fertilizers and, in regions where harvesting was mechanized, from equipment emissions.
Letamendi et al. [
17] observed in Chile that organic grape production’s environmental impacts were predominantly from viticulture at 39%, with bottling at 11.8% and distribution at 42.2%. These impacts largely stemmed from fertilizers, glass bottles, long-distance road transport, and to a lesser extent, energy consumption during viticulture and vinification. Echoing these findings, Harb, Zaydan, and Vieira [
24] pinpointed grape production as the primary hotspot for reducing environmental impacts in wine production, accounting for an average of 39% across impact categories.
Laca et al. [
39] evaluated the impact of mountain wines in Spain and identified similar main sources of environmental impacts. They found that the packaging stage, particularly the production of glass bottles, was responsible for more than 25% of the impacts in 12 of the 18 ReCiPe 2016 categories. Other significant sources of impact included grape production (stratospheric ozone depletion and land use categories), electricity (ionizing radiation), and waste treatment (in toxicity-related categories), as wastes were sent to landfills. The authors also noted that, despite the manual grape harvesting, high emissions resulted from employee and grape transportation and from the burning of organic materials, with the latter being a critical hotspot for emission reduction.
Further, Meneses, Torres, and Castell [
40] identified the glass bottle production as the main environmental burden in the production of red wine in Catalonia, Spain. This stage accounted for 10% to 80% of impacts across various categories, followed by the viticulture stage, which ranged from 17% to 84%, particularly due to pesticide application, soil preparation, and fertilization. They noted that the vinification stage contributed minimally, between 1% and 5%, to the overall environmental impact.
Lannone et al. [
28] reported that the vinification stage has often been overlooked and treated as a monolithic stage without detailed analysis of its constituent processes. Indeed, we found only three studies specifically focused on assessing the environmental impacts of distinct stages within the vinification process. Montalvo et al. [
41] evaluated the impact of fermentation using steel and concrete tanks and recommended steel tanks for reduced climate change impacts. Flor et al. [
42] investigated the life cycle of oak barrels used in wine production, finding significant impacts from the extraction and treatment of wood. Lastly, Margallo et al. [
43] assessed the environmental impacts of various dealcoholization technologies, contributing further insights into the specific stages of vinification. These studies highlight the need for more detailed evaluations within the vinification process to better understand and mitigate its environmental impacts.
Regarding the winemaking process in general, the production of the glass bottle and electricity consumption are often cited as primary environmental concerns. Litskas, Tzortzakis, and Stavrinides [
44] assessed the climate change impacts across 20 wine-producing farms, identifying glass bottle production (31%) and electrical energy usage in the winery (18%) as the most significant contributors, followed by heat used in the winery (11%), harvesting (9%), and diesel used in the vineyards (9%). This perspective is corroborated by Ponstein, Meyer-Aurich, and Prochnow [
45], who pinpointed bottle production and winery electricity usage as critical hotspots for reducing carbon footprints in wine production.
Furthermore, Vázquez-Rowe et al. [
31] noted that electricity usage during the vinification stage alone accounted for at least 93% of the environmental impact in five categories, including Climate Change. Zhang and Rosentrater [
46] also highlighted that bottle production (35%) and vinification (31%) were major contributors to energy consumption. They found that the vinification stage led in water consumption impacts (91%), while viticulture stages (38%) and bottle production (25%) had significant contributions to the greenhouse effect. Additionally, vinification (59%) and bottle production (32%) were major contributors to waste generation.
Bonamente et al. [
47] reported that the packaging and distribution stages are crucial in terms of both Carbon Footprint and Water Footprint, accounting for 56.1% and 41.1% of these indicators, respectively. Their study estimated impacts of 1.07 ± 0.09 kg CO
2e per bottle and 580 ± 30 L of water per bottle. These insights collectively highlight critical areas within the wine production process, where environmental impact reduction is both necessary and possible.
3. Materials and Methods
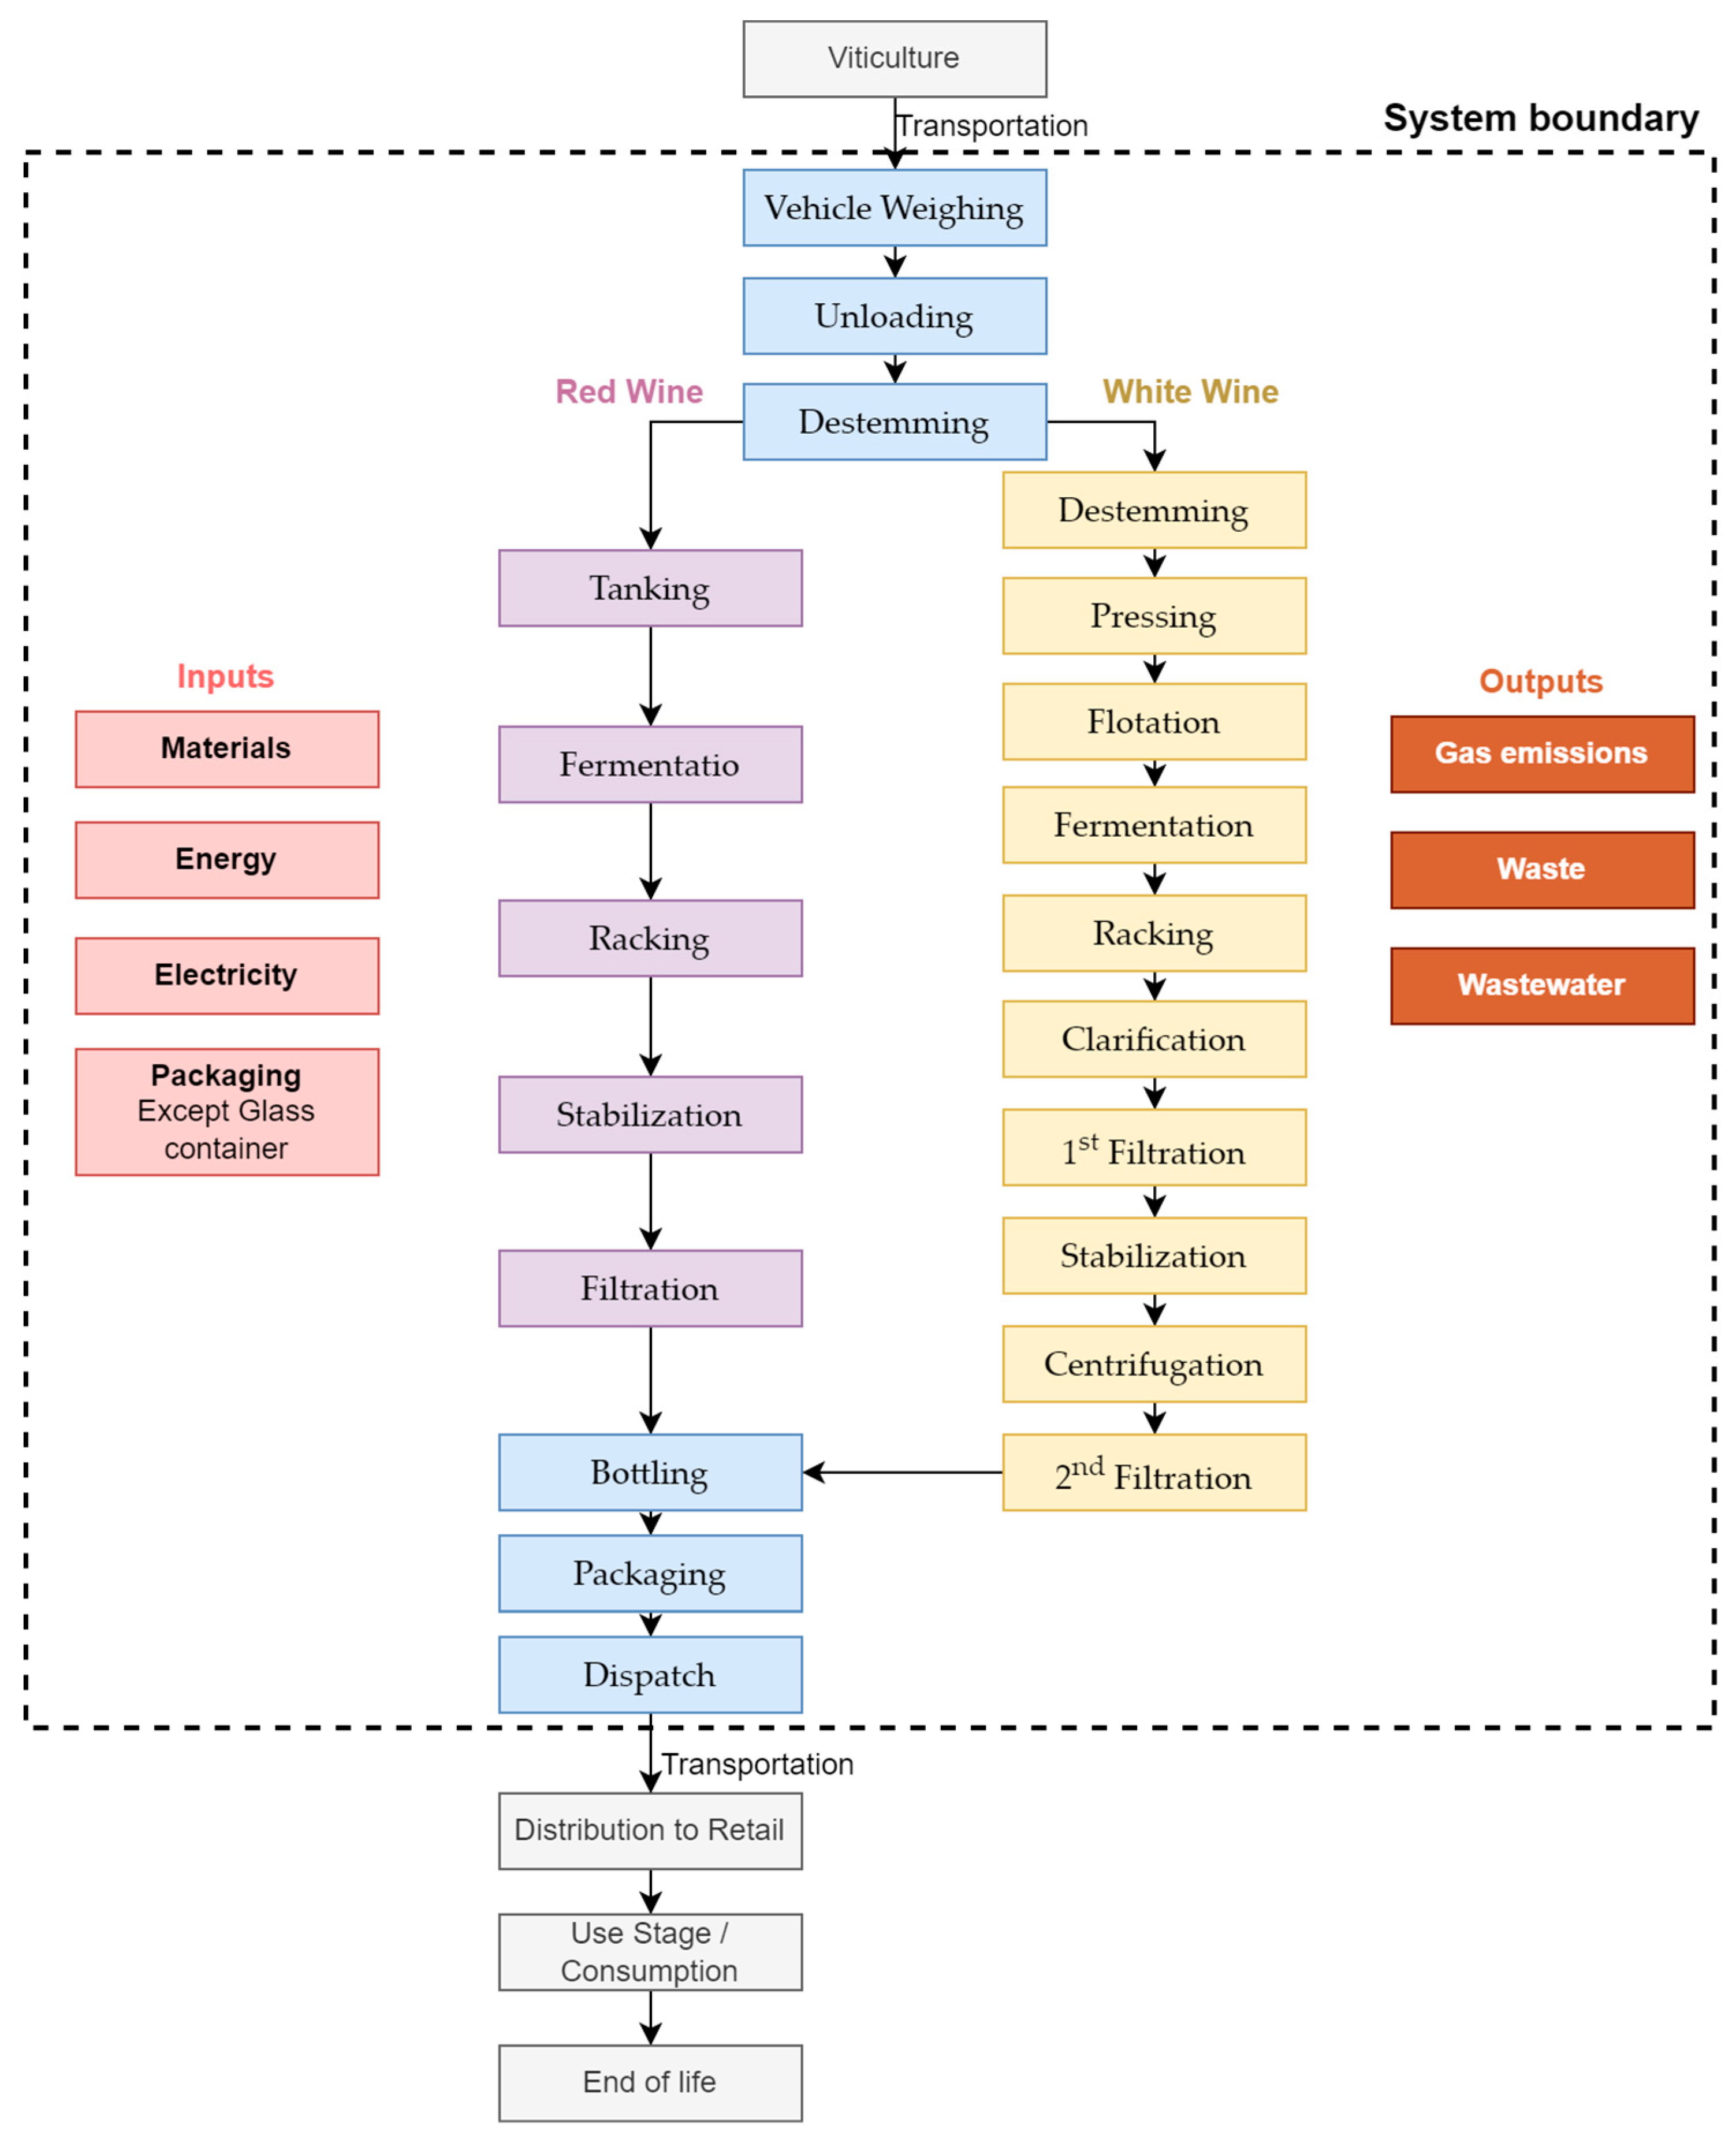
In this study, we conducted a detailed Life Cycle Assessment of red and white wine production at a traditional winery located in Bento Gonçalves, Rio Grande do Sul, Brazil, during the year 2020. The target company boasts an extensive product range, primarily focusing on the production of red and white wines, sparkling wines, and grape juice.
Thus, the red wine and white wine presented in this study do not represent specific wine brands within the company, but rather a virtual product that has characteristics proportional to the products (wine brands) that comprise it. It should be noted that these virtual products are mostly composed of common wines.
In 2020, the company utilized 13 grape varieties for its red wine production. Cabernet Sauvignon, used in 29% of production, was the most prevalent, followed by Merlot at 26% and Tannat at 16%. For white wine production, six grape varieties were used, with Chardonnay (33%) and Moscato Giallo (30%) being the most predominant, followed by Malbec (18%) and Malvasia (15%).
It is important to note that the production processes for the various products within the major categories of red and white wines are fundamentally similar; the primary variation lies in the quantities of raw materials used. The process steps for both red and white wines are illustrated in
Figure 1.
The functional unit (FU), which is the reference value for calculations in life cycle studies, typically involves the mass or volume of a single product unit. For this study, we adopted 750 mL as the FU, aligning with the standard practice in wine LCAs [
12,
25,
26,
27].
This assessment employed a Gate-to-Gate approach, focusing exclusively on operations within the company’s boundaries. Consequently, it did not include upstream processes such as vineyard planting, viticulture, and transportation of grapes to the winery, nor did it account for downstream stages like transportation of wine, distribution, consumption, and disposal.
3.1. Life Cycle Inventory
The company provided the data on input quantities and waste generated for this study. However, due to the absence of an individualized monitoring system for each process or product, we needed to rely on the total consumption of inputs and energy across the company and implement allocation criteria based on product prioritization. In this context, red wine accounts for 29.8% of the company’s production, white wine comprises 4.2%, and the remaining 66% pertains to the production of sparkling wines and grape juices, as detailed in
Table 1.
We conducted a survey with the employees responsible for the operation to estimate electricity consumption by electrical equipment and obtained the equipment power from either equipment data or the manufacturer’s manual. Similarly, we estimated lighting consumption by collaborating with company employees to survey the number of lamps in each area (unloading, industrial pavilion, and dispatch) and their power. Our study found that electric equipment for both wines accounts for 86.7% of the electricity consumption, while lighting accounts for the remaining 13.3%.
We used the proportion of electricity consumption among the four product lines as an allocation criterion for items related to equipment. This included diesel fuel consumption by generators, lubricating oil consumption (new and used), metallic scrap (resulting from maintenance), hazardous waste, and other non-hazardous waste.
The volumes of water used were determined based on the company’s total consumption, with proportional allocation to each product line. We considered the volume of wastewater generated (measured by the company), the volume evaporated by cooling towers (estimated based on the equipment), and water retained in sewage sludge. The remainder was considered water lost during the process. For the sewage sludge, we considered 70% as the liquid fraction, a value obtained from the analysis of the company’s sludge.
Since emissions vary significantly depending on the type of equipment, fuel characteristics, and system operation, and not all fuels used had equivalent combustion datasets, we standardized emissions from the diesel generator and natural gas combustion in forklifts using greenhouse gas emission factors from the PBGHG PROTOCOL [
48], as shown in
Table 2.
The waste modeling was based on the waste management practices used in the winery. As a result, it was necessary to create new datasets for some types of waste managements. The methodologies adopted for the main types of waste are detailed below:
- (a)
Used Lubricating Oil: This waste was sent for re-refining, utilizing a combination of 70% recycled lubricating oil and 30% used petroleum coke.
- (b)
Hazardous and Non-Hazardous Waste: These wastes were sent for co-processing in the cement industry. According to Resolution Consema RS 02/2000 [
49], it is considered that 0.27 kcal of heating is avoided for each kilogram of waste processed.
- (c)
Wood: This waste was recycled, with the practice estimated to avoid the extraction of 527 kg of wood per cubic meter of pallet.
- (d)
Other types of Waste: These were sent to recycling.
Table 3 and
Table 4 present the parameters and values adopted for input and output for red and white wine, respectively.
Given the significant environmental impact of glass bottle production in wineries [
47], this input is typically treated separately from the rest of the wine production process. Consequently, the results presented in this study exclude the impact associated with the wine bottle.
3.2. Life Cycle Inventory Analysis
We developed the Life Cycle Assessment (LCA) using OpenLCA software version 1.11. The primary source of datasets was the Ecoinvent 3.8 database, supplemented by datasets from Product Environmental Footprints V2.0 and Agribalyse 3.0.1. The use of LCIs from outside Brazil is a limitation of this study. Currently, the only national LCI database available is SICV Brazil, which is still in its early stages and contains only 218 datasets, a significantly lower number compared to Ecoinvent, which has over 20,000 inventory datasets in its latest version [
50]. The complete table of used datasets is available in the
Supplementary Materials.
This was a Physical Type LCA, therefore excluding assessments of economic or social impacts. Our aim was to provide a generalist LCA method to evaluate the environmental impacts generated by the process across various aspects. To achieve this, we sought methodologies with a greater number of indicators and factors. Consequently, we adopted the ReCiPe 2016 method for this study. Developed jointly by RIVM, Radboud University, Leiden University, and Pré Sustainability, ReCiPe 2016 is a modern and robust method with indicators adapted to various regions worldwide, including South America.
To highlight the most significant outcomes, we categorized the results according to the PEFCR 2.0 guidelines. The Product Environmental Footprint Category Rules (PEFCR) for still and sparkling wine, originally published in 2018, are currently in version 2.0, published in February 2020 [
37]. Developed by the European Commission, PEFCR aims to standardize LCA studies of wines within the European Union. The four impact categories recommended by PEFCR 2.0, based on the Environmental Footprint (EF) LCA method, and the six equivalent categories adopted in ReCiPe 2016 are as follows:
Climate change as global warming;
Particulate matter as fine particulate matter formation;
Resource use, fossil as fossil resource scarcity;
Acidification of terrestrial and freshwater as terrestrial acidification, freshwater ecotoxicity, and freshwater eutrophication.
Furthermore, we normalized the results in terms of the equivalent number of inhabitants using the normalization factors from ReCiPe 2016 [
51] and the weighting factors from Environmental Footprints 3.0 [
52].
The identification of hotspots and Most Relevant Flows was guided by the criteria established by Zampori et al. [
53]. They define hotspots as any combination of life cycle stages, processes, or elementary flows that contribute at least 50% to a given impact category, making them essential for companies’ decision-making processes and internal communication. Additionally, the authors specify that if the sum of these processes exceeds 80% or has at least 5% individual participation, they should be regarded as the Most Relevant Flows for decision making.
4. Results and Discussion
The comparison between red wine and white wine for each impact category is presented in
Table 5, showing the impact observed for red wine in relation to white wine.
Red wine generally has a slightly higher environmental impact than white wine, with an average impact that is 6% higher in both the PEFCR categories and the overall analyzed group. However, red wine demonstrates a lower impact in six categories, particularly in mineral resource scarcity, where its impact is 19% lower than that of white wine.
This variation arises from the differences in the production processes of red and white wine. Red wine uses a higher concentration of sugar, while white wine incorporates more liquid CO
2, affecting the impact categories in which each wine excels. According to
Table 3 and
Table 4, red wine production adds 15.6 g/FU of sugar, compared to 3.15 g/FU in white wine. In terms of CO
2, red wine adds 44.7 g/FU, while white wine adds 62.7 g/FU.
The most significant divergences between red and white wine are found in categories where the environmental effects of sugarcane production are most pronounced. For instance, red wine shows a notable advantage in the mineral resource scarcity category. Conversely, categories negatively impacted by sugarcane cultivation favor white wine, which performs better than red wine in categories such as water consumption (−28%), terrestrial acidification (−22%), fine particulate matter formation (−17%), and land use (−13%).
These results are also partially explained by the differences in electricity consumption between the two types of wine. White wine requires less electricity (2.06 MJ/FU) compared to red wine (3.03 MJ/FU). This difference significantly affects the water consumption category, where 77% of the impact for white wine is attributed to electricity consumption.
Table 6 presents the environmental impact values for red and white wine production, excluding the bottle, according to the ReCiPe 2016 method, along with their normalization scores (functional units per person).
First, we highlight the results for the PEFCR categories. During the production of 1 FU (750 mL) of red wine, emissions include 287.5 g of CO
2e, 0.52 g of PM2.5
e, 46.6 g of oil eq, 9.15 g of 1,4-DCB
e, 0.061 g of P
e, and 1.4 g of SO
2e Similarly, for white wine, 1 FU (750 mL) results in emissions of 29.2 g of CO
2e, 0.43 g of PM2.5
e, 45.1 g of oil eq, 9.5 g of 1,4-DCB
e, 0.063 g of P
e, and 1.1 g of SO
2e. It is important to note that the carbon footprint indicator for climate change results (CO
2e) in the ReCiPe 2016 method is derived from the IPCC 2013 method [
54].
Regarding normalization factors, we observed that, on average, the production of 471,443 bottles of red wine and 441,970 bottles of white wine corresponds to the impact generated by one person per year. This average excludes the highest (mineral resource scarcity) and lowest (human non-carcinogenic toxicity) values due to significant variation among impact categories.
At first glance, similar results appear when considering the PEFCR average. However, this similarity is primarily due to the low impact values obtained for the fossil resource scarcity category. When this category is disregarded, the PEFCR average reduces to 118,975 FU/person for red wine and 136,270 FU/person for white wine, revealing a significant discrepancy between the “PEFCR average” and the “all impact categories average”.
We also noted that the categories with the highest normalized impacts in the production process for both red and white wine are related to toxicity: non-human carcinogenic toxicity (1st), freshwater ecotoxicity (2nd), and human carcinogenic toxicity (3rd).
It is noteworthy that the PEFCR categories did not stand out when applying normalization factors. The ranking based on these factors placed freshwater ecotoxicity in 2nd, freshwater eutrophication in 5th, global warming in 8th, terrestrial acidification in 9th, fine particulate matter formation in 13th, and fossil resource scarcity in 16th. This finding suggests that the PEFCR categories for winemaking may not represent the most significant impacts in the Brazilian context, requiring cautious application.
Recognizing this limitation, we proposed new recommended impact categories, considering the normalized results and weighting them based on the Environmental Footprints 3.0 weight factors, presented in
Table 7.
Given that both red and white wine showed similar results, adopting different impact categories for each would not be suitable. We identified seven impact categories that encompass 79% of the impacts in red wine and 80% in white wine: global warming, water consumption, freshwater ecotoxicity, fossil resource scarcity, carcinogenic human toxicity, marine ecotoxicity, and freshwater eutrophication. Selecting this 80% threshold aligns with the criterion introduced by Zampori et al. [
53] for delineating significant flows and corresponds to the criterion embraced by PEFCR 2.0 for identifying significant impact categories.
These results are more comprehensive than those obtained by adopting PEFCR 2.0 classes, as the recommended categories account for 79% of the impacts in red wine and 80% in white wine, compared to only 54% and 56% for the PEFCR 2.0 classes, respectively.
To further evaluate the scope of these six categories, we also verified their classification using the ReCiPe endpoint, which groups the classes into five major impact groups: terrestrial ecosystems, aquatic ecosystems, marine ecosystems, human health, and resources. The classification of these six categories is presented in
Table 8.
As shown in
Table 8, the six identified impact categories cover all five endpoint classes: aquatic ecosystems (four times), human health (three times), terrestrial ecosystems (twice), marine ecosystems (once), and resources (once). In contrast, the PEFCR categories do not include the marine ecosystem class, highlighting another limitation in using this set of impact categories.
4.1. Comparison with Other Countries
Methodological differences in Life Cycle Assessment (LCA) studies significantly impede drawing conclusions about the sustainability of different products or identifying the most significant impacts within the wine industry [
25]. ISO 14040 itself clarifies that comparisons between LCA studies are feasible only when the assumptions and contexts of the studies are equivalent [
21]. Furthermore, ISO 14025 [
55] specifies 11 conditions that must be met to allow comparability between Type III environmental declarations, which are based on LCA.
Considering these limitations and the importance of comparing Brazilian results with those from other countries, we present findings from other LCA studies juxtaposed with the results of this study.
To compare Brazilian results with those of other wine-producing countries,
Table 9 presents five recent studies (since 2018) involving LCAs of wineries developed in European countries and Lebanon, showing values obtained for Carbon Footprint and electricity consumption for the production of one functional unit (0.75 L).
We chose carbon footprint (or global warming, in ReCiPe 2016) due to its adoption as an indicator in most studies and as a reference indicator in PEFCR 2.0. It is important to note that, as previously explained, the carbon footprint indicator from ReCiPe 2016 is based on the IPCC 2013 method.
As noted in
Table 9, the values obtained in this study are similar to those observed in other countries. They are higher than the values reported in studies from Germany, Cyprus, and part of Lebanon but lower than those from Italy, Portugal, and another part of Lebanon. With an average of 0.365 kg CO
2e per 0.75 L across the studies, Brazilian values can be considered below average.
The methodological differences among the studies make it challenging to pinpoint the exact causes of this variation. However, the low emission factor for electricity in southern Brazil (0.2223 kg CO
2e/0.75 L), compared to those from other countries in
Table 9, likely contributes to the lower emissions observed. This can be attributed to Brazil’s predominantly hydroelectric power generation, which results in low emissions due to minimal use of fuels for heating (diesel or natural gas) by the winery [
57].
Despite the low emission rate per kWh, the electricity consumption in the Brazilian winery exceeds the average observed in the other studies evaluated. This combination of high electricity consumption and a low emission factor results in the median impact values obtained in this study. These findings suggest that the Brazilian winery lower than average carbon footprint for wine production is largely due to its clean energy mix. However, high electricity consumption remains a concern and presents an opportunity for further improvement in sustainability practices.
4.2. Hotspots and Most Significant Flows
Table 10 presents all flows that contributed more than 5% to each impact category. Most relevant flows are similar between red and white wine, including electricity, sugar, CO
2 production, cardboard, N
2, metals, aluminum, nutrients, and CO
2 emissions (for the global warming category). Due to differences in production processes, some flows are unique to one type of wine: SO
2, gum arabic, and tartaric acid for red wine; activated bentonite and enzymes for white wine.
The number of relevant flows to be monitored varies by impact category, averaging six. The three hotspots (electricity, sugar, and CO
2 production) and two of the most relevant flows (cardboard and N
2) are common across both wines. The sixth most relevant flow differs by wine type, with SO
2 for red wine and enzymes for white wine. It is worth highlighting that electricity is consistently identified as a significant parameter, with PEFCR indicating it as the most relevant flow for the industrial stage and glass bottles for the packaging stage [
37].
The land use category requires the fewest flows to be monitored (2), while five categories require monitoring of eight indicators. For both wines, the highest monitoring demand occurs in the ecotoxicity categories (freshwater, marine, and terrestrial), mineral resource depletion, and non-carcinogenic human toxicity.
Both the PEFCR and recommended categories requires monitoring 12 indicators for both red and white wine: electricity, sugar, CO2 production, cardboard, N2, metals, aluminum, effluents, CO2 emissions, SO2, bentonite, and enzymes. Additionally, though not included in this analysis, monitoring of glass bottles is essential.
Table 11 summarizes the results, showing the quantities and percentages of participation in impact categories as hotspots and most relevant processes for the main flows.
Among the 15 most relevant flows, three (gum arabic, tartaric acid, and nutrients) are not considered essential for evaluating the indicators of PEFCR 2.0 or the recommended impact categories. However, five flows have proven to be especially relevant for both wines: electricity, sugar, CO2 production (considered hotspots), and, to a lesser extent, N2 production and cardboard used in packaging. Therefore, we provide further discussion on these five indicators below.
Table 12 and
Table 13 summarize the percentages of the total environmental impact, by impact category, for electricity, sugar, CO
2 production, N
2, and cardboard, for red wine and white wine, respectively.
An important conclusion from these tables is that, for the PEFCR categories, recommended categories, and all categories in the ReCiPe 2016, the use of these five processes accounts for approximately 80% of the impacts on average. This indicates that they are generally the most relevant processes for planning purposes, necessitating further quantification. Additionally, electricity, sugar, and liquid CO2 production constitute the largest impacts during the production of both red and white wines.
While most of the relevant indicators show similarity across the averages of all categories, PEFCR, and recommended categories, there is a significant discrepancy for sugar. In both wines, the impact percentage of sugar is underestimated, accounting for 24% on average across All categories, compared to 15% for recommended categories and 16% for PEFCR (red wine). This discrepancy is explained by the categories where sugar has the highest percentage impact—land use (60%), marine eutrophication (47%), and atmospheric ozone depletion (33%)—which are not part of either PEFCR or recommended categories. These categories rank 13th, 15th, and 16th, respectively, after normalization and weighting, indicating that despite their low overall relevance, they are disproportionately affected by sugar. This requires greater attention to these categories in actions involving this input. To a lesser extent, water consumption, part of the recommended categories, and non-carcinogenic human toxicity also proved relevant in assessing sugar environmental impact. The values obtained for water consumption exceeding 100% are due to the negative impact generated by effluent treatment, which results in an impact of −13.4% in red wine and −10.9% in white wine.
For red wine, the main environmental impact is generated by electricity consumption, accounting for an average of 33% of the impacts among all impact categories, or 35% considering only the PEFCR categories. However, there is a high variation among the impact categories, ranging from 13% for freshwater toxicity to 82% for water consumption. The higher water consumption in electricity is related to the Brazilian electrical grid, which is predominantly composed of hydropower (87%) in the southern region of Brazil [
57]. It is noteworthy that in multiple studies, electricity is also identified as the main source of impact in winemaking processes, after the glass bottles [
31,
44,
45,
47].
The second-largest impact is attributed to sugar, which accounts for an average of 21% of the impacts but drops to 16% for the PEFCR categories. This input also showed considerable variability among the categories, with the lowest values for the ionizing radiation category (4%) and the highest for land use (60%). Notably, categories related to climate change, such as global warming (9%) and fossil resource scarcity (8%), displayed low values. This variability indicates the need for caution in studies based solely on GHGs when evaluating the environmental impact of sugar production.
The impact generated by the liquid CO2 added to the process proved less significant in four categories (land use, marine eutrophication, stratospheric ozone depletion, and water consumption) but very significant in categories related to toxicity, such as terrestrial ecotoxicity (34%), marine ecotoxicity (23%), and freshwater ecotoxicity (21%).
White wine presented similar results to red wine; however, due to the lower addition of sugar and higher addition of CO2, there is a variation in the most significant impact categories. For white wine, electricity showed the highest average impact (25%), followed by sugar (20%) and liquid CO2 (19%), with the remaining impacts totaling 34%. When considering only the PEFCR categories, there is a reversal in the positions of sugar and CO2, with sugar accounting for 14% of the impacts and CO2 for 20%. This discrepancy arises because the PEFCR emphasizes categories related to climate change more than those related to toxicity/ecotoxicity.
The significant contributions of electricity, sugar, and liquid CO2 to the impacts of both red and white wines indicate that the most impactful process stages are precisely those where these three items are most prevalent.
Lastly, as previously explained, when focusing only on the recommended impact categories we identified 12 most relevant flows. These include electricity, sugar, CO
2 production, cardboard, N
2, metals, aluminum, effluents, CO
2 (emissions), SO
2, bentonite, and enzymes. When evaluating the 18 categories of ReCiPe 2016, 15 flows are necessary, adding gum arabic, tartaric acid, and nutrients. This assessment is significantly simpler than that required by PEFCR 2.0, which mandates evaluating 79 flows [
37]. It is important to note that these flows do not include the impact of the glass bottle, which remains a critical component of the wine production process.
This result provides crucial guidance for future stages of the life cycle inventory of Brazilian wineries by pinpointing the flows that require greater attention. By simplifying the number of relevant flows, we can streamline the assessment process and focus on the most significant contributors to environmental impact. This targeted approach enhances the efficiency and effectiveness of sustainability initiatives within the wine industry.
5. Conclusions
This study presents the first Life Cycle Assessment (LCA) conducted for a Brazilian winery, utilizing data from a leading winery in the country’s primary wine-producing region, Serra Gaúcha. On average, white wine exhibited a 6% lower environmental impact compared to red wine across both the PEFCR categories and the overall average of all categories. However, notable variations exist among the categories: red wine performs better in mineral resource scarcity and ionizing radiation, while white wine shows favorable outcomes in water consumption, terrestrial acidification, and fine particulate matter formation. These disparities primarily arise from the higher sugar consumption in red wine production and the increased liquid CO2 consumption in white wine production.
The categories with the highest normalized impacts are related to toxicity and ecotoxicity, with non-human carcinogenic toxicity ranked first, followed by freshwater ecotoxicity and human carcinogenic toxicity. It is worth highlighting that the PEFCR categories did not stand out when using normalization factors.
The seven categories most relevant in terms of environmental impacts, accounting for 80% of the total impact after normalization and weighting, are global warming (15%), water consumption (14%), freshwater ecotoxicity (13%), fossil resource scarcity (13%), carcinogenic human toxicity (10%), marine ecotoxicity (9%), and freshwater eutrophication (5%). Thus, four of the PEFCR categories are relevant to the Brazilian context, while two (terrestrial acidification and fine particulate matter formation) were removed, and three (water consumption, carcinogenic human toxicity, and marine ecotoxicity) were added.
As a result of these changes, the impact accounted for increased from 55% in PEFCR 2.0 to 80% in the recommended categories, and the number of endpoint equivalences increased from five to six, with the addition of a marine ecosystem indicator (marine ecotoxicity).
We identified three hotspots for both red and white wine: electricity, sugar, and CO2 production, listed in order of relevance. Among these, only electricity is commonly cited in foreign studies. It is important to note that these highlighted categories provide a general overview of the impacts. The individual analysis of flows revealed significant variability among the most relevant impact categories. Therefore, if the objective is to evaluate specific flows, it is advisable to verify the most relevant impact categories.
Sugar plays a crucial role in the most relevant impact categories, significantly impacting land use, marine eutrophication, and ozone depletion. Since neither PEFCR 2.0 nor the recommended impact categories include these three categories, part of the impact of sugar has been underestimated in these evaluations. This finding indicates the need for a distinct approach to assessing the environmental impact of sugar.
These findings also reveal notable differences in the environmental impacts of wine production in Brazil compared to European studies. While electricity remains a critical factor, inputs like sugar and CO2 production are equally pivotal. Additionally, Brazil’s reliance on hydroelectric power makes water consumption particularly significant, with ecotoxicity categories heavily influenced by CO2 and land use impacts driven by sugar usage. These elements deviate from the PEFCR 2.0 guidelines, highlighting the need for an approach tailored to Brazil’s specific conditions.
Despite being the 15th largest wine producer globally, Brazil has a scarcity of studies and environmental certifications concerning its wine industry. These insights enhance our understanding of the environmental context and will inform future strategies in the Brazilian wine industry, especially regarding the heightened significance of sugar and the reduced reliance on fossil fuels compared to European countries.


