
Critical Raw Materials Supply: Challenges and Potentialities to Exploit Rare Earth Elements from Siliceous Stones and Extractive Waste

 ,
,  , , and
Abstract
:1. Introduction
2. Materials and Methods
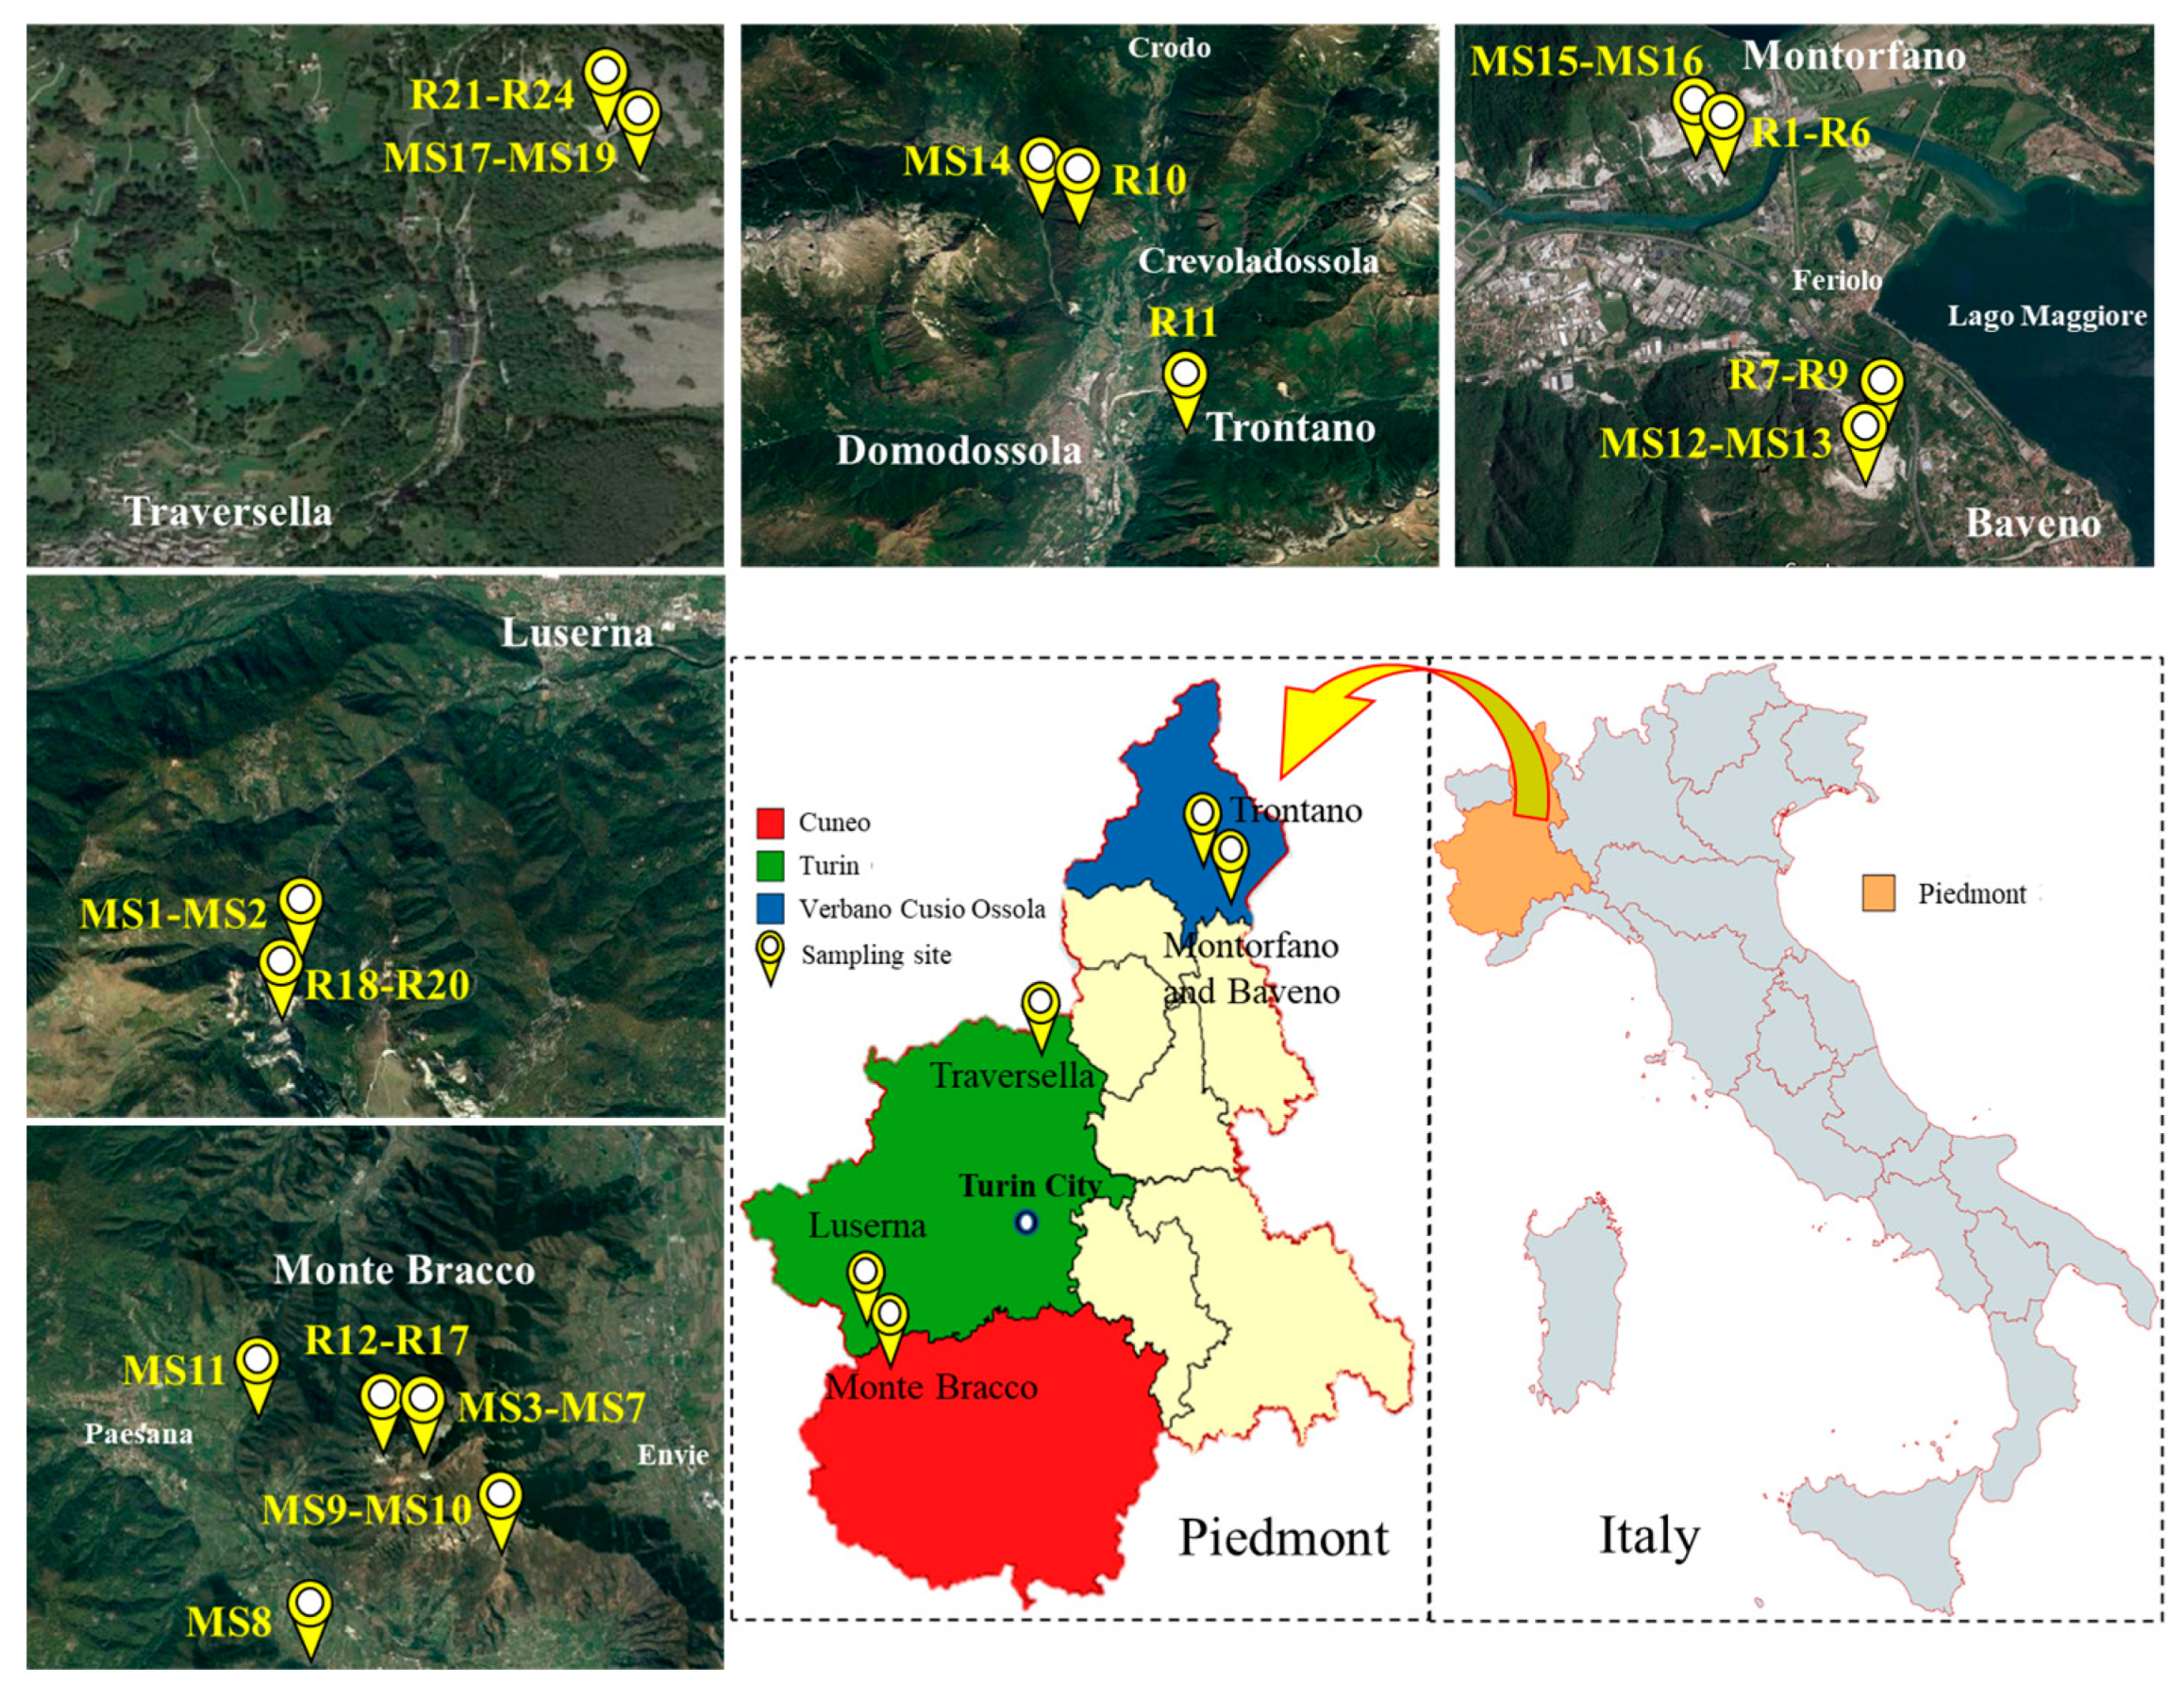
2.1. Investigation and Description of Sampling Area
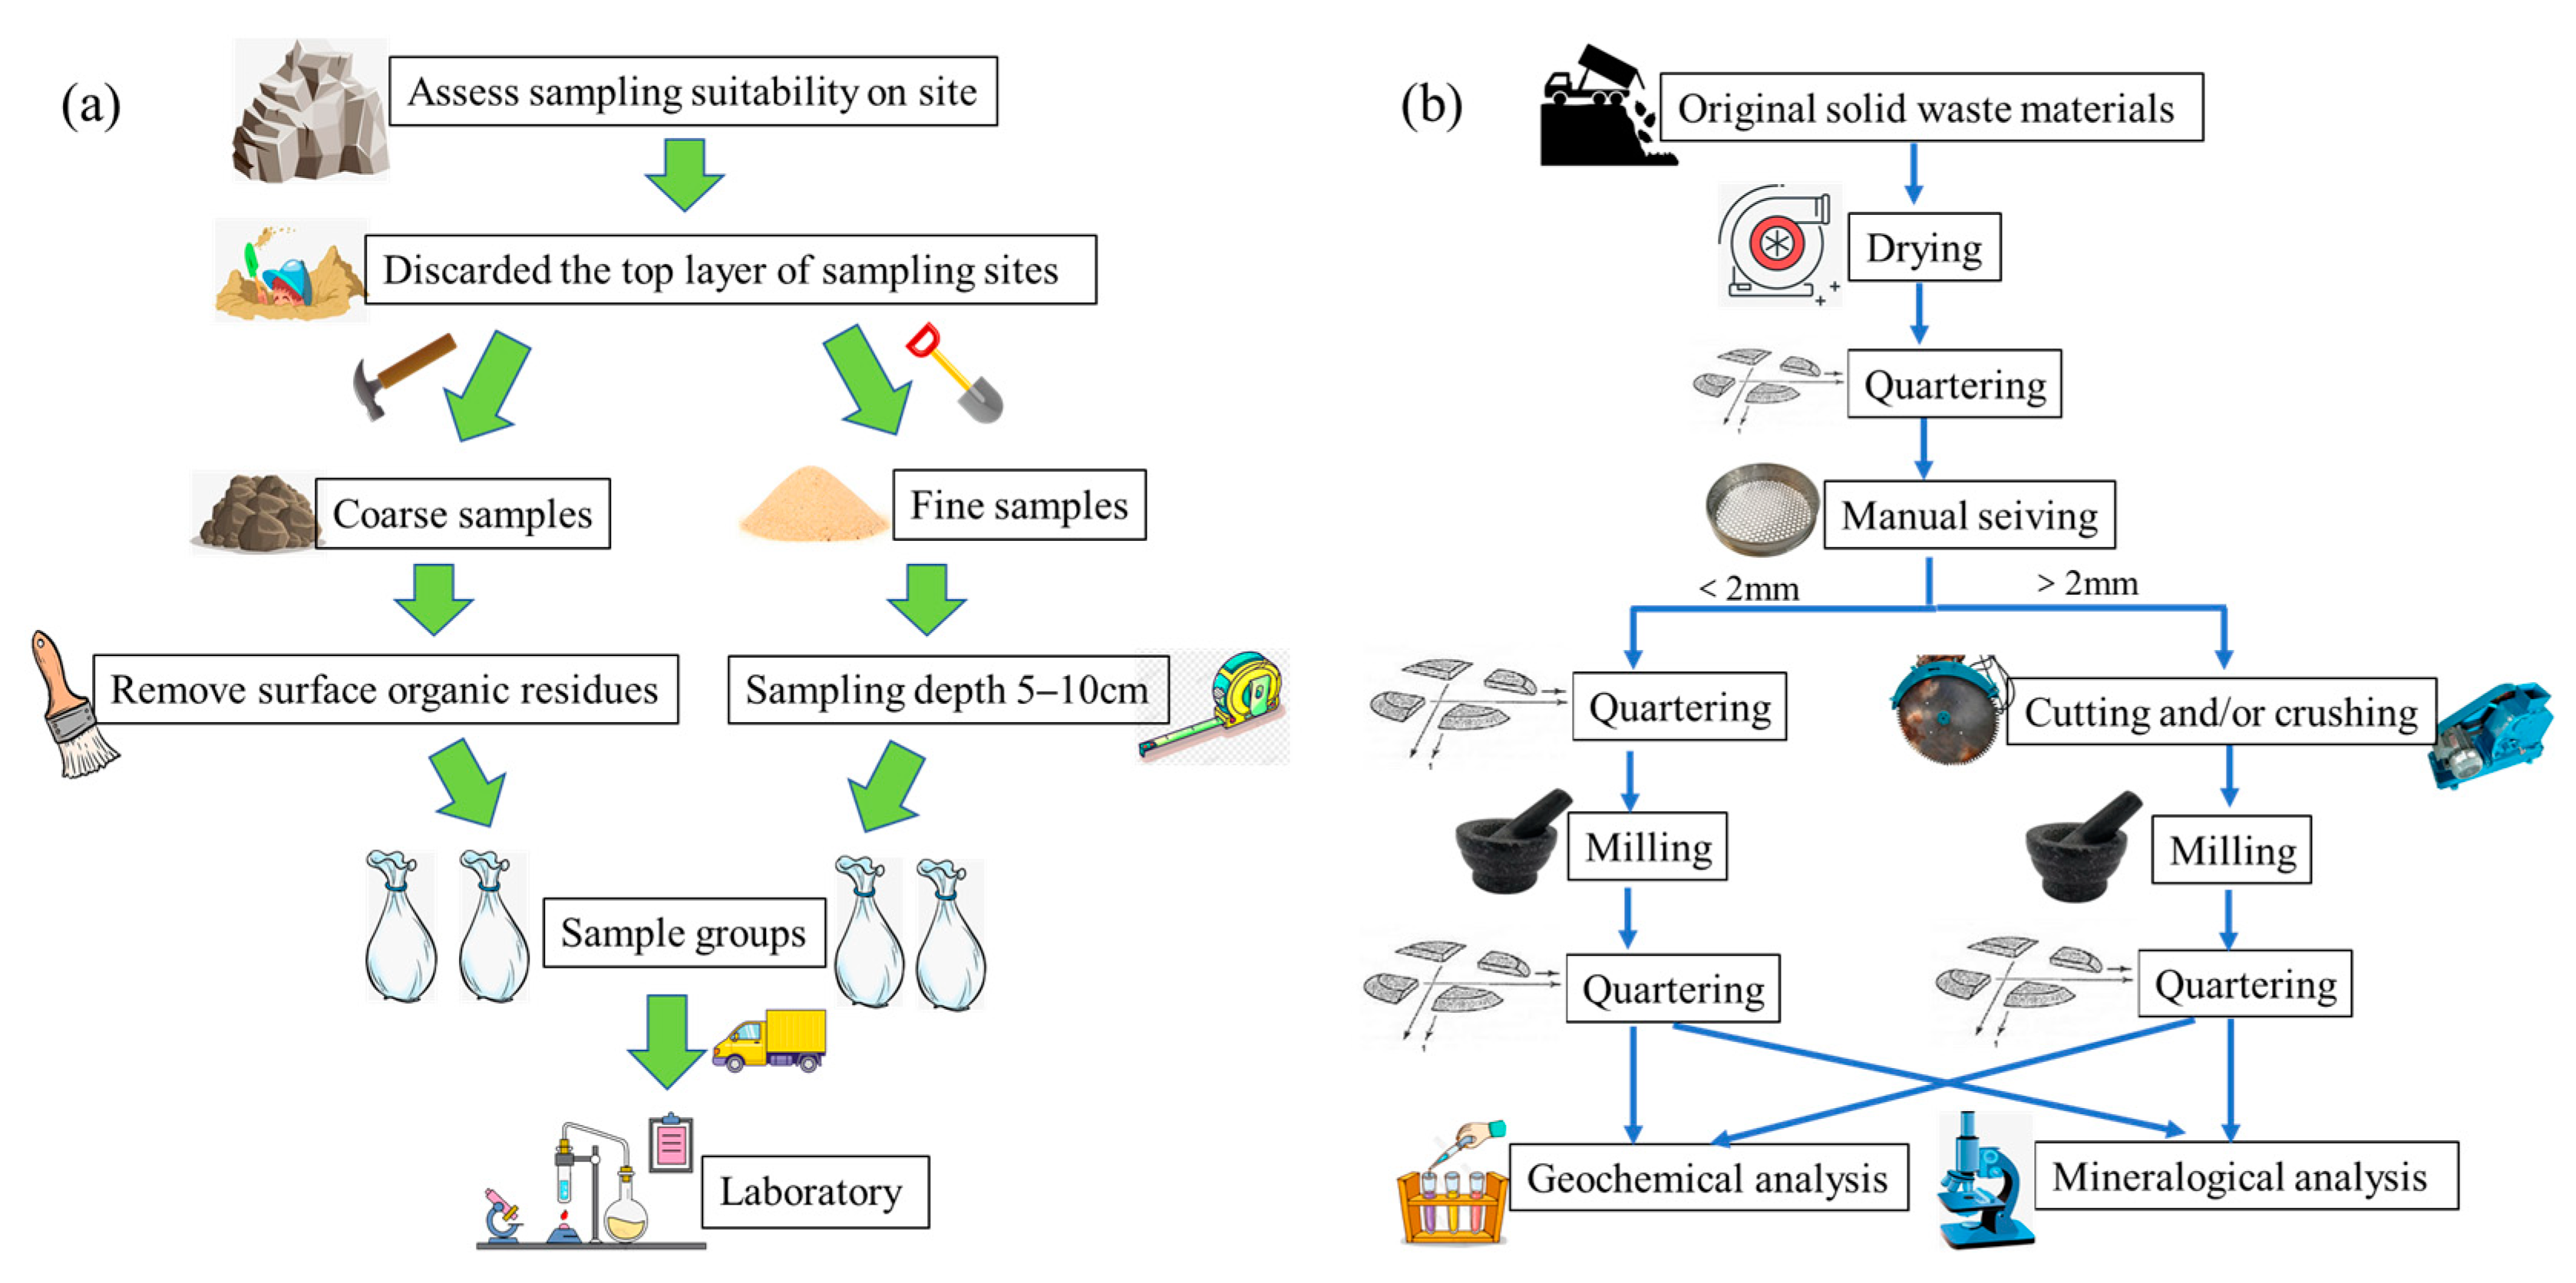
2.2. Sampling Criteria
2.3. Materials Characterization
2.3.1. Mineralogy and Petrology
2.3.2. Geochemistry
2.3.3. Environmental Risk
3. Results and Discussion
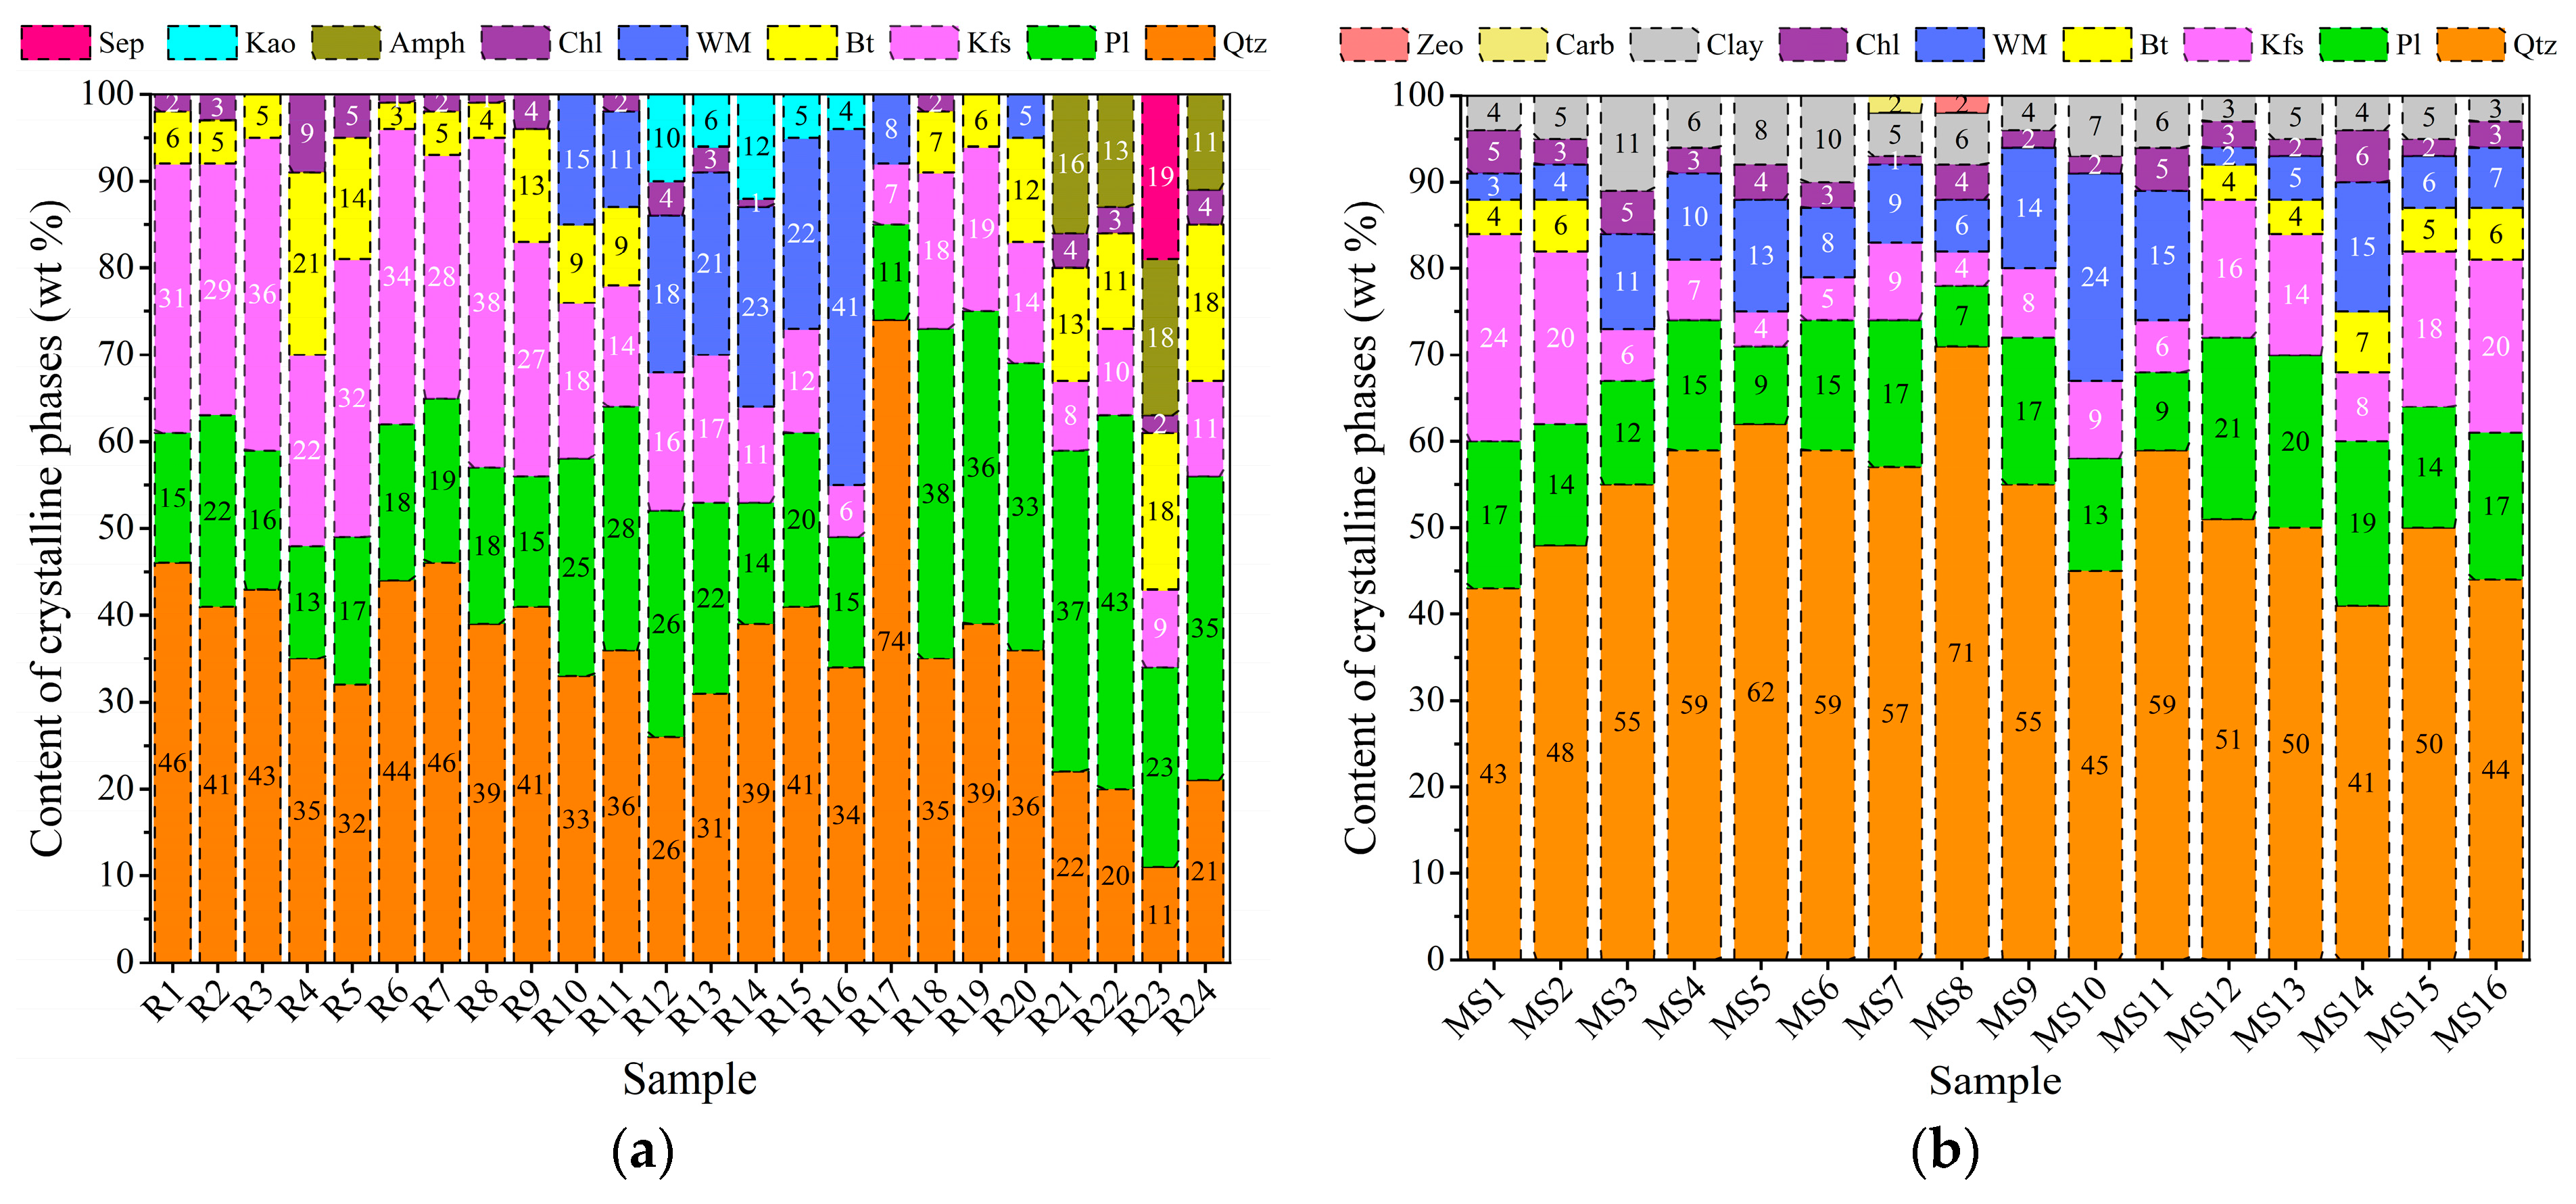
3.1. Mineralogical and Petrographical Characterisation
3.2. Geochemical Characterization
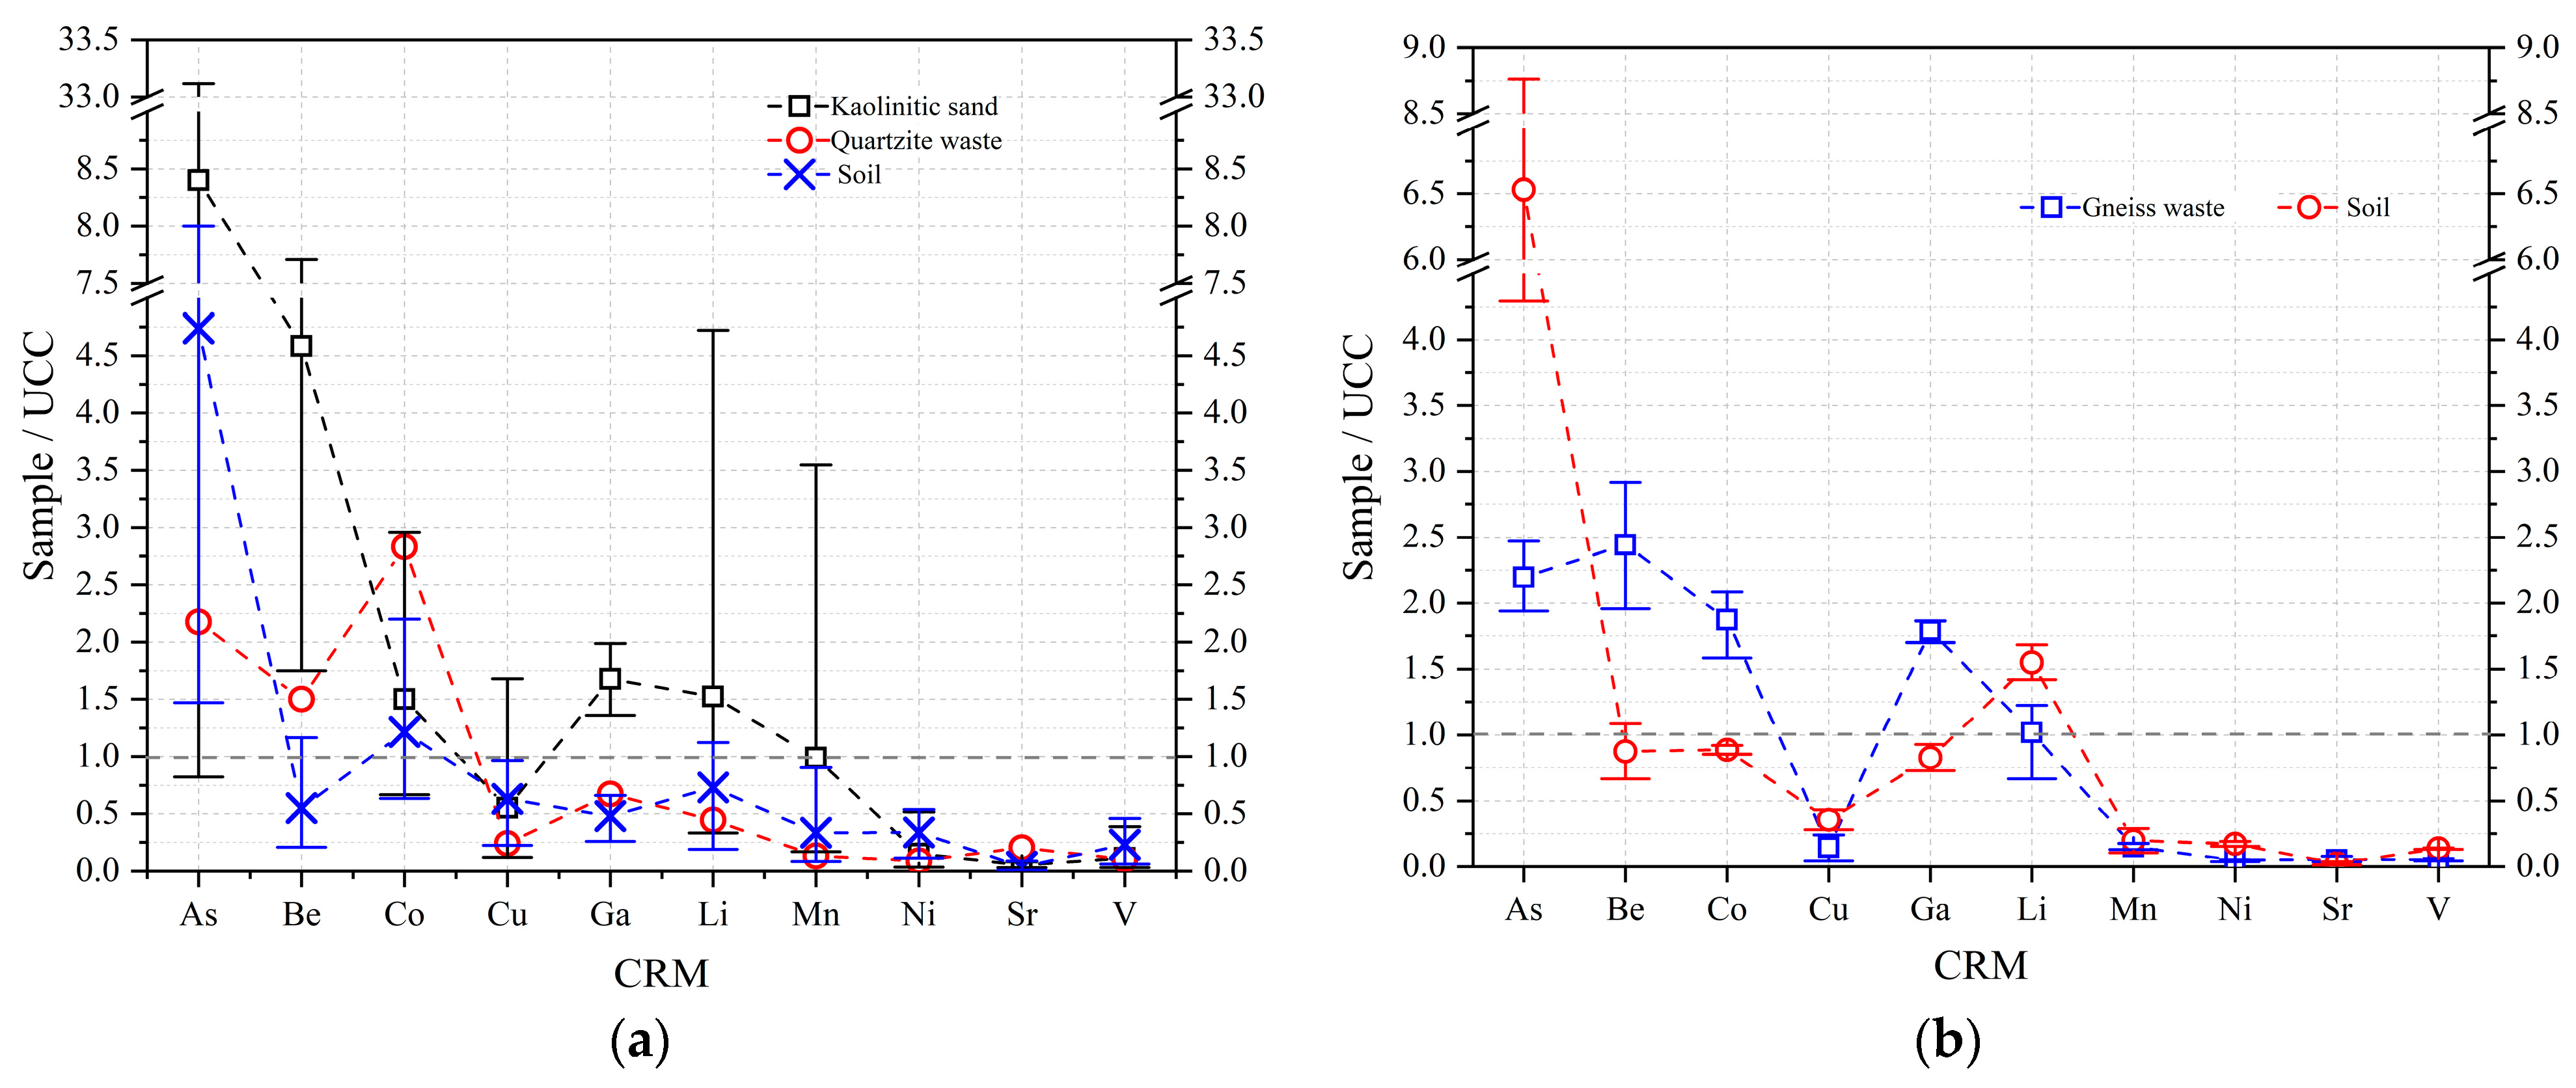
3.2.1. CRM Abundance
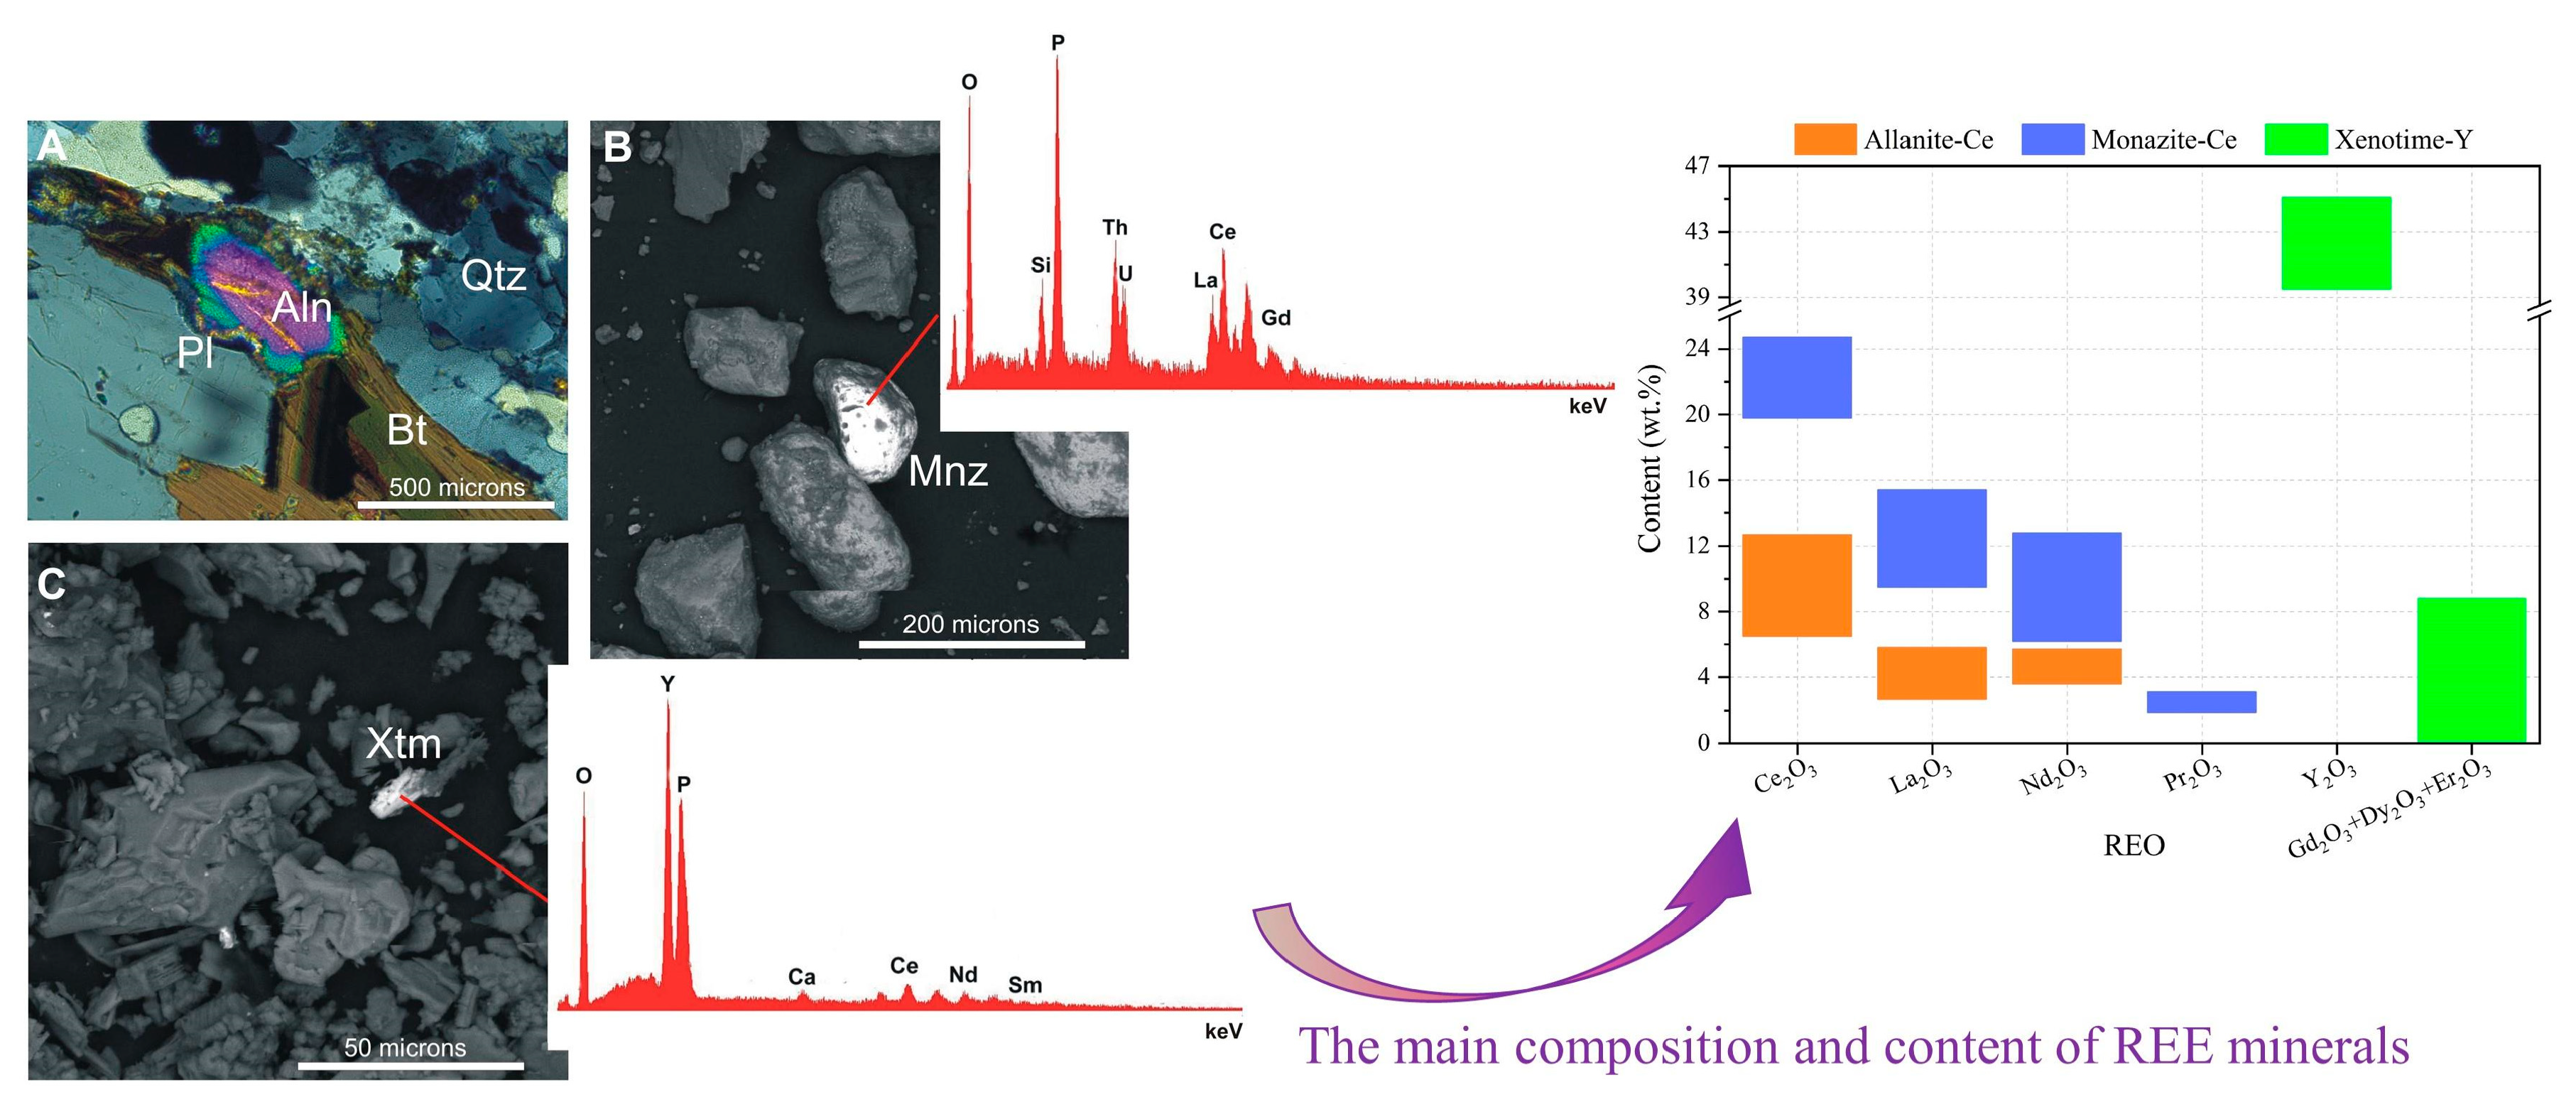
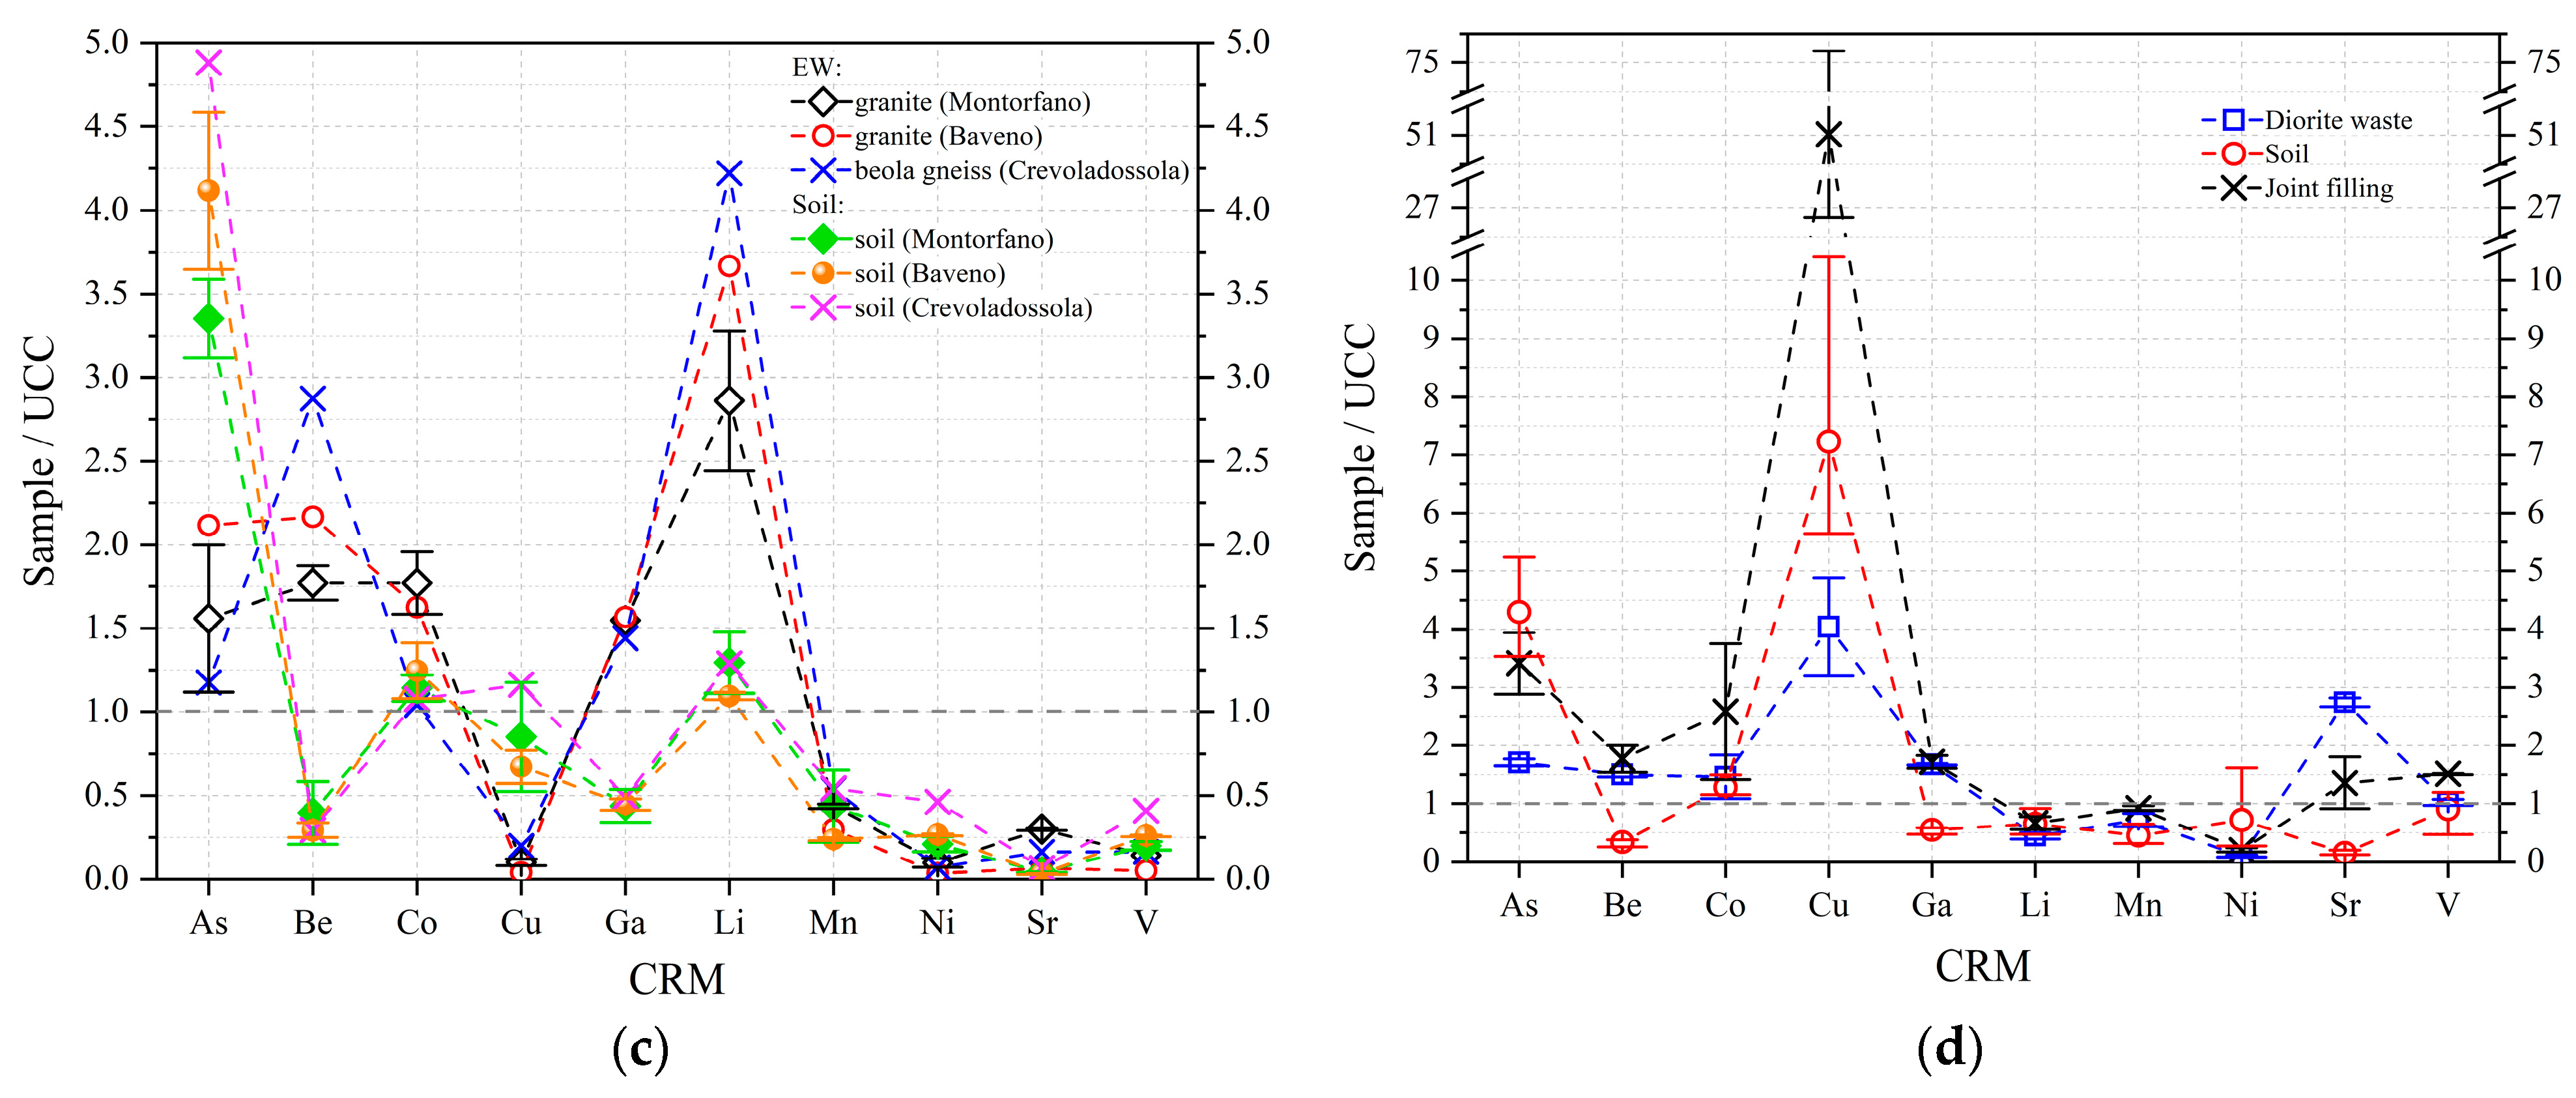
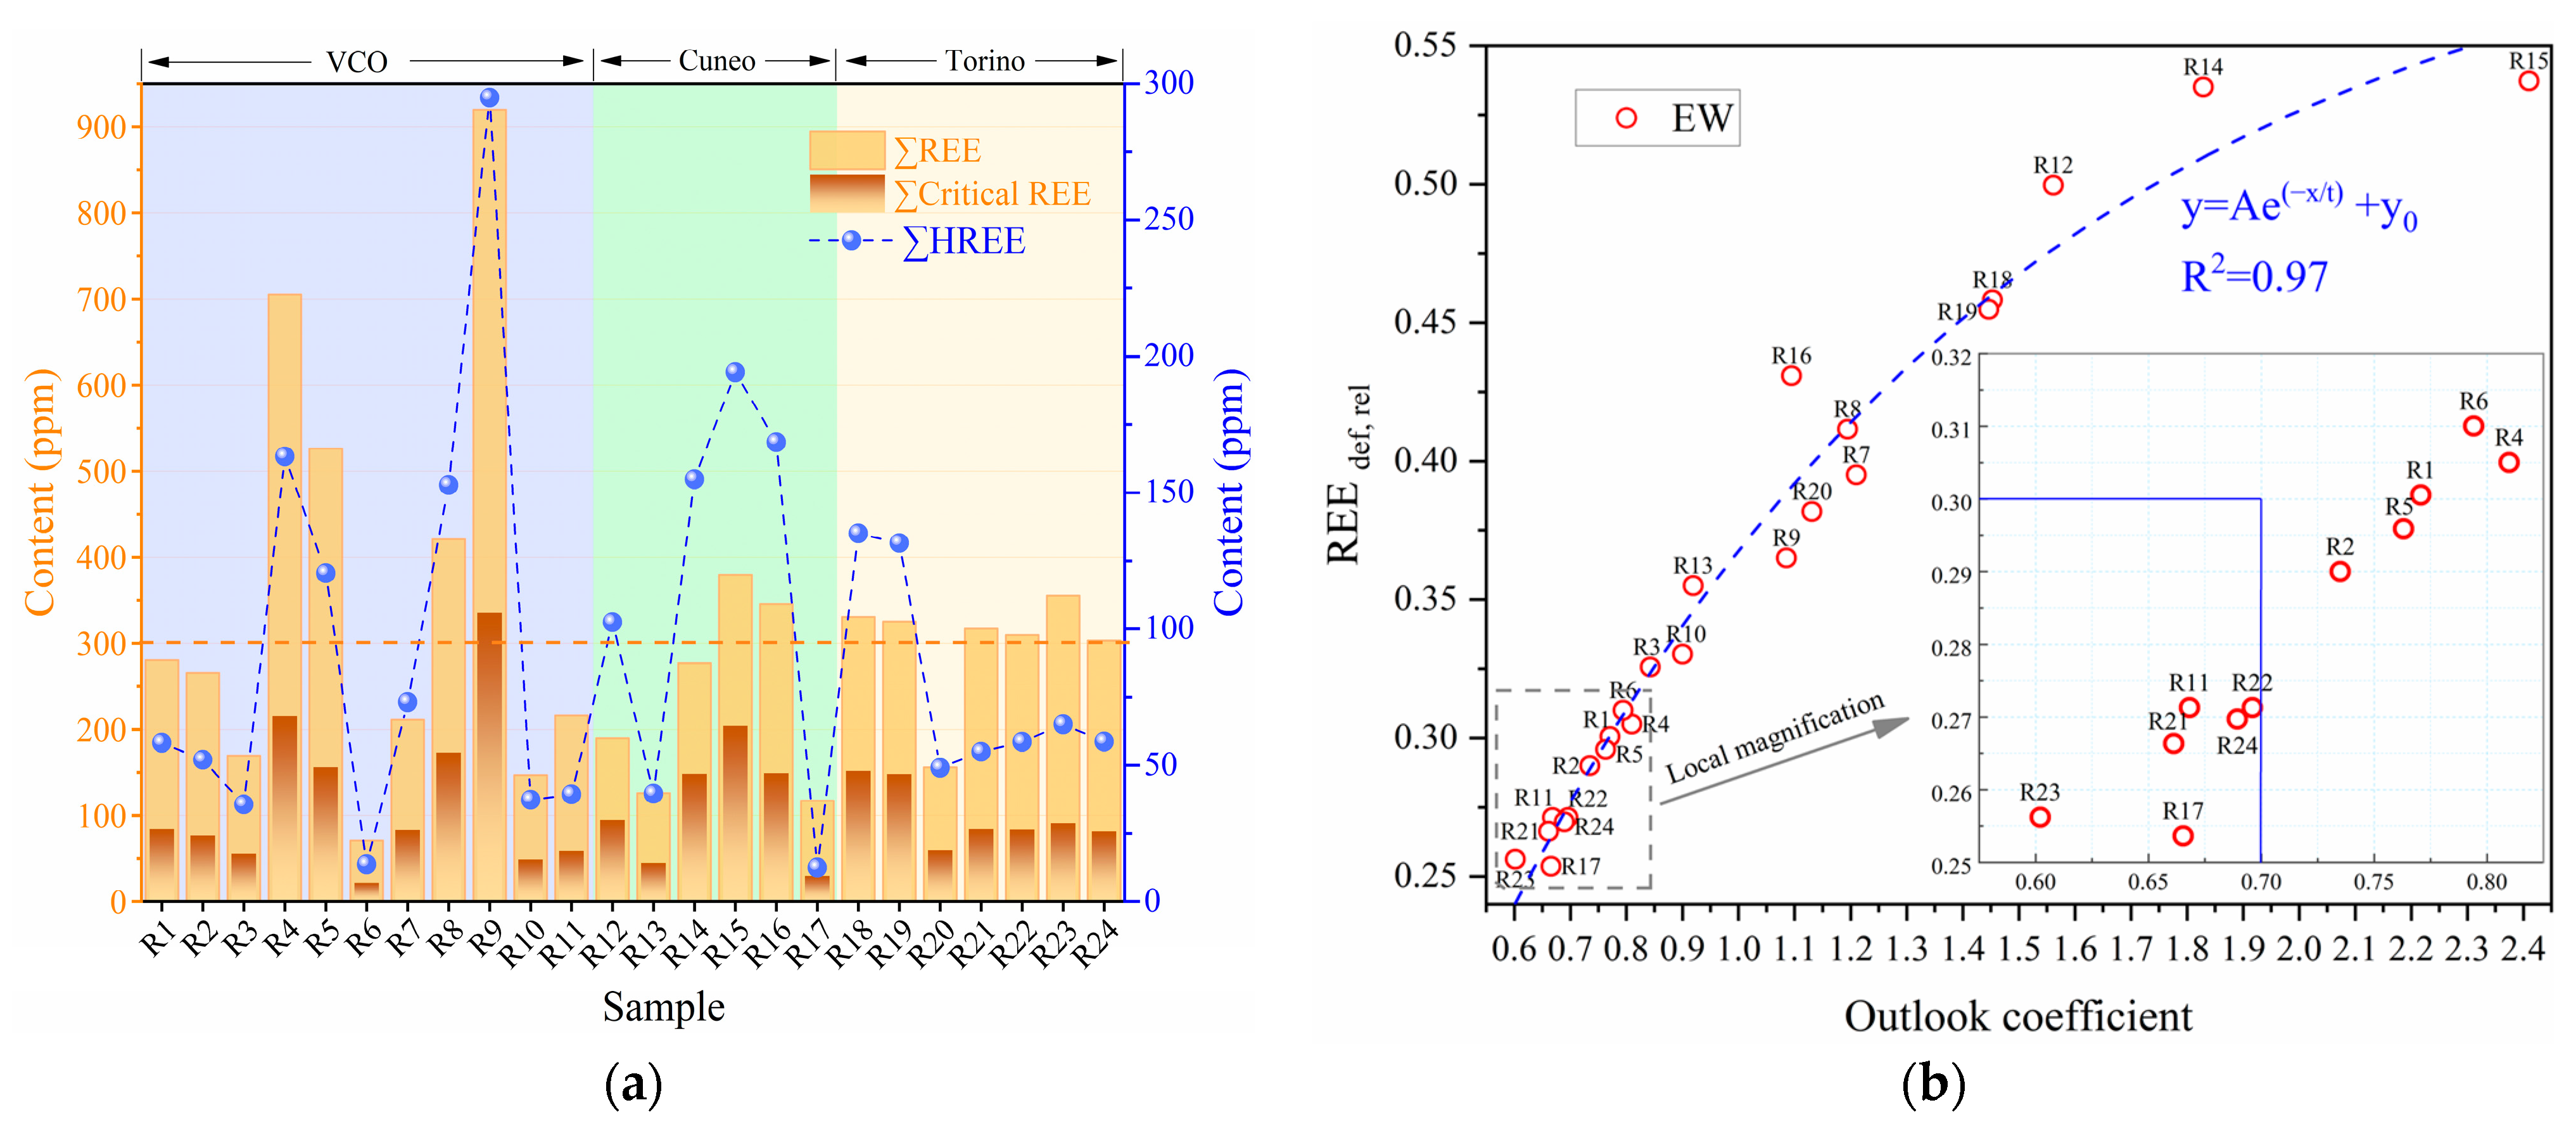
3.2.2. REEs Abundance
3.2.3. Geochemical characteristics
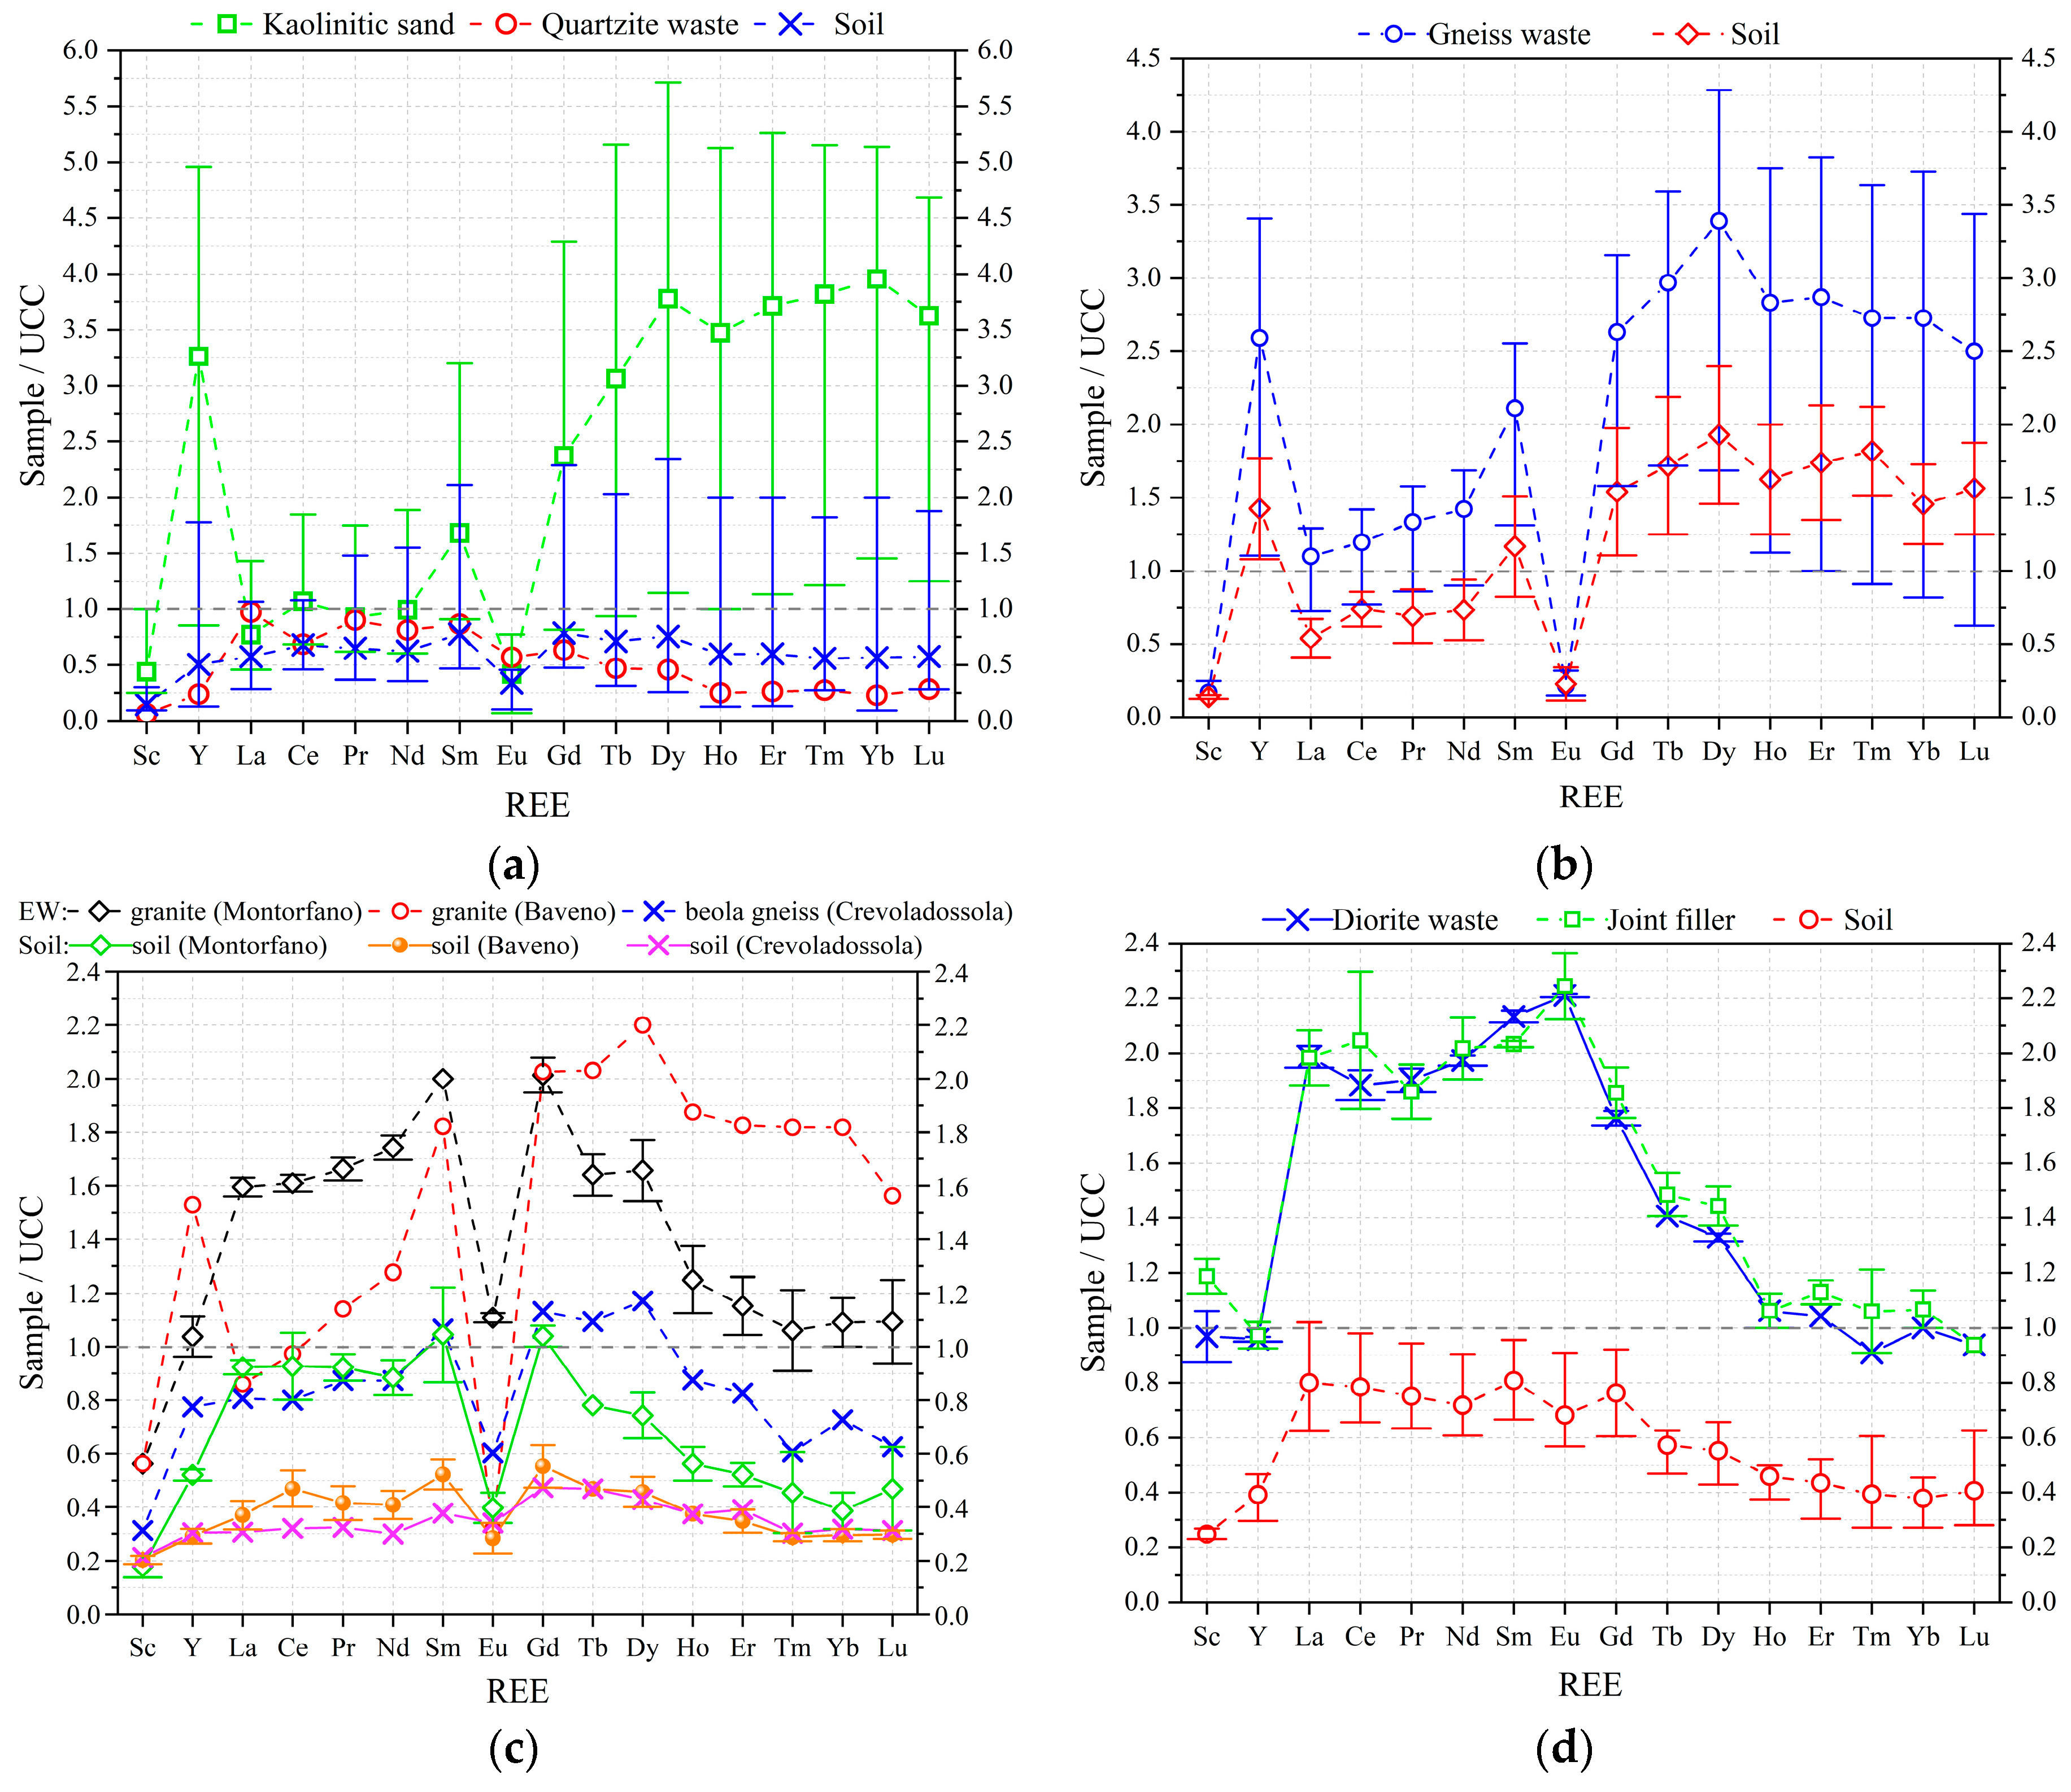
3.3. Environmental Risk
4. REEs Recovery Potential of EW
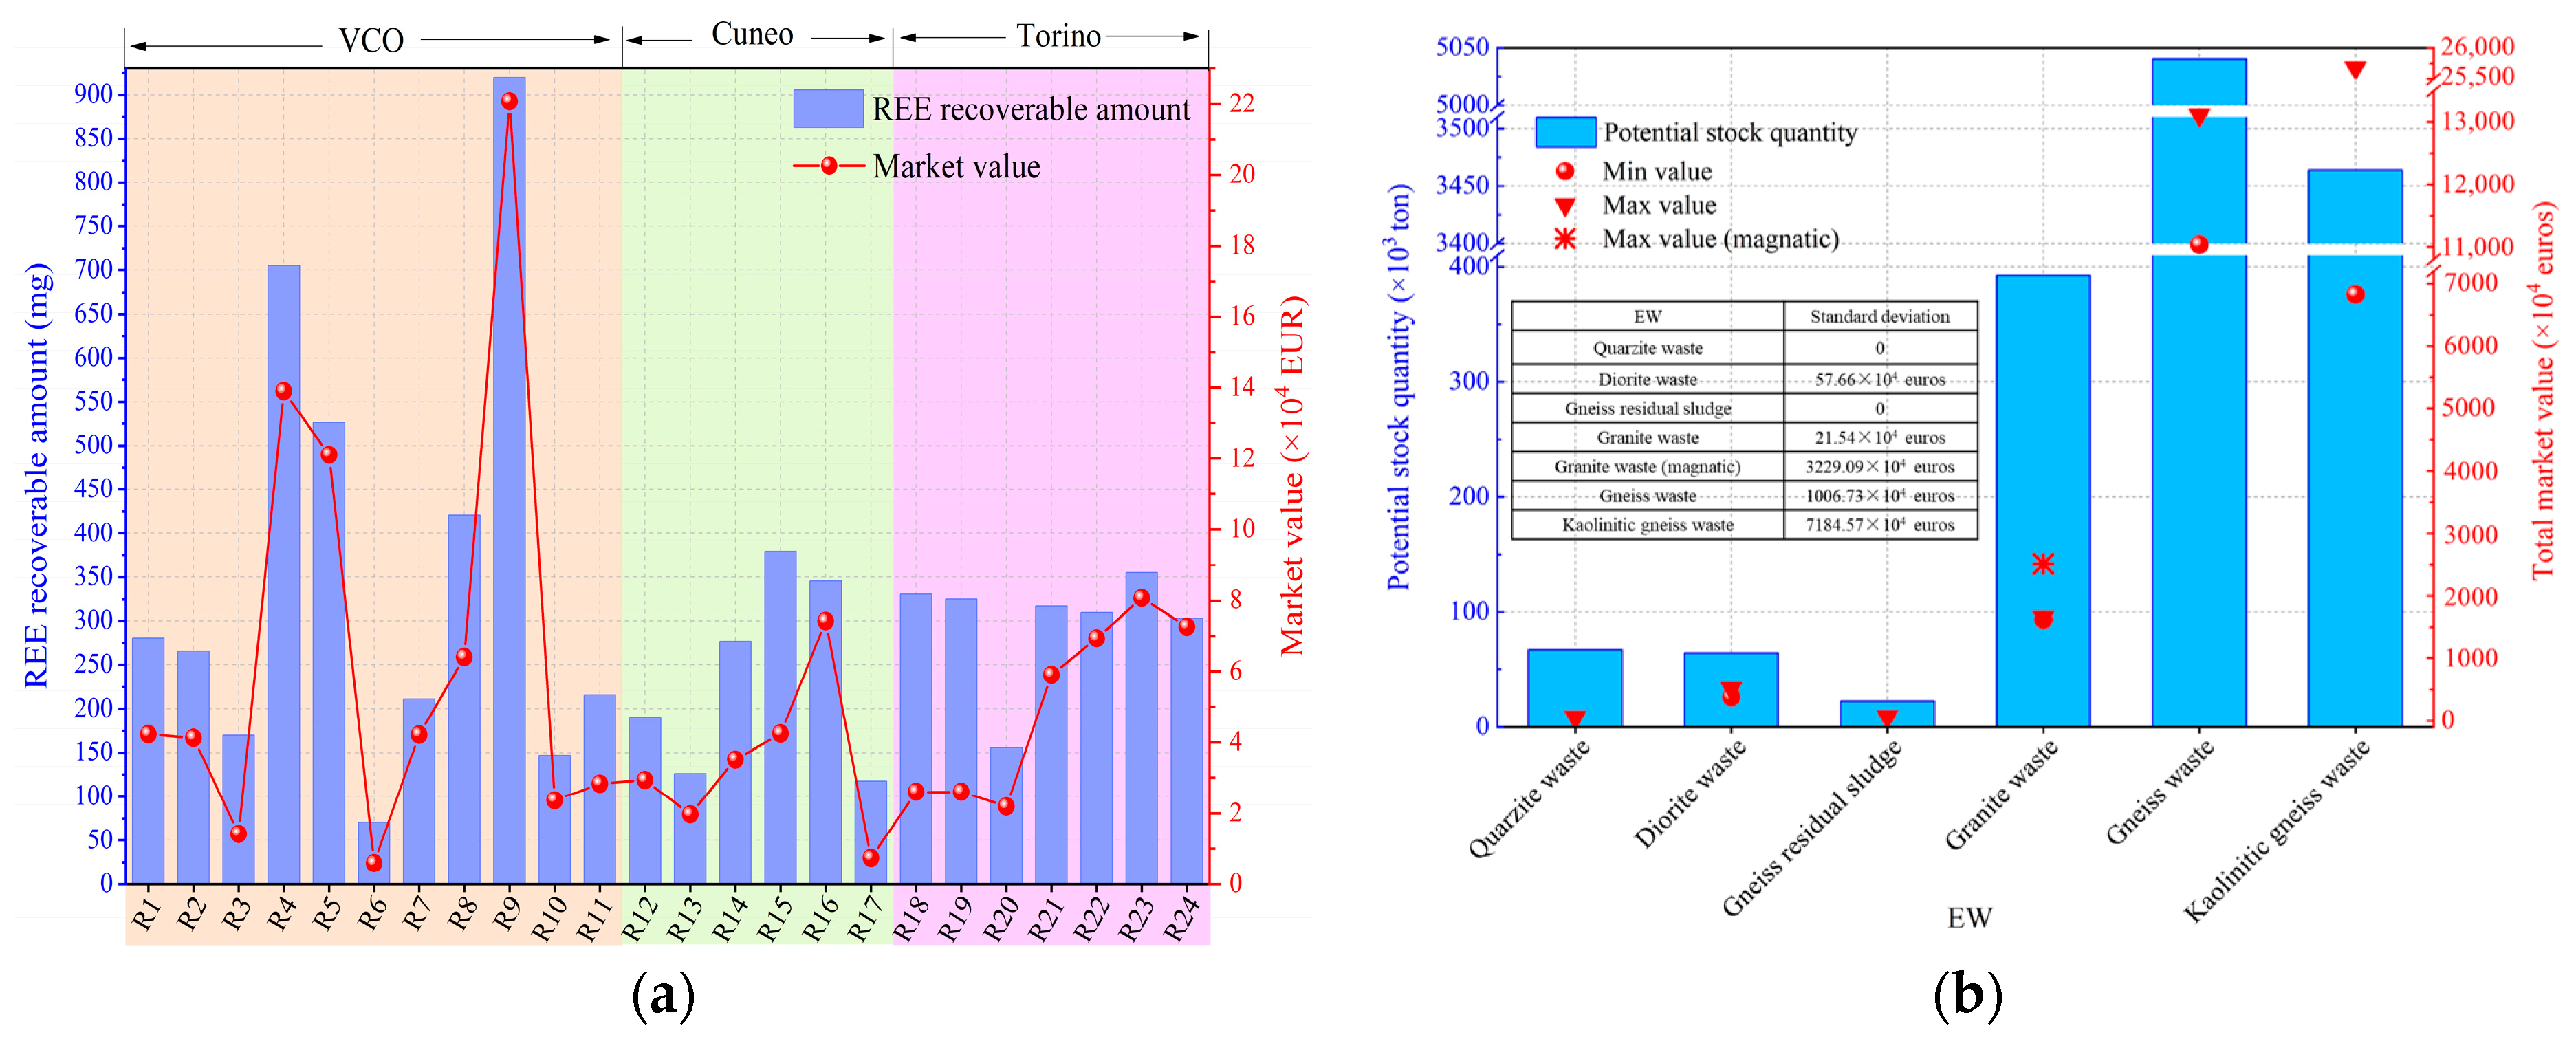
4.1. Industrial Recovery Grade of REEs
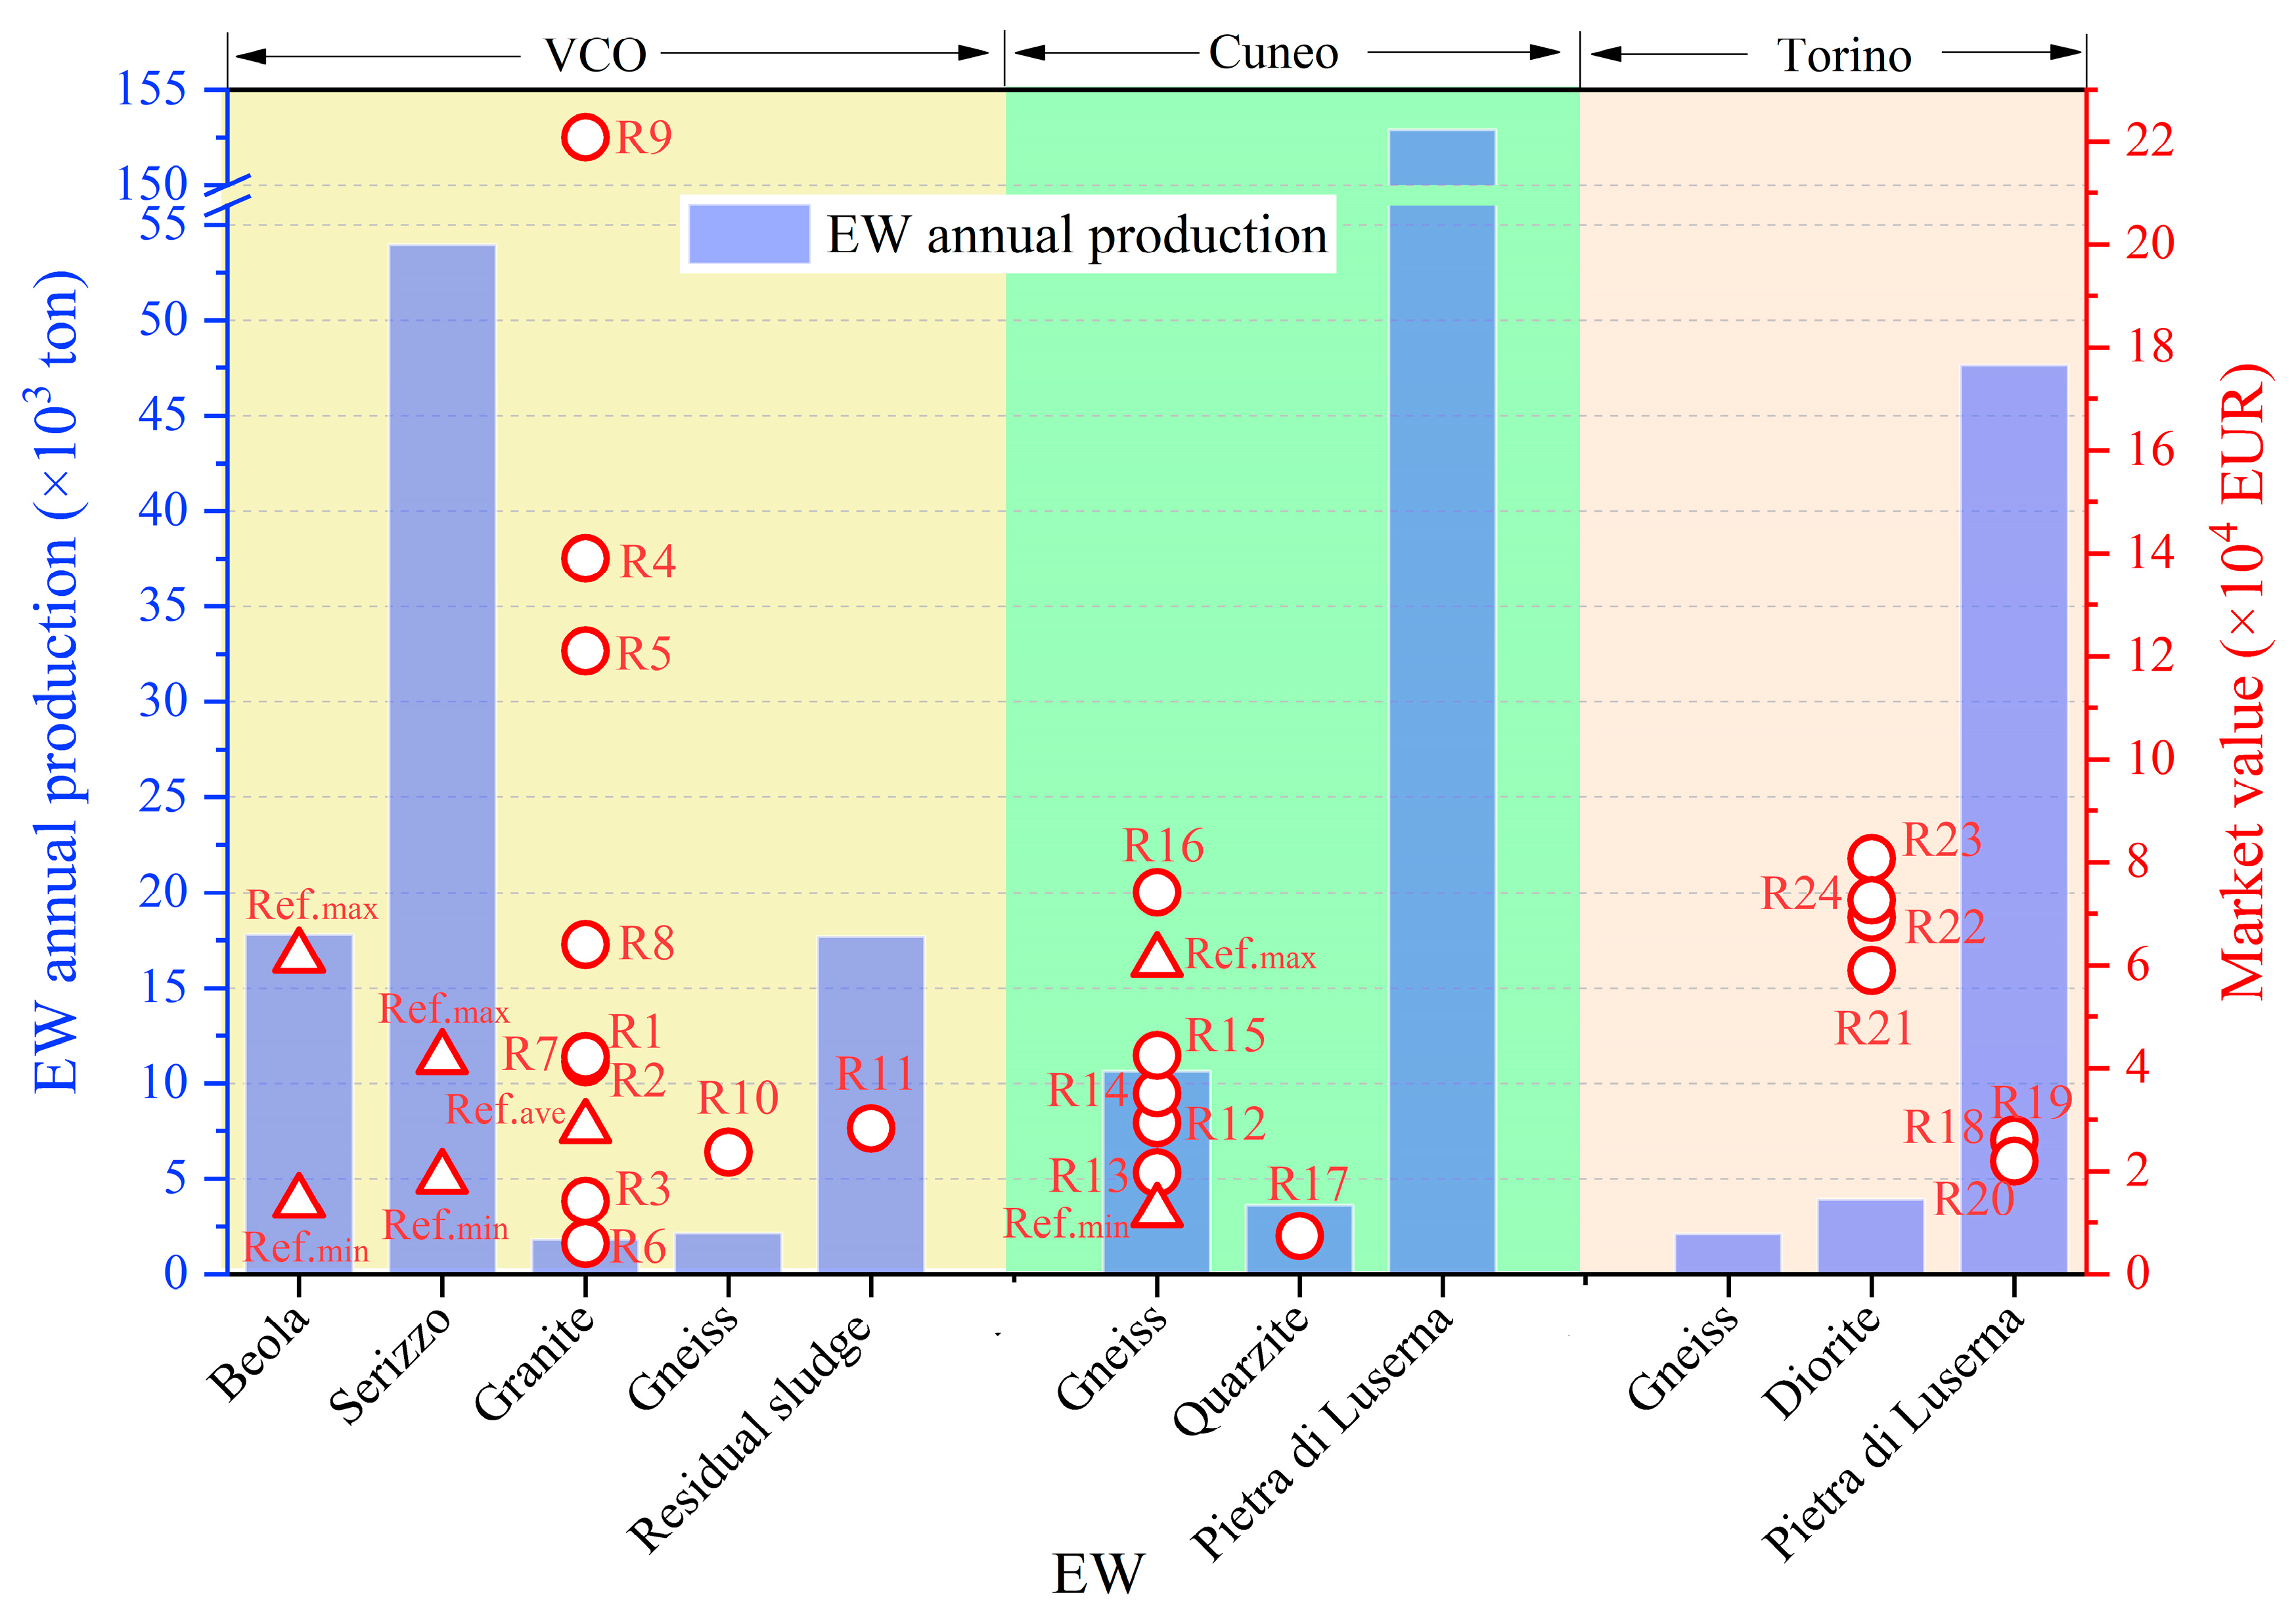
4.2. Potential Market Value for REEs Recovery
5. Challenges Facing REE Recovery
6. Future Prospects
7. Conclusions
Author Contributions
Funding
Data Availability Statement
Acknowledgments
Conflicts of Interest
Appendix A

| Parameters | Unit | Meaning | Value |
|---|---|---|---|
| ppm | Concentration of element i | Table A3 and Table A4 | |
| ppm | Reference value of element i | Table A2 | |
| - | Toxic response coefficient for i | Table A2 | |
| mg/(kg·d) | Average daily exposure doses of element i (ingestion) | - | |
| mg/(kg·d) | Average daily exposure doses of element i (inhalation) | - | |
| mg/(kg·d) | Average daily exposure doses of element i (dermal) | - | |
| mg/d | Ingestion rate | 100 | |
| day/yr | Exposure frequency | 250 | |
| yr | Exposure duration | 30 | |
| kg | Body weight | 60 | |
| day | Average exposure time | 7500 | |
| m3/kg | Particle emission factor | 1.36 × 10⁹ | |
| m3/d | Inhalation rate | 20 | |
| kg/mg | Conversion factor | 0.000001 | |
| cm2 | Exposed skin area | 5700 | |
| mg/cm2 | Skin adherence factor | 0.07 | |
| - | Dermal absorption factor | 0.001 0.03 (for As) | |
| mg/(kg·d) | Reference dose of i | Table A2 | |
| per mg/(kg·d) | Cancer slope factor of i | Table A2 |
| i | Value (mg/(kg·d)) [2,4] | Value [5] | Value (per mg/(kg·d)) [2,6,7] | Value (ppm) [8,9] | |||||
|---|---|---|---|---|---|---|---|---|---|
| Ingestion | Inhalation | Dermal | Ingestion | Inhalation | Dermal | Soil | EW | ||
| Cr | 0.003 | 0.0000286 | 0.00006 | 2 | 0.42 | 42 | 20 | 74 | 120 |
| Cu | 0.04 | 0.0402 | 0.012 | 5 | - | - | - | 25 | 60 |
| Zn | 0.3 | 0.3 | 0.06 | 1 | - | - | - | 69 | 70 |
| Cd | 0.001 | 0.00001 | 0.00001 | 30 | 6.1 | 6.3 | 20 | 0.47 | 0.15 |
| Pb | 0.0035 | 0.00352 | 0.000525 | 5 | 0.0085 | 0.042 | - | 42 | 14 |
| Ni | 0.02 | 0.00009 | 0.0054 | 5 | - | 0.84 | - | 46 | 84 |
| As | 0.0003 | 0.000123 | 0.000123 | - | 1.5 | 15.1 | 3.66 | - | 1.8 |
| Sample | Cr | Cu | Zn | As | Cd | Pb | Ni | Ba |
|---|---|---|---|---|---|---|---|---|
| MS1 | 15 | 7 | 57.7 | 7.3 | 0.05 | 28.5 | 8.7 | 20.4 |
| MS2 | 15 | 10.8 | 85.5 | 14.9 | 0.2 | 41.6 | 10.6 | 41.8 |
| MS3 | 46 | 18 | 53.7 | 13.6 | 0.15 | 42.5 | 21 | 64.2 |
| MS4 | 14 | 20 | 28 | 8.6 | 0.05 | 29.2 | 19.6 | 72.6 |
| MS5 | 36 | 18.2 | 57.1 | 10 | 0.33 | 51.1 | 19.8 | 85.5 |
| MS6 | 20 | 12.7 | 41.4 | 6.1 | 0.13 | 51.4 | 12.5 | 51.3 |
| MS7 | 8 | 5.6 | 12.5 | 2.5 | 0.03 | 28.2 | 6.3 | 9.2 |
| MS8 | 44 | 17.6 | 58.1 | 11.6 | 0.13 | 49.9 | 30.1 | 65.8 |
| MS9 | 8 | 10.3 | 12.8 | 3.9 | 0.03 | 45.7 | 6.7 | 10.5 |
| MS10 | 28 | 15.5 | 50.5 | 4.2 | 0.06 | 45.8 | 25.1 | 24.3 |
| MS11 | 37 | 24.1 | 113 | 12 | 0.34 | 44.8 | 29 | 124 |
| MS12 | 26 | 14.3 | 47.7 | 6.2 | 0.24 | 21.6 | 15.2 | 29.3 |
| MS13 | 23 | 19.3 | 48.4 | 7.8 | 0.18 | 43.9 | 14.6 | 24.3 |
| MS14 | 36 | 29.1 | 115 | 8.3 | 0.32 | 39.2 | 25.8 | 76.2 |
| MS15 | 14 | 13.1 | 64.8 | 5.3 | 0.25 | 44.4 | 9.2 | 38 |
| MS16 | 19 | 29.4 | 150 | 6.1 | 0.37 | 81.5 | 14.3 | 113 |
| MS17 | 19 | 260 | 45.2 | 7 | 0.13 | 57.2 | 15.2 | 236 |
| MS18 | 19 | 141 | 54.8 | 8.9 | 0.19 | 39.7 | 14.9 | 103 |
| MS19 | 81 | 141 | 52.9 | 6 | 0.12 | 33.8 | 90.6 | 118 |
| Sample | Cr | Cu | Zn | As | Cd | Pb | Ni | Ba |
|---|---|---|---|---|---|---|---|---|
| R1 | 7 | 3 | 65 | 3.4 | 0.2 | 33 | 7 | 435 |
| R2 | 14 | 2 | 59 | 1.9 | 0.2 | 30 | 4 | 421 |
| R3 | 4 | 2 | 20 | 2.9 | 0.2 | 28 | 4 | 333 |
| R4 | 13 | 2 | 198 | 1.5 | 0.2 | 43 | 8 | 433 |
| R5 | 17 | 29 | 187 | 1.7 | 0.2 | 37 | 8 | 439 |
| R6 | 0.9 | 1 | 12 | 1.3 | 0.2 | 27 | 4 | 412 |
| R7 | 8 | 1 | 66 | 3.6 | 0.2 | 33 | 2 | 75 |
| R8 | 71 | 10 | 93 | 5.7 | 0.2 | 43 | 4 | 95 |
| R9 | 32 | 12 | 340 | 3.9 | 0.4 | 77 | 4 | 89 |
| R10 | 9 | 5 | 53 | 2 | 0.2 | 25 | 4 | 213 |
| R11 | 149 | 159 | 67 | 4.5 | 0.2 | 14 | 83 | 453 |
| R12 | 7 | 5 | 31 | 2.8 | 0.2 | 66 | 3 | 27 |
| R13 | 2 | 3 | 15 | 1.4 | 0.2 | 45 | 4 | 104 |
| R14 | 3 | 9 | 22 | 3.2 | 0.2 | 53 | 2 | 161 |
| R15 | 6 | 10 | 35 | 7.7 | 0.2 | 54 | 4 | 379 |
| R16 | 42 | 42 | 123 | 56.3 | 0.5 | 244 | 29 | 523 |
| R17 | 17 | 6 | 28 | 3.7 | 0.2 | 16 | 5 | 644 |
| R18 | 7 | 1 | 32 | 3.3 | 0.2 | 18 | 3 | 52 |
| R19 | 13 | 4 | 30 | 4.2 | 0.2 | 16 | 2 | 44 |
| R20 | 7 | 6 | 55 | 3.7 | 0.2 | 23 | 3 | 116 |
| R21 | 8 | 122 | 25 | 3 | 0.2 | 14 | 4 | 1840 |
| R22 | 11 | 80 | 33 | 2.8 | 0.2 | 16 | 6 | 2040 |
| R23 | 11 | 1880 | 44 | 6.7 | 0.2 | 22 | 13 | 2050 |
| R24 | 10 | 671 | 35 | 4.9 | 0.2 | 15 | 9 | 2150 |
| REE | Price (EUR/kg) | REE | Price (EUR/kg) | REE | Price (EUR/kg) |
|---|---|---|---|---|---|
| La | 3.21 | Gd | 31.41 | Yb | 12.82 |
| Ce | 3.33 | Tb | 1243.59 | Lu | 711.54 |
| Pr | 83.33 | Dy | 439.10 | Sc | 3461.54 |
| Nd | 78.21 | Ho | 70.51 | Y | 30.13 |
| Sm | 11.03 | Er | 36.28 | ||
| Eu2O3 | 25.00 | Tm | 500.00 |
Appendix B. Potential REEs Recovery Process

Appendix C. Potential Recovery Rates

References
- Yu, S.; Wu, S.C.; Dumont, L.; Cardin, J.; Labbé, C.; Gourbilleau, F. Monolithic crystalline silicon solar cells with SiNx layers doped with Tb3+ and Yb3+ rare-earth ions. J. Rare Earths 2019, 37, 515–519. [Google Scholar] [CrossRef]
- Heier, S. Grid Integration of Wind Energy: Onshore and Offshore Conversion Systems; John Wiley & Sons: Hoboken, NJ, USA, 2014. [Google Scholar]
- Nakamura, H. The current and future status of rare earth permanent magnets. Scr. Mater. 2018, 154, 273–276. [Google Scholar] [CrossRef]
- Blengini, G.A.; Nuss, P.; Dewulf, J.; Nita, V.; Peirò, L.T.; Vidal-Legaz, B.; Latunussa, C.; Mancini, L.; Blagoeva, D.; Pennington, D.; et al. EU methodology for critical raw materials assessment: Policy needs and proposed solutions for incremental improvements. Resour. Policy 2017, 53, 12–19. [Google Scholar] [CrossRef]
- Favot, M.; Massarutto, A. Rare-earth elements in the circular economy: The case of yttrium. J. Environ. Manag. 2019, 240, 504–510. [Google Scholar] [CrossRef]
- Hartley, K.; Van Santen, R.; Kirchherr, J. Policies for transitioning towards a circular economy: Expectations from the European Union (EU). Resour. Conserv. Recycl. 2020, 155, 104634. [Google Scholar] [CrossRef]
- Grohol, M.; Veeh, C.E.; Commission, I. Directorate-General for Internal Market, Entrepreneurship, SMEs, Study on the Critical Raw Materials for the EU 2023—Final Report; Publications Office of the European Union: Luxembourg, 2023. [Google Scholar]
- Khelifi, F.; Mokadem, N.; Liu, G.; Yousaf, B.; Zhou, H.; Ncibi, K.; Hamed, Y. Occurrence, contamination evaluation and health risks of trace metals within soil, sediments and tailings in southern Tunisia. Int. J. Environ. Sci. Technol. 2022, 19, 6127–6140. [Google Scholar] [CrossRef]
- Padoan, E.; Hernandez Kath, A.; Vahl, L.C.; Ajmone-Marsan, F. Potential Release of Zinc and Cadmium From Mine-Affected Soils Under Flooding, a Mesocosm Study. Arch. Environ. Contam. Toxicol. 2020, 79, 421–434. [Google Scholar] [CrossRef] [PubMed]
- Zhao, X.; Yang, K.; Wei, Z.; He, X.; Chen, R. Study on the effect of multi-source solid waste on the performance of its backfill slurry. Heliyon 2023, 9, e16251. [Google Scholar] [CrossRef] [PubMed]
- Zhao, X.; Yang, K.; Dino, G.A.; He, X.; Wei, Z.; Zhang, J. Feasibility and challenges of multi-source coal-based solid waste (CSW) for underground backfilling—A case study. Process Saf. Environ. Prot. 2024, 181, 8–25. [Google Scholar] [CrossRef]
- Khelifi, F.; Melki, A.; Hamed, Y.; Adamo, P.; Caporale, A.G. Environmental and human health risk assessment of potentially toxic elements in soil, sediments, and ore-processing wastes from a mining area of southwestern Tunisia. Environ. Geochem. Health 2020, 42, 4125–4139. [Google Scholar] [CrossRef]
- Khelifi, F.; Caporale, A.G.; Hamed, Y.; Adamo, P. Bioaccessibility of potentially toxic metals in soil, sediments and tailings from a north Africa phosphate-mining area: Insight into human health risk assessment. J. Environ. Manag. 2021, 279, 111634. [Google Scholar] [CrossRef]
- Cavallo, A.; Dino, G.A. Quartz, feldspars and REE from gneiss waste materials: An example from the VCO province (Piedmont, northern Italy). In Proceedings of the EGU General Assembly 2022, Vienna, Austria, 23–27 May 2022. EGU22-3156. [Google Scholar] [CrossRef]
- Cavallo, A.; Dino, G.A. Extractive Waste as a Resource: Quartz, Feldspars, and Rare Earth Elements from Gneiss Quarries of the Verbano-Cusio-Ossola Province (Piedmont, Northern Italy). Sustainability 2022, 14, 4536. [Google Scholar] [CrossRef]
- Petrosino, P.; Sadeghi, M.; Albanese, S.; Andersson, M.; Lima, A.; De Vivo, B. REE contents in solid sample media and stream water from different geological contexts: Comparison between Italy and Sweden. J. Geochem. Explor. 2013, 133, 176–201. [Google Scholar] [CrossRef]
- Hammache, Z.; Berbar, Y.; Bensaadi, S.; Trari, M.; Amara, M. Recovery of light rare earth elements by leaching and extraction from phosphate mining waste (Fluorapatite and Carbonate-Fluorapatite). J. Afr. Earth Sci. 2020, 171, 103937. [Google Scholar] [CrossRef]
- Edahbi, M.; Plante, B.; Benzaazoua, M.; Pelletier, M. Geochemistry of rare earth elements within waste rocks from the Montviel carbonatite deposit, Québec, Canada. Environ. Sci. Pollut. Res. 2018, 25, 10997–11010. [Google Scholar] [CrossRef] [PubMed]
- Costis, S.; Mueller, K.K.; Coudert, L.; Neculita, C.M.; Reynier, N.; Blais, J.F. Recovery potential of rare earth elements from mining and industrial residues: A review and cases studies. J. Geochem. Explor. 2021, 221, 106699. [Google Scholar] [CrossRef]
- Cavallo, A.; Dino, G.A. The Bargiolina, a Striking Historical Stone from Monte Bracco (Piedmont, NW Italy) and a Possible Source of Industrial Minerals. Sustainability 2019, 11, 4293. [Google Scholar] [CrossRef]
- Costa, E.; Dino, G.A.; Benna, P.; Rossetti, P. The Traversella Mining Site as Piemonte Geosite. Geoheritage 2019, 11, 55–70. [Google Scholar] [CrossRef]
- Compagnoni, R.; Rolfo, F.; Groppo, C.; Hirajima, T.; Turello, R. Geological map of the ultra-high pressure Brossasco-Isasca unit (Western Alps, Italy). J. Maps 2012, 8, 465–472. [Google Scholar] [CrossRef]
- Dino, G.A.; Cavallo, A.; Faraudello, A.; Rossi, P.; Mancini, S. Raw materials supply: Kaolin and quartz from ore deposits and recycling activities. The example of the Monte Bracco area (Piedmont, Northern Italy). Resour. Policy 2021, 74, 102413. [Google Scholar] [CrossRef]
- Mehta, N.; Cocerva, T.; Cipullo, S.; Padoan, E.; Dino, G.A.; Ajmone-Marsan, F.; Cox, S.F.; Coulon, F.; De Luca, D.A. Linking oral bioaccessibility and solid phase distribution of potentially toxic elements in extractive waste and soil from an abandoned mine site: Case study in Campello Monti, NW Italy. Sci. Total Environ. 2019, 651, 2799–2810. [Google Scholar] [CrossRef] [PubMed]
- Dino, G.A.; Cavallo, A.; Rossetti, P.; Garamvölgyi, E.; Sándor, R.; Coulon, F. Towards Sustainable Mining: Exploiting Raw Materials from Extractive Waste Facilities. Sustainability 2020, 12, 2383. [Google Scholar] [CrossRef]
- Dino, G.A.; Rossetti, P.; Perotti, L.; Alberto, W.; Sarkka, H.; Coulon, F.; Wagland, S.; Griffiths, Z.; Rodeghiero, F. Landfill mining from extractive waste facilities: The importance of a correct site characterisation and evaluation of the potentialities. A case study from Italy. Resour. Policy 2018, 59, 50–61. [Google Scholar] [CrossRef]
- Jiu, B.; Huang, W.; Hao, R. A method for judging depositional environment of coal reservoir based on coal facies parameters and rare earth element parameters. J. Pet. Sci. Eng. 2021, 207, 109128. [Google Scholar] [CrossRef]
- Zhou, L.; Kang, Z.; Wang, Z.; Peng, Y.; Xiao, H. Sedimentary geochemical investigation for paleoenvironment of the Lower Cambrian Niutitang Formation shales in the Yangtze Platform. J. Pet. Sci. Eng. 2017, 159, 376–386. [Google Scholar] [CrossRef]
- Shi, Y.; Peng CE, Q.; Zhang, Z.; Zhang, J.; Yan, W.; Xu, C. Rare earth elements in aeolian loess sediments from Menyuan Basin, northeastern Tibetan plateau: Implications for provenance. Front. Environ. Sci. 2023, 11, 1074909. [Google Scholar] [CrossRef]
- Hakanson, L. An ecological risk index for aquatic pollution control.a sedimentological approach. Water Res. 1980, 14, 975–1001. [Google Scholar] [CrossRef]
- Muller, G. Index of geoaccumulation in sediments of the Rhine river. GeoJournal 1969, 2, 108–118. [Google Scholar]
- Mohammadi, A.A.; Zarei, A.; Majidi, S.; Ghaderpoury, A.; Hashempour, Y.; Saghi, M.H.; Alinejad, A.; Yousefi, M.; Hosseingholizadeh, N.; Ghaderpoori, M. Carcinogenic and non-carcinogenic health risk assessment of heavy metals in drinking water of Khorramabad, Iran. MethodsX 2019, 6, 1642–1651. [Google Scholar] [CrossRef]
- Fabietti, G.; Biasioli, M.; Barberis, R.; Ajmone-Marsan, F. Soil contamination by organic and inorganic pollutants at the regional scale: The case of Piedmont, Italy. J. Soils Sediments 2010, 10, 290–300. [Google Scholar]
- Wedepohl, K.H. The composition of the continental crust. Geochim. Cosmochim. Acta 1995, 59, 1217–1232. [Google Scholar] [CrossRef]
- Borst, A.M.; Smith, M.P.; Finch, A.A.; Estrade, G.; Villanova-de-Benavent, C.; Nason, P.; Marquis, E.; Horsburgh, N.J.; Goodenough, K.M.; Xu, C.; et al. Adsorption of rare earth elements in regolith-hosted clay deposits. Nat. Commun. 2020, 11, 4386. [Google Scholar] [CrossRef]
- Zhang, X.; Yang, H.; Cui, Z. Evaluation and analysis of soil migration and distribution characteristics of heavy metals in iron tailings. J. Clean. Prod. 2018, 172, 475–480. [Google Scholar] [CrossRef]
- Ye, Y.; Li, Y.; Cao, Z.; Liu, S.; Zhao, Y. Experimental and numerical study on Cu and Cd migration in different functional-area soils under simulated rainfall conditions. Environ. Res. 2022, 208, 112239. [Google Scholar] [CrossRef]
- Dutta, T.; Kim, K.H.; Uchimiya, M.; Kwon, E.E.; Jeon, B.H.; Deep, A.; Yun, S.T. Global demand for rare earth resources and strategies for green mining. Environ. Res. 2016, 150, 182–190. [Google Scholar] [CrossRef]
- Buss, H.L.; Sak, P.B.; Webb, S.M.; Brantley, S.L. Weathering of the Rio Blanco quartz diorite, Luquillo Mountains, Puerto Rico: Coupling oxidation, dissolution, and fracturing. Geochim. Cosmochim. Acta 2008, 72, 4488–4507. [Google Scholar] [CrossRef]
- Tazikeh, H.; Khormali, F.; Amini, A.; Motlagh, M.B. Geochemistry of soils derived from selected sedimentary parent rocks in Kopet Dagh, North East Iran. J. Geochem. Explor. 2018, 194, 52–70. [Google Scholar] [CrossRef]
- Hu, Z.; Haneklaus, S.; Sparovek, G.; Schnug, E. Rare Earth Elements in Soils. Commun. Soil Sci. Plant Anal. 2006, 37, 1381–1420. [Google Scholar] [CrossRef]
- Li, W.; Zuo, Y.; Wang, L.; Wan, X.; Yang, J.; Liang, T.; Song, H.; Weihrauch, C.; Rinklebe, J. Abundance, spatial variation, and sources of rare earth elements in soils around ion-adsorbed rare earth mining areas. Environ. Pollut. 2022, 313, 120099. [Google Scholar] [CrossRef]
- He, Y.; Ma, L.; Li, X.; Wang, H.; Liang, X.; Zhu, J.; He, H. Mobilization and fractionation of rare earth elements during experimental bio-weathering of granites. Geochim. Cosmochim. Acta 2023, 343, 384–395. [Google Scholar] [CrossRef]
- Liang, T.; Li, K.; Wang, L. State of rare earth elements in different environmental components in mining areas of China. Environ. Monit. Assess. 2014, 186, 1499–1513. [Google Scholar] [CrossRef]
- Relvini, A.; Martin, S.; Carvalho, B.B.; Prosser, G.; Toffolo, L.; Macera, P.; Bartoli, O. Genesis of the Eastern Adamello Plutons (Northern Italy): Inferences for the Alpine Geodynamics. Geosciences 2022, 12, 13. [Google Scholar] [CrossRef]
- Skurzyński, J.; Jary, Z.; Kenis, P.; Kubik, R.; Moska, P.; Raczyk, J.; Seul, C. Geochemistry and mineralogy of the Late Pleistocene loess-palaeosol sequence in Złota (near Sandomierz, Poland): Implications for weathering, sedimentary recycling and provenance. Geoderma 2020, 375, 114459. [Google Scholar] [CrossRef]
- Gujre, N.; Mitra, S.; Soni, A.; Agnihotri, R.; Rangan, L.; Rene, E.R.; Sharma, M.P. Speciation, contamination, ecological and human health risks assessment of heavy metals in soils dumped with municipal solid wastes. Chemosphere 2021, 262, 128013. [Google Scholar] [CrossRef]
- Tume, P.; González, E.; King, R.W.; Monsalve, V.; Roca, N.; Bech, J. Spatial distribution of potentially harmful elements in urban soils, city of Talcahuano, Chile. J. Geochem. Explor. 2018, 184, 333–344. [Google Scholar] [CrossRef]
- Seredin, V.V. A new method for primary evaluation of the outlook for rare earth element ores. Geol. Ore Depos. 2010, 52, 428–433. [Google Scholar] [CrossRef]
- Sun, Y.; Zhao, C.; Li, Y.; Wang, J. Minimum mining grade of the selected trace elements in Chinese coal. J. China Coal Soc. 2014, 39, 744–748. [Google Scholar]
- Honaker, R.Q.; Zhang, W.; Werner, J.; Noble, A.; Luttrell, G.H.; Yoon, R.H. Enhancement of a Process Flowsheet for Recovering and Concentrating Critical Materials from Bituminous Coal Sources, Mining. Metall. Explor. 2020, 37, 3–20. [Google Scholar]
- Seredin, V.V.; Dai, S. Coal deposits as potential alternative sources for lanthanides and yttrium. Int. J. Coal Geol. 2012, 94, 67–93. [Google Scholar] [CrossRef]
- Zichella, L.; Dino, G.A.; Bellopede, R.; Marini, P.; Padoan, E.; Passarella, I. Environmental impacts, management and potential recovery of residual sludge from the stone industry: The piedmont case. Resour. Policy 2020, 65, 101562. [Google Scholar] [CrossRef]
- Mendoza, J.-M.F.; Feced, M.; Feijoo, G.; Josa, A.; Gabarrell, X.; Rieradevall, J. Life cycle inventory analysis of granite production from cradle to gate. Int. J. Life Cycle Assess. 2014, 19, 153–165. [Google Scholar] [CrossRef]
- Ulubeyli, G.C.; Artir, R. Properties of Hardened Concrete Produced by Waste Marble Powder. Procedia-Soc. Behav. Sci. 2015, 195, 2181–2190. [Google Scholar] [CrossRef]
- Borra, C.R.; Blanpain, B.; Pontikes, Y.; Binnemans, K.; Van Gerven, T. Recovery of Rare Earths and Other Valuable Metals from Bauxite Residue (Red Mud): A Review. J. Sustain. Metall. 2016, 2, 365–386. [Google Scholar] [CrossRef]
- Zhang, W.; Honaker, R. Characterization and recovery of rare earth elements and other critical metals (Co, Cr, Li, Mn, Sr, and V) from the calcination products of a coal refuse sample. Fuel 2020, 267, 117236. [Google Scholar] [CrossRef]
- Gaustad, G.; Williams, E.; Leader, A. Rare earth metals from secondary sources: Review of potential supply from waste and byproducts, Resources. Conserv. Recycl. 2021, 167, 105213. [Google Scholar] [CrossRef]
- Mancini, S.; Casale, M.; Rossi, P.; Faraudello, A.; Dino, G.A. Operative instruments to support public authorities and industries for the supply of raw materials: A decision support tool to evaluate the sustainable exploitation of extractive waste facilities. Resour. Policy 2023, 81, 103338. [Google Scholar] [CrossRef]
- Deng, B.; Wang, X.; Luong, D.X.; Carter, R.A.; Wang, Z.; Tomson, M.B.; Tour, J.M. Rare earth elements from waste. Sci. Adv. 2022, 8, eabm3132. [Google Scholar] [CrossRef]
- Balaram, V. Rare earth elements: A review of applications, occurrence, exploration, analysis, recycling, and environmental impact. Geosci. Front. 2019, 10, 1285–1303. [Google Scholar] [CrossRef]
- Peelman, S.; Sun ZH, I.; Sietsma, J.; Yang, Y. Chapter 21—Leaching of Rare Earth Elements: Review of Past and Present Technologies. In Rare Earths Industry; De Lima, I.B., Leal, W.F., Eds.; Elsevier: Boston, MA, USA, 2016; pp. 319–334. [Google Scholar]
- Polyakov, E.G.; Sibilev, A.S. Recycling Rare-Earth-Metal Wastes by Pyrometallurgical Methods. Metallurgist 2015, 59, 368–373. [Google Scholar] [CrossRef]
- Swain, B. Challenges and opportunities for sustainable valorization of rare earth metals from anthropogenic waste. Rev. Environ. Sci. Bio/Technol. 2023, 22, 133–173. [Google Scholar] [CrossRef]
- Ambaye, T.G.; Vaccari, M.; Castro, F.D.; Prasad, S.; Rtimi, S. Emerging technologies for the recovery of rare earth elements (REEs) from the end-of-life electronic wastes: A review on progress, challenges, and perspectives. Environ. Sci. Pollut. Res. 2020, 27, 36052–36074. [Google Scholar] [CrossRef]
- Royen, H.; Fortkamp, U. Rare Earth Elements—Purification, Separation and Recycling; IVL Svenska Miljöinstitutet: Stockholm, Sweden, 2016. [Google Scholar]
- Kuppusamy, V.K.; Holuszko, M. Sulfuric acid baking and water leaching of rare earth elements from coal tailings. Fuel 2022, 319, 123738. [Google Scholar] [CrossRef]
- Fasana, S.; Nelva, R. Improvement of the performance of traditional stone roofs by wind driven rain experimental tests. Constr. Build. Mater. 2011, 25, 1491–1502. [Google Scholar] [CrossRef]
- Yang, K.; Zhao, X.; Wei, Z.; Zhang, J. Development overview of paste backfill technology in China’s coal mines: A review. Environ. Sci. Pollut. Res. 2021, 28, 67957–67969. [Google Scholar] [CrossRef]
- Zhao, X.; Yang, K.; Li, X.; Cheng, L. The Material Mix Proportion of Roadside Backfill Body (RBB) Based on Spatiotemporal Law of Ground Pressure: A Case Study. Energy Explor. Exploit. 2023, 42, 01445987231190786. [Google Scholar] [CrossRef]
- Zhang, W.; Honaker, R. Calcination pretreatment effects on acid leaching characteristics of rare earth elements from middlings and coarse refuse material associated with a bituminous coal source. Fuel 2019, 249, 130–145. [Google Scholar] [CrossRef]
- Ji, B.; Li, Q.; Zhang, W. Leaching recovery of rare earth elements from the calcination product of a coal coarse refuse using organic acids. J. Rare Earths 2022, 40, 318–327. [Google Scholar] [CrossRef]
- Taggart, R.K.; Hower, J.C.; Hsu-Kim, H. Effects of roasting additives and leaching parameters on the extraction of rare earth elements from coal fly ash. Int. J. Coal Geol. 2018, 196, 106–114. [Google Scholar] [CrossRef]
- Pan, J.; Nie, T.; Vaziri Hassas, B.; Rezaee, M.; Wen, Z.; Zhou, C. Recovery of rare earth elements from coal fly ash by integrated physical separation and acid leaching. Chemosphere 2020, 248, 126112. [Google Scholar] [CrossRef]
- Tunsu, C.; Menard, Y.; Eriksen, D.O.; Ekberg, C.; Petranikova, M. Recovery of critical materials from mine tailings: A comparative study of the solvent extraction of rare earths using acidic, solvating and mixed extractant systems. J. Clean. Prod. 2019, 218, 425–437. [Google Scholar] [CrossRef]
- Borra, C.R.; Pontikes, Y.; Binnemans, K.; Van Gerven, T. Leaching of rare earths from bauxite residue (red mud). Miner. Eng. 2015, 76, 20–27. [Google Scholar] [CrossRef]
- Peelman, S.; Kooijman, D.; Sietsma, J.; Yang, Y. Hydrometallurgical Recovery of Rare Earth Elements from Mine Tailings and WEEE. J. Sustain. Metall. 2018, 4, 367–377. [Google Scholar] [CrossRef]
- Pan, J.; Nie, T.; Zhou, C.; Yang, F.; Jia, R.; Zhang, L.; Liu, H. The effect of calcination on the occurrence and leaching of rare earth elements in coal refuse. J. Environ. Chem. Eng. 2022, 10, 108355. [Google Scholar] [CrossRef]
- Zhang, W.; Noble, A. Mineralogy characterization and recovery of rare earth elements from the roof and floor materials of the Guxu coalfield. Fuel 2020, 270, 117533. [Google Scholar] [CrossRef]
- Wu, H.; Yang, J.; Huang, L.; Huang, W.; Duan, S.; Ji, S.; Zhang, G.; Ma, J.; Deng, J. Full-components utilization: Study on simultaneous preparation of sodalite and separation of yttrium from coal gangue by chlorination roasting process. Sep. Purif. Technol. 2024, 332, 125802. [Google Scholar] [CrossRef]
- Masmoudi-Soussi, A.; Hammas-Nasri, I.; Horchani-Naifer, K.; Férid, M. Rare earths recovery by fractional precipitation from a sulfuric leach liquor obtained after phosphogypsum processing. Hydrometallurgy 2020, 191, 105253. [Google Scholar] [CrossRef]
- Moraes ML, B.; Murciego, A.; Álvarez-Ayuso, E.; Ladeira AC, Q. The role of Al13-polymers in the recovery of rare earth elements from acid mine drainage through pH neutralization. Appl. Geochem. 2020, 113, 104466. [Google Scholar] [CrossRef]
- Yang, X.; Rozelle, P.L.; Pisupati, S.V. The effect of caustic soda treatment to recover rare earth elements from secondary feedstocks with low concentrations. Miner. Eng. 2021, 173, 107184. [Google Scholar] [CrossRef]
- Zhang, W.; Honaker, R.Q. Rare earth elements recovery using staged precipitation from a leachate generated from coarse coal refuse. Int. J. Coal Geol. 2018, 195, 189–199. [Google Scholar] [CrossRef]
- King, J.F.; Taggart, R.K.; Smith, R.C.; Hower, J.C.; Hsu-Kim, H. Aqueous acid and alkaline extraction of rare earth elements from coal combustion ash. Int. J. Coal Geol. 2018, 195, 75–83. [Google Scholar] [CrossRef]
- Liang, H.; Zhang, P.; Jin, Z.; De Paoli, D.W. Rare Earth and Phosphorus Leaching from a Flotation Tailings of Florida Phosphate Rock. Minerals 2018, 8, 416. [Google Scholar] [CrossRef]
- Rosita, W.; Bendiyasa, I.M.; Perdana, I.; Anggara, F. Recovery of rare earth elements and Yttrium from Indonesia coal fly ash using sulphuric acid leaching. AIP Conf. Proc. 2020, 2223, 050004. [Google Scholar]
- Kuppusamy, V.K.; Kumar, A.; Holuszko, M.E. Simultaneous Extraction of Clean Coal and Rare Earth Elements From Coal Tailings Using Alkali-Acid Leaching Process. J. Energy Resour. Technol. 2019, 141, 070708. [Google Scholar] [CrossRef]
- Li, X.; Jiang, R.; Wang, G.; Chen, Y.; Long, T.; Lin, Y. A Comparative Study of Soil Environmental Standards for Agricultural Land Among Different Countries and Its Implication for China. Environ. Sci. 2022, 43, 577–585. [Google Scholar]

| EW No. | EW Lithotype and Size | Quarrying Area | Soil No. |
|---|---|---|---|
| R1 | Granite waste (0–60 mm) | Montorfano, VCO | MS15 MS16 |
| R2 | Granite waste (60–300 mm) | Montorfano, VCO | |
| R3 | From granite processing (not magnetic concentrate) | Montorfano, VCO | |
| R4 | From granite processing (magnetic concentrate—sand) | Montorfano, VCO | |
| R5 | From granite processing (magnetic concentrate—fine) | Montorfano, VCO | |
| R6 | From granite processing (not magnetic concentrate) | Montorfano, VCO | |
| R7 | Granite waste, coarse | Baveno, VCO | MS12 MS13 |
| R8 | From granite processing (powder fraction) | Baveno, VCO | |
| R9 | From granite processing (magnetic concentrate) | Baveno, VCO | |
| R10 | Gneiss waste, coarse | Crevoladossola, VCO | MS14 |
| R11 | Residual sludge from gneiss | Trontano, VCO | - |
| R12 | Kaolinitic sand, fine | Monte Bracco | MS3 to MS11 |
| R13 | Kaolinitic sand, fine | Monte Bracco | |
| R14 | Kaolinitic sand, fine | Monte Bracco | |
| R15 | Kaolinitic sand, fine | Monte Bracco | |
| R16 | Kaolinitic sand (brown), fine | Monte Bracco | |
| R17 | Quartzite waste, coarse | Monte Bracco | |
| R18 | Gneiss waste, coarse | Rorà, Luserna | MS1 MS2 |
| R19 | Gneiss waste, coarse | Rorà, Luserna | |
| R20 | Gneiss waste, coarse | Rorà, Luserna | |
| R21 | Diorite waste, coarse | Traversella | MS17 MS18 MS19 |
| R22 | Diorite waste, coarse | Traversella | |
| R23 | Joint filling in diorite, brown fine fraction | Traversella | |
| R24 | Filled clasts in Diorite joint, brown coarse fraction | Traversella |
Disclaimer/Publisher’s Note: The statements, opinions and data contained in all publications are solely those of the individual author(s) and contributor(s) and not of MDPI and/or the editor(s). MDPI and/or the editor(s) disclaim responsibility for any injury to people or property resulting from any ideas, methods, instructions or products referred to in the content. |
© 2024 by the authors. Licensee MDPI, Basel, Switzerland. This article is an open access article distributed under the terms and conditions of the Creative Commons Attribution (CC BY) license (https://creativecommons.org/licenses/by/4.0/).
Share and Cite
Zhao, X.; Khelifi, F.; Casale, M.; Cavallo, A.; Padoan, E.; Yang, K.; Dino, G.A. Critical Raw Materials Supply: Challenges and Potentialities to Exploit Rare Earth Elements from Siliceous Stones and Extractive Waste. Resources 2024, 13, 97. https://doi.org/10.3390/resources13070097
Zhao X, Khelifi F, Casale M, Cavallo A, Padoan E, Yang K, Dino GA. Critical Raw Materials Supply: Challenges and Potentialities to Exploit Rare Earth Elements from Siliceous Stones and Extractive Waste. Resources. 2024; 13(7):97. https://doi.org/10.3390/resources13070097
Chicago/Turabian StyleZhao, Xinyuan, Faten Khelifi, Marco Casale, Alessandro Cavallo, Elio Padoan, Ke Yang, and Giovanna Antonella Dino. 2024. "Critical Raw Materials Supply: Challenges and Potentialities to Exploit Rare Earth Elements from Siliceous Stones and Extractive Waste" Resources 13, no. 7: 97. https://doi.org/10.3390/resources13070097