Article

Zai Pits as a Climate-Smart Agriculture Technique in Southern Kenya: Maize Success Is Influenced More by Manure Than Depth

by
Matthew J. Bowers
1,
Simon Kasaine
2 and
Bruce A. Schulte
1,*
1
Department of Biology, Western Kentucky University, Bowling Green, KY 42101, USA
2
Wildlife Works, Voi P.O. Box 310-80300, Kenya
*
Author to whom correspondence should be addressed.
Resources 2024, 13(9), 120; https://doi.org/10.3390/resources13090120
Submission received: 17 May 2024 / Revised: 11 August 2024 / Accepted: 26 August 2024 / Published: 28 August 2024

Abstract

:
In semi-arid southern Kenya, climate change is putting rainfed agriculture at risk with major implications for food security. The zai pit, a Climate-Smart Agriculture (CSA) technique, has proven to enhance yields in arid regions, but its labor demands have limited adoption rates. This study assessed how the zai pit depth and manure application within zai pits influenced maize (Zea mays) success (i.e., growth, development, and productivity). Three zai pit treatments were prepared at the Wildlife Works Research Center in southeastern Kenya: (1) deep (50 cm) with manure; (2) shallow (25 cm) with manure; and (3) deep (50 cm) without manure, and all were compared to a non-zai pit control (surface planting). Maize growth/development (e.g., height, stage, roots) and productivity (e.g., yield) measurements were taken over two growing periods. For most measures, shallow zai pits performed equally as well as deep zai pits, with both performing better than the control. Zai pits without manure performed significantly worse than zai pits with manure, oftentimes not differing from the control. Results suggest that maize success is influenced more by manure than the depth of the pit. Kenyan farmers are encouraged to dig shallower, manure-enriched zai pits to enhance food security in response to climate change.

1. Introduction

Throughout sub-Saharan Africa, agriculture is the largest source of food, income, and employment [1], yet observed crop yields are one third of the predicted maximum [2], and productivity has remained stagnant over the past 50 years [3]. Over 60 percent of the human population in Africa experiences moderate to severe food insecurity, while nearly 20 percent of the population is undernourished [4]. Rapid human population growth [5] is projected to increase these rates [6], emphasizing the need to enhance agricultural productivity.
Climate change is a major threat to agricultural productivity in sub-Saharan Africa [7], where most crops are rainfed and are therefore jeopardized by changes in seasonal rainfall variability [1,8]. In Kenya, arid and semi-arid lands (ASALs), which constitute nearly 80 percent of the country, are characterized by high climatic variability, water scarcity, and poor soil fertility [9,10]. Over the past several decades, the ASALs of southern Kenya have experienced decreasing amounts of annual precipitation [11], and droughts are becoming more frequent and intense [12,13]. Given the large role agriculture plays in the survival and economic stability of the Kenyan population (e.g., one third of gross domestic product, employs over 40 percent of the population and 70 percent of the rural population) [14,15], the effects of climate change on agriculture could put millions of lives and livelihoods at risk.
A strategy that addresses the challenges of climate change and food insecurity is Climate-Smart Agriculture (CSA). The three primary goals of CSA are (1) sustainably increasing agricultural productivity; (2) building resilience to climate change by reducing vulnerability and increasing adaptive capacity; and (3) reducing greenhouse gas emissions associated with agriculture [16,17]. CSA encompasses a wide variety of site-specific technologies and practices while also considering the outcomes, trade-offs, and socio-ecological implications of interventions beyond the farm level [16,18]. In Kenya, since the main food staples are unirrigated crops such as maize (Zea mays) [19], CSA techniques that enhance water and soil conservation are essential to boost crop productivity in response to climate change and reduce vulnerability to food insecurity [20,21,22,23].
One CSA technique that improves rainfall retention and soil fertility in crop fields is the zai pit, which is an ancestral, indigenous technique used in sub-Saharan Africa. Zai pits augment the water infiltration of crusted soils via holes/basins dug in the soil for planting crops (Figure 1). Depending on the crop being grown, these holes can vary 20–60 cm in diameter and 10–60 cm in depth [24,25,26]. For maize production in Kenya, zai pits are traditionally square shaped with a length and width of 60 cm, depth of 60 cm, and spacing of 60 cm between pits [8,27,28] (Figure 1). The excavated topsoil is commonly mixed with manure, vegetative material, and/or other nutrient additives before being filled back into the pit [29,30,31], increasing soil fertility and water retention [24,26,28]. By integrating the soil amendments into each pit rather than depositing them on the surface, they are less likely to be lost to runoff [31]. The remaining excavated subsoil is typically formed into ridges down-slope of the pit to maximize the capture of runoff [24]. Overall, benefits of zai pits include improved water use efficiency, improved soil water-holding capacity, and enhanced plant uptake of soil nutrients such as nitrogen, phosphorus, and potassium, all leading to increased crop yields [26,32]. The main downside is that zai pits are labor intensive and highly demanding during construction; however, a zai pit field can subsequently last multiple growing seasons with little maintenance [28].
The labor associated with zai pits has discouraged their adoption on a large scale [33,34]. Smallholder farmers in Kenya often dig a few zai pits near their homesteads but do not expand this technique to their agricultural fields, as it takes up to 450 h/hectare to dig the pits by hand [35]. Notably, most Kenyan farmers lack agricultural machinery and therefore prepare their fields by hand or by livestock-drawn plow [36,37,38]. Given that zai pits have been shown to increase crop yields by 250–1000% in some instances [24,33,35], finding ways to decrease the labor demands of this technique could increase their usage and therefore have large implications for food security.
To confirm the overall success (i.e., crop growth, development, and productivity) of the zai pit technique, maize grown in traditional zai pits was compared to maize grown via traditional surface planting. We hypothesized that maize growth, development, and productivity within zai pits will be better compared to maize grown using surface planting.
The main objectives of this study were to assess maize growth, development, and productivity in response to (1) zai pit depth; and (2) the use of manure in zai pits. These objectives address the labor concerns associated with zai pits by assessing whether farmers need to dig as deep as they have traditionally. If depth matters, then maize will grow better in deep compared to shallow zai pits. If manure matters, then maize will grow better in zai pits with manure compared to zai pits lacking manure.

2. Materials and Methods

2.1. Study Area

This study took place at the Wildlife Works Research Center, which is an area enclosed by electric fencing to exclude large wildlife within the Rukinga Wildlife Sanctuary (RWS). The RWS is situated within the Kasigau Wildlife Corridor (KWC), which is a vital link between Tsavo East and Tsavo West National Parks in southeastern Kenya [39,40] (Figure 2). The region has an annual rainfall of 300–450 mm [41].

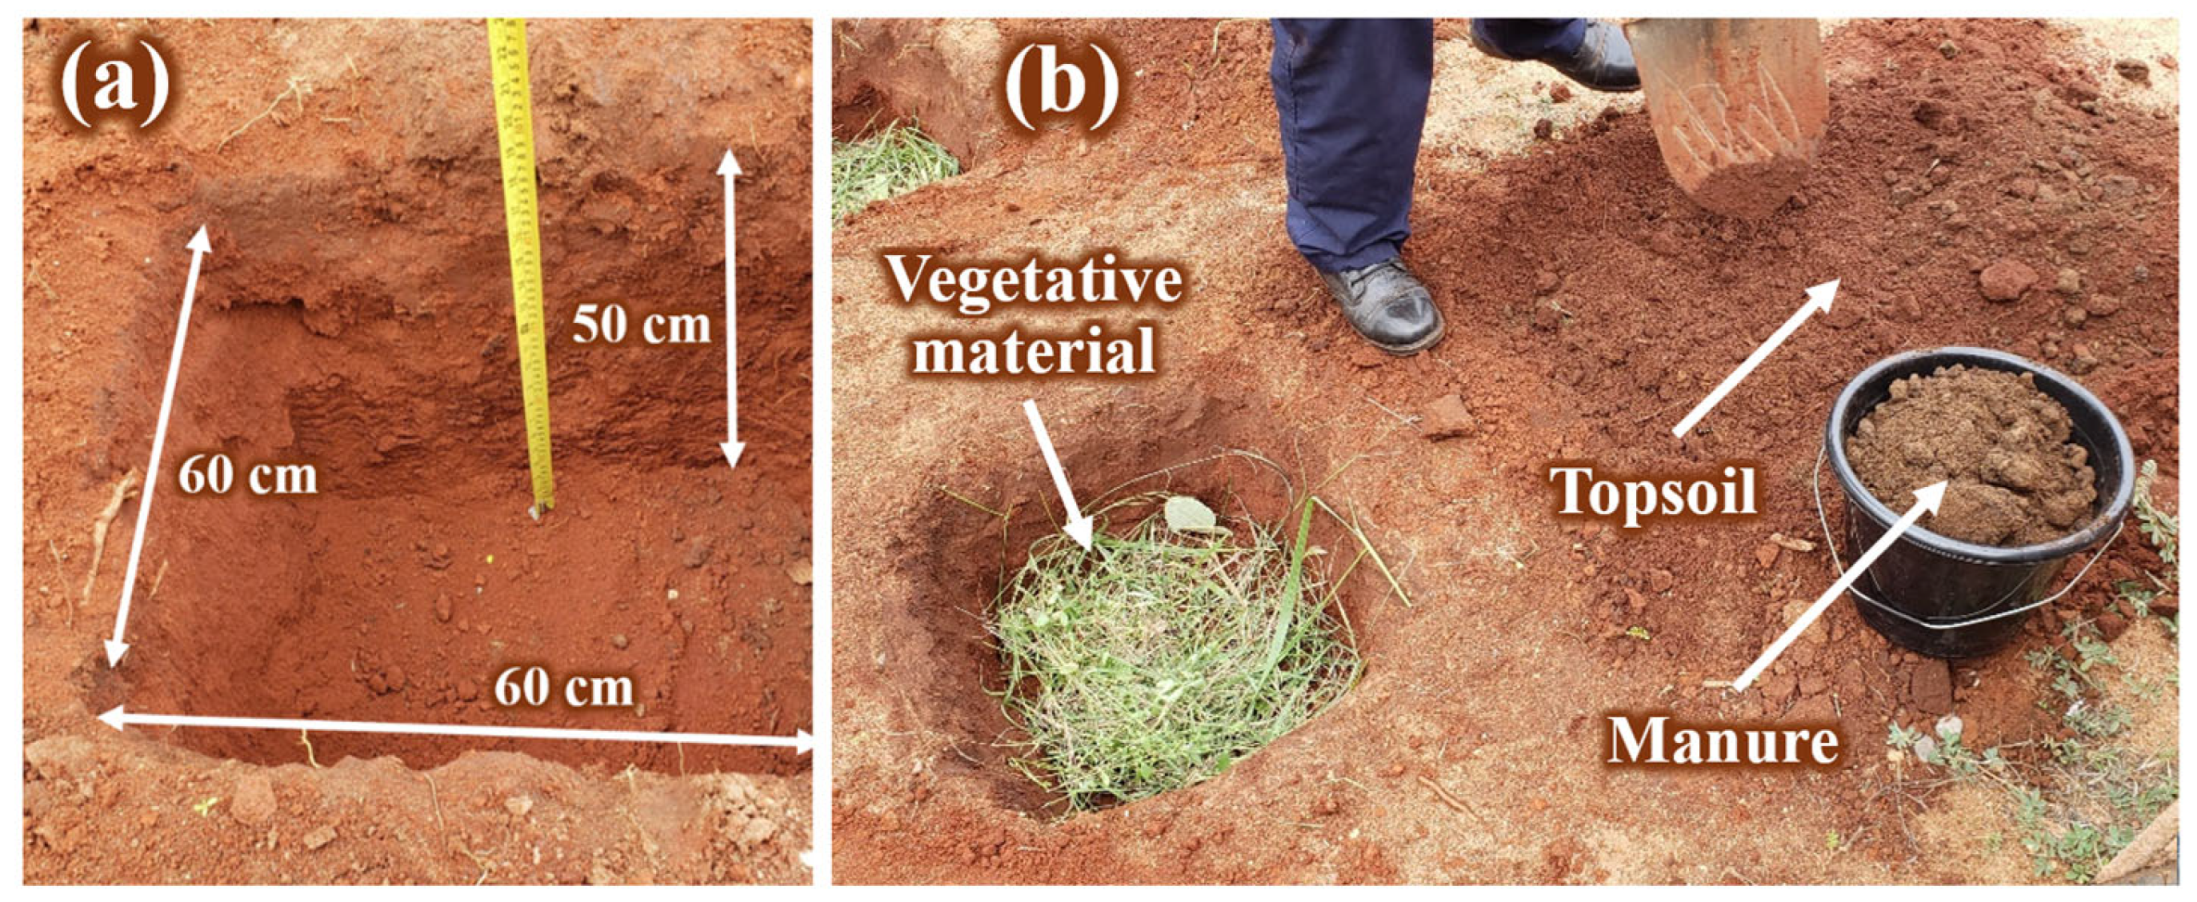
2.2. Experimental Design

In May of 2023, a 9 m by 5 m experimental field containing a seven-by-four grid of square plots (n = 28 plots) was prepared (Figure 3). All plots were 60 cm by 60 cm and spaced 60 cm apart, as they are traditionally structured by farmers in the study area when digging zai pits [26,28]. Three treatments were established within this field: 50 cm deep zai pits with manure (“deep”), 25 cm deep zai pits with manure (“shallow”), and non-zai pit surface planting plots (0 cm, no manure, “control”). Deep zai pits were 50 cm rather than the traditional 60 cm due to difficulty reaching 60 cm during excavation (Figure 4). To account for environmental variation within the field (primarily shade), treatments were arranged in the field using a modified Latin square design (as the field was not a square) so that at least two of each treatment occurred per row and at least one of each treatment occurred per column. The sample size for each treatment was n = 9 with one leftover plot designated as a test plot that was not included in analyses (Figure 3). In August of 2023, a second experimental field was prepared approximately 4 m adjacent to the first field. This 8 m by 2 m field contained six plots, arranged in a single row, with the same dimensions as those in the first field. These plots comprised a fourth treatment: 50 cm deep zai pits without manure (“no manure”) (Figure 3).
For all zai pits, the bottom of the pit was covered with a layer (ca. 2–4 cm) of grass collected from the research center. For zai pits with manure (deep and shallow treatments), the pit was filled with an integrated mixture of topsoil that was dug out from the pit and aged goat/cow manure collected from a single farm in the agricultural community of Sasenyi (Figure 4). The ratio of topsoil to manure was 4:1 as recommended by local farmers. This equates to roughly 4 kg and 8 kg of manure per shallow and deep zai pit, respectively. For zai pits without manure, only the excavated topsoil and subsoil were filled back into the pit. All zai pits were filled almost to surface level, leaving approximately 2–4 cm of indentation for water to accumulate after rain or watering. For the control plots, the soil surface was hoed (ca. 2–4 cm deep) to break up the soil; manure and vegetative material were not added. After all plots had been prepared and filled, nine maize seeds were planted per plot with two seeds per corner and one in the center in accordance with the traditional practices of farmers in the study area. Seeds were “SC Duma 43” variety rated “very early maturity” [44], and they were planted 2–4 cm deep and watered immediately after planting. Each plot was watered roughly twice per week throughout the growing period with 5 L of water per watering to ensure plants stayed alive. Following rain, plants were not watered until they showed signs of stress, such as leaf rolling [45].
Data collection took place over two growing periods (1: 31 May–20 August, 2: 30 August–2 December 2023) for the first field (n = 28), and one growing period (30 August–2 December) for the second field (n = 6). Extensive baboon crop foraging took place in July and August, preventing the collection of yield data for the first growing period. In between growing periods, all plants were uprooted and removed, fences surrounding both fields were strengthened, and no further raiding by baboons occurred. Planting and watering methods were the same for each growing period. However, unlike the first growing period, rain in October and November sustained the plants, such that additional watering was rare.

2.3. Maize Measurements

To assess maize growth and development over time among treatments, the height and stage measurements of each plant were taken roughly twice per week. Height was measured from the soil surface to the apex of the tallest leaf with a curve [46]. As height is not always reflective of plant development [46], a staging system was also used. When in its vegetative (immature) state, a maize plant is staged by counting the number of leaves with a collar, which is a visible crease in the leaf blade near the base where it bends away from the stalk [47,48]. A newly emerged plant without any leaf collars is staged as “VE”. Afterwards, the stage is listed as “V” plus the number of leaves with collars (e.g., V1, V2, V3…Vn) [48]. The last vegetative stage occurs when a tassel fully emerges from the top of the plant (stage VT). A plant becomes reproductively mature once silks start to emerge from the husks of an ear (stage R1) [49,50]. Upon reaching stage R1, plants were no longer staged, as assessing later reproductive stages would have required harvesting ears to measure kernel moisture content [48]. The number of ears was also recorded for any plant that was R1 up until harvest. As the growing periods progressed, the staging of immature plants became difficult, as the lower leaves started to senesce and fall off. Therefore, vegetative stages were only recorded up through week five of development. Plant height continued to be recorded up until a plant reached stage VT. Plant damage (e.g., leaves, ears, or other parts consumed; plant knocked over; stalk snapped) was noted at each visit as well as the species causing the damage (e.g., baboons during the first growing period, armyworms during both growing periods). If a plant was damaged to the point where it impacted the height or stage of the plant, the respective measurement(s) was not recorded.
At the end of each growing period, root measurements were taken. The roots of each plant were shaken to remove attached soil before being laid unstretched on the ground. Root depth was measured from the start of the above-ground brace roots to the tip of the longest vertical root. Root ball diameter was measured at the widest point of the widest side of the main root ball, excluding lone horizontally stretching roots. Combined as a ratio, the above root measurements were used to characterize root system architecture (RSA) as three types: shallow type, intermediate type, and deep and steep type [51]. Additionally, the stem diameter was measured 5 cm up from the top of the brace roots during the second growing period only.
To assess maize productivity among treatments, measurements were taken to calculate yields. Again, due to heavy crop damage during the first growing period, yields could only be measured during the second growing period. All ears were harvested on 2 December (94 days after planting) regardless of their size or maturity. The number of kernels on each ear was counted, and two random kernels representative of the average kernel size were selected from each ear, weighed, and then averaged. Yield per ear (in grams) was then calculated by multiplying the number of kernels by the average kernel weight. Ears without kernels—those that were never fertilized or were too immature to have kernels—were excluded from analyses.

2.4. Statistical Analyses

Statistical analyses were conducted separately for the depth and manure experiments because the design was unbalanced, disallowing the consideration of an interaction between depth and manure. Moving forward, the terminology distinguishing these analyses are “depth” and “manure”. For depth analyses, shallow zai pits (25 cm) were compared to deep zai pits (50 cm) and non-zai pit control plots (0 cm, no manure). For manure analyses, deep zai pits without manure (50 cm) were compared to the same deep zai pits (“manure”) and the control plots used in the depth experiment. The modified Latin square design of the depth experiment accounted for location (i.e., row, column) and other spatially influenced effects like light intensity, and therefore, these variables were not included in the models below. The manure experiment was only conducted in the second growing season. Locational effects could not be statistically distinguished from a treatment effect because the manure and no manure zai pits were in adjacent fields, so these effects were also excluded from models.
To compare maize growth and development over time among treatments, generalized linear mixed models (GLMMs) were generated. The independent variable was the number of days after planting, and the dependent variable was either height or stage. Treatment was included as a fixed effect interacting with the independent variable to compare growth rate slopes. Models, regardless of the experiment or the growing period, were the following: Dependent Variable~Days After Planting × Treatment + (Days After Planting|Plot/Plant). Plot and plant were random effects, with plant nested within plot to prevent pseudoreplication. An Analysis of Covariance (ANCOVA) was performed between the above models and reduced models without the interaction term (e.g., Height~Days After Planting + Treatment) to determine if there were significant differences in slopes among treatments. If there was a heterogeneity of slopes, pairwise comparisons of slopes were made using a Tukey HSD test via the package “emmeans” and function “emtrends” in the programming software R version 4.2.3.
To compare maize growth, development, and productivity measurements at specific periods of time among treatments, GLMMs were generated. The independent variable was treatment, and the dependent variables were as follows: height at week eight, stage at week five, days to reach stage R1, root depth, root ball diameter, RSA ratio (root depth/root ball diameter), stem diameter, number of kernels per ear, mean kernel weight, and yield per ear. Models, regardless of the experiment or the growing period, were the following: Dependent Variable~Treatment + (1|Plot) + (1|Plant). Plot and plant were again random effects to prevent pseudoreplication. Height values at week eight were used (~day 56), as this was the last measurement before plants started to tassel and become reproductive. Stage values at week five were used (~day 37), as this was the last measurement before leaf senescence made staging difficult. For the depth experiment, models for the following variables could only be generated for the second growing period due to a lack of data: days to reach stage R1, stem diameter, number of kernels per ear, mean kernel weight, and yield per ear. An Analysis of Variance (ANOVA) was conducted for each model to assess how mean values varied among treatments, which was followed by a Tukey HSD test for pairwise comparisons. Additionally, an ANOVA and subsequent Tukey HSD test were conducted on the mean number of viable ears per plant (calculated by dividing the total number of viable ears in each plot by the number of plants in that plot) among treatments.
For all maize growth, development, and productivity variables, Pearson correlation tests were conducted, and the results of highly related variables were grouped together in figures for simplicity.
For all statistical tests, the acceptable family-wise type I error rate was calculated using Bonferroni correction for multiple comparisons. For both experiments, α = 0.05 was divided by the total number of variables tested (n = 13), resulting in α = 0.0038. All statistical tests were run in R version 4.2.3.

3. Results

3.1. Zai Pit Effectiveness

Over the 13 variables measured, only the mean number of viable ears per plant did not differ significantly for the depth (F = 3.30, df = 24, p = 0.054) or manure (F = 3.07, df = 21, p = 0.068) experiments. The remaining 12 variables support the hypothesis that traditional zai pits improve the growth of maize compared to traditional surface planting (see below).

3.2. Depth Experiment

For 9 of the 13 variables (i.e., height growth rate, height at week eight, stage growth rate, stage at week five, days to reach stage R1, root ball diameter, number of kernels per ear, mean kernel weight, and yield per ear), maize grown in deep zai pits and shallow zai pits performed similarly with both performing significantly better than maize grown in the control plots (i.e., [deep = shallow] > control) (Table 1, rows 1–5, 7, 10–12; Figure 5a,b and Figure 6).
For 2 of the 13 variables (i.e., root depth, stem diameter), maize grown in deep zai pits performed significantly better than maize grown in shallow zai pits, and both performed significantly better than maize grown in the control plots (i.e., deep > shallow > control) (Table 1, rows 6, 9; Figure 5c).
For one of the 13 variables—RSA ratio—during the first growing period, results fit the pattern deep > shallow > control, while during the second growing period, results fit the pattern (deep = shallow) > control (Table 1, row 8).

3.3. Manure Experiment

For 9 of the 13 variables (i.e., height growth rate, height at week eight, stage growth rate, days to reach stage R1, root ball diameter, stem diameter, number of kernels per ear, mean kernel weight, and yield per ear), maize grown in zai pits with manure performed significantly better than maize grown in both zai pits without manure and the control plots, and maize in zai pits without manure and the control plots performed similarly (i.e., manure > [no manure = control]) (Table 2, rows 1–3, 5, 7, 9–12; Figure 7a,b,d).
For 2 of the 13 variables (i.e., stage at week five, root depth), maize grown in zai pits with manure performed significantly better than maize grown in zai pits without manure, and both performed significantly better than maize grown in the control plots (i.e., manure > no manure > control) (Table 2, rows 4, 6; Figure 7c).
For 1 of the 13 variables—RSA ratio—maize grown in zai pits with manure and zai pits without manure performed similarly, with both performing significantly better than maize grown in the control plots (i.e., [manure = no manure] > control) (Table 2, row 8).

4. Discussion

The results of this study showed that zai pits are a superior means of growing maize compared to surface planting at our study site, supporting the findings of previous research [24,29,31,32,33,34]. Our primary objectives were to assess if zai pit functionality was retained in shallower zai pits and in zai pits without manure, as both these features add to the labor of constructing zai pits. Our findings indicate that shallower zai pits can be just as effective as deeper ones and that manure at least in deeper zai pits is essential for improving maize growth compared to surface planting. Thus, in our study, maize growth, development, and productivity in zai pits was influenced more by manure than depth. Based on our findings, we encourage farmers to dig shallower (25 cm) compared to the traditional (50 cm) zai pits and retain the use of manure.
Regardless of the agricultural technique used, the application of animal manure has been shown to increase crop growth, development, and productivity compared to non-manure counterparts [52]. Zai pits with manure have produced larger yields and have increased plant growth in sorghum (Sorghum) [20,30,34], pearl millet (Pennisetum glaucum) [53], cowpeas (Vigna unguiculata) [31], and maize [32] compared to zai pits without manure. These differences in yields are largely due to enhanced soil fertility and structure [20,25,29,54]. In addition to improving soil nutrient concentrations, manure improves soil water retention [55,56], so manure use in zai pits likely builds upon the existing water-saving structural components of the pit. The moist environment of zai pits favors microbe decomposition and nutrient release in manure, increasing the value of the manure (compared to surface application) and emphasizing the mutualistic zai–manure relationship [57]. In the present study, plants grown in zai pits with manure not only had higher yields than zai pits without manure, but they also reached reproductive maturity six days earlier on average. Farmers in the region prefer crops that reach maturity faster and can be harvested sooner, as these crops are less likely to succumb to prolonged drought [58] or foraging by wildlife such as elephants [59,60,61].
To the average Kenyan farmer, yields matter more than growth and development, as yields correlate to food availability and income [62]. Zai pit depth (25 cm vs. 50 cm) did not influence maize yields, which is supported by Oduor et al. [31], who found no significant difference in cowpea yields between 30 cm, 45 cm, and 60 cm zai pits. A threshold likely exists for the benefits of depth, as deeper zai pits (e.g., 50–60 cm) can store water for longer, but they risk being waterlogged, which can lead to increased leaching of soil nutrients and impact crop success [31]. Depending on the soil qualities and precipitation levels of a region, depth might be more or less important. Future studies could assess progressively shallower zai pits (e.g., 20 cm, 10 cm, 5 cm) with manure to see if a threshold depth for maize growth, development, and productivity exists in the study region.
Root measurements were one of the few variables that were significantly different between deep and shallow zai pits. Deep zai pits had longer roots in both growing periods and a larger RSA ratio in growing period one, indicating that these roots are more representative of the “deep and steep” RSA category [51]. In addition to acquiring otherwise inaccessible water, deeper roots uptake more nitrogen [63,64], which can increase yields in arid areas with nutrient-poor soils [65]; however, this was not supported by this study. Additionally, the roots in deep zai pits did not utilize the full depth of the pit (50 cm; mean root depth was ~22 cm), suggesting that digging to 50 cm was unnecessary. However, by regularly watering plants in this study (twice per week in growing period one), roots likely did not have to grow as deep into the soil as they would have under less predictable conditions with higher water stress [66]. Given the arid conditions of the study area and the increased frequency of droughts [11,41], future studies could assess whether shallow zai pits perform just as well during the growing season without supplemental watering.
The battle with zai pits involves balancing their effectiveness with their affordability and practicality. This study suggests that farmers do not need to dig as deep, which would improve the practicality of the technique by reducing time and labor. Farmers state that the biggest challenge of using zai pits is labor, as most lack machinery [38], household labor, or the capital to hire labor [28]. Women may be less attracted to zai pit use because of their commitment to non-farm activities such as cooking, raising children, and collecting water and firewood [28]. By digging 25 cm deep zai pits with manure, more pits can be dug while still achieving the enhanced yields associated with the technique. Any marginal increase in the use of zai pits can have a large positive impact on local food security, and the total monetary benefits of zai pits with manure greatly outweigh the costs [34]. Additionally, zai pits can last multiple growing seasons (up to four to six seasons, or 2–3 years) with little maintenance, so the high labor costs of this technique do not need to be incurred every growing season [28,67]. Another factor that influences zai pit adoption is whether a farmer is a member of a social group such as a farming organization [28]. Zai pits are more practical when undertaken by a group of farmers rather than individuals, as more pits can be dug per unit time [24].
Manure availability must also be considered when assessing the affordability and practicality of zai pits. Over two thirds of Kenyan farmers own livestock [68,69], so the implementation of manure-enriched zai pits on a large scale is possible but would likely require sharing between farmers in a community. The adoption of shallow zai pits will save resources and be more economical than deep zai pits, as half of the amount of manure is needed for the same number of plants. Overall, the integration of manure in shallow zai pits is more sustainable and less wasteful than conventional manure applications, which involve simply broadcasting it on top of a field; much of this manure becomes baked or is washed away, and nutrients are often not concentrated where plants can use them [25]. Excessive manure use should be avoided, as nutrient losses by leaching occur when nutrient release exceeds crop nutrient uptake [57]. Mustapha et al. [30] found that a zai pit manure application rate of three tons per hectare resulted in significantly higher sorghum yields than rates of one and two tons per hectare, while Motis et al. [25] report that at least four tons of manure per hectare of zai pits is needed. For Kenyan soils, regardless of the agricultural practice, a rate of 2–5 tons of manure per hectare is suggested [70]. As manure application rates in this study were well above the suggested rate (tenfold, although this is the rate farmers use in the study area), future studies could assess progressively smaller rates of manure in zai pits to determine the threshold where maize growth, development and productivity are impacted by manure availability. To supplement such studies, data on physical and chemical soil parameters should also be collected to evaluate differences in soil moisture content and nutrients between different zai pit variants. The availability of vegetative material for zai pits should also be considered in the future. All zai pits in this study incorporated vegetative material; however, much like how manure was studied here, future studies could assess the role of vegetative material on maize growth, development, and productivity in zai pits.
As maize in the arid and semi-arid lands (ASAL) of Kenya continues to be plagued by poor soil fertility and climate variability [9,71], zai pits pose a viable solution while also conserving and valuing indigenous knowledge [72]. Sustainable manure application within zai pits meets the three goals of CSA by increasing agricultural productivity and building resilience to climate change while minimizing the environmental impact of agriculture [16,17]. CSA techniques will become more necessary to improve food security as human populations continue to grow and climate change progresses [73].

Author Contributions

Conceptualization, M.J.B., S.K. and B.A.S.; methodology, M.J.B. and B.A.S.; formal analysis, M.J.B.; investigation, M.J.B.; resources, S.K. and B.A.S.; writing—original draft preparation, M.J.B.; writing—review and editing, M.J.B., S.K. and B.A.S.; visualization, M.J.B.; supervision, B.A.S.; project administration, M.J.B. and B.A.S.; funding acquisition, M.J.B. and B.A.S. All authors have read and agreed to the published version of the manuscript.

Funding

This research was financially supported by Earthwatch Institute (award date 28 October 2022), the Western Kentucky University (WKU) Graduate School (no. 221660), the WKU Ogden College (Quick Turn-Around Grant, award date 6 July 2023), and the WKU Department of Biology (graduate research assistantship, award date 3 August 2023).

Data Availability Statement

The raw data supporting the conclusions of this article will be made available by the authors on request.

Acknowledgments

The authors are thankful for support from all partners of the Elephants and Sustainable Agriculture in Kenya (ESAK) project, including Wildlife Works, Western Kentucky University, Earthwatch Institute (and the 2023 Earthwatch volunteers who assisted with data collection), Jomo Kenyatta University of Agriculture and Technology, the International Elephant Foundation, the University of Nairobi, Taita Taveta University, and Tsavo Trust. All research was conducted in accordance with permission from: NACOSTI permit #NACOSTI/P/23/24929, WRTI permit #WRTI-293-03-23, and WKU IACUC permit #22-11.

Conflicts of Interest

Author S.K. was employed by the company Wildlife Works. The remaining authors declare that the research was conducted in the absence of any commercial or financial relationships that could be construed as a potential conflict of interest.

References

  1. Ssozi, J.; Asongu, S.; Amavilah, V.H. The effectiveness of development aid for agriculture in sub-Saharan Africa. J. Econ. Stud. 2019, 46, 284–305. [Google Scholar] [CrossRef]
  2. Calzadilla, A.; Zhu, T.; Rehdanz, K.; Tol, R.S.J.; Ringler, C. Economywide impacts of climate change on agriculture in Sub-Saharan Africa. Ecol. Econ. 2013, 93, 150–165. [Google Scholar] [CrossRef]
  3. Jayne, T.S.; Mather, D.; Mghenyi, E. Principal challenges confronting smallholder agriculture in Sub-Saharan Africa. World Dev. 2010, 38, 1384–1398. [Google Scholar] [CrossRef]
  4. FAO; AUC; ECA; WFP. Africa—Regional Overview of Food Security and Nutrition 2023: Statistics and Trends; FAO: Accra, Ghana, 2023. [Google Scholar] [CrossRef]
  5. Kaba, A.J. Explaining Africa’s rapid population growth, 1950 to 2020: Trends, factors, implications, and recommendations. Sociol. Mind 2020, 10, 226–268. [Google Scholar] [CrossRef]
  6. Hall, C.; Dawson, T.P.; Macdiarmid, J.I.; Matthews, R.B.; Smith, P. The impact of population growth and climate change on food security in Africa: Looking ahead to 2050. Int. J. Agric. Sustain. 2017, 15, 124–135. [Google Scholar] [CrossRef]
  7. Nhemachena, C.; Nhamo, L.; Matchaya, G.; Nhemachena, C.R.; Muchara, B.; Karuaihe, S.T.; Mpandeli, S. Climate change impacts on water and agriculture sectors in southern Africa: Threats and opportunities for sustainable development. Water 2020, 12, 2673. [Google Scholar] [CrossRef]
  8. Biazin, B.; Sterk, G.; Temesgen, M.; Abdulkedir, A.; Stroosnijder, L. Rainwater harvesting and management in rainfed agricultural systems in sub-Saharan Africa—A review. Phys. Chem. Earth Pt. A/B/C 2012, 47, 139–151. [Google Scholar] [CrossRef]
  9. Kipkulei, H.K.; Bellingrath-Kimura, S.D.; Lana, M.; Ghazaryan, G.; Baatz, R.; Boitt, M.; Chisanga, C.B.; Rotich, B.; Sieber, S. Assessment of maize yield response to agricultural management strategies using the DSSAT–CERES-Maize model in trans Nzoia County in Kenya. Int. J. Plant Prod. 2022, 16, 557–577. [Google Scholar] [CrossRef]
  10. Makoti, A.; Waswa, F. Rural community coping strategies with drought-driven food insecurity in Kwale County, Kenya. J. Food Secur. 2015, 3, 87–93. [Google Scholar] [CrossRef]
  11. Marigi, S.N.; Njogu, A.K.; Githungo, W.N. Trends of extreme temperature and rainfall indices for arid and semi-arid lands of South Eastern Kenya. J. Geosci. Environ. Prot. 2016, 4, 158–171. [Google Scholar] [CrossRef]
  12. Ochieng, P.O.; Nyandega, I.; Wambua, B.; Ongoma, V. Linkages between Madden–Julian oscillation and drought events over Kenya. Meteorol. Atmos. Phys. 2023, 135, 9. [Google Scholar] [CrossRef]
  13. PBS. Kenya’s Worst Drought in Decades Creates Humanitarian Crisis. Available online: https://www.pbs.org/newshour/show/kenyas-worst-drought-in-decades-creates-humanitarian-crisis (accessed on 16 May 2024).
  14. Ogallo, L.A.; Otengi, S.B.; Ambenje, P.; Nyakwada, W.; Githui, F. Monitoring agricultural drought: The case of Kenya. In Monitoring and Predicting Agricultural Drought: A Global Study; Boken, V.K., Craknell, A.P., Heathcote, R.L., Eds.; Oxford University Press, Inc.: New York, NY, USA, 2005; pp. 238–251. [Google Scholar]
  15. USAID. Agriculture and Food Security: Kenya. Available online: https://www.usaid.gov/kenya/agriculture-and-food-security#:~:text=The%20agricultural%20sector%20is%20the,percent%20of%20the%20rural%20population (accessed on 16 May 2024).
  16. FAO. Climate-Smart Agriculture Sourcebook. Available online: https://openknowledge.fao.org/server/api/core/bitstreams/b21f2087-f398-4718-8461-b92afc82e617/content (accessed on 16 May 2024).
  17. The World Bank. Climate-Smart Agriculture. Available online: https://www.worldbank.org/en/topic/climate-smart-agriculture (accessed on 16 May 2024).
  18. USDA NRCS. NRCS Climate-Smart Mitigation Activities. Available online: https://www.nrcs.usda.gov/conservation-basics/natural-resource-concerns/climate/climate-smart-mitigation-activities (accessed on 16 May 2024).
  19. Shimeles, A.; Verdier-Chouchane, A.; Boly, A. Introduction: Understanding the challenges of the agricultural sector in Sub-Saharan Africa. In Building a Resilient and Sustainable Agriculture in Sub-Saharan Africa; Shimeles, A., Verdier-Chouchane, A., Boly, A., Eds.; Springer Nature: Basingstoke, UK, 2018; pp. 1–11. [Google Scholar] [CrossRef]
  20. Getare, E.K.; Mucheru-Muna, M.; Muriu-Ng’ang’a, F.; Ndung’u, C.K. Utilisation of zai pits and soil fertility management options for improved crop production in the dry ecosystem of Kitui, Eastern Kenya. Afr. J. Agric. Res. 2021, 17, 1547–1558. [Google Scholar] [CrossRef]
  21. Kogo, B.K.; Kumar, L.; Koech, R. Climate change and variability in Kenya: A review of impacts on agriculture and food security. Environ. Dev. Sustain. 2021, 23, 23–43. [Google Scholar] [CrossRef]
  22. Ouiminga, I. Profitability in a sustainable agricultural production system: An approach by the soil and water conservation. In Building a Resilient and Sustainable Agriculture in Sub-Saharan Africa; Shimeles, A., Verdier-Chouchane, A., Boly, A., Eds.; Springer Nature: Basingstoke, UK, 2018; pp. 123–145. [Google Scholar] [CrossRef]
  23. Speranza, C.I.; Kiteme, B.; Wiesmann, U. Droughts and famines: The underlying factors and the causal links among agro-pastoral households in semi-arid Makueni district, Kenya. Glob. Environ. Chang. 2008, 18, 220–233. [Google Scholar] [CrossRef]
  24. Danjuma, M.N.; Mohammed, S. Zai pits system: A catalyst for restoration in the dry lands. J. Agric. Vet. Sci. 2015, 8, 2319–2372. [Google Scholar] [CrossRef]
  25. Motis, T.; D’Aiuto, C.; Lingbeek, B. Zai pit system. ECHO Tech. Note 2013, 78, 1–11. [Google Scholar]
  26. Muchiri, P.M.; Ogara, W.O.; Karanja, F.K.; Maweu, J.M. A climate-smart agriculture approach using double digging, zai pits and aquacrop model in rain-fed sorghum cultivation at Wiyumiririe location of Laikipia County, Kenya. Afr. J. Phys. Sci. 2020, 4, 23–53. [Google Scholar]
  27. Kathuli, P.; Itabari, J.K. In-situ soil moisture conservation: Utilisation and management of rainwater for crop production. Int. J. Agric. Resour. Gov. Ecol. 2014, 10, 295–310. [Google Scholar] [CrossRef]
  28. Kimaru-Muchai, S.W.; Ngetich, F.K.; Baaru, M.; Mucheru-Muna, M.W. Adoption and utilisation of zai pits for improved farm productivity in drier upper eastern Kenya. J. Agric. Rural Dev. Trop. 2020, 121, 13–22. [Google Scholar] [CrossRef]
  29. Kebenei, M.C.; Mucheru-Muna, M.; Muriu-Ng’ang’a, F.; Ndung’u, C.K. Zai technology and integrated nutrient management for improved soil fertility and increased sorghum yields in Kitui county, Kenya. Front. Sustain. Food Syst. 2021, 5, 714212. [Google Scholar] [CrossRef]
  30. Mustapha, Y.K.; Mani, F.A.; Bunu, A. Effects of zai (pit planting) and different manure rates on the growth and yield of sorghum. Int. J. Res. Appl. Sci. Eng. Technol. 2021, 9, 21–25. [Google Scholar] [CrossRef]
  31. Oduor, S.O.; Mungai, N.W.; Owido, S.F. Zai pit effects on selected soil properties and cowpea (Vigna unguiculata) growth and grain yield in two selected dryland regions of Kenya. Open J. Soil Sci. 2021, 11, 39–57. [Google Scholar] [CrossRef]
  32. Kugedera, A.T. The use of zai pits and integrated nutrient management as a strategy in improving maize grain yield: A case of Zvipani Area in Hurungwe. Amity J. Manag. Res. 2022, 5, 537–549. [Google Scholar]
  33. Amede, T.; Menza, M.; Awlachew, S.B. Zai improves nutrient and water productivity in the Ethiopian highlands. Exp. Agric. 2011, 47, 7–20. [Google Scholar] [CrossRef]
  34. Kimaru-Muchai, S.W.; Ngetich, F.K.; Mucheru-Muna, M.W.; Baaru, M. Zai pits for heightened sorghum production in drier parts of Upper Eastern Kenya. Heliyon 2021, 7, e08005. [Google Scholar] [CrossRef]
  35. Kaboré, D.; Reij, C. The Emergence and Spreading of an Improved Traditional Soil and Water Conservation Practice in Burkina Faso; International Food Policy Research Institute: Washington, DC, USA, 2004; Volume 114, pp. 1–28. [Google Scholar]
  36. Mumah, E.; Chen, Y.; Hong, Y.; Okello, D. Machinery adoption and its effect on maize productivity among smallholder farmers in western Kenya: Evidence from the chisel harrow tillage practice. Res. World Agric. Econ. 2024, 5, 1–18. [Google Scholar] [CrossRef]
  37. Pingali, P. Agricultural mechanization: Adoption patterns and economic impact. Handb. Agric. Econ. 2007, 3, 2779–2805. [Google Scholar] [CrossRef]
  38. Wawire, N.W.; Bett, C.; Ruttoh, R.C.; Wambua, J.; Omari, F.G.; Kisilu, R.; Kavoi, J.; Omari, J.; Wanyonyi, N.W.; Ketiem, P. The Status of Agricultural Mechanization in Kenya; Kenya Agricultural & Livestock Research Organization: Nairobi, Kenya, 2016; pp. 1–14. [Google Scholar]
  39. Wildlife Works Carbon. Sustainable Development Verified Impact Standard: The Kasigau Corridor REDD+ Project Phase I—Rukinga Sanctuary. Available online: https://registry.verra.org/mymodule/ProjectDoc/Project_ViewFile.asp?FileID=72451&IDKEY=s097809fdslkjf09rndasfufd098asodfjlkduf09nm23mrn87s99909929 (accessed on 16 May 2024).
  40. Wildlife Works Carbon. Sustainable Development Verified Impact Standard: The Kasigau Corridor REDD+ Project Phase II—The Community Ranches. Available online: https://registry.verra.org/mymodule/ProjectDoc/Project_ViewFile.asp?FileID=72454&IDKEY=s8723kjnf7kjandsaslmdv09887vaksmrmnwqkjoiuanfnfuq0r99914066 (accessed on 16 May 2024).
  41. Githiru, M.; Kasaine, S.; Mdamu, D.M.; Amakobe, B. Recent records and conservation issues affecting the African wild dogs in the Kasigau Corridor, south-east Kenya. Canid Biol. Conserv. 2014, 17, 1478–2677. [Google Scholar]
  42. Vacarro, D.; Schulte, B.A. Mammalian and avian community response to African elephant (Loxodonta africana) habitat disturbance in southeastern Kenya. Afr. J. Zool, 2024; in review. [Google Scholar]
  43. Von Hagen, L.; LaDue, C.A.; Schulte, B.A. Elephant scar prevalence in the Kasigau Wildlife Corridor, Kenya: Echoes of human-elephant conflict. Animals 2023, 13, 605. [Google Scholar] [CrossRef]
  44. Seed, Co. Kenya. SC Duma 43. Available online: https://seedcogroup.com/ke/fieldcrops/sc-partners/sc-duma-43/ (accessed on 16 May 2024).
  45. Kadioglu, A.; Terzi, R. A dehydration avoidance mechanism: Leaf rolling. Bot. Rev. 2007, 73, 290–302. [Google Scholar] [CrossRef]
  46. Province of Manitoba. Are You Staging Corn Correctly? Available online: https://www.gov.mb.ca/agriculture/crops/seasonal-reports/Pubs/staging-corn-correctly.pdf (accessed on 16 May 2024).
  47. Nielsen, R.L. Determining corn leaf stages. Corny News Netw. Artic. 2003, 237, 1–2. [Google Scholar]
  48. Nleya, T.; Chungu, C.; Kleinjan, J. Corn growth and development. In iGrow Corn: Best Management Practices; Clay, D.E., Carlson, C.G., Clay, S.A., Byamukama, E., Eds.; South Dakota State University: Brookings, SD, USA, 2016; pp. 1–10. [Google Scholar]
  49. Abendroth, L.J.; Elmore, R.W.; Boyer, M.J.; Marlay, S.K. Corn Growth and Development; Iowa State University of Science and Technology, Cooperative Extension Service: Ames, IA, USA, 2011; pp. 1–50. [Google Scholar]
  50. Nielsen, R.L. Silk development and emergence in corn. Corny News Netw. 2016, 7, 1–5. [Google Scholar]
  51. Mi, G.; Chen, F.; Yuan, L.; Zhang, F. Ideotype root system architecture for maize to achieve high yield and resource use efficiency in intensive cropping systems. Adv. Agron. 2016, 139, 73–97. [Google Scholar] [CrossRef]
  52. Githongo, M.W.; Kiboi, M.N.; Ngetich, F.K.; Musafiri, C.M.; Muriuki, A.; Fliessbach, A. The effect of minimum tillage and animal manure on maize yields and soil organic carbon in sub-Saharan Africa: A meta-analysis. Environ. Challeng. 2021, 5, 100340. [Google Scholar] [CrossRef]
  53. Fatondji, D.; Martius, C.; Bielders, C.L.; Vlek, P.L.; Bationo, A.; Gerard, B. Effect of planting technique and amendment type on pearl millet yield, nutrient uptake, and water use on degraded land in Niger. Nutr. Cycl. Agroecosyst. 2006, 76, 203–217. [Google Scholar] [CrossRef]
  54. Muchai, S.W.K.; Mucheru-Muna, M.W.; Ngetich, F.K.; Gitari, H.I.; Nungula, E.Z.; Baaru, M. Interactive effects of zai pits and convectional practices with soil amendments on soil physico-chemical properties. Int. J. Biores. Sci. 2023, 10, 185–196. [Google Scholar] [CrossRef]
  55. Blanco-Canqui, H.; Hergert, G.W.; Nielsen, R.A. Cattle manure application reduces soil compactibility and increases water retention after 71 years. Soil Sci. Soc. Am. J. 2015, 79, 212–223. [Google Scholar] [CrossRef]
  56. Rayne, N.; Aula, L. Livestock manure and the impacts on soil health: A review. Soil Syst. 2020, 4, 64. [Google Scholar] [CrossRef]
  57. Fatondji, D.; Martius, C.; Zougmore, R.; Vlek, P.L.; Bielders, C.L.; Koala, S. Decomposition of organic amendment and nutrient release under the zai technique in the Sahel. Nutr. Cycl. Agroecosys. 2009, 85, 225–239. [Google Scholar] [CrossRef]
  58. Bello, O.B.; Abdulmaliq, S.Y.; Ige, S.; Mahamood, J.; Oluleye, F.; Azeez, M.A.; Afolabi, M.S. Evaluation of early and late/intermediate maize varieties for grain yield potential and adaptation to a southern guinea savanna agro-ecology of Nigeria. Int. J. Plant Res. 2012, 2, 14–21. [Google Scholar] [CrossRef]
  59. Mukeka, J.M.; Ogutu, J.O.; Kanga, E.; Røskaft, E. Human-wildlife conflicts and their correlates in Narok County, Kenya. Glob. Ecol. Conserv. 2019, 18, e00620. [Google Scholar] [CrossRef]
  60. Von Hagen, R.L.; Kasaine, S.; Githiru, M.; Amakobe, B.; Mutwiwa, U.N.; Schulte, B.A. Metal strip fences for preventing African elephant (Loxodonta africana) crop foraging in the Kasigau Wildlife Corridor, Kenya. Afr. J. Ecol. 2021, 59, 293–298. [Google Scholar] [CrossRef]
  61. Corde, S.C.; Von Hagen, R.L.; Kasaine, S.; Mutwiwa, U.N.; Amakobe, B.; Githiru, M.; Schulte, B.A. A comparison of deterrent fence types as a means of human-elephant conflict mitigation in southeastern Kenya. J. Nat. Conserv, 2024; in review. [Google Scholar]
  62. Mumo, L.; Yu, J.; Fang, K. Assessing impacts of seasonal climate variability on maize yield in Kenya. Int. J. Plant. Prod. 2018, 12, 297–307. [Google Scholar] [CrossRef]
  63. Lynch, J.P. Steep, cheap and deep: An ideotype to optimize water and N acquisition by maize root systems. Ann. Bot. 2013, 112, 347–357. [Google Scholar] [CrossRef] [PubMed]
  64. Schneider, H.M.; Lor, V.S.N.; Hanlon, M.T.; Perkins, A.; Kaeppler, S.M.; Borkar, A.N.; Bhosale, R.; Zhang, X.; Rodriguez, J.; Bucksch, A.; et al. Root angle in maize influences nitrogen capture and is regulated by calcineurin B-like protein (CBL)-interacting serine/threonine-protein kinase 15 (ZmCIPK15). Plant Cell Environ. 2022, 45, 837–853. [Google Scholar] [CrossRef] [PubMed]
  65. Dathe, A.; Postma, J.A.; Postma-Blaauw, M.B.; Lynch, J.P. Impact of axial root growth angles on nitrogen acquisition in maize depends on environmental conditions. Ann. Bot. 2016, 118, 401–414. [Google Scholar] [CrossRef]
  66. Fan, Y.; Miguez-Macho, G.; Jobbágy, E.G.; Jackson, R.B.; Otero-Casal, C. Hydrologic regulation of plant rooting depth. Proc. Natl. Acad. Sci. USA 2017, 114, 10572–10577. [Google Scholar] [CrossRef]
  67. Mati, B.M. Overview of Water and Soil Nutrient Management under Smallholder Rain-Fed Agriculture in East Africa; Working Paper 105; International Water Management Institute: Colombo, Sri Lanka, 2006; pp. 1–85. [Google Scholar]
  68. Dumas, S.E.; Maranga, A.; Mbullo, P.; Collins, S.; Wekesa, P.; Onono, M.; Young, S.L. “Men are in front at eating time, but not when it comes to rearing the chicken”: Unpacking the gendered benefits and costs of livestock ownership in Kenya. Food Nutr. Bull. 2018, 39, 3–27. [Google Scholar] [CrossRef]
  69. Njarui, D.M.G.; Gichangi, E.M.; Gatheru, M.; Nyambati, E.M.; Ondiko, C.N.; Njunie, M.N.; Ndungu-Magiroi, K.W.; Kiiya, W.W.; Kute, C.A.O.; Ayako, W. A comparative analysis of livestock farming in smallholder mixed crop-livestock systems in Kenya: 2. Feed utilization, availability and mitigation strategies to feed scarcity. Livest. Res. Rural Dev. 2016, 28, 66. [Google Scholar]
  70. Mangale, N.; Muriuki, A.; Kathuku-Gitonga, A.N.; Kibunja, C.N.; Mutegi, J.K.; Esilaba, A.O.; Ayuke, F.O.; Nguluu, S.N.; Gikonyo, E.W. Field and Laboratory Research Manual for Integrated Soil Fertility Management in Kenya; Kenya Soil Health Consortium KALRO Kabete: Nairobi, Kenya, 2016; pp. 1–96. [Google Scholar]
  71. Mafouasson, H.N.A.; Kenga, R.; Gracen, V.; Ntsomboh-Ntsefong, G.; Tandzi, L.N.; Ngome, P.I.T. Production constraints, farmers’ preferred characteristics of maize varieties in the bimodal humid forest zone of Cameroon and their implications for plant breeding. Agric. Res. 2020, 9, 497–507. [Google Scholar] [CrossRef]
  72. Agbor, R.E.; Elangwe, W. Indigenous peoples and agrobiodiversity in Africa. In Environmental Resilience and Food Law; Steier, G., Cianci, A.G., Eds.; CRC Press: Boca Raton, FL, USA, 2019; pp. 77–106. [Google Scholar]
  73. Lipper, L.; Thornton, P.; Campbell, B.M.; Baedeker, T.; Braimoh, A.; Bwalya, M.; Caron, P.; Cattaneo, A.; Garrity, D.; Henry, K.; et al. Climate-smart agriculture for food security. Nat. Clim. Chang. 2014, 4, 1068–1072. [Google Scholar] [CrossRef]
Figure 1. A zai pit planted with maize (corn).
Resources 13 00120 g001
Figure 2. A map of Rukinga Wildlife Sanctuary (RWS) situated within the Kasigau Wildlife Corridor (KWC) in southern Kenya. The study took place at the Wildlife Works Research Center situated within the RWS (purple dot). Zoomed-out panels of the study site on the left are from Vaccaro and Schulte [42], while the base for the KWC panel on the right is from Von Hagen et al. [43] (maps used with permission).
Resources 13 00120 g002
Figure 3. The experimental design for both experimental fields. Each box correlates to a plot. “DZ” = deep zai pits (50 cm), “SZ” = shallow zai pits (25 cm), “C” = control plots (0 cm), “No M” = deep zai pits (50 cm) without manure, and “Test” = a test plot (excluded). Spacing between plots and between fields is not to scale; plots were 60 cm by 60 cm and spaced 60 cm apart while the fields were separated by 4 m.
Resources 13 00120 g003
Figure 4. The dimensions of a deep zai pit (a) and the components of a zai pit (b). Topsoil and manure were mixed at a 4:1 ratio before being filled into the pit atop a layer of vegetative material.
Resources 13 00120 g004
Figure 5. Maize growth and development measurements by treatment over two growing periods. (a) Height growth rate (cm/day), (b) height at week eight (cm) with an image showing height differences at week six (three control plots are highlighted, all others are deep or shallow zai pits), (c) root depth (cm) with an image showing roots from a deep zai pit (left) versus a control plot (right). “Deep” refers to 50 cm deep zai pits with manure, “Shallow” refers to 25 cm deep zai pits with manure, and “Control” refers to non-zai pit surface planting without manure (0 cm). Sample size for each treatment was n = 9 plots. Error bars are one standard error. Not all variables are shown due to Pearson correlation coefficients (r) greater than 0.5 and p-values less than 0.05. Variable groupings are as follows: (1) height growth rate/stage growth rate; (2) height week 8/stage week 5/days to reach stage R1; (3) root depth/root diameter/RSA/stem diameter.
Resources 13 00120 g005
Figure 6. Maize productivity (yield) measurements by treatment. Pictures include yields from two deep zai pits (top left), two shallow zai pits (bottom left), and one control plot (top right). For reference, the purple pencil is approximately 15 cm, and the piece of paper is roughly the same size in all images. The bar graph on the (bottom right) shows mean yield per ear; error bars are one standard error. Yield data are from the second growing period only. Sample size for each treatment was n = 9 plots. Not all variables are shown due to Pearson correlation coefficients (r) greater than 0.6 and p-values less than 0.05. The following variables are grouped together: yield per ear/kernels per ear/kernel weight.
Resources 13 00120 g006
Figure 7. Maize growth, development and productivity measurements by treatment. (a) Height growth rate (cm/day), (b) height at week eight (cm), (c) root depth (cm), (d) yield per ear (g). “Manure” refers to 50 cm deep zai pits with manure, “No Manure” refers to 50 cm deep zai pits without manure, and “Control” refers to non-zai pit surface planting without manure (0 cm). All figures were generated from data from the second growing period only. Sample size for Manure and Control was n = 9 plots, while sample size for No Manure was n = 6 plots. Error bars are one standard error. Not all variables are shown due to Pearson correlation coefficients (r) greater than 0.5 and p-values less than 0.05. Variable groupings are as follows: (1) height growth rate/stage growth rate; (2) height week 8/stage week 5/days to reach stage R1; (3) root depth/root diameter/RSA/stem diameter; (4) yield per ear/kernels per ear/kernel weight.
Resources 13 00120 g007
Table 1. Summary of maize growth, development, and productivity variables among treatments over two growing periods (GPs). Data not collected during the first growing period (GP1) were left blank. Values are growth rates or means ± standard error (SE). Sample size for each treatment was n = 9 plots. All p-values (from ANCOVAs or ANOVAs) across treatments within a GP were less than 0.001, all χ2 values (ANCOVAs; rows 1, 2) were greater than 64, and all F values (ANOVAs; rows 3–12) were greater than 9, with the exception of row 13 (F = 3.30, p = 0.054). Rows 1 and 2 had df = 2, while all other rows had df = 21–24. Values within a row with the same superscript letters (e.g., a & a) were not significantly different at α = 0.05 (Tukey HSD tests), while values with different superscript letters (e.g., a & b) were significantly different.
RowVariableDeep GP1Shallow GP1Control GP1Deep GP2Shallow GP2Control GP2
1Height Growth
Rate (cm/day)
1.46 a
(±0.04)
1.41 a
(±0.04)
0.56 b
(±0.04)
1.25 a
(±0.05)
1.24 a
(±0.05)
0.73 b
(±0.05)
2Stage Growth
Rate
0.21 a
(±0.01)
0.21 a
(±0.01)
0.15 b
(±0.01)
0.17 a
(±0.01)
0.17 a
(±0.01)
0.15 b
(±0.01)
3Mean Height
Week 8 (cm)
77.2 a
(±1.5)
74.2 a
(±2.2)
33.7 b
(±1.1)
68.6 a
(±2.2)
66.8 a
(±1.8)
40.3 b
(±2.1)
4Mean Stage
Week 5
6.9 a
(±0.1)
6.7 a
(±0.1)
4.9 b
(±0.1)
7.1 a
(±0.1)
6.9 a
(±0.1)
5.5 b
(±0.1)
5Mean Days to Reach
Stage R1
70.3 a
(±0.4)
70.4 a
(±0.3)
76.3 b
(±0.8)
6Mean Root
Depth (cm)
22.20 a
(±0.66)
18.78 b
(±0.46)
7.84 c
(±0.25)
22.68 a
(±0.79)
18.84 b
(±0.75)
11.18 c
(±0.44)
7Mean Root Ball
Diameter (cm)
8.99 a
(±0.23)
8.91 a
(±0.31)
4.78 b
(±0.18)
8.81 a
(±0.38)
7.97 a
(±0.41)
5.83 b
(±0.29)
8Mean RSA
Ratio
2.5 a
(±0.1)
2.2 b
(±0.1)
1.7 c
(±0.1)
2.7 a
(±0.1)
2.4 a
(±0.1)
2.0 b
(±0.1)
9Mean Stem
Diameter (cm)
1.64 a
(±0.05)
1.47 b
(±0.04)
0.98 c
(±0.05)
10Mean # Kernels
Per Ear
112.0 a
(±13.7)
85.1 a
(±7.9)
60.1 b
(±10.3)
11Mean Kernel
Weight (g)
0.23 a
(±0.01)
0.22 a
(±0.01)
0.17 b
(±0.01)
12Mean Yield
Per Ear (g)
26.5 a
(±3.0)
20.1 a
(±2.1)
10.7 b
(±1.7)
13Mean # Viable
Ears Per Plant
0.88 a
(±0.06)
0.81 a
(±0.06)
0.62 a
(±0.09)
Table 2. Summary of maize growth, development, and productivity variables among treatments. Data are from the second growing period only. Values are growth rates or means ± standard error (SE). Sample size for Manure and Control was n = 9 plots while sample size for No Manure was n = 6 plots. All p-values (from ANCOVAs or ANOVAs) across treatments were less than 0.003, all χ2 values (ANCOVAs; rows 1, 2) were greater than 21, and all F values (ANOVAs; rows 3–12) were greater than 8 except for row 13 (F = 3.07, p = 0.068). Rows 1 and 2 had df = 2, while all other rows had df = 17–21. Values within a row with the same superscript letters (e.g., a & a) were not significantly different at α = 0.05 (Tukey HSD tests), while values with different superscript letters (e.g., a & b) were significantly different.
RowVariableManureNo ManureControl
1Height Growth
Rate (cm/day)
1.25 a
(±0.05)
0.76 b
(±0.06)
0.73 b
(±0.05)
2Stage Growth
Rate
0.17 a
(±0.01)
0.15 b
(±0.01)
0.15 b
(±0.01)
3Mean Height
Week 8 (cm)
68.6 a
(±2.2)
43.4 b
(±1.8)
40.3 b
(±2.1)
4Mean Stage
Week 5
7.1 a
(±0.1)
5.9 b
(±0.1)
5.5 c
(±0.1)
5Mean Days to Reach
Stage R1
70.3 a
(±0.4)
76.7 b
(±1.4)
76.3 b
(±0.8)
6Mean Root
Depth (cm)
22.68 a
(±0.79)
15.83 b
(±0.38)
11.18 c
(±0.44)
7Mean Root Ball
Diameter (cm)
8.81 a
(±0.38)
5.80 b
(±0.42)
5.83 b
(±0.29)
8Mean RSA
Ratio
2.7 a
(±0.1)
2.8 a
(±0.1)
2.0 b
(±0.1)
9Mean Stem
Diameter (cm)
1.64 a
(±0.05)
1.02 b
(±0.03)
0.98 b
(±0.05)
10Mean # Kernels
Per Ear
112.0 a
(±13.7)
68.5 b
(±7.6)
60.1 b
(±10.3)
11Mean Kernel
Weight (g)
0.23 a
(±0.01)
0.15 b
(±0.01)
0.17 b
(±0.01)
12Mean Yield
Per Ear (g)
26.5 a
(±3.0)
11.0 b
(±1.5)
10.7 b
(±1.7)
13Mean # Viable
Ears Per Plant
0.88 a
(±0.06)
0.80 a
(±0.06)
0.62 a
(±0.09)
Disclaimer/Publisher’s Note: The statements, opinions and data contained in all publications are solely those of the individual author(s) and contributor(s) and not of MDPI and/or the editor(s). MDPI and/or the editor(s) disclaim responsibility for any injury to people or property resulting from any ideas, methods, instructions or products referred to in the content.

