Article

Assessment of Hydropower Potential in the Upper Indus Basin: A Geographic Information System-Based Multi-Criteria Decision Analysis for Sustainable Water Resources in Pakistan

1
Key Laboratory of Cryospheric Science and Frozen Soil Engineering, Northwest Institute of Eco-Environment and Resources, Chinese Academy of Sciences, Lanzhou 730000, China
2
University of Chinese Academy of Sciences, Beijing 100049, China
3
China-Pakistan Joint Research Center on Earth Sciences, CAS-HEC, Islamabad 45320, Pakistan
4
Centre of Excellence in Water Resources Engineering, University of Engineering and Technology (UET), Lahore 54890, Pakistan
5
College of Hydrology and Water Resources, Hohai University, Nanjing 210098, China
6
School of Chemical and Environmental Engineering, Anhui Polytechnic University, Wuhu 241000, China
7
School of Surveying and Land Information Engineering, Henan Polytechnic University, Jiaozuo 454003, China
8
Key Laboratory of Geographic Information Science (Ministry of Education), School of Geographic Sciences, East China Normal University, Shanghai 200241, China
*
Author to whom correspondence should be addressed.
Resources 2025, 14(3), 49; https://doi.org/10.3390/resources14030049
Submission received: 29 January 2025 / Revised: 5 March 2025 / Accepted: 10 March 2025 / Published: 17 March 2025

Abstract

:
The development of hydropower projects is crucial to addressing Pakistan’s ongoing energy and financial crises. Despite the country’s abundant hydropower resources, particularly in the northern regions, these have not been adequately explored, while energy consumption and supply issues have persisted for the past two decades. Focusing on Sustainable Development Goal (SDG-7): “Ensure access to affordable, reliable, sustainable, and modern energy”, this study aimed to assess the hydropower potential at suitable sites in the Upper Indus Basin (Pakistan) by integrating Geographic Information Systems (GIS) and Multi-Criteria Decision Analysis (MCDM). This study not only focused on estimating hydropower but also considered the environmental constraints at all sites by using the multi-criteria decision-making (MCDM) tool, which used the location and constraint criteria, along with benefit and cost criteria. The methodology combines technical evaluations (head and discharge) with environmental constraints to prioritize sustainable hydropower development. Key findings identify sites 17, 15, 16, 5, and 6 as the most promising locations, balancing energy generation with minimal environmental impact. This study provides a replicable framework for policymakers to harness hydropower resources responsibly, contributing to Pakistan’s energy security and aligning with global Sustainable Development Goals. This approach not only bridges the gap between technical feasibility and environmental sustainability but also offers a model for other regions facing similar energy challenges.

1. Introduction

Pakistan is a developing nation with significant potential for sustainable and renewable energy resources, i.e., hydropower. According to the National Electric Power Regulatory Authority (NEPRA), Pakistan’s total installed power generation capacity stands at 45,888 MW as of June 2024, comprising 28,766 MW from thermal sources, 11,519 MW from hydroelectric sources, and significant contributions from nuclear, wind, and solar energy [1]. However, the country faces a significant gap between supply and demand, experiencing an energy crisis, with a power deficit ranging from 5000 MW to 8000 MW. This deficit underscores the urgent need to develop sustainable and reliable energy sources, such as hydropower, to bridge the gap and ensure energy security [2]. The strategic advancement of resources for hydropower in many nations has been hindered by financial circumstances and a shortage of data regarding topography, river flows, power grid infrastructure, environmentally vulnerable regions, and the potential energy for hydropower [3,4]. For sustainable energy consumption and usage, Pakistan’s Ministry of Water and Power established its policy on energy in 2006, aiming to integrate hydropower development into the country’s monetary plan. The energy policy prioritized examining various potential locations to establish Pakistan as a prominent player in renewable energy worldwide, with a particular focus on the northern regions of the country [5]. The country possesses considerable undeveloped hydropower capacity, primarily due to insufficient government investment in the energy sector, partially executed strategies, structural reforms, and inadequate analysis of the hydropower of various streams [6]. The Indus River possesses a potential of 60 GW, yet around 80% of this potential is still unidentified [7]. Despite facing a severe energy shortage, Pakistan’s progress toward sustainability in the energy sector remains insufficient to meet its growing demands. Meanwhile, global hydropower installations continue to rise rapidly. In response to the ongoing energy crisis, the Ministry has initiated assessments of the hydroelectric potential across the country’s rivers [8].
Hydropower, as a renewable energy source, is a clean, environmentally friendly, and cost-effective means of electricity production [9,10] that is beneficial for managing sustainable water resources [11]. Contemporary and efficient hydroelectric power facilities are expediting our shift toward renewable energy, supplying adequate electricity and reservoirs for agricultural irrigation, and contributing to climate change mitigation efforts. Hydropower produces minimal emissions of greenhouse gases, as it contributes 16% of overall energy consumption globally [12]. It is expected that the currently operational energy capacity of hydropower has the potential to exceed 1064 GW, although this would still fall short of the anticipated economically viable hydropower generation [13]. Hydropower development in various regions of the world is primarily hindered by economic constraints, increasing population, changes in hydrological systems, and limited assets. Approximately 70% of economically viable hydropower has not yet been developed, primarily in developing nations. Thus, sustainable hydropower may enable us to fulfill both the UN’s (sustainable development) agenda and the climate change agreement in Paris [14].
Encouraging progress toward achieving SDG 7 highlights the growing accessibility and sustainability of energy. The hydropower sector is making significant advancements in renewable energy and efficiency, with electricity access accelerating in developing countries. This study aligns with SDG 7, particularly targets 7.1 and 7.2, which aim to ensure universal access to affordable, modern energy services and to significantly increase the share of renewable energy in the global mix by 2030 [15]. In 2016, Pakistan formally adopted the Sustainable Development Goals (SDGs) as its national development framework, becoming the first country to integrate them into its strategy through a unanimous National Assembly resolution. Significant investments have been made to address energy shortages, boost generation, and improve electricity access, contributing to progress toward SDG 7. Over the past decade, power accessibility has increased by 8%. Pakistan is now targeting a renewable energy share of 20% by 2025 and 30% by 2030 [16].
Numerous studies have assessed hydroelectric potential and identified suitable locations using various methods. Traditionally, most research relied on field investigations and conventional approaches. However, recent advancements have led to the growing use of modern tools like remote sensing (RS) and Geographic Information Systems (GIS) for more efficient and precise assessments [17,18,19]. The traditional approach of paper mapping incurs substantial costs and time requirements, restricting its use, particularly in remote areas characterized by complicated topography [20,21,22,23,24]. Furthermore, rational approximation involves utilizing the river’s flow and elevation to estimate the potential for power generation. This estimation is performed through a site assessment conducted at a single point, two sites, or a very limited area [25]. Nevertheless, there are remote regions with challenging terrain where hydropower potential exists, rendering it impracticable to accurately evaluate power potential and identify significant sites using this technique. Furthermore, the presence of human error and the influence of subjective judgment impede the reliability of these approaches [26]. To address these challenges, GIS and RS techniques, along with Geospatial Information Systems (GSIS), are increasingly utilized for site analysis due to their efficient use of time and resources [27]. For example, Alashan et al. (2018) [25] utilized GIS to evaluate the feasibility of hydropower generation by employing a spatial decision support system. In addition, several studies have used GIS data to identify appropriate sites [28]. Similarly, a location analysis method was suggested by Belmonte et al. (2009) [29] for the exploration of potential hydropower sites using GSIS. Similarly, Fasipe et al. (2021) [30] utilized spatial tools and a hydrological model to analyze the Osse Sub-basin (OSB) and calculate the stream’s peak discharge (Qp). This method quantifies potential locations for small hydropower (SHP) by evaluating catchment parameters along the drainage network in run-of-river projects, thereby overcoming the limitations of traditional survey methods. Similarly, many studies have advanced location analysis systems using GIS and RS for spatially optimized hydropower assessments [31]. A hydropower potential assessment was carried out at the White Bandama Watershed in West Africa by Kouadio et al. (2022) [32] and at the Samar River System in the Philippines by Uy et al. (2023) [33]. Both studies integrated a hydrological model with GIS, specifically the Soil and Water Assessment Tool (SWAT). Similarly, Akande et al. (2023) [34] employed a GIS-based methodology to evaluate the potential for small hydropower generation along the River Ogun in Nigeria. This approach aimed to identify suitable locations for small hydropower projects that could benefit rural communities along the river. The capacity for run-of-river hydropower generation along the Gumara River was evaluated by Ayele (2020) [35], utilizing geospatial data and techniques. The utilization of GIS involves the manipulation of satellite images, demarcating watershed and stream networks, and identifying viable sites for hydropower projects, resulting in the discovery of 20 suitable sites with hydropower potential.
Multi-criteria decision-making (MCDM) methods offer a practical solution for these analyses, enabling the evaluation and prioritization of alternatives based on multiple measures [36,37]. It is also used for hydropower assessments in some cases. For example, it can help locate appropriate potential locations for the construction of small-scale hydropower facilities to generate electricity along the Awata River in Ethiopia. Areri and Bibi (2009) [38] examined the identified suitable sites by prioritizing the sites using an analytical hierarchy process (AHP). The utilization of MCDM methodologies, such as TOPSIS, AHP, and ANP, has witnessed a significant rise in recent years [39,40,41]. These approaches are particularly prevalent in the field of water resource engineering and management, where they are employed to tackle complex problems [42,43].
While hydropower offers significant potential as a clean energy source, it also has notable negative impacts that must be carefully considered. The construction of dams disrupts natural ecosystems and alters the flow of rivers, potentially harming aquatic and terrestrial habitats [44]. Dams can block the migration of fish species, which is a critical concern in many regions. For example, the dams on the Snake River in the U.S. have significantly reduced the survival of juvenile salmon, impacting biodiversity and local communities that rely on these species for their livelihoods [45]. Environmental concerns also include sediment accumulation, which reduces the storage capacity of reservoirs over time, threatening water quality and availability downstream. As reservoirs fill with sediment, they can lose up to 25% of their storage capacity by 2050, exacerbating water shortages and compromising hydropower efficiency [46]. Moreover, the flooding of large areas for dam construction can displace local populations, often leading to social conflicts, as seen with Indigenous communities whose ancestral lands are submerged [47,48].
Hence, considering the positive and negative factors for developing hydropower projects, this study is based on assessing the suitable and environmentally friendly locations for potential hydropower projects to fulfill the nation’s energy requirements. While Pakistan possesses significant hydropower potential, particularly in the Upper Indus Basin, in existing studies, there is a lack of integrated approaches that combine Geographic Information Systems (GIS) with multi-criteria decision-making (MCDM) tools to evaluate and prioritize hydropower sites in a holistic manner. This gap limits policymakers’ ability to make informed decisions that balance energy generation with environmental sustainability. Hence, concentrating on Sustainable Development Goal (SDG) 7, “Ensure access to affordable, reliable, sustainable and modern energy” [49], and the exploration of hydropower potential in the Upper Indus Basin and the identification of promising locations along the Indus, Gilgit, and Hunza Rivers, this study employed a location analysis methodology integrating GIS and a multi-criteria decision-making (MCDM) approach. The significance of this study stands out because it combines technical and environmental evaluations to prioritize hydropower sites in Pakistan’s northern regions. By bridging the gap between technical feasibility and environmental sustainability, this study provides a valuable resource for policymakers and stakeholders seeking to harness Pakistan’s hydropower resources responsibly. This study addresses these gaps by employing a novel, integrated methodology that combines GIS-based spatial analysis with an MCDM approach to assess hydropower potential in the Upper Indus Basin. Specifically, this study can achieve the following goals:
Introduce a framework for prioritizing sites while identifying and evaluating potential hydropower sites along the Indus, Gilgit, and Hunza Rivers, considering both technical factors (e.g., head, discharge) and environmental criteria.
Provide actionable insights for policymakers by identifying the most promising sites and demonstrating how environmental constraints can be integrated into the decision-making process.
Offer a replicable methodology that can be applied to other regions with similar hydropower potential, thereby contributing to global efforts in sustainable energy development.
This article is organized into six sections. Section 2 provides a detailed description of the study area, including the geographical and hydrological characteristics of the Upper Indus Basin, and outlines the adopted methodology, which includes the use of GIS for watershed delineation, the area ratio method for discharge estimation, and the multi-criteria decision-making (MCDM) framework for site prioritization and suitability. Section 3 presents the results, highlighting the hydropower potential of the identified sites and the environmental constraints considered and their role in the selection and prioritization of suitable sites. Section 4 discusses the implications of the findings, emphasizing the balance between energy generation and environmental sustainability. Section 5 concludes this study by summarizing the key findings and their relevance for policymakers. Finally, Section 6 summarizes the assumptions and limitations of this study and offers recommendations for future research.

2. Material and Methods
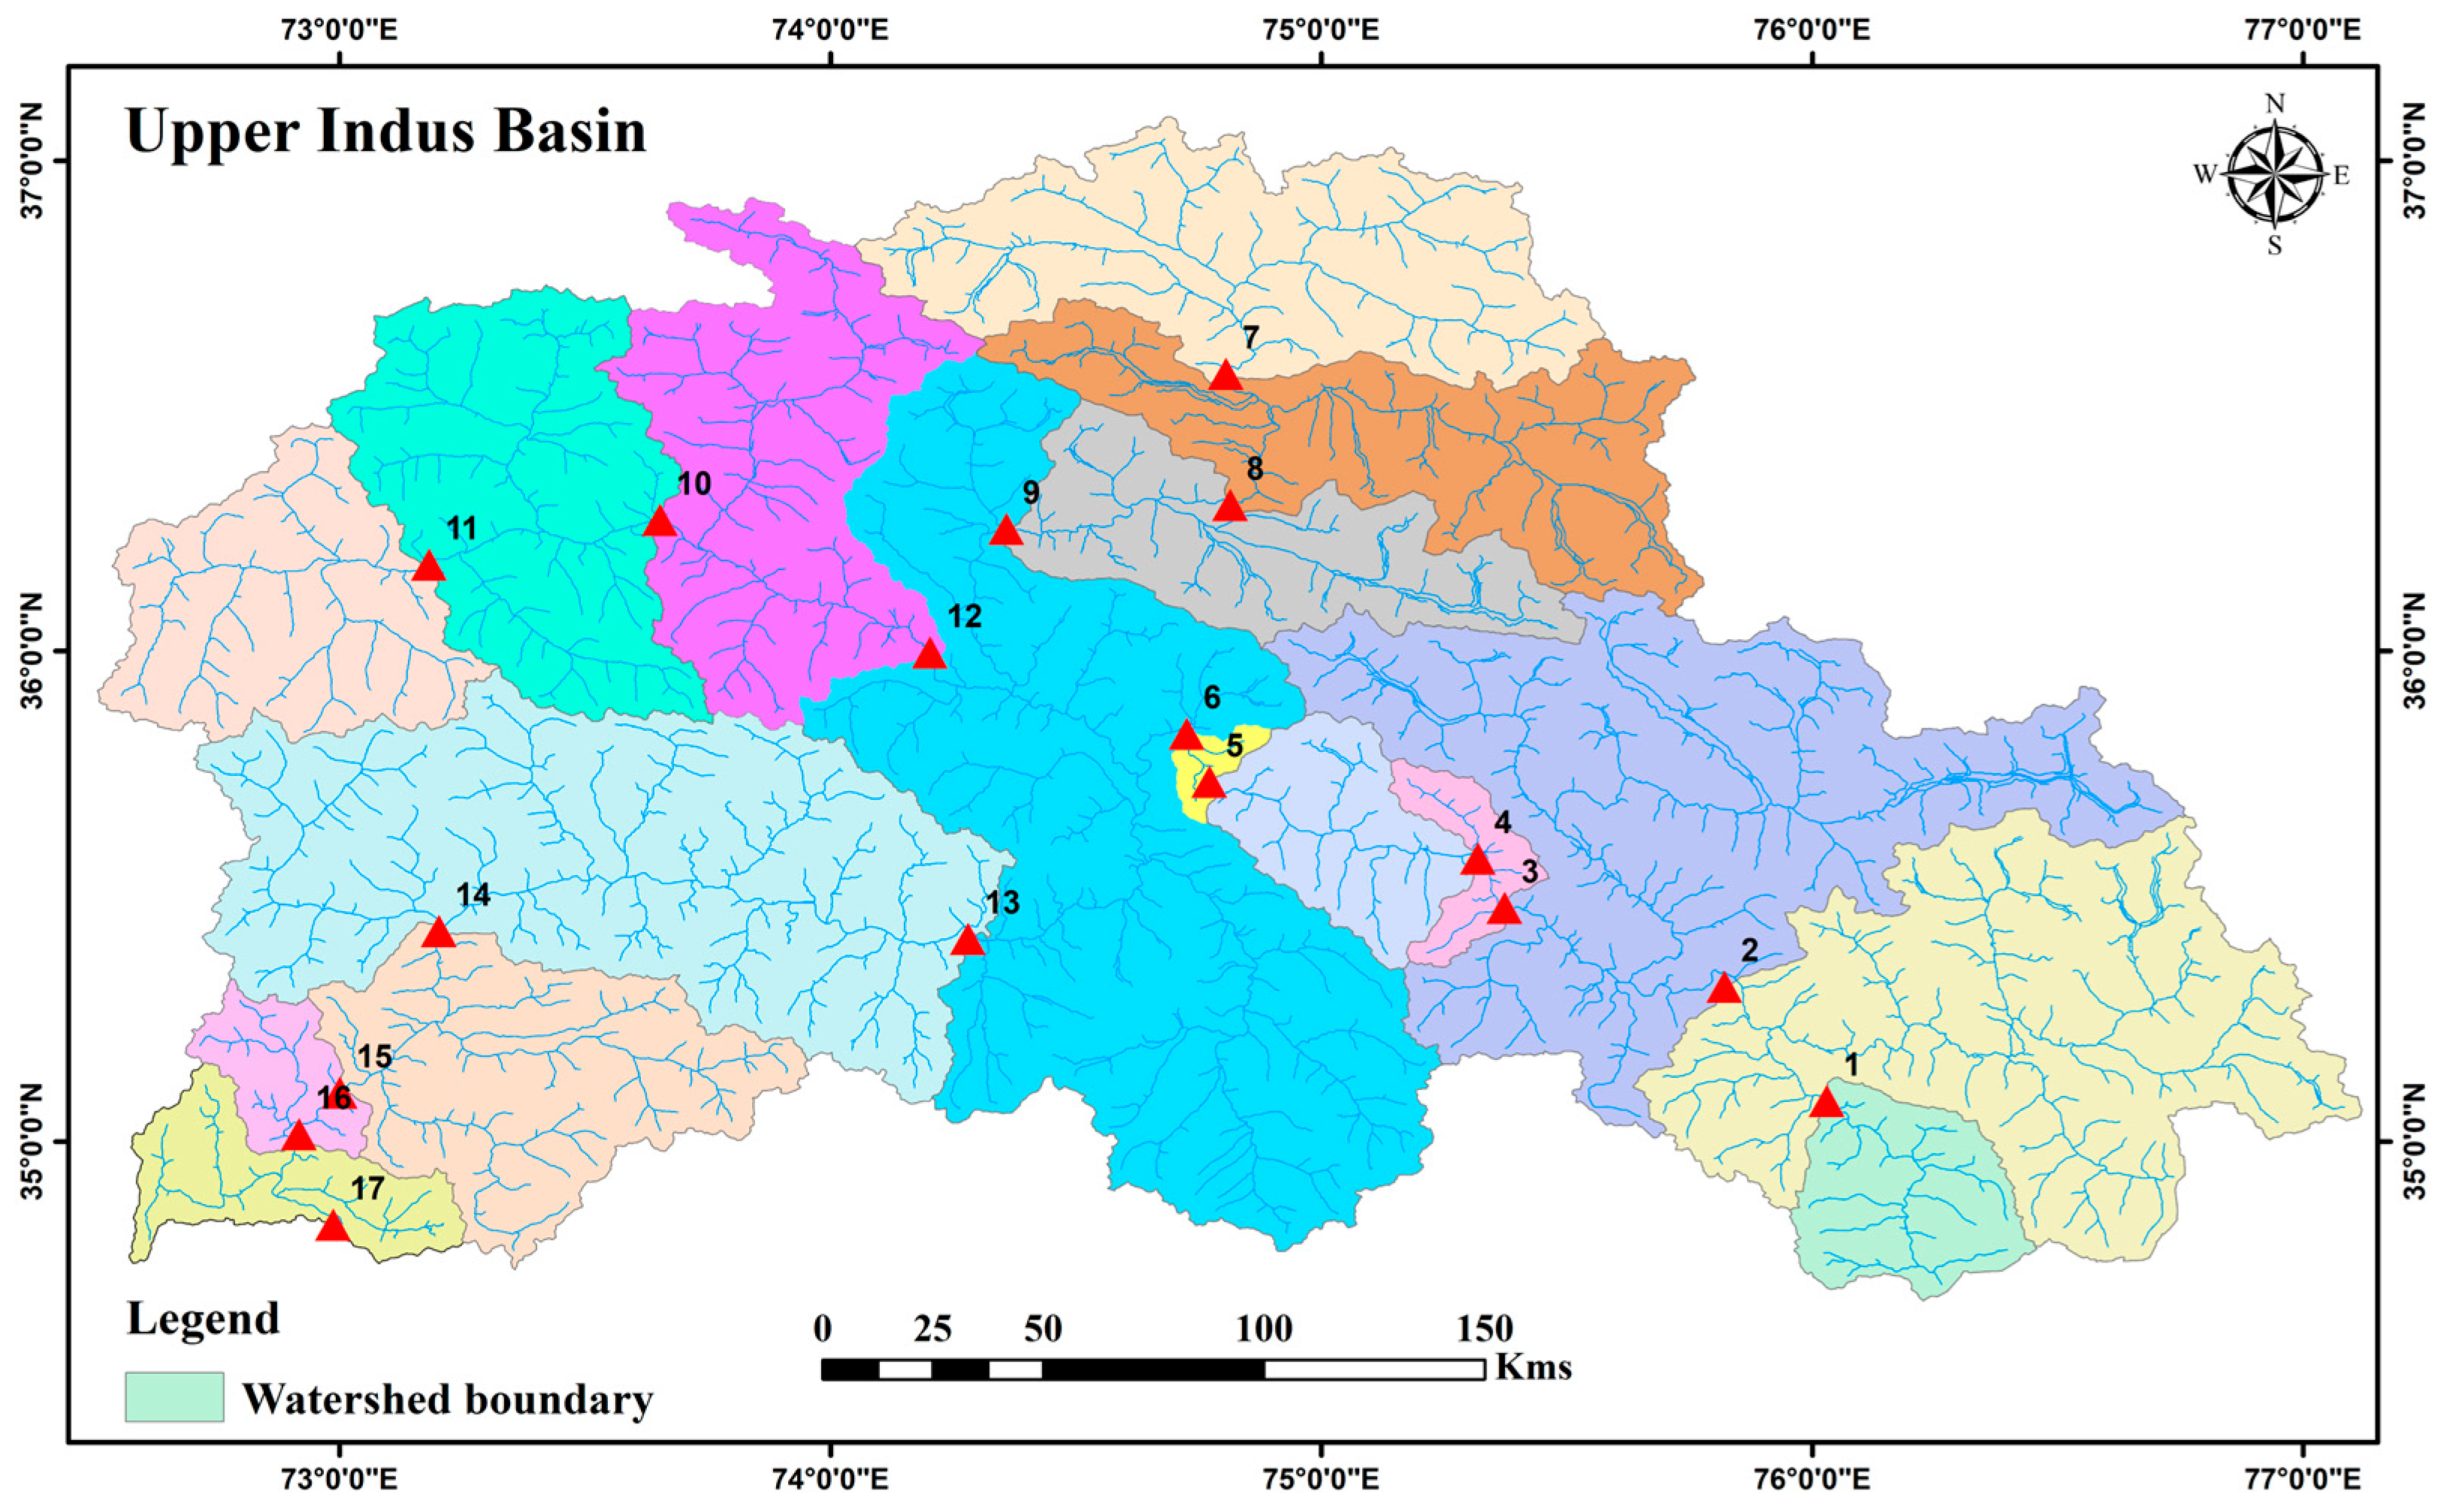
2.1. Study Area

Pakistan, as a prominent nation in the Global South, possesses extensive and varied surface topography, encompassing both undulating terrain and vast plains [50]. It is endowed with abundant natural resources and has experienced rapid population growth. These factors underscore the importance of gathering sufficient data on environmental and socioeconomic conditions to work toward achieving Sustainable Development Goals (SDGs) [51]. Pakistan spans 61–76° E longitude and 24–37° N latitude, covering an area of 796,095 km2. It borders India, Afghanistan, China, Iran, and the Arabian Sea. The Upper Indus Basin in northern Pakistan features a rugged landscape shaped by the upward thrust of the Hindu Kush, Karakoram, and Himalayas along the tectonic boundary of the Indian and Eurasian Plates. The Indus River’s main tributary originates in the Tibetan Plateau, one of Earth’s most erosive landforms, situated over 5 km above sea level [52]. The Tibetan Plateau encompasses a watershed spanning 970,000 km2, with a mountainous catchment area of 264,000 square kilometers. In the northern region of Pakistan, upstream of the Tarbela Dam, approximately 75,000 km2 falls within this boundary [53]. The Indus River enters northern Pakistan from the Indian-administered Jammu Kashmir and merges with the Shyok and Shigar Rivers in the Skardu Basin. After the Gilgit River confluence, the river reaches the Tarbela Reservoir and flows through the Bisham and Chilas regions before eventually joining the Arabian Sea, 3020 km from its source [54].
Regarding social and economic factors, there has been a noticeable rise in the region’s population over the past few decades, with an average annual growth rate of 1.8%. The region is susceptible to future changes due to heightened climate variability, extensive disasters, rapid population growth, and accompanying land modifications [55]. Consequently, accurate environmental impact assessment techniques are required to ensure sustainable development. Figure 1 shows the study area, the Upper Indus Basin (UIB), selected for study, highlighting the proposed sites with hydropower potential. Therefore, keeping the potential for hydropower in mind, the present study focused on identifying appropriate locations within the Upper Indus Basin, specifically in the Indus, Hunza, and Gilgit Rivers. To identify possible sites, discharge data were collected from the Water and Power Development Authority (WAPDA) of Pakistan.

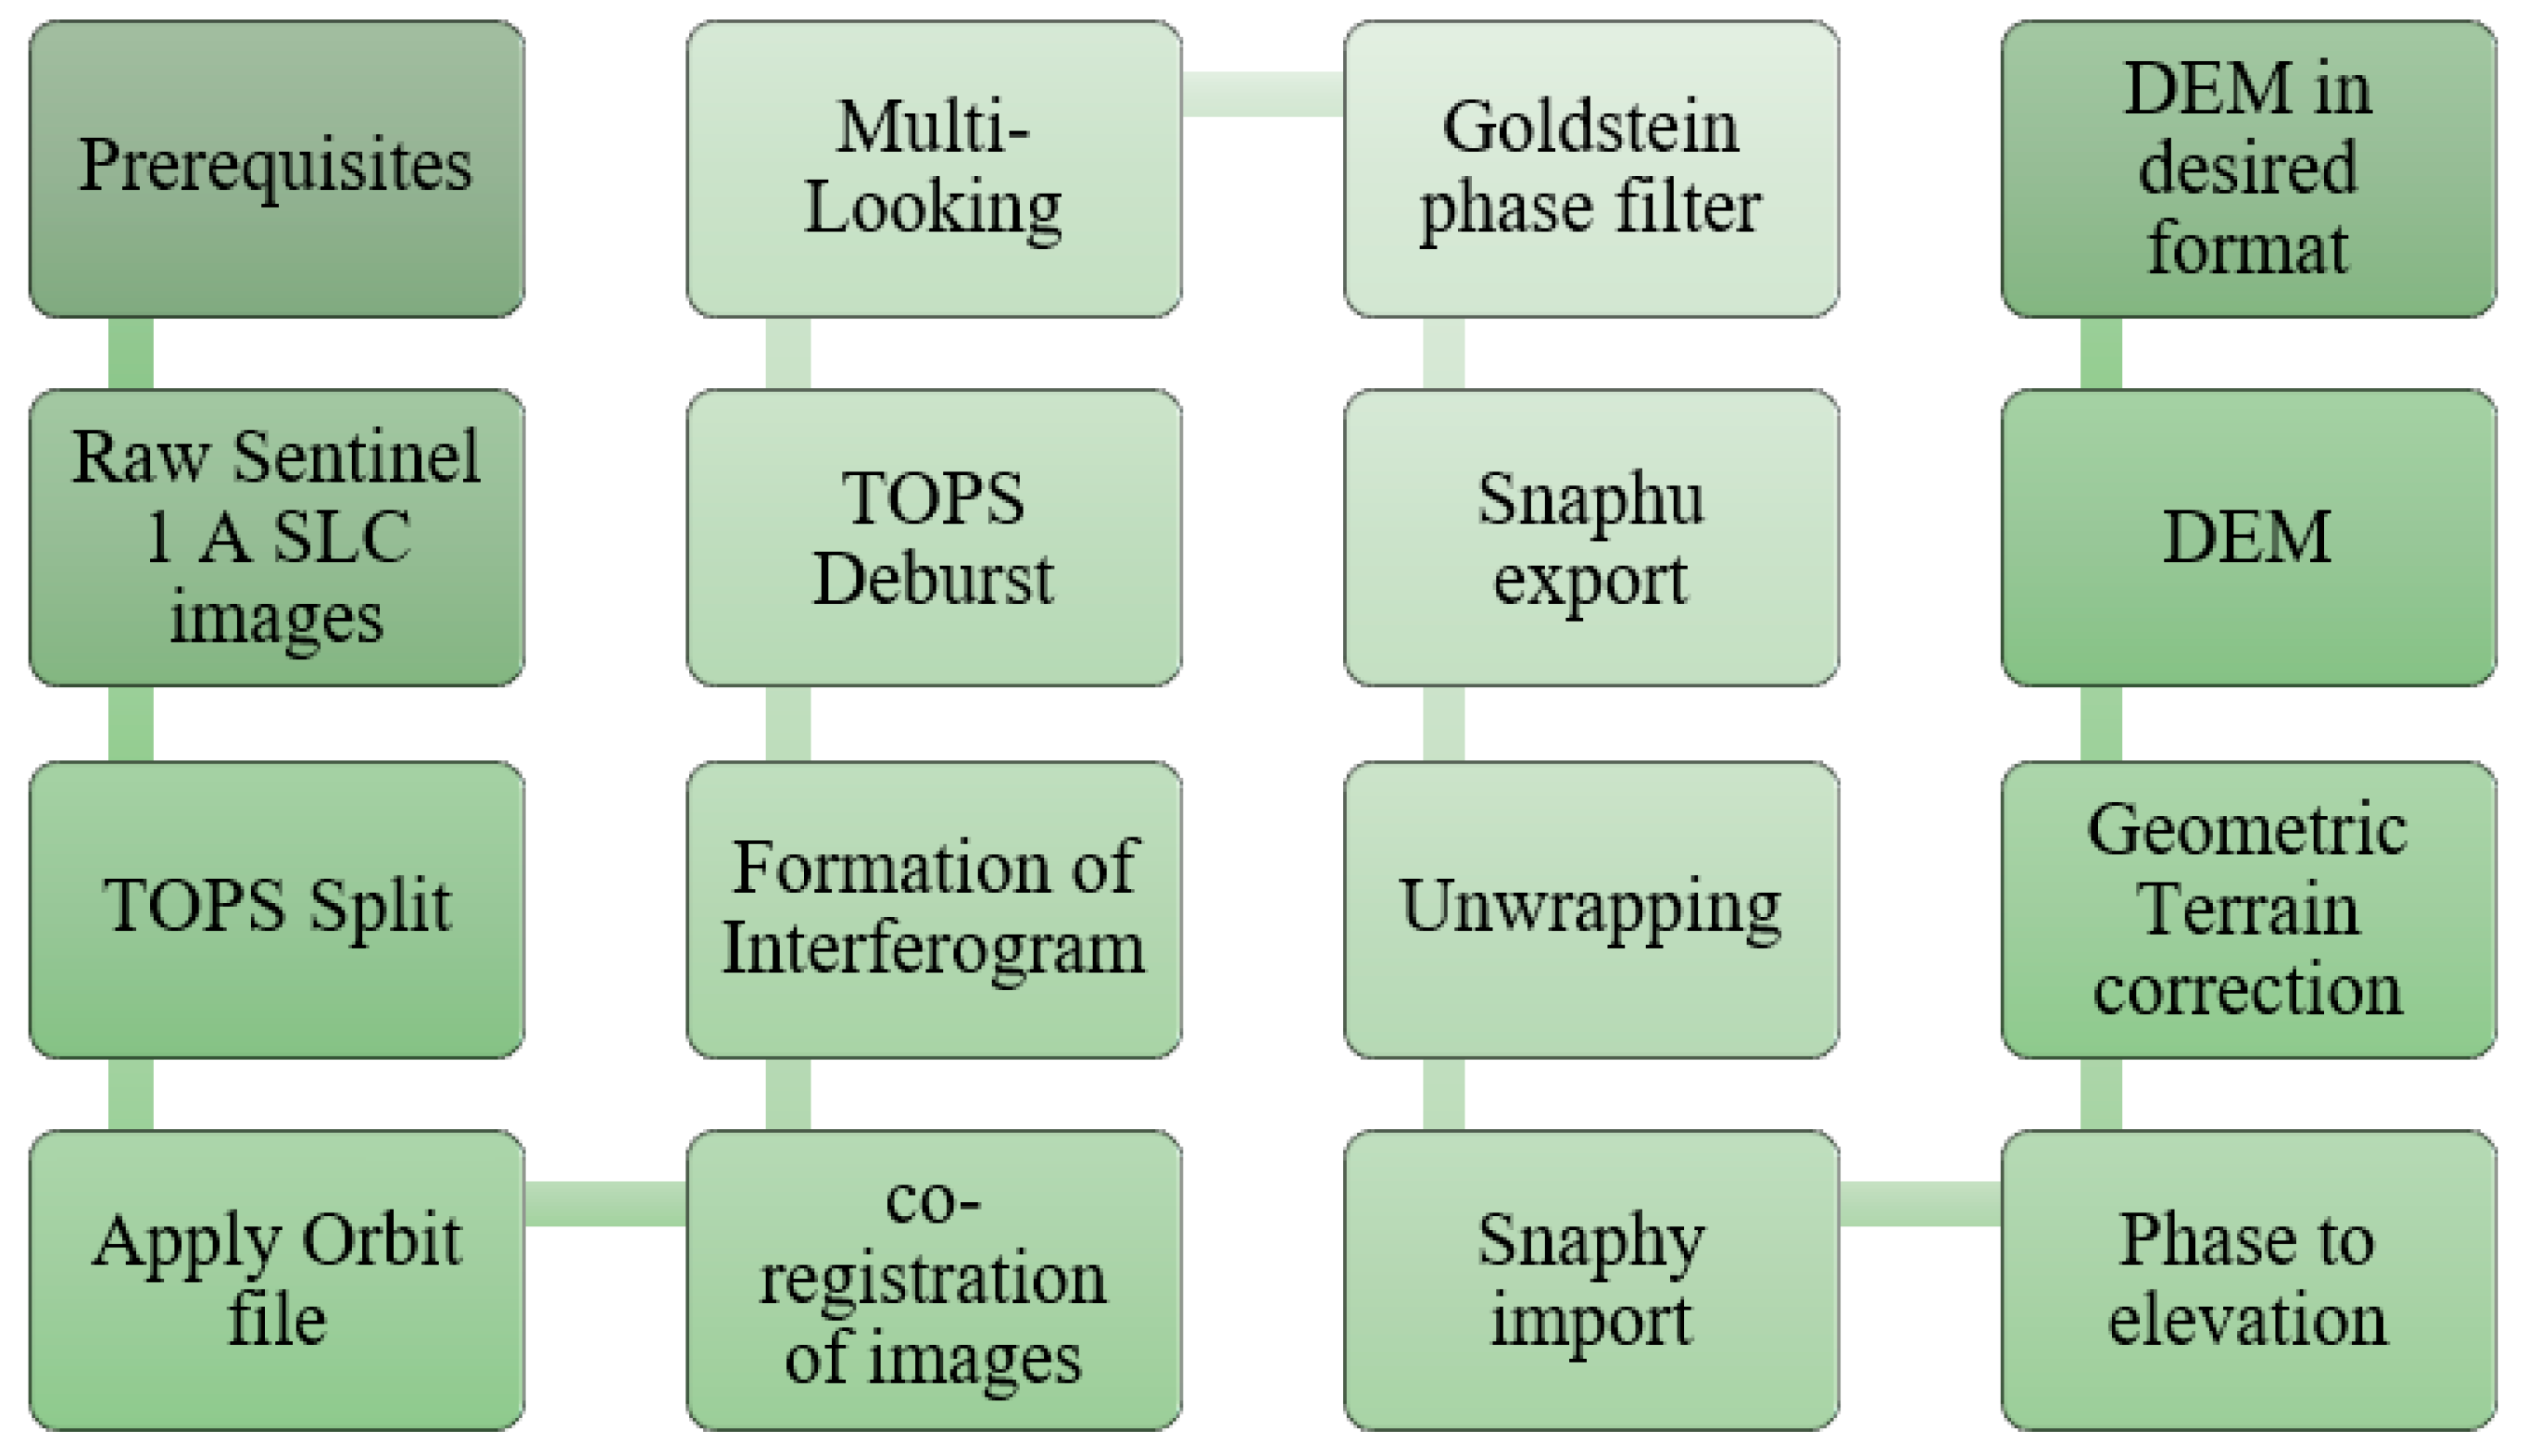
2.2. Data Collection and Framework for DEM

The data were collected at Besham for the Indus River (1985–2022), at Gilgit Bridge for the Gilgit River (1960–2016), and at Daniyor Bridge for the Hunza River (1966–2016) and Shimshal and Passo tributaries. Additionally, a high-resolution DEM was created using the Sentinel-1 SLC dataset by adopting the procedure outlined in Figure 2. This study utilized Sentinel-1 SLC images to generate a high-resolution digital elevation model (DEM) through Interferometric Synthetic Aperture Radar (InSAR) processing. This dataset was selected due to its superior temporal coverage, which minimizes temporal decorrelation and ensures reliable elevation extraction for hydropower site assessment. Both Sentinel-1 (C-band SAR) and the generated DEM have a 10 m spatial resolution, ensuring high accuracy in elevation modeling. Sentinel-1 images acquired between 2015 and 2023 were used to cover a range of hydrological conditions and capture seasonal variations in river inflow. A total of 36 Sentinel-1 SLC images were processed to ensure sufficient temporal representation and enhance the accuracy of elevation estimation. Sentinel offers superior temporal coverage compared to earlier sensors, significantly reducing temporal decorrelation. The Sentinel-1 InSAR processing began with co-registering the interferogram, TOPS Deburst, and phase filtering. Subsequent steps involved creating subsets and opening the interferogram in S1TBX, followed by phase unwrapping using the SNAPHU algorithm. SNAPHU, a phase unwrapping statistical-cost, network-flow algorithm, was used to unwrap the interferograms and was then re-imported into S1TBX. The interferometric phase was transformed into a digital elevation model (DEM) using the radar tool in S1TBX by converting phase data to elevation. Finally, geocoding and Range Doppler terrain correction generated the geocoded terrain-corrected DEM. This DEM was employed in GIS to identify suitable sites and determine elevation and watershed areas at potential locations. To further support the hydropower potential assessment, river discharge data from the Water and Power Development Authority (WAPDA), Pakistan, were integrated. Additionally, the Shuttle Radar Topography Mission (SRTM) 30 m DEM was utilized for validation, ensuring consistency in terrain elevation measurements.

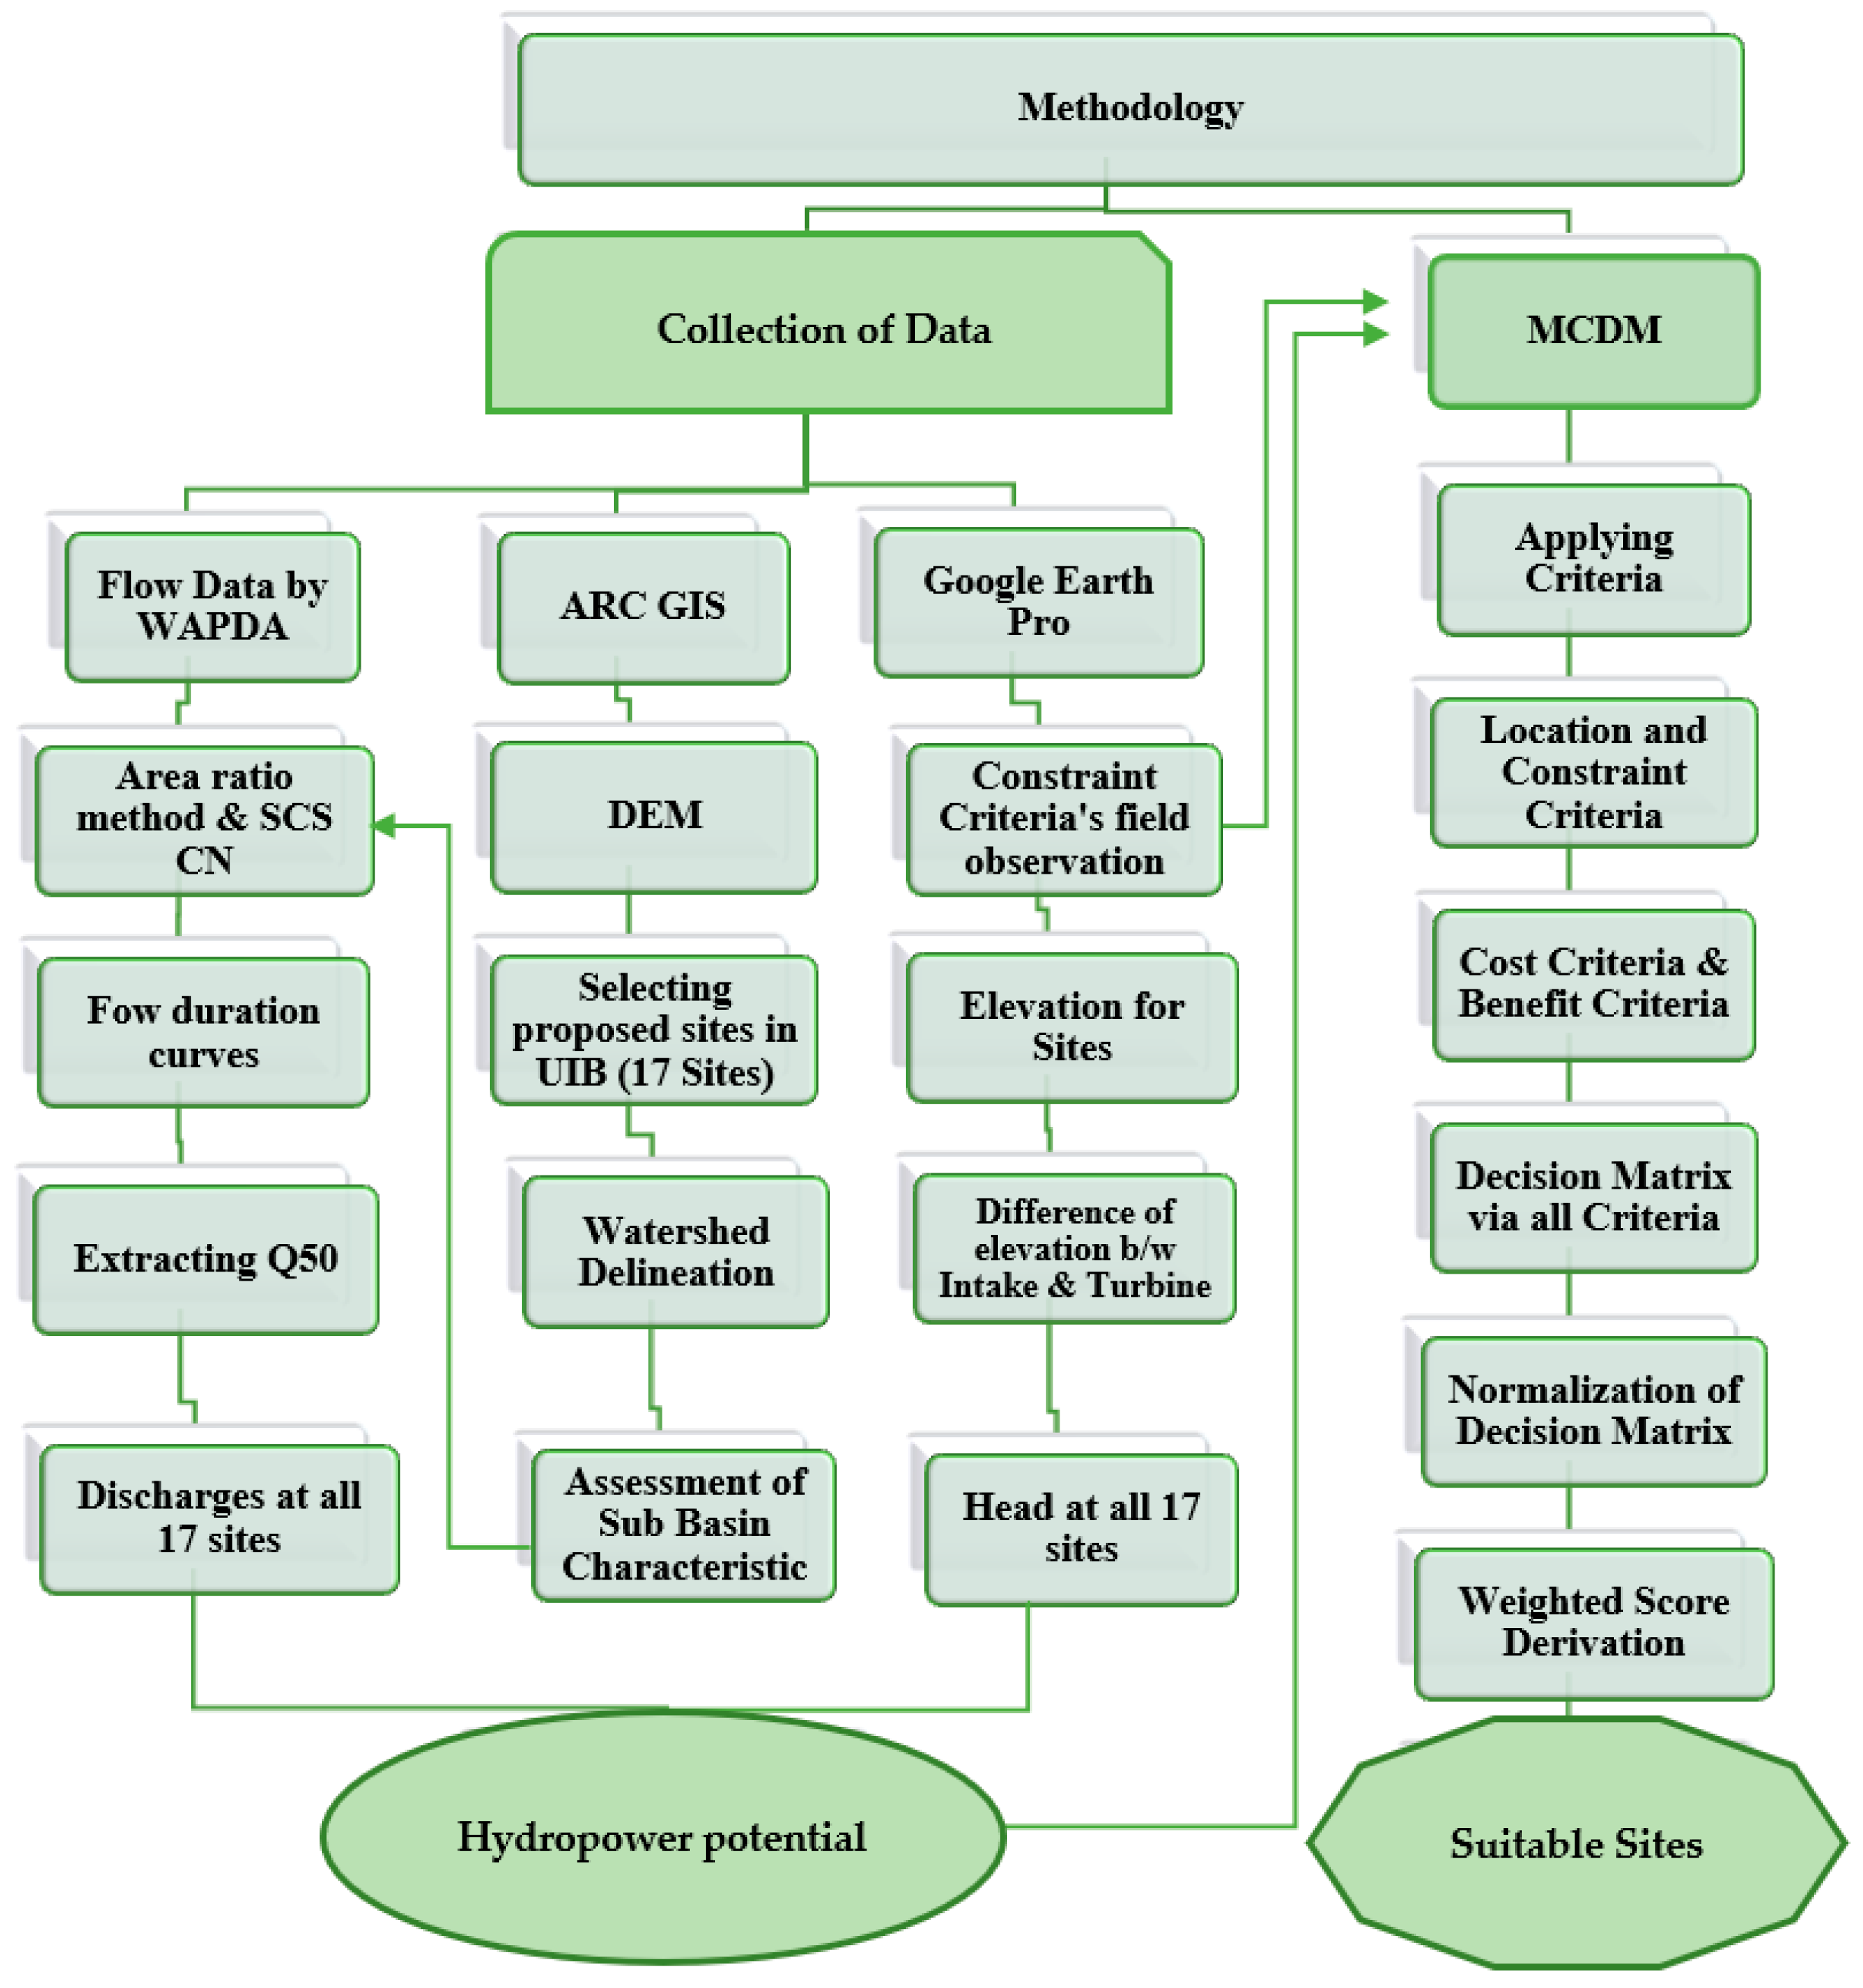
2.3. Adopted Procedure for Analysis

This study utilized a methodology that employed GIS and MCDM approaches to determine the most optimal location for hydropower generation. This process is illustrated in the flowchart (Figure 3) for a comprehensive description.

2.4. Head Determination at Proposed Sites

Seventeen potential sites for hydropower were identified along the river’s centerline to indicate the projected sites for hydropower, as shown in Figure 1. The site selection process involved a multi-stage GIS analysis that integrated hydrological, topographical, and environmental factors, ensuring that spatial variability and hydrological feasibility were adequately considered. The selection relied on freely available satellite-based datasets (Sentinel-1, SRTM DEM, and Google Earth Pro). The Indus River, Hunza River, and Gilgit River are sustained by tributaries and rivers fed by glaciers. For each proposed site, an appropriate narrow segment of the river and a turn in the river flow were considered suitable factors. All seventeen sites were selected by choosing search points immediately before a new tributary. To analyze the suitability of each site, base coordinates were selected. Locations for proposed plant/turbine sites and intake sites were chosen on a GIS map based on the rivers’ centerline. The designated sites were identified using the ArcGIS Editor Toolbar. The elevation at each suggested site was obtained using Google Earth Pro. Subsequently, the head for each of the seventeen search points/sites was determined by calculating the difference between the elevation head and the tailwater level. The head was determined by subtracting the assumed elevation of the intake point from the elevation of the assumed turbine position.
Figure 3. Methodology adopted to complete this study.
Resources 14 00049 g003

2.5. Discharge Determination at Ungauged Sites

The data were acquired utilizing the area ratio method for ungauged stations due to the absence of discharge data at different locations, supported by the Soil Conservation Service Curve Number (SCS-CN) methodology. The Soil Conservation Service Curve Number (SCS-CN) method is a widely used empirical model for estimating surface runoff based on land use, soil type, and antecedent moisture conditions. The SCS-CN approach was employed to estimate the discharge of sub-basins with meteorological stations, while the area ratio method was utilized to synthesize the data for the remaining points. In addition, the delineation of watersheds was conducted at all seventeen locations to split the Upper Indus Basin into seventeen smaller basins. The characteristics of each catchment, such as area, length, and CN, were estimated using GIS. Below are the specifics of the SCS-CN method and the area ratio method. The SCS-CN method is extensively employed for estimating runoff in ungauged basins and is designed to consider hydrologic abstraction and land characteristics of CN. The curve number (CN) primarily depends on soil type, land use, and antecedent moisture conditions (AMCs) [56,57,58]. The runoff (Q) is estimated using rainfall (P), curve number (CN), and initial abstraction Ia using the SCS-CN method, as shown below in Equations (1) and (2).
P Ia Q S = Q P Ia
Q = P λ S 2 P + 1 λ S   P λ S   else   Q = 0
Here, S is the maximum potential retention and can be determined as follows: S = 1000 CN 10   if   P   is   in   inches , while S = 2540 CN 25.4   if   P   is   in   cm , λ = 0.2. CN is the dimensionless index used in tabular form and ranges from 0 to 100. The area ratio method is a commonly used regionalization approach for estimating streamflow at ungauged sites by scaling discharge values from gauged locations based on watershed areas. The area ratio approach can be employed to estimate discharge at specific sites in cases in which flow data are insufficient by leveraging existing data obtained from one or more adjacent gauging stations on streams that possess comparable attributes [59]. The discharge per unit area in the targeted ungauged watershed is assumed to be equal to that in the known basin when using the area ratio technique applied using Equation (3). This method requires the runoff of the gauged site ( Q g ), and the area of the target ungauged sub-basin derived from watershed delineation ( A u ), the area of the whole basin ( A g ) for estimating the runoff of the targeted ungauged basin ( Q u ). The area ratio approach has been used in several studies [60,61], which have found that it works very well in areas with few gauging networks [62].
Q u = K A u A g ϕ × Q g
Here, ϕ is the factor valued by the area of the gauged basin and the regression analysis of flow and is considered to be 1.0, and K is a bias correction aspect = 1.0 [59,62].
After estimating and gathering discharge data at each of the seventeen sites, a flow duration curve (FDC) was generated for each selected site. The discharge from each proposed site was individually organized in descending order to generate the FDC. The corresponding percentiles were computed utilizing the Weibull plotting algorithm. For the present study, Q100, Q90, Q80, Q70, Q60, and Q50 were obtained from the FDC of each site. Q100 denotes the flow rate equal to or exceeding 100% of the time. Q50 denotes the discharge equal to or exceeding 50% of the time.

2.6. Estimation of Hydropower Potential

Before assessing the most promising sites using the MCDM approach, the hydropower potential was determined using Equation (4) for all suggested sites in the Upper Indus Basin, assuming a global efficiency rate of 81% [63].
P = η ρ gHQ 1000
In Equation (4), H denotes the estimated head for each site in meters, Q denotes the discharge in m3/s, and P refers to the mean annual electric power in kW. The density of water (ρ) is taken as 1000 (kg/m3), while g refers to the gravitational acceleration in m/s2. η denotes the turbine efficiency, which usually ranges from 75 to 88 (%). Q50 is considered for hydropower estimation, as Q50 represents the flow that is equaled or exceeded 50% of the time [64]. According to [65], The discharge in Q50 is almost perennial for the whole year, although it is lower than in Q75 and Q90. Therefore, Q50 was used in this study.

2.7. Multi-Criteria Decision-Making (MCDM)

Multi-criteria decision-making (MCDM) is employed to evaluate, prioritize, choose, or rank alternatives based on a limited set of options, using various competing criteria. The process of MCDM includes making a decision matrix based on location and constraint criteria, normalizing the decision matrix based on cost and benefit criteria, applying relative weights, and obtaining a final score.

2.7.1. Step 1: Criterion Selection

Several hydrologic, topographic, environmental, and socioeconomic criteria and water resource-related factors were used, based on the literature, to assess the circumstances of the study region. For this study, the criteria were divided into constraint criteria and location criteria, as indicated in Table 1. Discharge and head were utilized for power calculations. The location criteria incorporated both head and discharge. The sustainability of hydropower sites is influenced by various criteria rather than just the head and discharge. In addition, these constraint criteria were further categorized based on their positive aspect (where a higher value indicates a benefit) or negative aspect (where a higher value indicates a cost) [66]. Table 1 displays the constraint criteria and power criteria (obtained after estimating hydropower potential using head and discharge) for MCDM processing.

2.7.2. Step 2: Making a Decision Matrix

The intangible criteria were quantified on a scale of zero to ten using benefit and cost criteria analysis. This allowed for the creation of a decision matrix for each site, as illustrated in Table 2. If the proposed site encompasses a substantial agricultural region, evaluating its environmental impact is necessary, and the possibility of resettlement arises in the event of constructing a hydropower project at that specific location. Therefore, it will be assigned a value of 1 based on the scale. Conversely, if the chosen proposed site has a significantly reduced agricultural area, it implies that there would be no concerns regarding environmental impact assessment. Therefore, it is assigned a value of 9. Similarly, a site that has excellent accessibility is assigned a value of 9 on the scale, whereas a site with challenging or no accessibility is given a value of up to 1.

2.7.3. Step 3: Normalization of the Decision Matrix Using Constraint Criteria and Location Criteria

Evaluating location criteria, i.e., power criteria, and converting constraint criteria into numerical values, a comprehensive decision matrix was created for each proposed site. The decision matrix was subsequently standardized according to the benefit and cost criteria using Equations (5) and (6).
For   benefit   criteria ,   n ij = b ij b max bmin max
For   cost   criteria ,   n ij = cij max cmin max
Here, bij characterizes the ith value of jth benefit criteria, cij represents the ith value of jth cost criteria, min and max in subscript characterize the respective minimum and maximum value of benefit criteria and cost criteria, respectively, and nij is the normalized value.

2.7.4. Step 4: Conveying the Weights to Each Criterion

The rank-sum weighted method was employed to normalize the decision matrix and allocate weights to each criterion. The weights in the rank-sum (RS) method are calculated by normalizing the individuals’ rankings using Equation (7). This is achieved by dividing their combined ranks by the sum of all ranks [67].
W j = 2 n + 1 r j n n + 1
Here, j = 1, 2, 3……n, and rj is the ranking of jth criterion.

2.7.5. Step 5: Ultimate Standing of Sites Considering the Weighted Result

Once the relative weights for all criteria were established, each criterion was multiplied by its corresponding weight. The resulting values were then added together to obtain a total score, which was used to rank the suitable sites.

3. Results

3.1. Head Determination

The elevations of the selected sites were determined using Google Earth Pro to assess the head at the seventeen marked sites. To determine the starting point of the river, specific sites were selected on a geographic information system (GIS) map of the Upper Indus Basin. These sites were chosen along the centerline of the river and were meant to indicate potential sites for plants/turbines and intake points. The ArcGIS Editor Toolbar was utilized to designate the intended positions. The disparity in elevation between the head and tail waters is subsequently employed to compute the head for each of the seventeen search points/sites. Head determination of all seventeen sites in the Upper Indus Basin is shown in Figure 3.
Table 3 demonstrates the utilization of the first point as the intake point and the second point as the powerhouse/turbine position to calculate the elevation difference/head. According to the findings, sites 8, 5, and 7 exhibit the three highest heads, i.e., 193.902 m, 100.304 m, and 81.707 m, respectively.

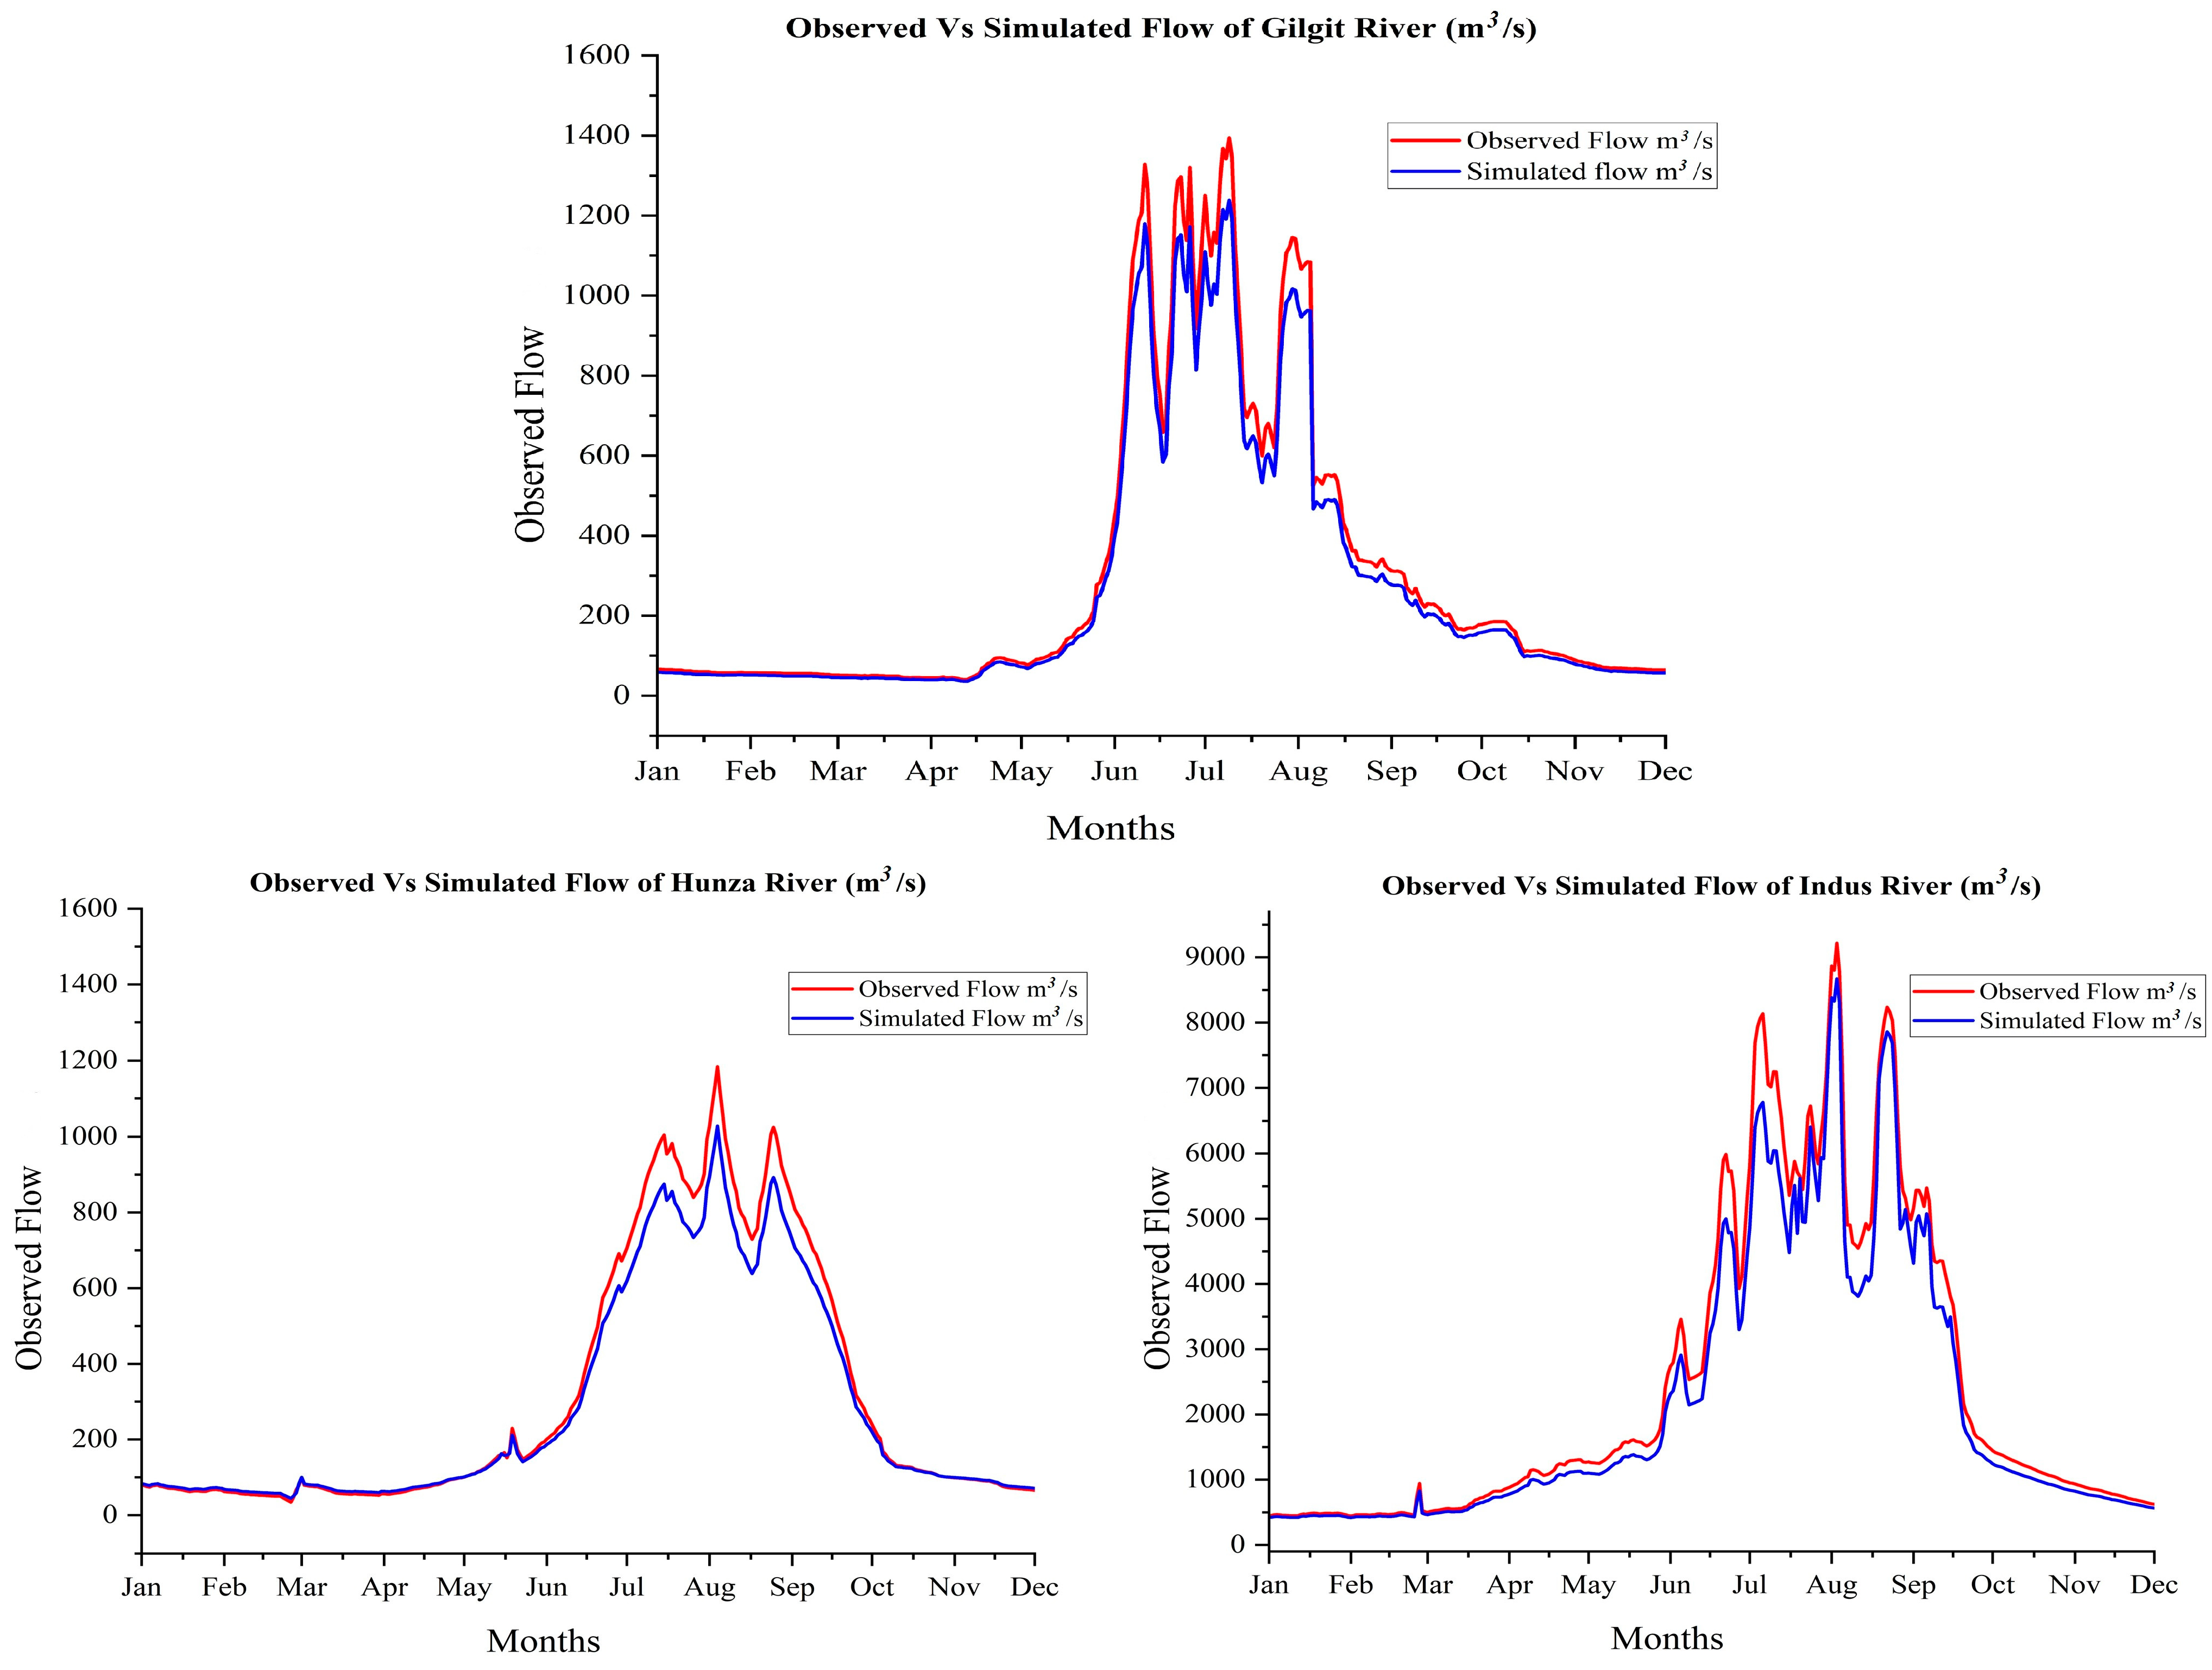
3.2. Discharge Determination

3.2.1. Watershed Delineation

The geographic information system (GIS) and CN-Tables were used to determine the catchment features, such as the watershed area size and the curve number (CN). These attributes were then used to calculate the discharge using the area ratio (AR) and Soil Conservation Service Curve Number (SCS-CN) techniques. Figure 4 depicts the process of demarcating the watershed, starting from the upper reaches and extending to the lower reaches, utilizing the GIS extension Arc-hydro tool.

3.2.2. Flow Duration Curves (FDC)

Figure 5 shows the flow duration curves for the Indus, Hunza, and Gilgit Rivers. The flow duration curve (FDC) for three designated locations in the Upper Indus Basin—site 6 on the Indus River, site 8 on the Hunza River, and site 12 on the Gilgit River—illustrates the diversity of hydrological regimes in the Upper Indus Basin, emphasizing the disparate potential for hydropower generation at each site. The selected sites were derived from 17 prospective hydropower locations to offer a representative and comprehensive understanding of the basin’s hydrological parameters. FDCs demonstrate the UIB’s substantial flow capacity, with discharge values consistently high across most exceedance probabilities, signifying a reliable and considerable flow regime suitable for high-capacity hydropower production.
Coefficient to check the accuracy of the model:
The Nash–Sutcliffe efficiency (NSE) [68] is a normalized statistical metric that quantifies the proportion of residual variance relative to the variance of the measured data. The Nash–Sutcliffe efficiency assesses the degree to which the observed data align with the simulated data along the 1:1 line. The Nash–Sutcliffe efficiency is calculated using Equation (8) as follows:
E = 1 i = 1 n O i P i 2 i = 1 n O i O ¯ 2
In Equation (8), Oi represents the observed flow, Pi represents the simulated flow, and Ō represents the average of the observed data. Following Equation (8), the Nash–Sutcliffe efficiency calculated for the observed flow vs. simulated flow in 2012 is 0.987 at the Gilgit River, 0.98 at the Hunza River, and 0.97 at the Indus River, which shows the accuracy of the simulation produced using this method.
Willmott [69] introduced an agreement index (d) as a standardized metric to quantify the level of model prediction error, ranging from 0 to 1. The index of agreement is the ratio of the mean square error to the potential error. A value of 1 signifies a complete match in agreement, while a value of 0 shows no agreement at all. The index of agreement can identify both additive and proportional discrepancies in the observed and simulated means and variances. However, the index of agreement is highly responsive to extreme values because it involves squared differences [70]. The agreement index is determined as follows:
i o a = 1 i = 1 n O i e i 2 i = 1 n O i O ¯ + e i e ¯ 2
In Equation (9), Oi represents the observed power, ei represents the simulated power, Ō represents the average of the observed data, and ē represents the average of the simulated data. The index of agreement produced satisfactory results. After the application of the abovementioned equation, the index of agreement value for the observed flow vs. simulated flow for the year 2012 is 0.94 at the Gilgit River, 0.95 at the Hunza River, and 0.98 at the Indus River, which shows the accuracy of the simulation produced using this method.
The R2 score quantifies the degree of correlation between the simulated and observed values [71]. The R2 coefficient is estimated using Equation (10) as follows:
R 2 = Q o b s Q o b s ¯ × Q s i m Q s i m ¯ Q o b s Q o b s ¯ 2 × Q s i m Q s i m ¯ 2
In Equation (10), Qobs is the observed value, Qsim is the simulated value, Ǭobs is the average observed value, and Ǭsim is the average simulated value. The permissible values for R2 range from 1.0 (indicating the best fit) to 0.0 (indicating an inadequate fit). The correlation coefficient (R2) also produced satisfactory results. After the application of the abovementioned equation, the correlation coefficient (R2) value for the observed flow vs. simulated flow for the year 2012 is 0.98 at the Gilgit River, 0.94 at the Hunza River, and 0.96 at the Indus River, which shows the accuracy of the simulation produced using this method. The model calibration results are indicated in Figure 6 for the Gilgit, Hunza, and Indus Rivers.
As shown in Figure 6, the calibration of the area ratio method yields satisfactory results. Therefore, it is recommended that further steps be taken.

3.3. Hydropower Potential

Estimating hydropower availability at all seventeen selected sites was conducted using Equation (4), as illustrated in Table 4. The hydropower potential of the 17 proposed sites in the Upper Indus Basin (UIB) reveals significant variations in power generation capacity, ranging from small-scale to large-scale potential. The discharge values at these sites vary widely, with site 17 showing the highest discharge (861.64 m3/s) and site 11 the lowest (24.79 m3/s). Similarly, head values range from 6.4 m at site 1 to 100.3 m at site 5, influencing the power output at each site. The power generated at these sites also spans a broad range, with the lowest estimated at 3.9 kW (site 11) and the highest at 243.66 MW (site 16). Sites 5, 6, 15, 16, and 17 are the most promising locations due to their high discharge rates and favorable head conditions, suggesting substantial hydropower potential. While the hydropower potential values estimated for the proposed sites in the Upper Indus Basin provide a strong foundation for identifying viable energy generation locations, it is crucial to incorporate a multi-criteria decision-making (MCDM) analysis to prioritize these sites based on environmental constraints, thereby minimizing the negative impacts of the construction of hydropower projects.
By integrating these considerations, the analysis will support a more sustainable decision-making process, helping to avoid irreversible environmental damage and ensuring that hydropower projects align with the broader goals of environmental conservation and sustainable development.

3.4. MCDM

The constraint parameters were assigned quantitative values, as illustrated in Table 5, through the utilization of opinions from experts and field analysis. Table 5 presents the comprehensive decision matrix, showcasing a numerical illustration of the constraint and location criteria for each proposed site. The decision matrix was further standardized based on cost and benefit criteria using Equations (5) and (6).
Once the decision matrix was compiled with numerical values, it was normalized to ensure that the influence of a single larger criterion does not outweigh that of the other criteria. To achieve this objective, the benefit criteria (Site Accessibility and Power) were standardized by dividing the values of each proposed site by the highest value among all proposed sites for each specific criterion. This process ensures that the highest value is assigned a score of 1.0.
According to Table 5, the highest value for the benefit criteria is 243.661, corresponding to site 16. To normalize the power values, each was divided by 243.661. For instance, for site 16, dividing 243.661 by 243.661 results in 1.0. Similarly, for site 2, dividing 24.8746 by 243.661 gives 0.1021. For the cost criteria—including residential area, agricultural area, and interaction with other HPPs—normalization was performed by dividing each site’s value by the smallest value among all sites for each criterion. This ensures that the lowest value receives a normalized score of 1.0. As shown in Table 5, the smallest observed value is 1 for the agricultural area. This value was used to normalize the proposed sites for criterion 3. For example, for site 16, the agricultural area value was calculated as 1 divided by 3, resulting in 0.3333. Meanwhile, the minimum value of 1 divided by 1 yields 1.0. After applying the numerical scale to the intangible criteria, the normalized decision matrix is elaborated in Table 6.
Additionally, as shown in Table 7, the relative weights were obtained using Equation (7).
Table 7 presents the relative weights assigned to different criteria based on their importance in hydropower site selection. Power generation potential is given the highest priority (weight: 0.333), followed by site access (0.267) and agricultural land (0.200), which impacts land use considerations. Residential areas (0.133) and interaction with existing HPPs (0.067) are weighted lower due to their relatively lesser influence on site feasibility. These weights reflect a balanced approach, prioritizing power output and accessibility while minimizing environmental and social impacts. The relative weights for each site were multiplied by the corresponding criteria, as shown in Table 8, and the sum of all the criteria was used to determine the final score for the suggested sites.
Table 8 shows the weighted decision matrix, where each site’s attributes are multiplied by the corresponding relative weights from Table 7. The final column sums these weighted values to rank the suitability of potential sites. Sites with higher scores indicate better feasibility based on the chosen criteria. For instance, site 17 (0.941) and site 15 (0.829) rank the highest, suggesting they offer the most favorable conditions for hydropower development. This matrix aids in making informed decisions by systematically evaluating multiple factors affecting site selection. Table 9 displays the ultimate rankings of the suggested sites, determined by the total weightings of all criteria for the proposed hydropower sites in the Upper Indus Basin. After applying the multi-criteria decision-making (MCDM) analysis, a significant shift in priorities is observed when environmental constraints are considered.
While sites 16, 17, 5, 14, and 15 initially had high hydropower potential based on their discharge and head values, their rankings are altered when environmental and socioeconomic factors are incorporated into the decision-making process. Site 17, with the highest environmental score (0.941), emerges as the most optimal choice for development, despite not being the top contender based on hydropower generation alone. Similarly, site 16, which had more promising hydropower outputs than site 15, now ranks lower than site 15 after considering their environmental impacts. This shift in rankings emphasizes the importance of adopting a holistic approach to hydropower site selection.
By integrating environmental considerations, the methodology ensures that potential sites are evaluated not only based on technical feasibility but also on their sustainability and impact on local ecosystems. These results underscore the role of MCDM in prioritizing sites that minimize negative environmental consequences, such as habitat destruction, sedimentation, and water quality degradation, which are commonly associated with hydropower development. The final rankings indicate that while high hydropower potential is crucial, addressing environmental challenges is essential for sustainable development. The prioritization of sites based on their total weighted score ensures that the proposed projects align with global sustainability goals, such as SDG 7, by providing clean energy while protecting ecosystems and local communities. This integrated approach paves the way for informed decision-making that balances energy needs with environmental preservation.

4. Discussion

The growing need for sustainable and renewable energy has encouraged the advancement of small run-of-river plants. Initial investigations are necessary to evaluate the technical and economic viability of these plants. After conducting an analysis and calculating the final score using the MCDM method, it has been determined that site 17, site 15, site 16, site 5, and site 6 are the most promising sites among the seventeen alternatives proposed (Table 9), yielding estimated hydropower of 200.39, 119.45, 243.66, 196.82, and 100.86 MW, respectively (Table 4). The assessment of hydropower potential in the Upper Indus River Basin revealed that this area has significant opportunities for hydropower development, including the Indus River, Hunza River, and Gilgit River. Furthermore, the MCDM analysis of each site showed that site 16 possesses the highest hydropower potential, i.e., 243.66 MW, yet ranks third rank because of the impacts of constraint criteria compared to the first and second ranked sites.
Previous research is also discussed here to place the findings in the broader context of the existing literature, highlighting the consistencies and discrepancies and providing a comprehensive perspective on how the current study’s results fit within the wider scientific discourse. This analytical hierarchy process has been utilized by various researchers in the assessment of hydropower development, e.g., [72,73], and yielded reasonable results when it was used. In one study, Ali et al. (2023) [74] analyzed the possible sites for small-scale run-of-river hydropower projects in Thailand’s Songkhla Lake Basin (SLB) using the analytical hierarchy process (AHP), geographic information system (GIS), and other tools, considering environmental, economic, and technical factors during the selection process. The same methodology was adopted in another study, where MCDM was used by Vassoney et al. (2021) [75] in Aosta Valley, Italy, to determine the best environmental flow scenario for releasing water from hydroelectric power. The study considered four criteria: energy, environment and fishing, landscape, and economy.
Thus, it was determined that the presence of significant favorable location criteria alone does not make the site the most suitable. Other factors, such as constraint criteria, also have a crucial impact on the overall suitability of the environment. Therefore, this study conducted an initial evaluation and comprehensive examination to facilitate the advancement of hydropower initiatives in the designated region.

5. Conclusions

This study demonstrates the significant hydropower potential in the Upper Indus Basin of Pakistan, highlighting its capacity to sustainably meet the country’s growing energy demands. Multi-criteria decision-making (MCDM) and Geographic Information Systems (GIS) allowed for a thorough evaluation of seventeen proposed hydropower sites, considering both technical and environmental factors. This study successfully identified optimal sites that balance energy potential and environmental sustainability. The final rankings, which prioritize sites based on environmental sustainability, revealed that sites 17, 15, 16, 5, and 6 were selected as the most promising sites for hydropower projects in the study region. The findings emphasize the importance of integrating environmental constraints into hydropower site selection, ensuring that the benefits of hydropower are realized without compromising the integrity of local ecosystems and communities. While it is not a substitute for detailed field investigations, the methodology presented here provides a valuable framework for policymakers and developers to conduct initial assessments of hydropower potential. By leveraging GIS and MCDM tools, this approach efficiently identifies the most promising sites for future hydropower projects while minimizing negative environmental consequences. In short, this study lays the groundwork for sustainable hydropower development in Pakistan, contributing to the achievement of Sustainable Development Goal 7 (SDG-7) by ensuring access to affordable, reliable, and sustainable energy. The methodology provides a replicable model that can be applied globally, offering a balanced approach to hydropower development that respects environmental limits while addressing energy security needs.

6. Limitations and Future Research Directions

While this study focused on assessing conventional hydropower potential in the Upper Indus Basin, future research could explore the feasibility of pumped-hydro storage (PHS) systems at the identified sites. PHS offers significant potential for energy storage and grid stability, particularly in regions with variable energy demand and increasing renewable energy integration. A detailed assessment of PHS feasibility, including site suitability, environmental impacts, and economic viability, would provide valuable insights for policymakers and stakeholders. This could further enhance the sustainability and reliability of Pakistan’s energy system. Incorporating PHS units in the UIB could significantly enhance Pakistan’s energy storage capabilities and contribute to a more resilient and sustainable power grid. Additionally, this study did not consider the economic and political challenges associated with hydropower development, such as funding availability, regulatory hurdles, or geopolitical issues in the region. The elevation data used for head calculations (e.g., from DEMs/Google Earth Pro) were assumed to be accurate and representative of the actual terrain. The impact of climate change on future water availability and hydropower potential was not considered.
Future research should expand on this methodology by incorporating additional indices and more precise location criteria, particularly for small-scale hydropower projects. The lack of geological, seismic, and riverbed studies, as well as electricity transmission infrastructure and cost assessments in this analysis, presents an opportunity for further exploration in future studies, which could refine the understanding of potential sites. Additionally, incorporating more advanced engineering techniques, such as headrace tunnels, would allow for a more comprehensive evaluation of the sites. Future research directions can also focus on the need for ground-based hydro-meteorological and geological data collection to improve model precision, the integration of economic feasibility assessments, such as Levelized Cost of Energy (LCOE) analysis and financial risk assessment, to refine hydropower project planning, and the potential of public–private partnerships and policy frameworks to support the implementation of GIS-based site selection methods for practical decision-making.

Author Contributions

A.Q.B.: methodology, data curation, formal analysis, investigation, writing—original draft, and writing—review and editing. D.S.: conceptualization, supervision, project administration, funding acquisition, and writing—review and editing. M.W.: supervision, investigation, validation, and writing—review and editing. A.A.: funding acquisition, project administration, and writing—review and editing. A.B.: formal analysis and writing—review and editing. N.Y.: software and writing—review and editing. All authors have read and agreed to the published version of the manuscript.

Funding

This work was financially supported by Youth Science and Technology, China project (B240201160), the international partnership of the Chinese Academy of Sciences (Grant No. 046GJHZ2023069MI), and the Natural Science Foundation of China (42171148).

Data Availability Statement

Upon request, the corresponding author will provide access to the data used to demonstrate the research findings.

Acknowledgments

The authors express their gratitude to all who contributed to this research, with special recognition to the Water and Power Development Authority (WAPDA) of Pakistan, particularly Engr. Nazakat Hussain (General Manager, Diamer Basha Dam), for providing the discharge data. The technical aspects of this research endeavor would not have been attainable without their collaboration.

Conflicts of Interest

The authors declare no conflicts of interest.

References

  1. Siddiqui, S. Surge in Capacity Drives up Electricity Production Cost, NEPRA Report Reveals. 2024. Available online: https://www.brecorder.com/news/40348104/ecc-endorses-purchase-of-582mn-capital-shares-in-bricss-new-development-bank (accessed on 1 January 2025).
  2. Tahir, A.A.; Chevallier, P.; Arnaud, Y.; Neppel, L.; Ahmad, B. Modeling snowmelt-runoff under climate scenarios in the Hunza River basin, Karakoram Range, Northern Pakistan. J. Hydrol. 2011, 409, 104–117. [Google Scholar] [CrossRef]
  3. Punys, P.; Vyčienė, G.; Jurevičius, L.; Kvaraciejus, A. Small Hydropower Assessment of Uganda Based on Multisource Geospatial Data. Water 2023, 15, 2051. [Google Scholar] [CrossRef]
  4. Butt, A.Q.; Shangguan, D.; Butt, F.K.; Khan, A.A.; Afzal, M. Navigating Sustainability: A Comprehensive Analysis of EIA Process and Mitigation Measures at the Karora Hydropower Project, Shangla, Pakistan. J. Mt. Area Res. 2024, 9, 31. [Google Scholar] [CrossRef]
  5. Butt, A.Q.; Shangguan, D.; Waseem, M.; Haq, F.U.; Ding, Y.; Mukhtar, M.A.; Afzal, M.; Muhammad, A. Ascertainment of Hydropower Potential Sites Using Location Search Algorithm in Hunza River Basin, Pakistan. Water 2023, 15, 2929. [Google Scholar] [CrossRef]
  6. Mirjat, N.H.; Uqaili, M.A.; Harijan, K.; Das Valasai, G.; Shaikh, F.; Waris, M. A Review of Energy and Power Planning and Policies of Pakistan. Renew. Sustain. Energy Rev. 2017, 79, 110–127. [Google Scholar] [CrossRef]
  7. Siddiqi, A.; Wescoat, J.L.; Humair, S.; Afridi, K. An empirical analysis of the hydropower portfolio in Pakistan. Energy Policy 2012, 50, 228–241. [Google Scholar] [CrossRef]
  8. Hashmi, A.; Bhatti, A.I.; Ahmed, S.; Tariq, M.A.U.R.; Savitsky, A. Revisiting the Indus Basin Model for an Energy Sustainable Pakistan. Water 2022, 14, 702. [Google Scholar] [CrossRef]
  9. Bartle, A. Hydropower potential and development activities. Energy Policy 2002, 30, 1231–1239. [Google Scholar] [CrossRef]
  10. Paish, O. Small hydro power: Technology and current status. Renew. Sustain. Energy Rev. 2002, 6, 537–556. [Google Scholar] [CrossRef]
  11. Flamos, A.; Georgallis, P.G.; Doukas, H.; Karakosta, C. Hydro energy: Techno-economic and social aspects within new climate regim. Int. J. Renew. Energy Technol. 2011, 2, 35–52. [Google Scholar] [CrossRef]
  12. World Energy Council. World Energy Resources Hydropower; World Energy Council: London, UK, 2016. [Google Scholar]
  13. Lu, B.; Blakers, A.; Stocks, M.; Do, T.N. Low-cost, low-emission 100% renewable electricity in Southeast Asia supported by pumped hydro storage. Energy 2021, 236, 121387. [Google Scholar] [CrossRef]
  14. UNCC. How Hydropower Can Help Climate Action. 2018. Available online: https://unfccc.int/news/how-hydropower-can-help-climate-action (accessed on 1 January 2025).
  15. UNRIC. Regional Information Centre for Western Europe. 2023. Available online: https://unric.org/en/sdg-7/ (accessed on 1 January 2025).
  16. Government of Pakistan. Pakistan’s Implementation of the 2030 Agenda for Sustainable Development Goals—Voluntary National Review; SDG Section, Ministry of Planning, Development and Reforms: Islamabad, Pakistan, 2019.
  17. Dudhani, S.; Sinha, A.K.; Inamdar, S.S. Assessment of small hydropower potential using remote sensing data for sustainable development in India. Energy Policy 2006, 34, 3195–3205. [Google Scholar] [CrossRef]
  18. Rojanamon, P.; Chaisomphob, T.; Bureekul, T. Application of geographical information system to site selection of small run-of-river hydropower project by considering engineering/economic/environmental criteria and social impact. Renew. Sustain. Energy Rev. 2009, 13, 2336–2348. [Google Scholar] [CrossRef]
  19. Ullah, S.; Iqbal, M.; Waseem, M.; Abbas, A.; Masood, M.; Nabi, G.; Tariq, M.A.U.R.; Sadam, M. Potential sites for rainwater harvesting focusing on the sustainable development goals using remote sensing and geographical information system. Sustainability 2024, 16, 9266. [Google Scholar] [CrossRef]
  20. Kusre, B.C.; Baruah, D.C.; Bordoloi, P.K.; Patra, S.C. Assessment of hydropower potential using GIS and hydrological modeling technique in Kopili River basin in Assam (India). Appl. Energy 2010, 87, 298–309. [Google Scholar] [CrossRef]
  21. Larentis, D.G.; Collischonn, W.; Olivera, F.; Tucci, C.E.M. Gis-based procedures for hydropower potential spotting. Energy 2010, 35, 4237–4243. [Google Scholar] [CrossRef]
  22. Yi, C.-S.; Lee, J.-H.; Shim, M.-P. Site location analysis for small hydropower using geo-spatial information system. Renew. Energy 2010, 35, 852–861. [Google Scholar] [CrossRef]
  23. Palomino Cuya, D.G.; Brandimarte, L.; Popescu, I.; Alterach, J.; Peviani, M. A GIS-based assessment of maximum potential hydropower production in La Plata basin under global changes. Renew. Energy 2013, 50, 103–114. [Google Scholar] [CrossRef]
  24. Akbar, H.; Gheewala, S.H. Impact of Climate and Land Use Changes on flowrate in the Kunhar River Basin, Pakistan, for the Period (1992–2014). Arab. J. Geosci. 2021, 14, 707. [Google Scholar] [CrossRef]
  25. Alashan, S.; Şen, Z.; Toprak, Z.F. Hydroelectric Energy Potential of Turkey: A Refined Calculation Method. Arab. J. Sci. Eng. 2016, 41, 1511–1520. [Google Scholar] [CrossRef]
  26. Zaidi, A.Z.; Khan, M. Identifying high potential locations for run-of-the-river hydroelectric power plants using GIS and digital elevation models. Renew. Sustain. Energy Rev. 2018, 89, 106–116. [Google Scholar] [CrossRef]
  27. Butt, A.Q.; Shangguan, D.; Ding, Y.; Banerjee, A.; Mukhtar, M.A.; Taj, K. Evaluation of environmental impact assessment and mitigation strategies for Gulpur hydropower project, Kotli, Pakistan. Discov. Appl. Sci. 2024, 6, 137. [Google Scholar] [CrossRef]
  28. Bayazıt, Y.; Bakış, R.; Koç, C. An investigation of small scale hydropower plants using the geographic information system. Renew. Sustain. Energy Rev. 2017, 67, 289–294. [Google Scholar] [CrossRef]
  29. Belmonte, S.; Núñez, V.; Viramonte, J.G.; Franco, J. Potential renewable energy resources of the Lerma Valley, Salta, Argentina for its strategic territorial planning. Renew. Sustain. Energy Rev. 2009, 13, 1475–1484. [Google Scholar] [CrossRef]
  30. Fasipe, O.A.; Izinyon, O.C.; Ehiorobo, J.O. Hydropower potential assessment using spatial technology and hydrological modelling in Nigeria river basin. Renew. Energy 2021, 178, 960–976. [Google Scholar] [CrossRef]
  31. Punys, P.; Dumbrauskas, A.; Kvaraciejus, A.; Vyciene, G. Tools for Small Hydropower Plant Resource Planning and Development: A Review of Technology and Applications. Energies 2011, 4, 1258–1277. [Google Scholar] [CrossRef]
  32. Kouadio, C.A.; Kouassi, K.L.; Diedhiou, A.; Obahoundje, S.; Amoussou, E.; Kamagate, B.; Paturel, J.-E.; Coulibaly, T.J.H.; Coulibaly, H.S.J.P.; Didi, R.S.; et al. Assessing the Hydropower Potential Using Hydrological Models and Geospatial Tools in the White Bandama Watershed (Côte d’Ivoire, West Africa). Front. Water 2022, 4, 844934. [Google Scholar] [CrossRef]
  33. Uy, H.C.; Quebada, A.E.E.; Amante, M.L.P. Hydropower Generation Potential of Samar River System Based on GIS and SWAT Model. GMSARN Int. J. 2023, 17, 33–39. [Google Scholar]
  34. Akande, B.S.O.; Sanusi, Y.A.; Sanni, L.M.; Santali, B.N. GIS-Based Approach to Small Hydropower Potential Assessment along River Ogun, Nigeria. J. Incl. Cities Built Environ. 2023, 3, 65–74. [Google Scholar]
  35. Ayele, M.K. GIS based assessment of hydropower potential (A case study on Gumara River Basin, Ethiopia). Am. Sci. Res. J. Eng. Technol. Sci. 2020, 69, 26–44. [Google Scholar]
  36. Tecle, A.; Fogel, M.; Duckstein, L. Multicriterion Selection of Wastewater Management Alternatives. J. Water Resour. Plan. Manag. 1988, 114, 383–398. [Google Scholar] [CrossRef]
  37. Weng, S.Q.; Huang, G.H.; Li, Y.P. An integrated scenario-based multi-criteria decision support system for water resources management and planning—A case study in the Haihe River Basin. Expert Syst. Appl. 2010, 37, 8242–8254. [Google Scholar] [CrossRef]
  38. Areri, D.C.; Bibi, T.S. Identification of small-scale hydropower potential sites using geographic information system and hydrologic modeling technique: Awata river, Genale Dawa basin, Ethiopia. Energy Rep. 2023, 9, 2405–2419. [Google Scholar] [CrossRef]
  39. Atieh, M.; Gharabaghi, B.; Rudra, R. Entropy-based neural networks model for flow duration curves at ungauged sites. J. Hydrol. 2015, 529, 1007–1020. [Google Scholar] [CrossRef]
  40. Gazendam, E.; Gharabaghi, B.; McBean, E.; Whiteley, H.; Kostaschuk, R. Ranking of Waterways Susceptible to Adverse Stormwater Effects. Can. Water Resour. J. 2009, 34, 205–228. [Google Scholar] [CrossRef]
  41. Pathak, S.; Sharma, S.; Banerjee, A.; Kumar, S. A methodology to assess and evaluate sites with high potential for stormwater harvesting in Dehradun, India. Big Data Res. 2024, 35, 100415. [Google Scholar] [CrossRef]
  42. Kodikara, P.N.; Perera, B.J.C.; Kularathna, M.D.U.P. Stakeholder preference elicitation and modelling in multi-criteria decision analysis—A case study on urban water supply. Eur. J. Oper. Res. 2010, 206, 209–220. [Google Scholar] [CrossRef]
  43. Noori, A.; Bonakdari, H.; Morovati, K.; Gharabaghi, B. The optimal dam site selection using a group decision-making method through fuzzy TOPSIS model. Environ. Syst. Decis. 2018, 38, 471–488. [Google Scholar] [CrossRef]
  44. Elmahmoudi, F.; Abra, O.E.; Serrar, O.; Raihani, A.; Bahatti, L.; Rafik, M. GIS based multi-criteria decision analysis for renewable energy sites selection: Comparative study. In Proceedings of the 2018 6th International Renewable and Sustainable Energy Conference (IRSEC), Rabat, Morocco, 5–8 December 2018; IEEE: Piscataway, NJ, USA, 2018. [Google Scholar] [CrossRef]
  45. Ferguson, J.W.; Healey, M.; Dugan, P.; Barlow, C. Potential effects of dams on migratory fish in the Mekong River: Lessons from salmon in the fraser and Columbia Rivers. Environ. Manag. 2011, 47, 141–159. [Google Scholar] [CrossRef]
  46. Schmitt, R.J.P.; Rosa, L. Dams for hydropower and irrigation: Trends, challenges, and alternatives. Renew. Sustain. Energy Rev. 2024, 199, 114439. [Google Scholar] [CrossRef]
  47. Wang, M.; Shangguan, D.; Li, D.; Li, Y.; Wang, R.; He, R.; Butt, A.Q. Glacial hazards change in Xinjiang over the past seven decades: Spatiotemporal patterns and trends. Quat. Sci. Rev. 2025, 351, 109183. [Google Scholar] [CrossRef]
  48. Wu, H.; Chen, J.; Xu, J.; Zeng, G.; Sang, L.; Liu, Q.; Yin, Z.; Dai, J.; Yin, D.; Liang, J.; et al. Effects of dam construction on biodiversity: A review. J. Clean. Prod. 2019, 221, 480–489. [Google Scholar] [CrossRef]
  49. Sustainable Development Goals. 2024. Available online: https://www.un.org/sustainabledevelopment/energy/ (accessed on 1 January 2025).
  50. Malik, M.A.; Ashraf, M.; Bahzad, A.; Aslam, A.M. Soil Physical and Hydraulic Properties of the Upper Indus Plain of Pakistan; Pakistan Council of Research in Water Resources: Islamabad, Pakistan, 2019; ISBN 9789698469696.
  51. Shangguan, D.; Li, D.; Ding, Y.; Liu, J.; Anjum, M.N.; Li, Y.; Guo, W. Determining the events in a glacial disaster chain at Badswat Glacier in the Karakoram Range using remote sensing. Remote Sens. 2021, 13, 1165. [Google Scholar] [CrossRef]
  52. Korup, O.; Montgomery, D.R.; Hewitt, K. Glacier and landslide feedbacks to topographic relief in the Himalayan syntaxes. Earth Atmos. Planet. Sci. 2010, 107, 5317–5322. [Google Scholar] [CrossRef] [PubMed]
  53. Ahmed, M.F.; Rogers, J.D. First-Approximation Landslide Inventory Maps for Northern Pakistan, Using ASTER DEM Data and Geomorphic Indicators. J. Environ. Eng. Geosci. 2014, 20, 67–83. [Google Scholar] [CrossRef]
  54. Butt, A.Q.; Shangguan, D.; Banerjee, A.; Farooq, R.; Wang, R.; Afzal, M.; Li, D.; Wang, M.; Wu, J.; Han, T.; et al. Assessing societal perceptions and adaptive responses to GLOF and related hazards in the Upper Indus Basin, Pakistan. Discov. Appl. Sci. 2025, 7, 152. [Google Scholar] [CrossRef]
  55. Butt, A.Q.; Shangguan, D.; Ding, Y.; Banerjee, A.; Sajjad, W.; Mukhtar, M.A. Assessing the existing guidelines of environmental impact assessment and mitigation measures for future hydropower projects in Pakistan. Front. Environ. Sci. 2024, 11, 1342953. [Google Scholar] [CrossRef]
  56. Ajmal, M.; Kim, T.-W.; Ahn, J.-H. Stability assessment of the curve number methodology used to estimate excess rainfall in forest-dominated watersheds. Arab. J. Geosci. 2016, 9, 402. [Google Scholar] [CrossRef]
  57. Soulis, K.X.; Valiantzas, J.D. SCS-CN parameter determination using rainfall-runoff data in heterogeneous watersheds—The two-CN system approach. Hydrol. Earth Syst. Sci. 2012, 16, 1001–1015. [Google Scholar] [CrossRef]
  58. Soulis, K.X.; Valiantzas, J.D.; Dercas, N.; Londra, P.A. Investigation of the direct runoff generation mechanism for the analysis of the SCS-CN method applicability to a partial area experimental watershed. Hydrol. Earth Syst. Sci. 2009, 13, 605–615. [Google Scholar] [CrossRef]
  59. Gianfagna, C.C.; Johnson, C.E.; Chandler, D.G.; Hofmann, C. Watershed area ratio accurately predicts daily streamflow in nested catchments in the Catskills, New York. J. Hydrol. Reg. Stud. 2015, 4, 583–594. [Google Scholar] [CrossRef]
  60. Ergen, K.; Kentel, E. An integrated map correlation method and multiple-source sites drainage-area ratio method for estimating streamflows at ungauged catchments: A case study of the Western Black Sea Region, Turkey. J. Environ. Manag. 2016, 166, 309–320. [Google Scholar] [CrossRef] [PubMed]
  61. Farmer, W.H.; Vogel, R.M. Performance-weighted methods for estimating monthly streamflow at ungauged sites. J. Hydrol. 2013, 477, 240–250. [Google Scholar] [CrossRef]
  62. Shu, C.; Ouarda, T.B.M.J. Improved methods for daily streamflow estimates at ungauged sites. Water Resour. Res. 2012, 48, W02523. [Google Scholar] [CrossRef]
  63. Jasso, A.T. Evaluation of Small Hydro Power Potential in Three River Basins of Mexico; Mexican Institute of Water Technology (IMTA): Jiutepec, Mexico, 2009; pp. 1–14. [Google Scholar]
  64. Khan, M.; Zaidi, A.Z. Run-of-River Hydropower Potential of Kunhar River, Pakistan. Pak. J. Meteorol. 2015, 12, 25–32. [Google Scholar]
  65. Cai, X.; Ye, F.; Gholinia, F. Application of artificial neural network and Soil and Water Assessment Tools in evaluating power generation of small hydropower stations. Energy Rep. 2020, 6, 2106–2118. [Google Scholar] [CrossRef]
  66. Wali, U.G. Estimating Hydropower Potential of an Ungauged Stream. Int. J. Emerg. Technol. Adv. Eng. 2013, 3, 592–600. [Google Scholar]
  67. Roszkowska, E. Rank Ordering Criteria Weighting Methods—A Comparative Overview. Optimum. Stud. Ekon. 2013, 5, 14–33. [Google Scholar] [CrossRef]
  68. Nash, J.E.; Sutcliffe, J.V. River Flow Forecasting through Conceptual Models Part I—A Discussion of Principles. J. Hydrol. 1970, 10, 282–290. [Google Scholar] [CrossRef]
  69. Willmott, C.J.; Ackleson, S.G.; Davis, R.E.; Feddema, J.J.; Klink, K.M.; Legates, D.R.; O’Donnell, J.; Rowe, C.M. Statistics for the evaluation and comparison of models. J. Geophys. Res. Ocean. 1985, 90, 8995–9005. [Google Scholar] [CrossRef]
  70. AgriMet. Index of Agreement. AgriMetSoft (2019). Online Calculators. 2019. Available online: https://agrimetsoft.com/calculators/Index%20of%20Agreement (accessed on 1 January 2025).
  71. Meenu, R.; Rehana, S.; Mujumdar, P.P. Assessment of hydrologic impacts of climate change in Tunga-Bhadra river basin, India with HEC-HMS and SDSM. Hydrol. Process. 2013, 27, 1572–1589. [Google Scholar] [CrossRef]
  72. Xiao, B.; Zeng, Y.; Zou, Y.; Hu, W. Hydropower Unit State Evaluation Model Based on AHP and Gaussian Threshold Improved Fuzzy Comprehensive Evaluation. Energies 2023, 16, 5592. [Google Scholar] [CrossRef]
  73. Hämmerling, M.; Kocięcka, J.; Zaborowski, S. AHP as a useful tool in the assessment of the technical condition of hydrotechnical constructions. Sustainability 2021, 13, 1304. [Google Scholar] [CrossRef]
  74. Ali, F.; Srisuwan, C.; Techato, K.; Bennui, A. Assessment of small hydropower in Songkhla Lake Basin, Thailand using GIS-MCDM. Sustain. Water Resour. Manag. 2023, 9, 40899. [Google Scholar] [CrossRef]
  75. Vassoney, E.; Mammoliti Mochet, A.; Desiderio, E.; Negro, G.; Pilloni, M.G.; Comoglio, C. Comparing Multi-Criteria Decision-Making Methods for the Assessment of Flow Release Scenarios from Small Hydropower Plants in the Alpine Area. Front. Environ. Sci. 2021, 9, 635100. [Google Scholar] [CrossRef]
Figure 1. (a) Study area, i.e., Upper Indus Basin (Pakistan). (b) Seventeen proposed sites in the Upper Indus Basin (Pakistan).
Resources 14 00049 g001
Figure 2. Steps involved in creating DEM using Sentinel-1.
Resources 14 00049 g002
Figure 4. Watershed delineation of Upper Indus River at all 17 proposed alternatives. Numbers denote the Watershed delineated area. i.e., Number 1 denotes the Watershed delineated area for Site 1, and so on.
Resources 14 00049 g004
Figure 5. Flow duration curves showing discharges at selective sites i.e., Indus, Hunza, and Gilgit Rivers.
Resources 14 00049 g005
Figure 6. Calibration of results for observed vs. simulated flow at Gilgit, Hunza, and Indus Rivers.
Resources 14 00049 g006
Table 1. Criteria considered for the MCDM.
Major CriteriaSub-CriteriaCriterion Type (Benefit or Cost)
Location Criteria
(Power)
HeadBenefit
DischargeBenefit
Constraint Criteria
(Environmental)
Site AccessBenefit
Agricultural AreasCost
Residential AreasCost
Interaction with existing HPPsCost
Table 2. Range of values that could be assigned to the constraint criteria considering site constraints using benefit and cost criteria.
Cost CriteriaAssigned ValueBenefit Criteria
0
Very high1Very low
High3Low
Normal5Normal
Low7High
Very low9Very high
10
Table 3. Head determination of all seventeen sites in the Upper Indus Basin.
UIB SitesLatitudeLongitudeRiverElevation at Headrace (ft)Elevation at Tailrace (ft)Head (ft)Head (m)
135.0902458176.03007488Indus River77347713216.402
235.3285625675.84508775Indus River746573729328.353
335.4677195475.37402412Indus River692568428325.305
435.5893777475.31262481Indus River6661644521665.853
535.7152023274.77516221Indus River52094880329100.304
635.8318608774.7384981Indus River4687452016750.915
736.5601435274.79766065Hunza river8831856326881.707
836.3068278174.80682667Hunza river83217685636193.902
936.2509983774.36602402Hunza river588758177021.341
1036.2659973273.65190705Gilgit river6560640615446.951
1136.1749229873.18099361Gilgit river795778926519.817
1235.9943495674.20603515Gilgit river520351287522.866
1335.4202228574.29436234Indus River347834047422.560
1435.4279503373.20348386Indus River278127047723.476
1535.1039925573.00655144Indus River221421555917.987
1635.002751972.91029199Indus River2079196011936.280
1734.8260975373.00278555Indus River181817229629.268
Table 4. Estimation of hydropower for all seventeen proposed sites.
UIB SitesDischarge Q50 (m3/s)Head (m)Density (kg/m3)Turbine Efficiency Gravitational Acceleration (ms−2)Power (KW)Power (MW)
119.1536.40243910000.819.81974.39780.974398
2110.40628.3536610000.819.8124,874.5824.87458
3220.47225.3048810000.819.8144,331.4344.33143
4227.43565.8536610000.819.81119,012.1119.0121
5246.942100.304910000.819.81196,820.8196.8208
6249.31250.9146310000.819.81100,864.8100.8648
734.16981.7073210000.819.8122,184.3822.18438
861.794193.902410000.819.8195,210.2395.21023
981.40521.3414610000.819.8113,804.7713.80477
1057.95346.9512210000.819.8121,621.0521.62105
1124.79219.8170710000.819.813903.9583.903958
1293.13222.8658510000.819.8116,921.5616.92156
13682.72622.5609810000.819.81122,393.5122.3935
14788.7223.4756110000.819.81147,127.5147.1275
15835.55917.987810000.819.81119,428.9119.4289
16845.236.2804910000.819.81243,661.3243.6613
17861.64329.2682910000.819.81200,391.3200.3913
Table 5. Decision matrix wherein the intangible criteria (benefit and cost) are assigned numerical values.
Site
No.
Power (MW)Site AccessAgricultural
Area
Residential
Area
Interaction
with Existing HPPs
10.97447999
224.87467979
344.33147339
4119.0127779
5196.8217999
6100.8657339
722.18447779
895.21027999
913.80487339
1021.62117339
113.903967779
1216.92167779
13122.3937559
14147.1277779
15119.4297119
16243.6617339
17200.3917119
Table 6. Normalized decision matrix after applying the numerical scale to the intangible criteria (cost and benefit).
Site No.Power (MW)Site AccessAgricultural AreaResidential AreaInteraction with Existing HPP
10.003910.11110.11111
20.102110.11110.14281
30.181910.33330.33331
40.488410.14280.14281
50.807810.11110.11111
60.413910.33330.33331
70.091010.14280.14281
80.390710.11110.11111
90.056610.33330.33331
100.088710.33330.33331
110.016010.14280.14281
120.069410.14280.14281
130.502310.20.21
140.603810.142800.14281
150.49011111
16110.33330.33331
170.82241111
Table 7. Weights of criteria based on their relative preferences.
CriterionPreferenceRelative Weight
Power10.333
Site Access20.267
Agricultural areas30.200
Residential areas40.133
Interaction with existing HPP50.067
Table 8. Weighted decision matrix obtained by multiplication of the relative weights with values of the normalized decision matrix.
Site No.Outcome Accomplished by the Multiplication of Criteria by Their Respective Relative WeightsSummation of Criteria Weightage
PowerSite AccessAgricultural AreaResidential AreaInteraction with Existing HPP
10.001330.26670.022220.014810.06670.371
20.033990.26670.022220.019040.06670.408
30.060580.26670.066670.044430.06670.505
40.162640.26670.028570.019040.06670.544
50.268980.26670.022220.014810.06670.639
60.137840.26670.066670.044430.06670.5823
70.030310.26670.028570.019040.06670.411
80.130110.26670.022220.014810.06670.501
90.018860.26670.066670.044430.06670.463
100.029540.26670.066670.044430.06670.474
110.005330.26670.028570.019040.06670.386
120.023120.26670.028570.019040.06670.404
130.167260.26670.040.026660.06670.567
140.201070.26670.028570.019040.06670.5821
150.163210.26670.20.13330.06670.829
160.3330.26670.066670.044430.06670.777
170.273860.26670.20.13330.06670.941
Table 9. Ordering of each proposed site according to the final score.
Site No.LongitudeLatitudeSum of All Criteria Weightage (from Table 8)Final Rankings
135.0902458176.030074880.37117
235.3285625675.845087750.40814
335.4677195475.374024120.5059
435.5893777475.312624810.5448
535.7152023274.775162210.6394
635.8318608774.73849810.58235
736.5601435274.797660650.41113
836.3068278174.806826670.50110
936.2509983774.366024020.46312
1036.2659973273.651907050.47411
1136.1749229873.180993610.38616
1235.9943495674.206035150.40415
1335.4202228574.294362340.5677
1435.4279503373.203483860.58216
1535.1039925573.006551440.8292
1635.002751972.910291990.7773
1734.8260975373.002785550.9411
Disclaimer/Publisher’s Note: The statements, opinions and data contained in all publications are solely those of the individual author(s) and contributor(s) and not of MDPI and/or the editor(s). MDPI and/or the editor(s) disclaim responsibility for any injury to people or property resulting from any ideas, methods, instructions or products referred to in the content.

