Article

Crude Oil Resources Under Climate Stringent Scenarios: Production Under Contract and Probabilistic Analyses of Exploratory Frontiers

by
Silvia Pantoja
1,
Pedro R. R. Rochedo
2,3,* and
Alexandre Szklo
1,3
1
Energy Planning Program (PPE), Alberto Luiz Coimbra Institute for Graduate Studies and Research in Engineering (COPPE), Universidade Federal do Rio de Janeiro (UFRJ), Rio de Janeiro 21941-917, Brazil
2
Research and Innovation Center on CO2 and Hydrogen (RICH Center), Management Science and Engineering Department, Khalifa University, Abu Dhabi P.O. Box 127788, United Arab Emirates
3
Centre for Energy and Environmental Economics (CENERGIA), Centro de Tecnologia, Sala C-211, Cidade Universitária, Ilha do Fundão, Rio de Janeiro 21941-972, Brazil
*
Author to whom correspondence should be addressed.
Resources 2025, 14(4), 54; https://doi.org/10.3390/resources14040054
Submission received: 29 January 2025 / Revised: 16 March 2025 / Accepted: 21 March 2025 / Published: 26 March 2025

Abstract

:
This study analyzes the crude oil supply in 2030 and 2050, comparing it with demand scenarios from the UN Intergovernmental Panel on Climate Change and the International Energy Agency. It focuses on the oil under production or development as of today (or the supply already under contract), and the oil frontiers. For that, it firstly evaluates a database of over 107,000 assets to identify and classify recoverable oil volumes through 2050. By comparing the supply and demand, this study identifies scenarios requiring production declines or, in opposition, the development of new projects and exploratory frontiers. The focus is on 2030 and 2050, which are key milestones in the global climate agenda. As an original contribution, the analysis also identifies how oil supply regions position themselves regarding oil quality, production costs, and the GHG emission intensity of the oil offered. As the second contribution, this study develops the probability assessment of recoverable resources to evaluate a typical oil frontier, analyzing how global climate scenarios could affect the probability of approving a deepwater offshore project. The findings show that cumulative oil consumption by 2050 may range from 600 billion to 1 trillion barrels, with marginal supply costs between US$28/bbl and US$44/bbl. The findings indicate that the frontier project lacks economic attractiveness in scenarios limiting the increase in the global surface temperature (GST) below 1.5 °C with no or limited overshoots. However, assuming a smooth price decline trajectory from today to 2050, the project exhibits high profitability and returns across all the scenarios. This suggests that the industry might remain inclined to approve new projects, even amid potential energy transition scenarios, driven by favorable short- and medium-term returns despite long-term uncertainties.

1. Introduction

The timing of the peak in the fossil hydrocarbon supply and whether this peak will occur due to resource scarcity remains a critical energy security issue. This question has led to seminal works on estimating peak oil, such as those by Hubbert [1] and Campbell and Laherrère [2] Additionally, methodologies were developed to estimate the decline rates in oil production, as in Arps [3] and Al-Fattah [4]. Such methodologies have significantly contributed to forecasting the oil supply, relying on data from already discovered resources, fields under development, and fields in production, guiding investments in exploring new frontiers to replenish reserves.
In the context of the climate crisis, however, the debate has evolved towards the necessity of a peak in oil demand to limit the increase in the global surface temperature (GST) to below 2 °C, ideally capping it at 1.5 °C. At the 2023 Conference of the Parties (COP-28), member nations signed an agreement endorsing a transition away from fossil fuels. While the term “phase out” was not explicitly included in the agreement, UN Secretary-General António Guterres affirmed that the phase-out of fossil fuels is inevitable and must proceed with justice and equity [5].
However, oil replacement presents more complex challenges than coal, whose phase-out is supported by technically and economically viable substitutes [6,7], and the major concerns relate to coal rents-dependent regions [7]. Projections indicate that a phase-down of oil, rather than an outright phase-out, is more feasible due to the demand from hard-to-abate sectors, such as aviation, maritime transport, and petrochemicals, which currently lack viable substitutes [6]. Oil demand forecasts for 2050 highlight a residual volume of hydrocarbons, even in scenarios limiting GST increases to 1.5 °C [7].
Despite the need for a phase-down, the oil and gas (O&G) industry holds, under existing contracts, a volume of oil potentially exceeding the global demand by 2050 in net-zero greenhouse gas (GHG) emissions scenarios [8,9]. Consequently, in ambitious climate policy scenarios, parts of these contracted assets risk becoming economically unviable, potentially leading to stranded assets and contractual disputes [10,11,12]. In the absence of a globally coordinated approach to phasing down oil, one that specifies regional production cessation sequences and mechanisms for a fair and equitable transition, producers capable of delivering oil sooner and at lower costs are expected to meet the remaining demand [11,12]. To adapt to potential energy transition scenarios, oil companies increasingly focus on reducing project breakeven costs and greenhouse gas (GHG) emissions from operations [13]. For instance, Petrobras [14] reports that 65% of its upstream investments are resilient to a long-term oil price of $35/bbl. Similarly, Equinor [15] and Exxon Mobil [16] highlighted portfolios of upstream assets with breakeven prices around $35/bbl and $40/bbl, respectively.
This concern has prompted studies on stranded assets and the transition from fossil fuels, typically emphasizing the resources that cannot be extracted [17], the criteria for defining the remaining producers [12,18], the analysis of cash flow in upstream projects [19], or even assess the risk of oil producers claiming compensation (as an example of an investor-state dispute settlement (ISDS), Rockhopper vs Italy is a case under the Energy Charter Treaty (ECT) where a British company, Rockhopper Exploration, sued Italy for banning offshore oil drilling near its coast, seeking compensation for lost profits) [20]. This study advances the analysis by providing an original contribution to evaluating the contracted production and the oil frontier (not yet contracted oil). First, it identified how oil supply regions position themselves regarding oil quality, production costs, and the GHG emission intensity of the oil contracted. Second, it proposed and applied an original approach that integrates climate scenarios with a probabilistic economic analysis of frontier resources to determine the probability of oil resources being viable under different levels of climate mitigation ambition.
Therefore, the main objective of this study is to carefully explore the implications of high-ambition climate scenarios for existing and future oil production. This includes assessing globally contracted oil production and the expansion of production frontiers, which are enabled by economically viable projects.
The paper begins with a global analysis of the contracted oil production (or the oil assets that are already under contract for exploration, development, or production activities), assessing its alignment with oil demand under various climate ambition scenarios and quantifying the oil volume at risk of becoming stranded in the coming decades. Contracted production is further stratified by quality, cost, and GHG emission intensity to identify the categories that are most susceptible to stranding. These categories are then regionalized to determine, under the cost-effectiveness criteria, which regions will face the greatest challenges in sustaining production under declining oil demand scenarios. Particularly, using primary data from Rystad Energy (this study used the UCube database provided by Rystad Energy through a scientific–academic partnership with the Cenergia Laboratory at COPPE/UFRJ; more details will be presented in the methodology section), the global volume of recoverable oil under contract (reflecting an acquired right for operators in the petroleum industry to explore and produce these volumes) is analyzed and compared against the demand projections from the last assessment report of the Intergovernmental Panel on Climate Change (IPCC) and the scenarios from the International Energy Agency (IEA). The analysis focuses on the milestone years of 2030 and 2050, reflecting the critical points in the global climate agenda.
Then, building on this global perspective that also allows the estimate of the marginal cost of oil supply, the study narrows its focus to the probabilistic analysis of the economic viability of an exploratory frontier under the same climate scenarios. The objective is to demonstrate that climate scenarios can drive varying trajectories in oil prices, which may probabilistically influence the feasibility of the production that is currently deemed viable in a representative exploratory frontier. In this case, a deepwater upstream project in Brazil serves as the case study, reflecting the importance of deepwater discoveries in the 21st century [21] and Brazil’s prominence in this domain. The analysis tests the project’s resilience at a breakeven price of $30/bbl under varying price trajectories from the IPCC and IEA scenarios.
The structure of this article is as follows: Section 2 introduces the IPCC and IEA climate scenarios used in the analyses; Section 3 details the methodology; Section 4 presents the results and discusses the impacts of climate scenarios on both contracted production and the economic viability of an exploratory frontier project; finally, Section 5 concludes with the key findings and final considerations.

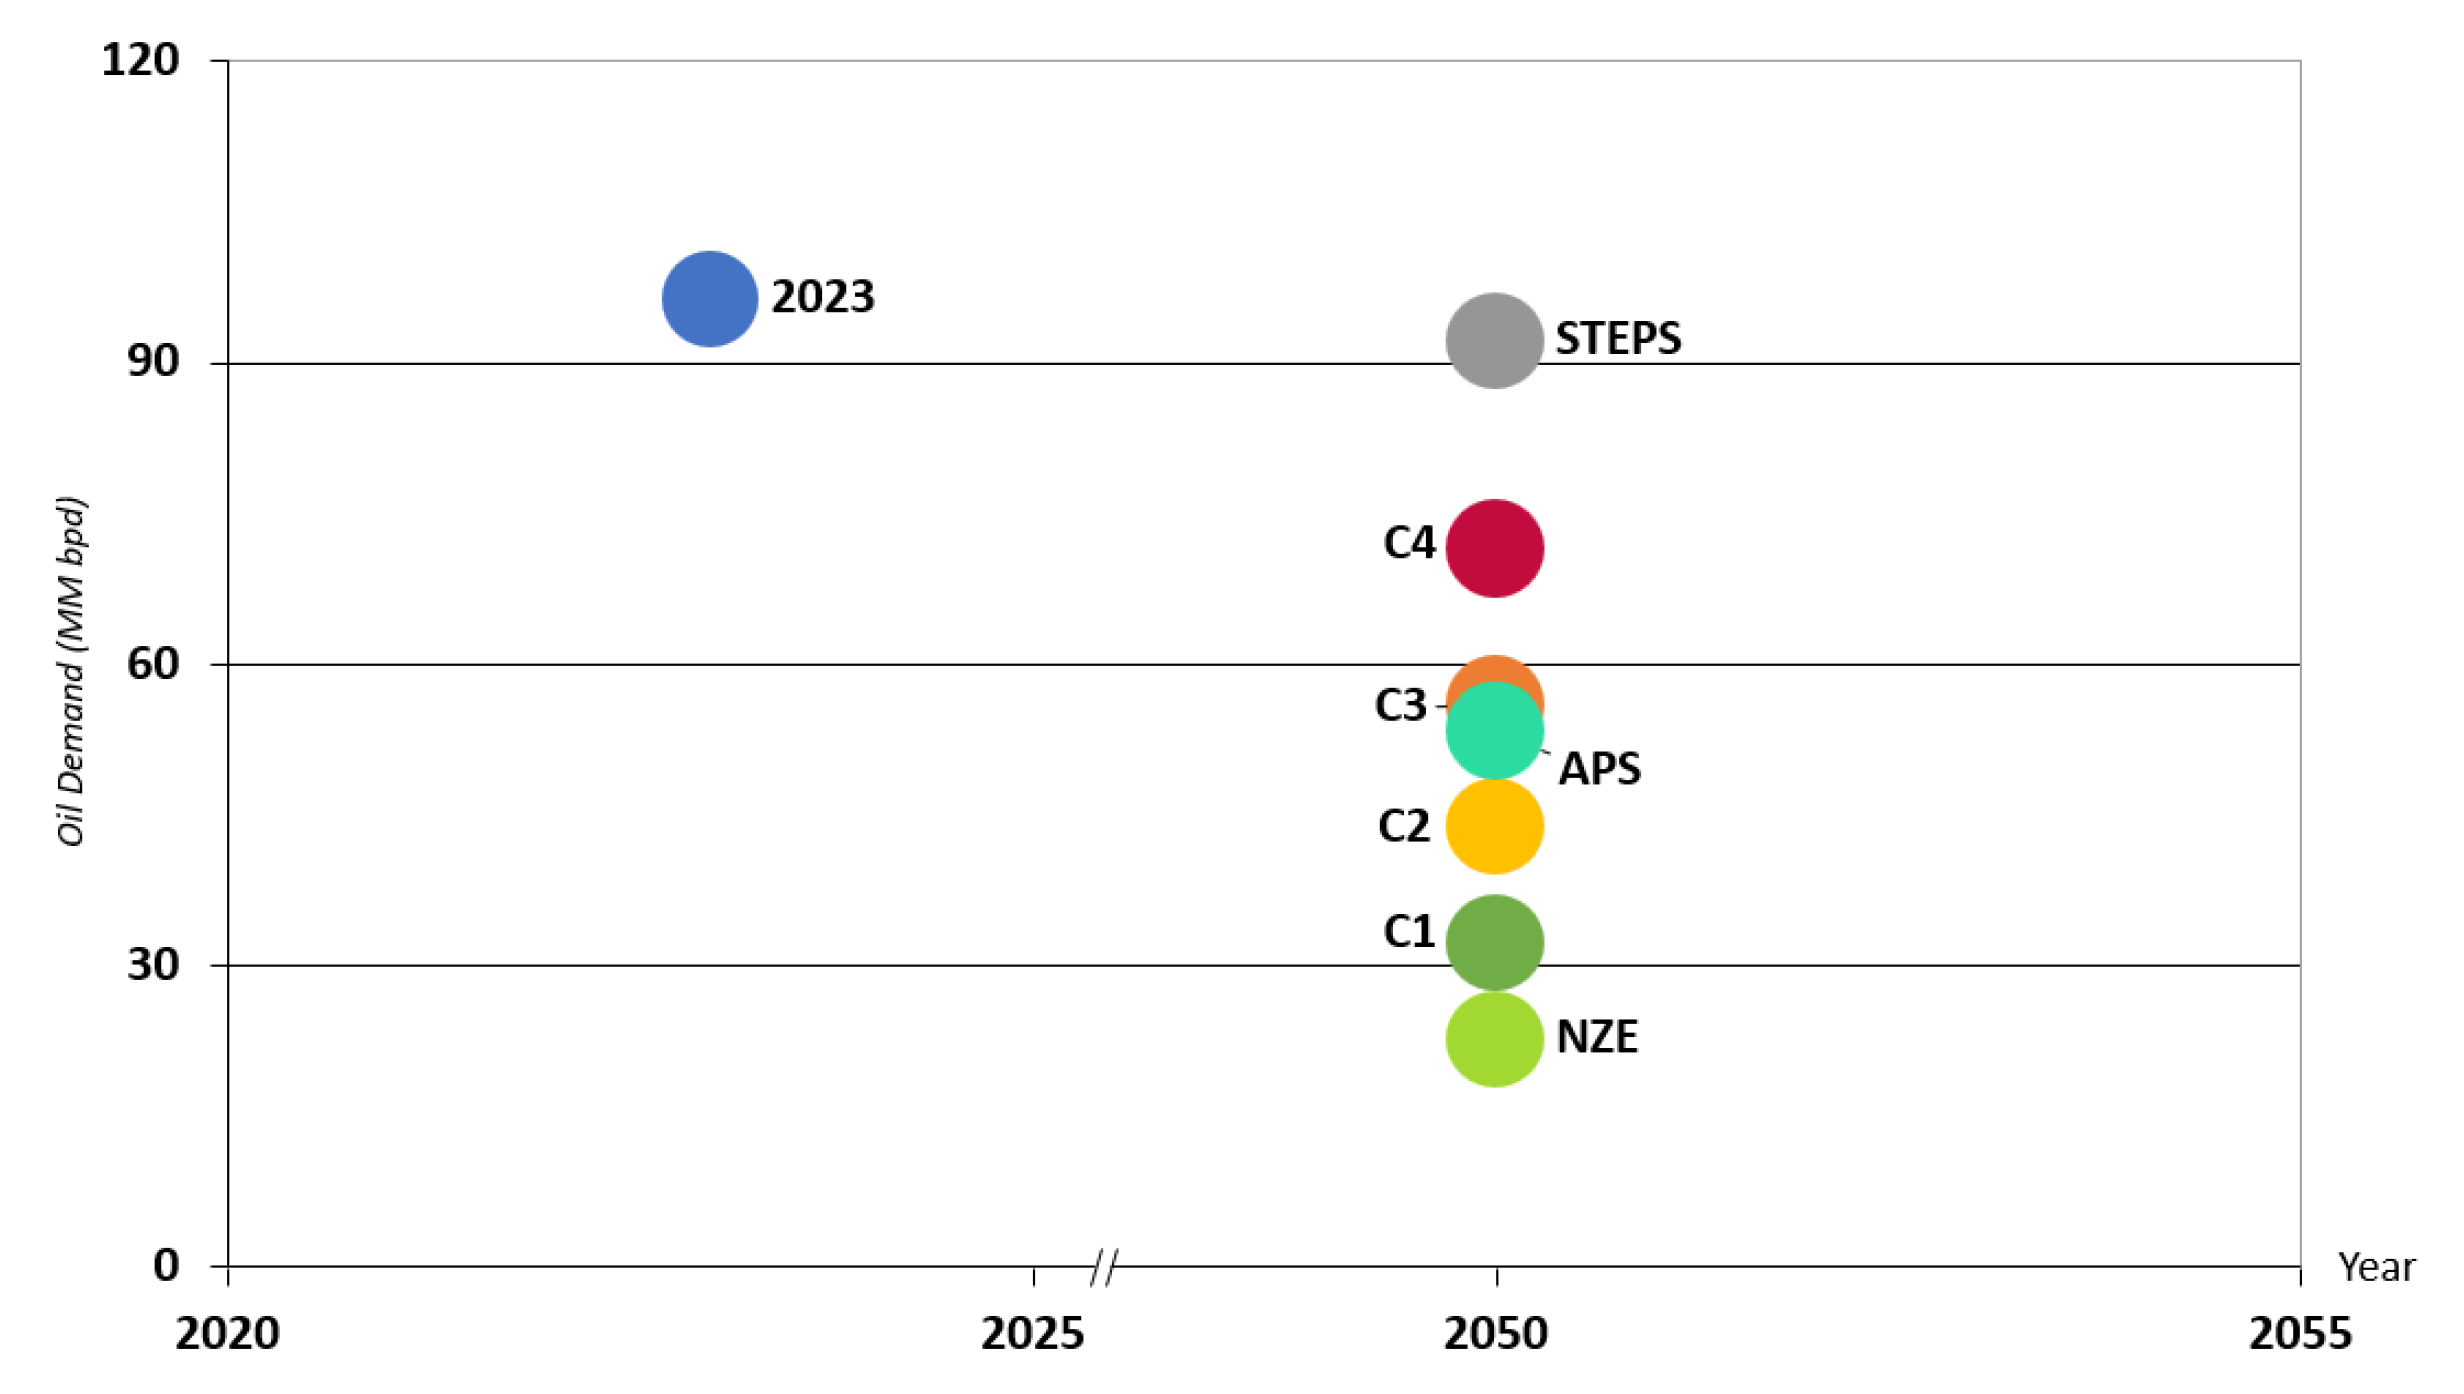
2. Oil Demand in IPCC and IEA Scenarios

The IPCC 6th Assessment Report (AR6) compiles global energy transition scenarios derived from scientific studies employing integrated assessment models (IAMs) [22]. Each scenario correlates the projected GST increase with the corresponding oil demand level, as illustrated in Table 1.
The AR6 scenarios range from C1 to C8, with the C8 scenario projecting a GST increase of up to 4°C. This study confines its analysis to the C4 scenario to align with the GST limits established in the Paris Agreement. Additionally, the three scenarios from the World Energy Outlook (it is worth noting that the IEA’s Net Zero Emissions (NZE) scenario achieves global net zero emissions without factoring in reductions from sectors outside the energy domain (e.g., land-based carbon dioxide removals), distinguishing it from the broader scope of the IPCC scenarios) [23] are incorporated, which correlate GST increases with oil demand levels, as presented in Table 2.

3. Methodology

3.1. Contracted Production

To perform a detailed analysis of the potential oil production from fields already contracted by the oil industry, two databases developed by international consultancy companies operating in the energy sector were examined. These databases include Vantage, from S&P Global, and UCube, from Rystad Energy. First, the global volume of oil under contract was compared for 2023, 2030, and 2050. However, differences were identified, primarily related to the volume of non-conventional fields. These differences arose due to the authors’ limited access to data on non-conventional resources within the Vantage database (it is important to note that this limitation derives from the authors’ partial access to the global S&P database). To refine the validation process, the global oil production of 96.4 million barrels per day (MM bpd) recorded in 2023 [24] was compared against both databases, confirming the compatibility of UCube. Furthermore, a scientific–academic partnership between Rystad Energy and the Cenergia Laboratory at COPPE/UFRJ facilitated access to UCube for this research.
The UCube database offers critical data on oil production curves by country, encompassing more than 107,000 assets. It integrates historical data on global oil and gas production alongside projections for hydrocarbon exploration and production through 2100. The database provides projections for future production, defined as the expected annual rate of hydrocarbon extraction, based on baseline price scenarios estimated at the time of data access. These projections encompass volumes that may or may not yet be confirmed as reserves. The UCube database also supports extensive data disaggregation, enabling categorizations by resource type, asset life cycle, and region. Hydrocarbons are categorized via the “Oil and Gas Category” filter into crude oil, condensate, natural gas liquids (NGLs), refinery gains, other liquids, gas, and other gas. Crude oil is further classified into bitumen, heavy, medium, light, and extra-light oil. Asset life cycles are categorized into phases such as undiscovered, discovered, under development, in production, and unknown. Geographic data span from continent-level aggregations to specific block-level details, facilitating queries across multiple hierarchical levels.
Data for this study were extracted in November 2024. The initial aggregations aimed to estimate the potential global liquid production over the coming decades, considering the fields currently in production, under development, or the exploratory phase. Using the UCube database filters, the following criteria were applied:
  • Field Type Category: Selected oil, gas, and gas condensate fields, excluding refinery gains.
  • Oil and Gas Category: Included crude oil, condensate, and NGL.
  • Life Cycle Category: Focused on assets currently in production, under development, or classified as discoveries.
  • Year Filter: Selected data for 2030 and 2050.
The resulting oil supply volumes projected for 2030 and 2050 were compared against the demand projections derived from IPCC and IEA scenarios. These comparisons aimed to identify potential production surpluses or deficits for each scenario in the designated years. To gain deeper insights into the volumes of oil at risk of becoming stranded, liquid production was analyzed based on the quality, cost, and emission intensity—key factors influencing the competitiveness of production in low-demand scenarios.

3.1.1. Quality Classification

The “API Group” filter was applied to categorize oil by density into the following groups: bitumen, extra-heavy (API < 15), heavy (API 15–22), medium (API 22–30), light (API > 30), extra-light, condensate, and gas. API gravity measures the petroleum density relative to water, where oil with an API gravity below 10° is heavier than water and above 10° is lighter. The liquids were subsequently grouped into four broad categories: (1) heavy oil, encompassing bitumen and extra-heavy oil; (2) medium oil; (3) light oil, including extra-light; and (4) condensates and NGL.

3.1.2. Cost Classification

The “Economy Type” filter isolates cost-related variables, including investments and operating expenses. The “Oil and Gas Category” filter included the gas volumes produced in each field to ensure an accurate cost-per-barrel calculation. The total field cost was then distributed across the entire hydrocarbon production volume, associating this unit cost specifically to liquid volumes. Liquid production was categorized into cost ranges from less than US$10/bbl to over US$40/bbl. Nominal values were used for these cost calculations.

3.1.3. Emission Intensity Classification

Emission intensity, measured in kilograms of CO2 equivalent per barrel of oil equivalent (kg CO2e/boe), was analyzed using the “Emission Source Category” and “Greenhouse Gas” filters. The selected emission sources included “Extraction” and “Flaring Upstream”, explicitly excluding “Combustion of Products” to focus solely on operational emissions (or scopes 1 and 2 of GHG emissions: scope 1 emissions originate directly from the operations of the O&G industry, while scope 2 emissions result from the energy generation required to power these operations). Both methane (CH4) and carbon dioxide (CO2) emissions were included. Similar to the cost analysis, the emission intensity accounted for the gas production and was associated exclusively with liquid volumes. Liquid production was stratified into emission intensity ranges, from less than 10 kg CO2e/boe to over 50 kg CO2e/boe. It is important to note that although relevant technologies are being developed to mitigate GHG emissions in upstream operations, with a particular emphasis on carbon capture, utilization, and storage (CCUS) [25], this analysis assumes that the emission intensity remains static over time. This assumption is made both for simplification and due to the understanding that the majority of oil production between 2030 and 2050 will not benefit from CCUS. This is primarily because of its high costs and, consequently, the slow pace of its deployment [26]. Moreover, it is not trivial to incorporate CCUS into fields that are already under production, whose development was established (and final investment decision, FID, was made) without considering this option.
Using the volumes identified as at risk of stranding in 2030 and 2050 across each scenario, the next step involved correlating these volumes with the least competitive categories of oil in terms of the quality, cost, and emission intensity. The least competitive volumes were defined as the heaviest oils, the most expensive to produce, and those with the highest greenhouse gas emission intensity. The analysis then sought to determine the regions with the highest concentrations of these least competitive oil volumes. Regional data were consolidated using Rystad’s “Continent” classification, complemented by a more granular analysis at the country level to pinpoint specific areas where these less competitive liquids are concentrated.

3.2. Exploratory Frontier

The analysis of the volume of oil at risk also makes it possible to identify the marginal cost of production in different scenarios, depending on the balance of the supply and demand curves. It thus contributes to assessing the probability of the economic feasibility of oil frontiers, since long-term oil prices can fluctuate probabilistically across these scenarios (the IPCC scenarios enable such a statistical analysis, as each comprises dozens or even hundreds of sub-scenarios; in contrast, the IEA scenarios are singular and deterministic but will also be used to evaluate the project, albeit without a statistical analysis). This study develops a simulation of the economic performance of a deepwater project, a remarkable exploratory frontier in the recent history of global hydrocarbon production [21,27]. Brazil was chosen as the deepwater region for this study, as it is one of the world’s leading producers in such environments [27,28], particularly through its pre-salt reservoirs in the Santos Basin [28]. Brazil also holds significant potential for further exploration and development in deepwater frontiers, such as the Sergipe–Alagoas Basin and the basins of the Equatorial Margin [29].
The first step in this analysis involves modeling the cash flow of an emblematic upstream project. The marginal cost of production in 2050 is determined by intersecting the oil supply curve, organized by marginal production costs, with the demand curves obtained from the IPCC and IEA scenarios. This approach assumes that global oil production will prioritize projects in ascending order of production costs, consistent with the methodologies of [11,18]. In alignment with the microeconomic theory, which posits that marginal cost equals price in competitive markets in the long run [30], the marginal production cost in 2050 is equated to the producer oil price (without taxes and royalties). Using these projected prices across different scenarios, the cash flow of a simulated upstream pre-salt project in Brazil, operating under a concession (royalty and tax) regime, is analyzed. This simulation is based on publicly available data. It incorporates parameters targeting a breakeven price of US$ 30/bbl, making it US$ 5 more resilient than comparable projects disclosed by Petrobras, Exxon, and Equinor (see the references mentioned in the introduction). The project is evaluated against price projections in two ways:
5.
Stress Test or Robustness Test: The oil price projected for 2050 is applied uniformly across all years as a robustness test for long-term viability.
6.
Simplified Price Trajectory: An interpolation between the 2023 oil price and the 2050 price projection creates a simplified trajectory for long-term analysis.

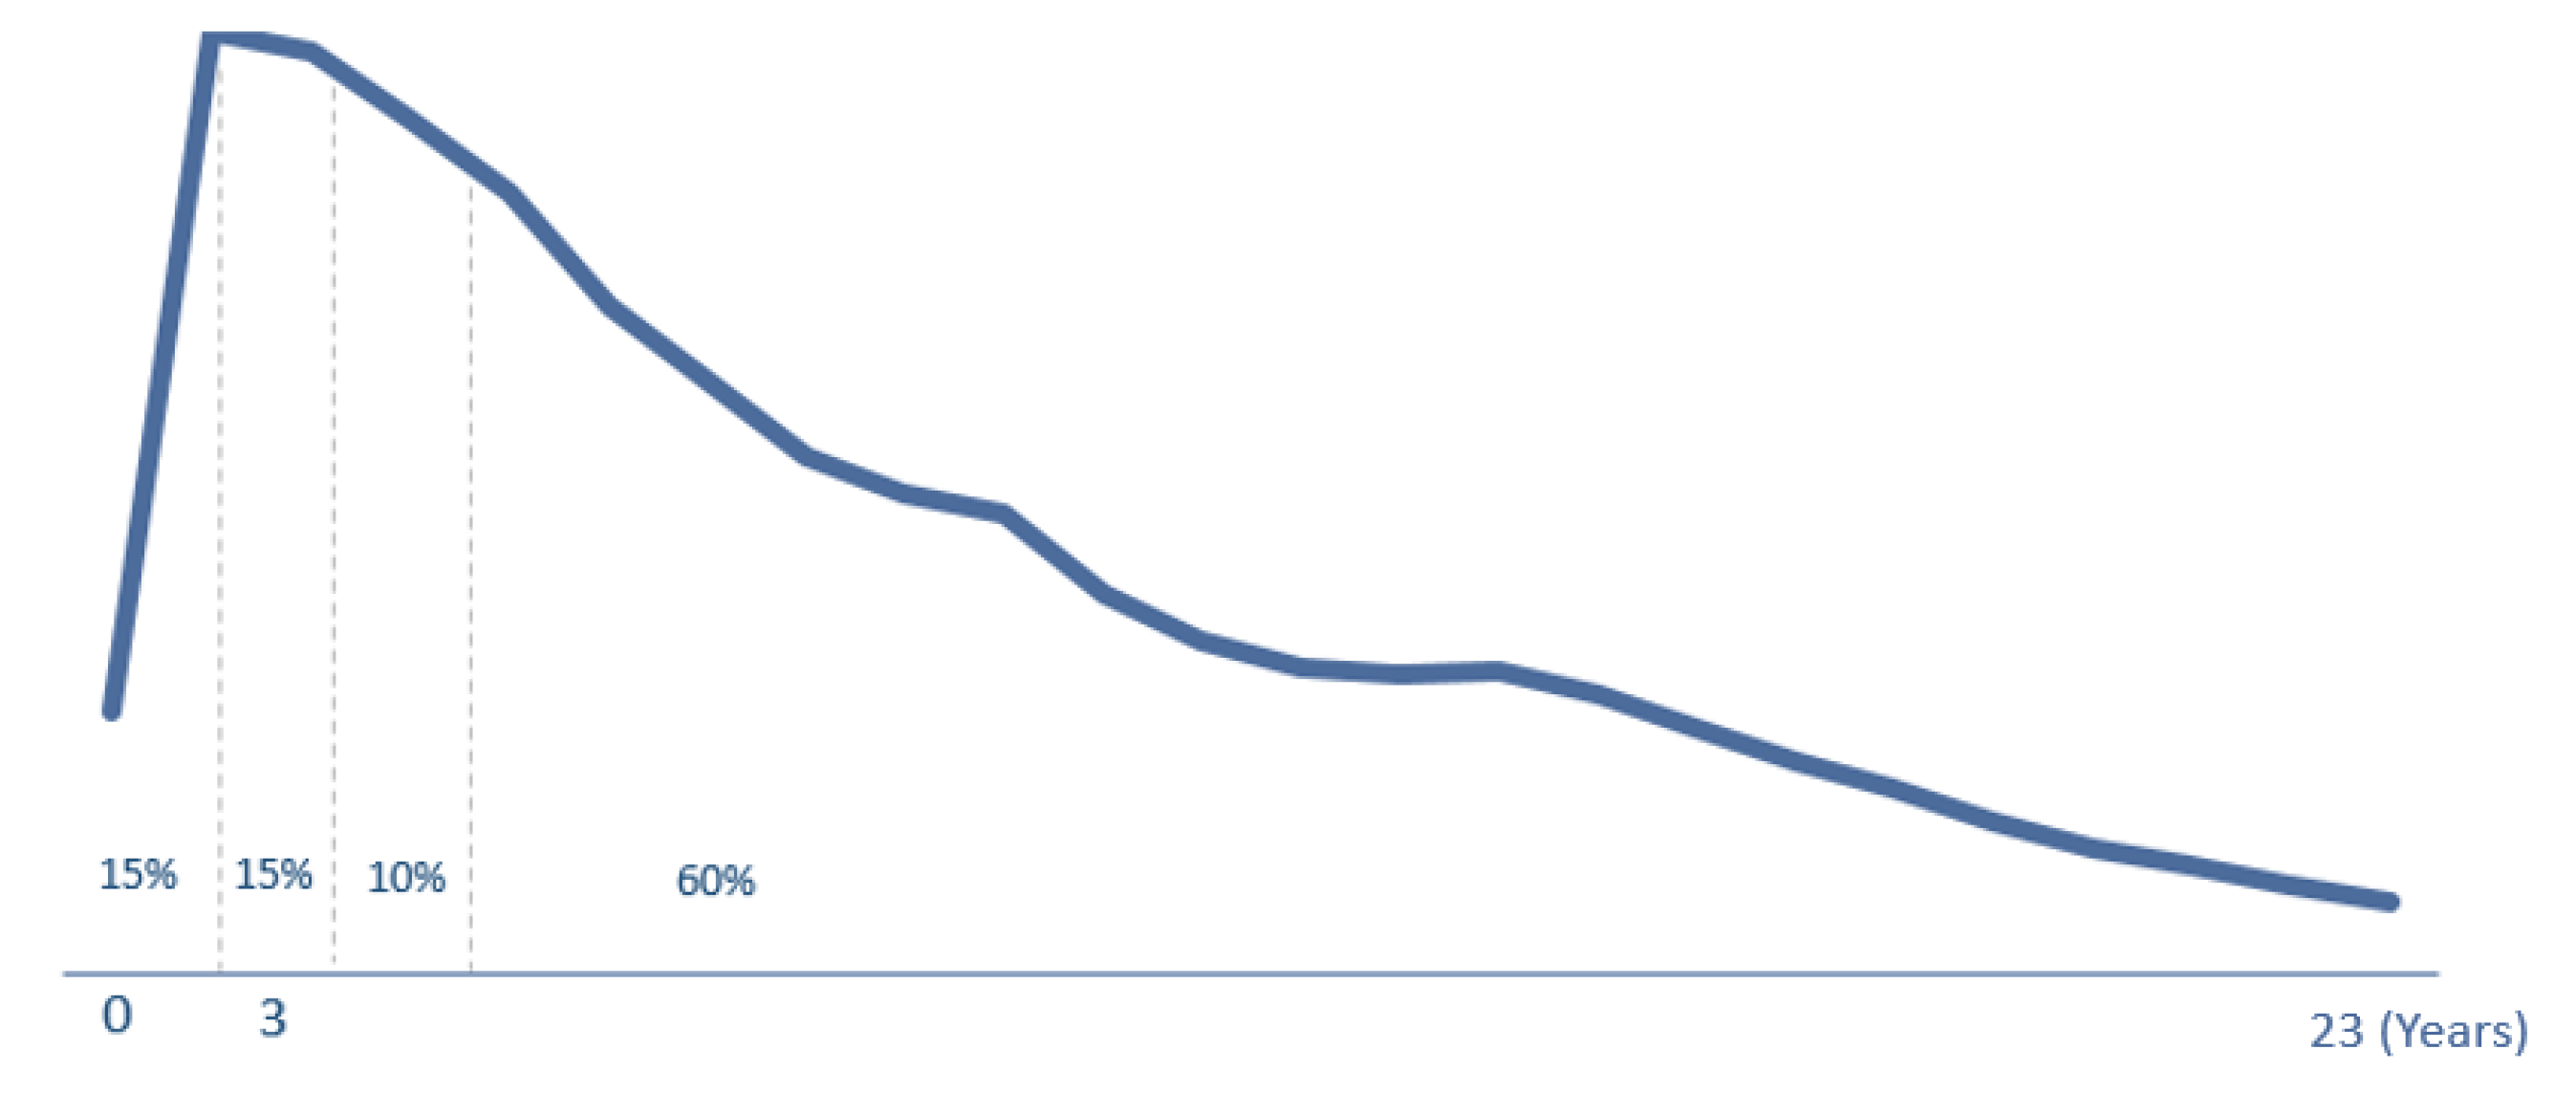
3.2.1. Modeling an Exemplary Offshore Project in Brazil

Several variables influence the economic performance of upstream projects, including the price of Brent (BFOE) crude oil, taxation (government take), capital investment (Capex), operating expenses (Opex), the opportunity cost of capital (reflected by the hurdle rate), and the volume of production. For this analysis, the simulated project is assumed to operate under Brazil’s regulatory concession regime. Brent prices, derived from various scenarios, are applied to evaluate their impact on key economic indicators. The cash flow model incorporates these variables and the project life cycle, which spans from the initial investment to production commencement and subsequent operational years, as detailed below.
  • Life Cycle: This simulation examines the project beginning at the development phase, excluding exploration, within a 27-year concession period [31,32]. Production is assumed to commence 5 years after the initial investment [32,33], with an economic cut-off occurring 23 years later [33]. Peak production is set at 150,000 barrels of oil per day (bpd), resulting in a cumulative production of 700 million barrels, based on the simulated production curve shown in Figure 1, where the peak output is achieved in the second year [33,34].
  • Government Take: The applicable taxes in Brazil include income tax (34%), social contribution on net profit (9%), land occupancy tax (1% of gross revenue), royalties (10% of gross revenue), and special participation (SP). SP, calculated based on production levels, ranges from 0% to 40% of net revenue [35]. For simplicity, a constant rate of 30% was applied, reflecting the project’s large scale and production range.
  • Hurdle Rate: Based on [36], the cost of capital for upstream projects in developing countries is 14.34% per annum. Adjusting for Brazil’s risk premium (5.19% per annum) results in a rate of 9.79% annually.
  • Opex: Operating expenses were set at US$ 6 per barrel, consistent with [37] for pre-salt projects.
  • Capex: An FPSO (floating production, storage, and offloading) unit with a 150,000-bpd capacity was assumed, with Capex set at US$ 4.75/boe. This value, calculated using Microsoft Excel’s solver tool, aligns the project’s breakeven price at US$ 30/bbl, making it US$ 5 more robust than the levels disclosed by [14,15] for long-term Brent resilience.

3.2.2. Oil Supply Curve by Production Cost

The supply curve is based on the work of Draeger et al. [18], which utilized the United States Geological Survey (USGS) database and COFFEE model analyses. Global crude oil resources were categorized by quality and production cost, resulting in the arrangement shown in Figure 2. Medium-quality oil costs were used as a baseline, with light oils assigned a 5% lower cost and heavy oils a 5% higher cost.
It is noteworthy that Draeger et al. [18] did not account for monopolistic behavior in the oil market, assuming that the crude supply follows the ascending order of the cost curve, contingent on the available refining assets.

3.2.3. Marginal Cost of Production in 2050

The annual oil demand projections for the IPCC scenarios C1 to C4 and the three IEA scenarios used before in this study were aggregated to determine the cumulative demand from 2023 to 2050. This demand was then matched against the supply cost database from [18] to calculate the marginal production cost of the last producer meeting the 2050 demand. For the IPCC scenarios, statistical metrics (mean, median, mode, and percentiles) were derived from the numerous sub-scenarios, as shown in Table 1. For the IEA scenarios, a single marginal production cost was determined for each one. These costs were considered equivalent to the Brent prices in 2050 across the scenarios.

3.2.4. Economic Analysis of the Project

The simulated upstream project underwent a robustness test by applying constant oil prices from the previous section across all years (2024–2050) in its cash flow. This yielded four net present value (NPV) series for the IPCC scenarios, with statistical metrics such as the mean, median, and probability of a positive NPV. As each IPCC scenario comprises dozens of sub-scenarios, the probability of a positive NPV was determined as the percentage of sub-scenarios yielding positive results relative to the total. In other words, the probability of a positive NPV is calculated, by using all the scenarios presented in the IPCC report and by the IEA, from a distribution probability of the crude oil demand. This distribution, when compared with the crude oil supply curve, resulted in a probabilistic distribution of crude prices (at the supply and demand equilibrium) that was the basis of the NPV analyses made.
For the IEA scenarios, three NPVs were directly computed. Additionally, a profitability indicator, return on investment (ROI), was calculated by dividing the NPV by the present value of Capex. For the IPCC scenarios, average NPVs were used to calculate the ROI. The project was also evaluated using interpolated price curves between 2024 and 2050. Assuming a gradual decline in oil prices over time, despite short- and medium-term fluctuations, a linear interpolation method was chosen to model this decline. Thus, the 2024 average oil price of US$ 81/bbl [38] was linearly interpolated with the 2050 average prices derived from the IPCC and the 2050 prices from the IEA scenarios. This analysis also produced the corresponding NPV and ROI values, providing a comprehensive evaluation of the project’s economic viability across various scenarios. It is also worth noting that the IAM models, such as those whose scenarios’ results were used by the IPCC, incorporate numerous uncertainties. Given these already existing uncertainties affecting oil price trajectories within these IAM scenarios, the linear interpolation was chosen as a simplified method for simulating the price evolution as a first approach, although it is recognizable that other methods could have been used, as the last section of this paper will indicate.

4. Results and Discussion

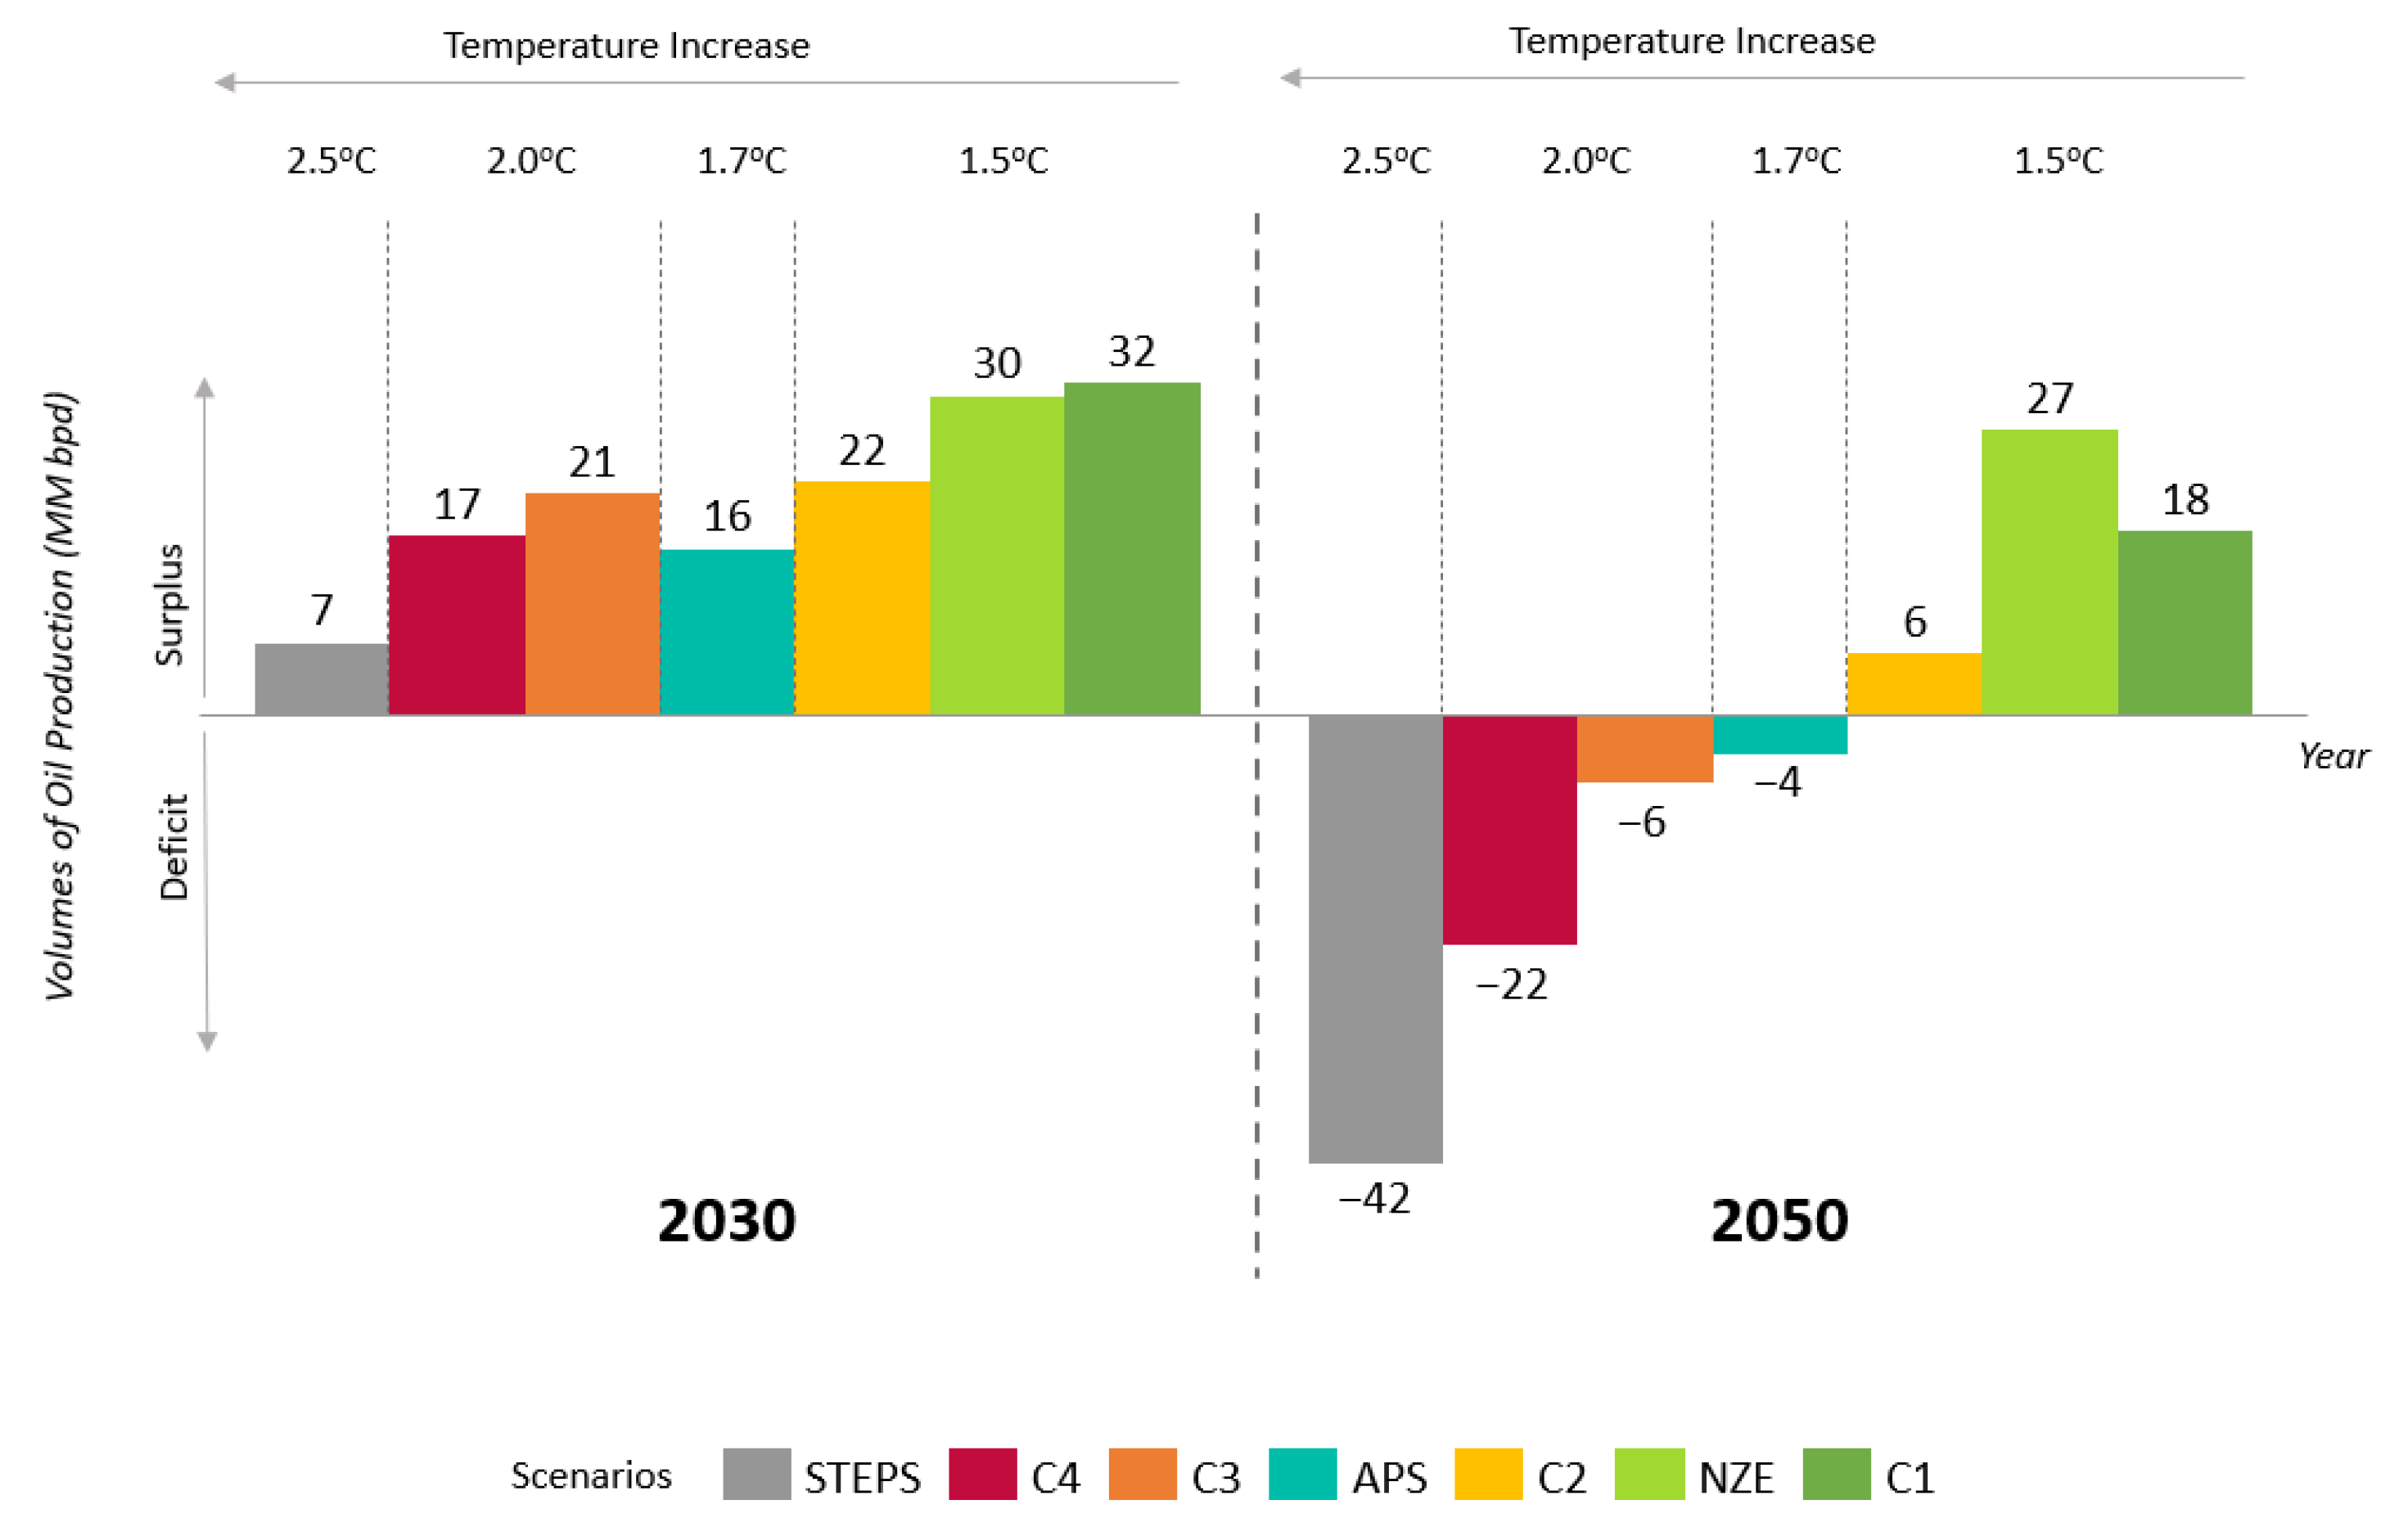
4.1. Implications of Climate Scenarios on Contracted Production

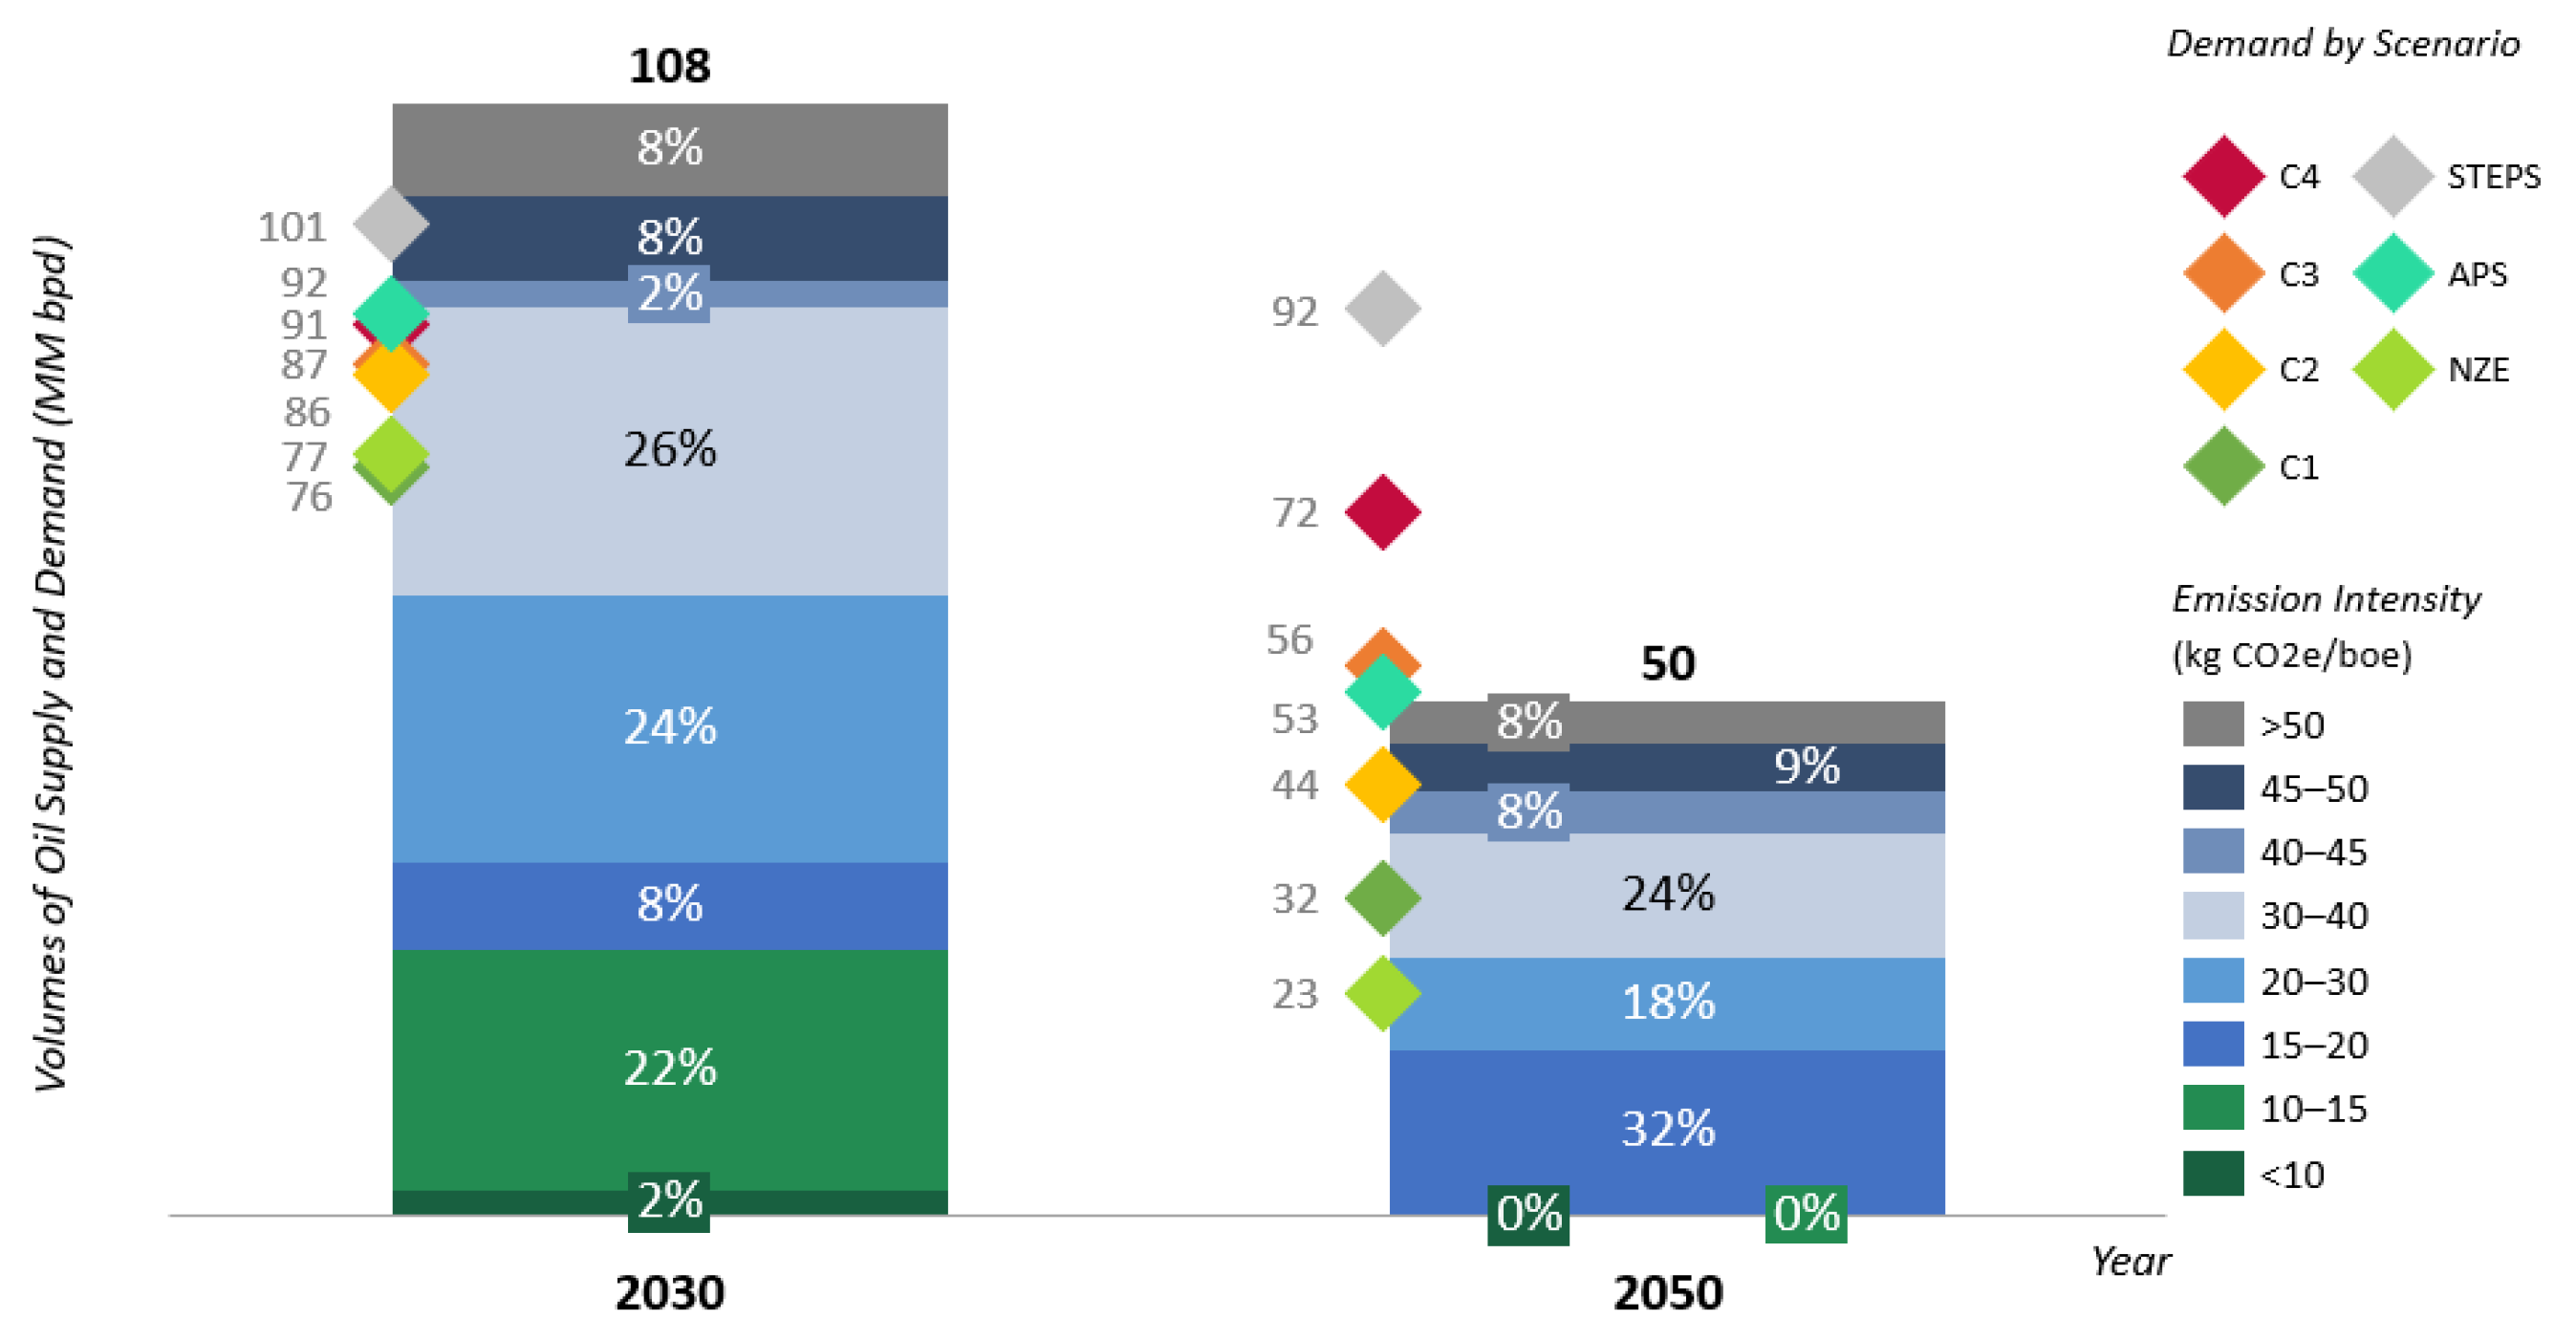
4.1.1. Supply Versus Demand Across Scenarios

As per the Ucube database, the potential oil supply is estimated at 107.7 million barrels per day (MM bpd) in 2030 and 49.8 MM bpd in 2050. Comparing these supply figures with the demand projections across various scenarios highlights potential oil surpluses or deficits during this period (see Figure 3).
The analysis indicates that if the scenarios associated with more stringent mitigation targets succeed, in 2030, an oil surplus may occur across all the scenarios, assuming all the licensed assets reach their production potential. However, by 2050, surpluses are only projected in scenarios limiting global temperature increases to 1.5 °C (C1, C2, and NZE). In contrast, scenarios with temperature increases between 1.7 °C and 2.5 °C (C3, C4, APS, and STEPS) indicate potential deficits. However, it is important to note that even in the C1, C2, and NZE scenarios, opportunities for exploring new frontiers may still exist. Newly discovered resources with more competitive characteristics could displace the existing contracted oils. Therefore, the subsequent sections evaluate contracted production in terms of quality, cost, and emission intensity, identifying volumes that are most vulnerable to stranding due to demand reductions in ambitious climate scenarios or displacement by more competitive discoveries in high-demand scenarios.

4.1.2. Oil Quality Analysis

Oil supply was categorized by API gravity using the Rystad classification criteria, ranging from condensate to heavy oil (see Figure 4), considering that heavier oils are typically sourer and less valuable. In contrast, lighter oils are sweeter and more valuable. However, certain medium oil streams may prove more competitive than some condensate streams, depending on the geographic location, sulfur content, and refining market characteristics.
In 2030, even under the highest-demand scenario (STEPS), the oil supply may exceed demand by approximately the total volume of heavy oil (~10 MM bpd). In lower-demand scenarios, the surplus could extend to medium oil volumes. By 2050, heavy oil faces a more significant risk of stranding in NZE, C1, and C2 scenarios. Furthermore, in scenarios like NZE, demand may align with the supply of condensate and light oil, potentially allowing some medium oil to fill the gap, depending on its quality and refining suitability.
Given the heightened stranding risk for heavy oil in 1.5 °C scenarios, its geographic distribution was analyzed. Figure 5 shows that North America holds the largest share, primarily due to Canada’s tar sands, followed by South America, especially Venezuelan extra-heavy crudes. In Asia, China is a major heavy oil producer, while the Middle East’s heavy oil supply grows between 2030 and 2050, driven mainly by Iran and, to a lesser extent, Saudi Arabia.

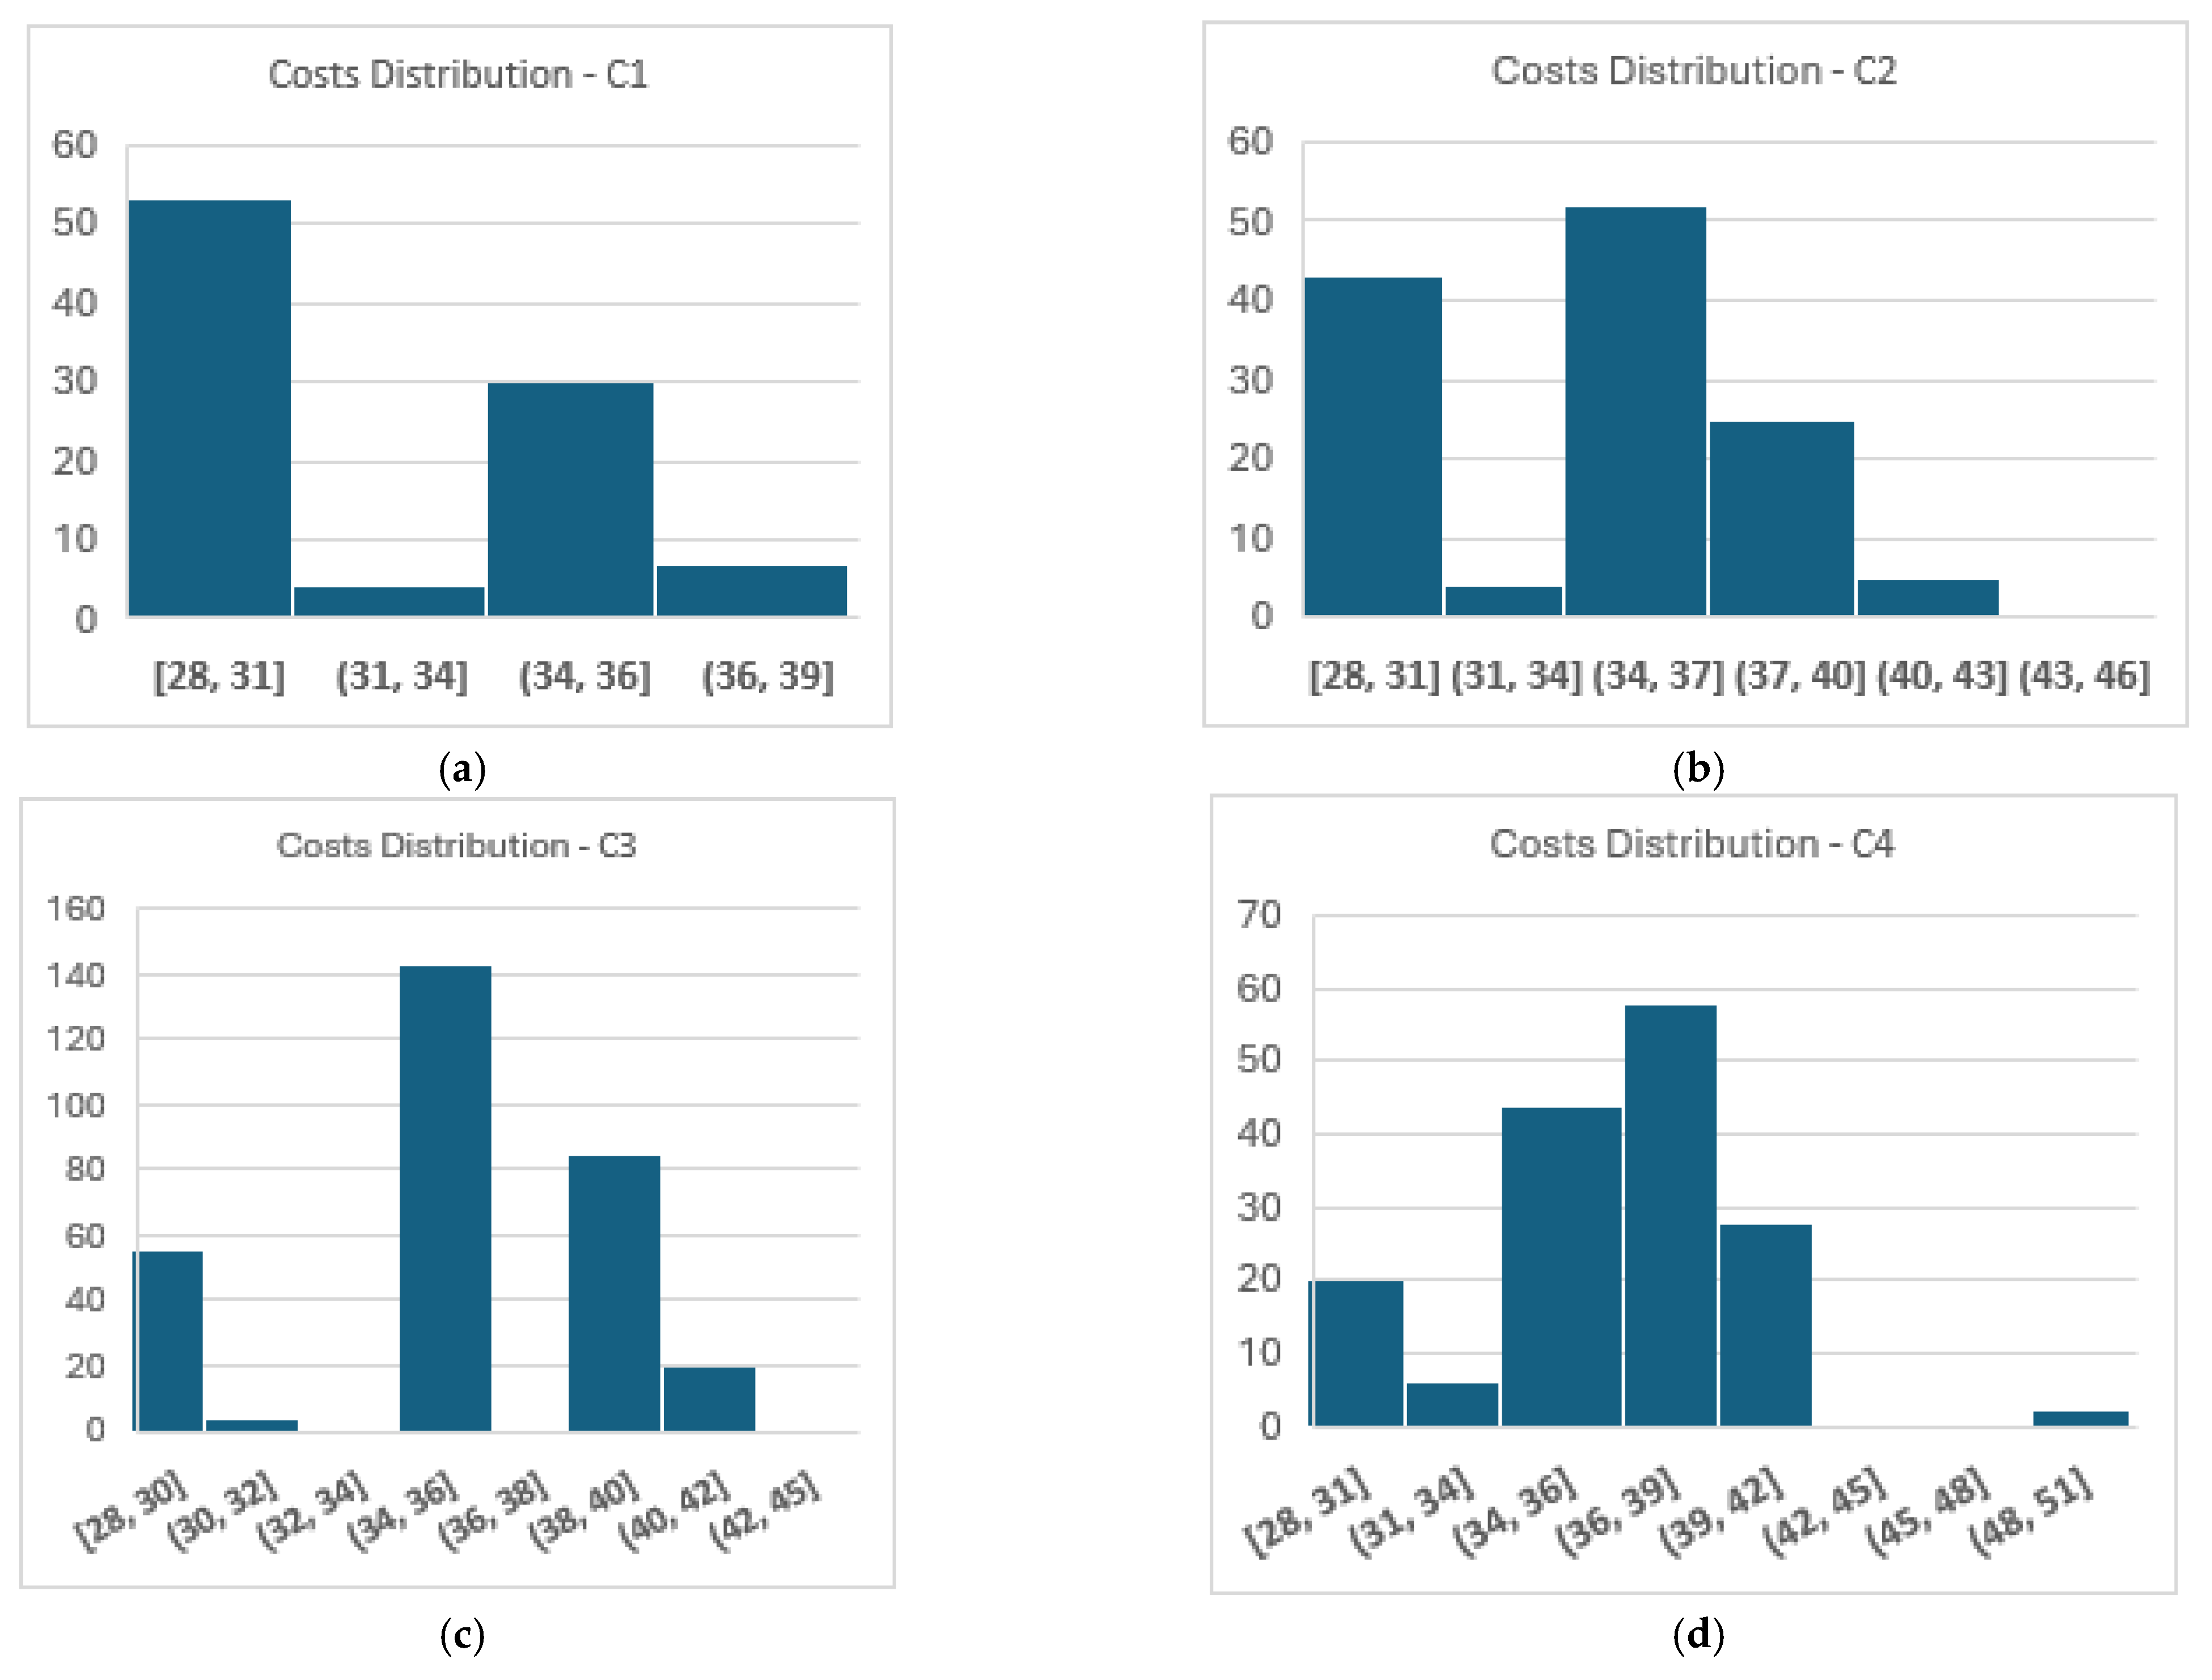
4.1.3. Analysis of Production Costs

Oil production costs in this analysis include capital expenditure (Capex), operational expenditure (Opex), and exploration Capex (Expex). Production was categorized into unit cost ranges, as shown in Figure 6.
As oil fields mature and production declines, lifting costs increase as fixed costs are spread over a reduced output. In 2030, a significant volume of oil can be produced at low costs (<US$ 15/bbl). By 2050, however, higher-cost production dominates, especially in the US$ 15–20/bbl and >US$ 40/bbl ranges. Cost competitiveness is critical for producers. In 2030, production costs above US$ 30/bbl may struggle even under high-demand scenarios (STEPS). In other scenarios, competition may intensify among producers in the US$ 25–30/bbl range, which constitutes the largest volume. By 2050, production exceeding US$ 40/bbl risks stranding in C2, while costs above US$ 20/bbl and US$ 15/bbl face risks in C1 and NZE, respectively. Production costs exceeding US$ 30/bbl account for approximately 13% (14 MM bpd) of the total in 2030 and 30% (14 MM bpd) in 2050. These volumes are primarily concentrated in South America, Asia, and North America (Figure 7). In 2030, South American high-cost production mainly originates in Brazil and Guyana. By 2050, Venezuela’s growing output will dominate the region’s share. In Asia, high-cost production occurs in China, while in North America, it shifts from Mexico in 2030 to all three regional countries by 2050, explaining the significant increase in the volume over time.

4.1.4. Analysis of Greenhouse Gas Emission Intensity

Upstream oil activities encompass scope 1 and 2 greenhouse gas (GHG) emissions. According to [40], approximately 15% of all energy-related GHG emissions originate from the operations of the O&G industry. Most of these emissions are attributed to power generation using fossil fuel-powered turbogenerators, natural gas flaring (the burning of gas during operations, whether as part of routine procedures or emergency measures), and methane leakage [13]. However, as the emission intensity indicator, measured in kg CO2e/boe, gains increasing prominence as a benchmark for industry competitiveness, upstream operators have undertaken initiatives such as eliminating leaks and non-emergency flaring, electrifying units, implementing CCUS (carbon capture, utilization, and storage) technologies, and setting targets to reduce the carbon intensity of their operations [40]. In this context, key international agreements have been established, including the Zero Routine Flaring by 2030, initiated by the World Bank [41], and the Global Methane Pledge [42], launched during the 26th Conference of the Parties (COP26) and endorsed by 155 countries. These agreements aim to reduce methane emissions significantly. Nonetheless, achieving the Net Zero Emissions (NZE) scenario requires upstream emissions to decrease by approximately 66% by 2030 relative to 2022 levels [43]. An analysis using Rystad data reveals that, by 2030, over half of the global oil production will exhibit GHG emission intensities exceeding 25 kg CO2e/boe, with some production reaching levels above 50 kg CO2e/boe. Figure 8 illustrates the production volumes for 2030 and 2050, stratified by GHG emission intensity. As seen, volumes exceeding demand in the Stated Policies Scenario (STEPS) in 2030 align closely with intensities above 45 kg CO2e/boe. Other scenarios indicate that volumes produced with intensities above 30–35 kg CO2e/boe will face significant risks, particularly under stricter public policy conditions and heightened societal expectations for reduced operational emissions in the oil industry.
Regarding emissions in 2050, under the 1.5 °C scenario (C2), production volumes exceeding 45 kg CO2e/boe may lose competitiveness compared with lower-intensity production. However, it is important to consider that industry initiatives could significantly alter the emissions profile by then. Figure 9 highlights the geographic distribution of production with intensities above 45 kg CO2e/boe in 2030 and 2050.
High-intensity production is concentrated in Iraq (Middle East), China (Asia), Libya and Algeria (Africa), and Venezuela and Colombia (South America). Among these countries, only China and Colombia have relatively low levels of gas flaring, but energy-intensive processes and fugitive methane emissions drive their emissions. The other countries exhibit high emissions across three categories: power generation, fugitive emissions, and flaring. Without measures to mitigate emissions, these nations may become among the least competitive in GHG emissions, while countries such as Norway and Saudi Arabia maintain lower emission profiles. Norway’s low emissions are attributed to stringent regulations and its “electric-power-from-shore” model, which supplies renewable energy from onshore sources to offshore units. Saudi Arabia benefits from the high productivity of its fields and minimal flaring rates [44]. Nevertheless, the IEA suggests that reducing emissions from existing operations can be up to ten times more cost-effective than initiating new projects in low-emission countries [40].

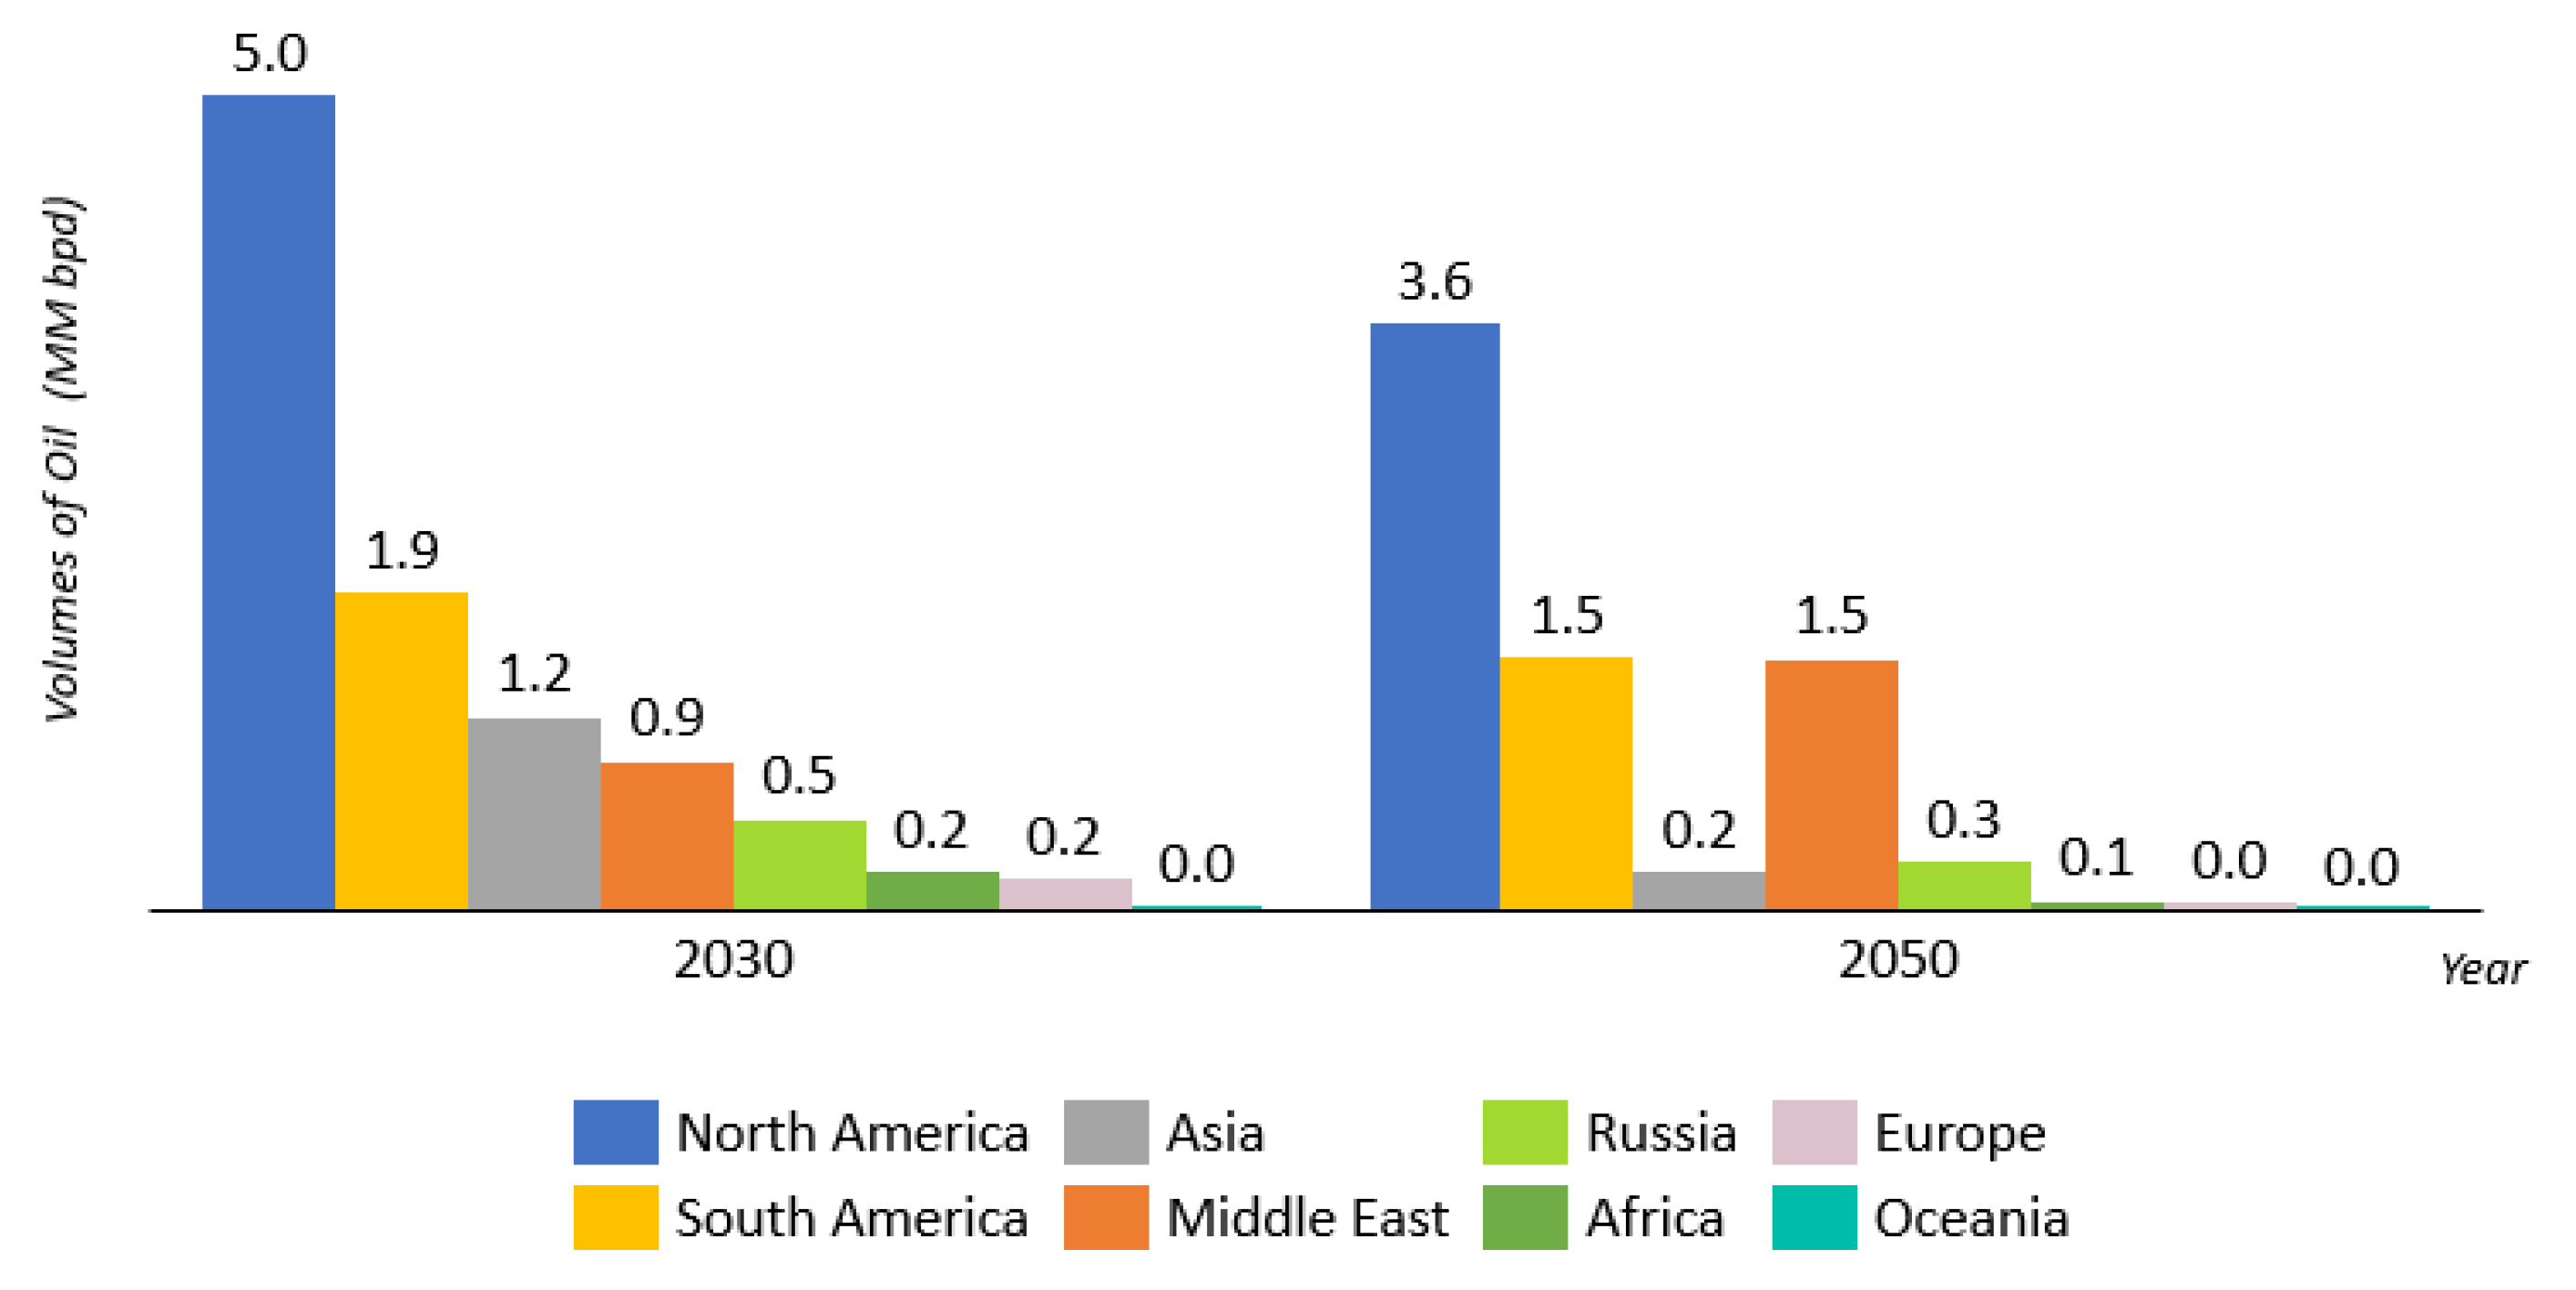
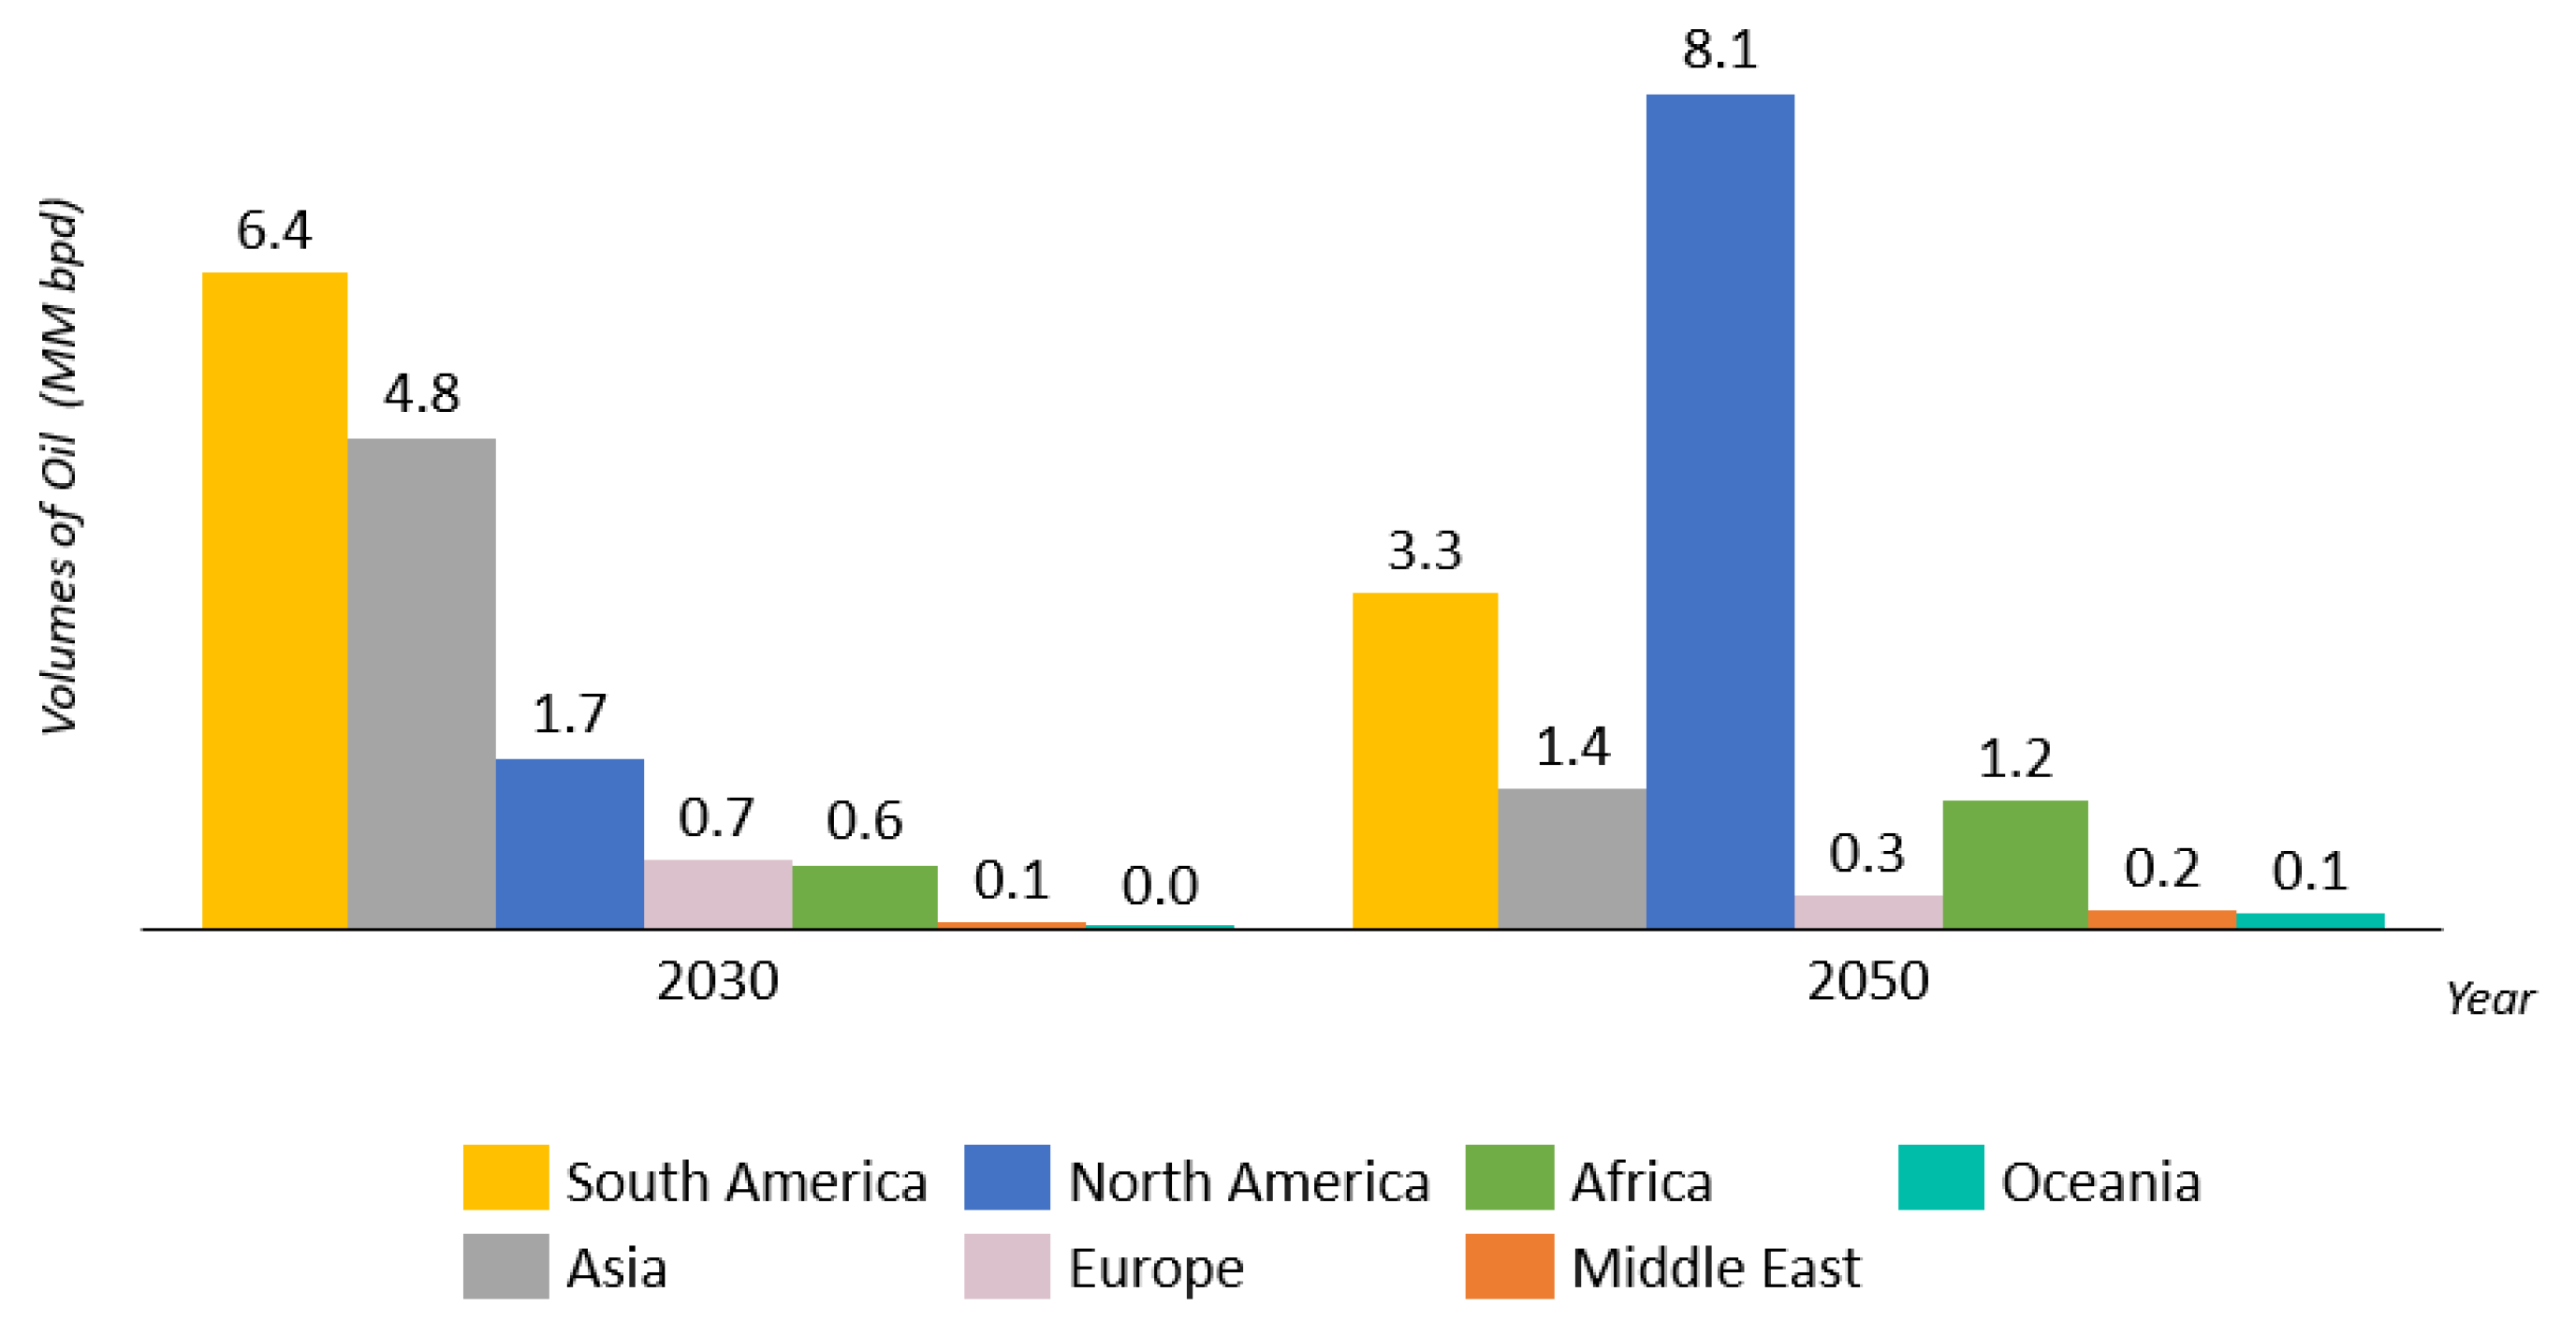
4.2. Implications of Climate Scenarios on the Feasibility of Developing an Exploratory Frontier

An exploratory frontier is developed through exploration and production projects that must demonstrate technical and economic viability under various scenarios. These scenarios involve a range of assumptions and projections for uncertainty variables.

4.2.1. Implications of Scenarios on the Trajectory of Oil Prices

In 2023, global liquid consumption was approximately 96.4 MM bpd [24]. Figure 10 compares the 2023 consumption levels with projections for 2050 under each scenario. For the IPCC data, median values for each scenario were used, while the IEA provides a single projection per scenario.
From these data, the cumulative global oil demand between 2023 and 2050 was calculated for each scenario, ranging from 606 to 1045 billion barrels (Table 3).
By comparing cumulative demand projections from IPCC scenarios with supply data by the marginal cost, a series of marginal cost distributions was derived for each scenario, shown in the histograms in Figure 11. The cost series return discrete values, often repeated or differing by hundredths of a unit, as the cumulative demand within certain ranges indicates identical costs, as shown in Figure 2. Scenario C1 is notable for having most of its cost series below $30/bbl, the breakeven value in the project under study.
Table 4 indicates that the average cost in 2050 in all the scenarios exceeds $30/bbl. However, in scenario C1, the mode and median values (which were identical) fell below this threshold.
The mode and median indicate that an upstream project with a breakeven of $30/bbl is not resilient in a world limited to 1.5 °C warming with low or no overshoot (scenario C1), despite the mean marginally indicating resilience. Given the probability distribution of prices within the IPCC scenarios, the next section provides a probabilistic assessment of the project’s economic viability under each scenario. For the three IEA scenarios, applying cumulative demands to supply data results in the following marginal costs: $44.16/bbl (STEPS), $34.51/bbl (APS), and $27.77/bbl (NZE). Thus, under the NZE scenario, the project would not meet the robustness criterion for economic viability.

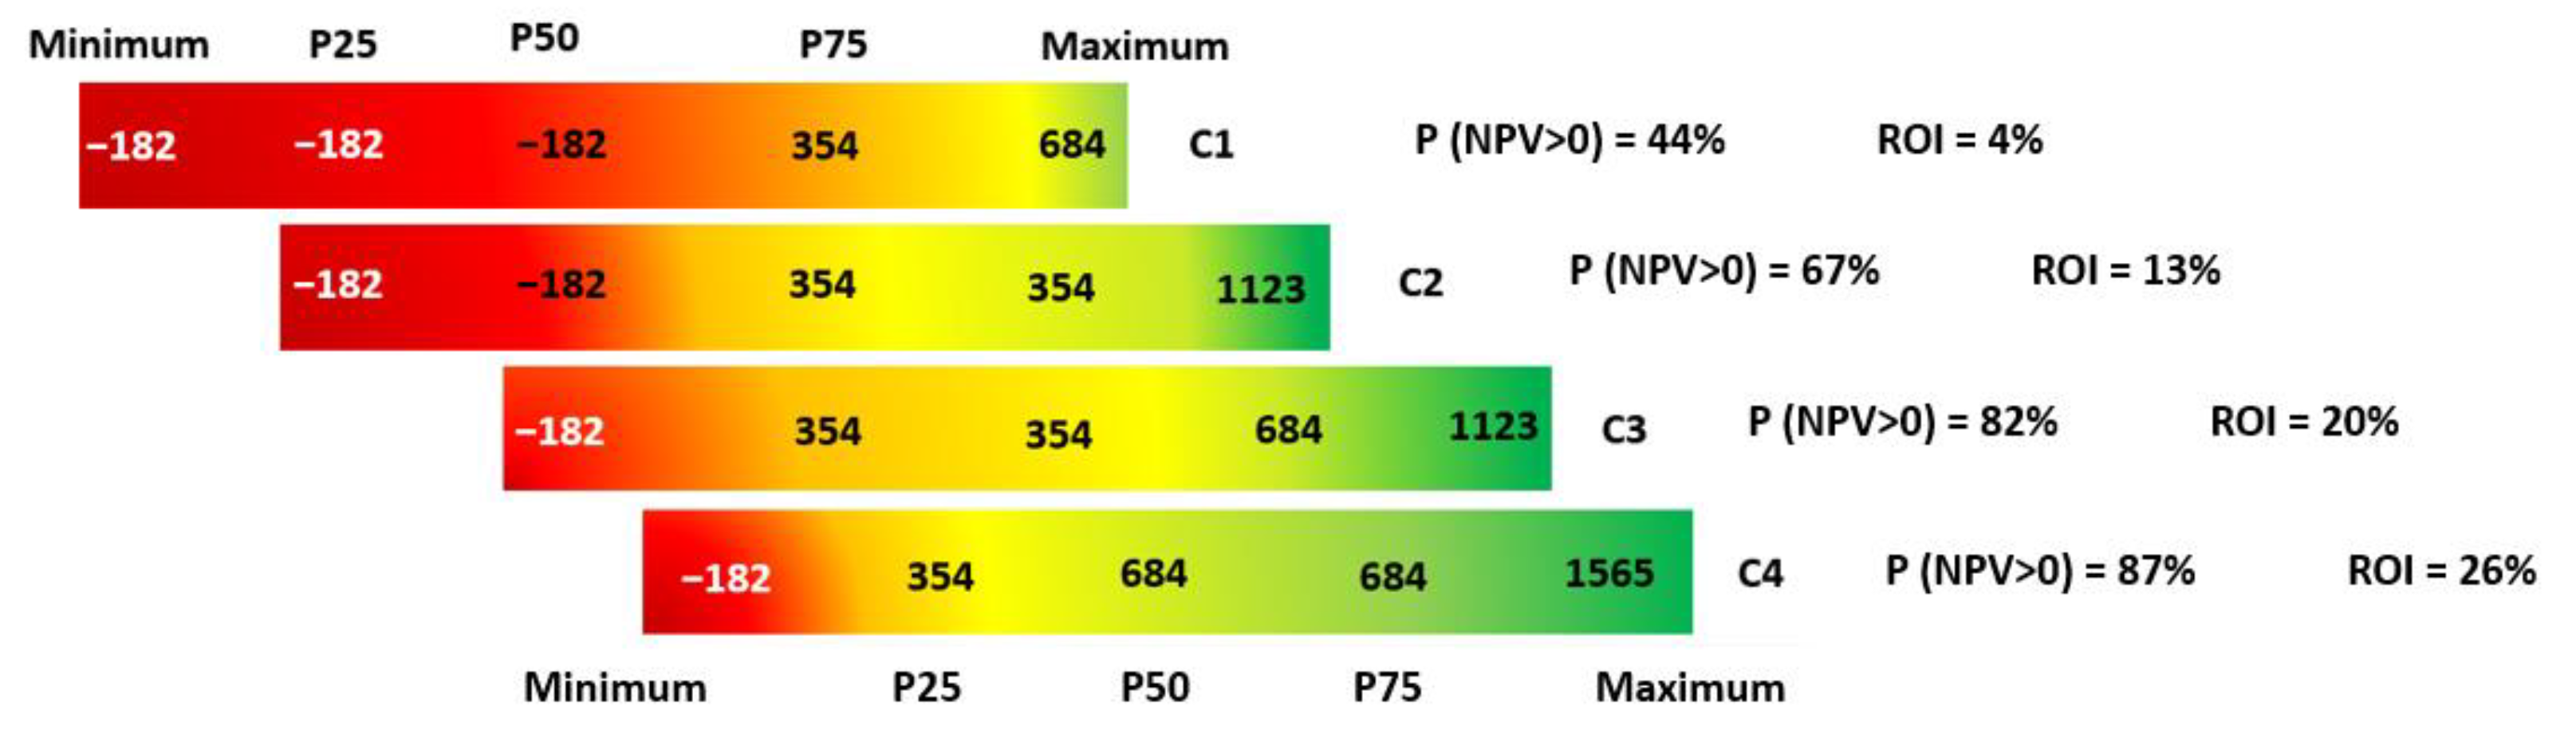
4.2.2. Implications on the Economic Results of the Upstream Project

To assess the impact of the scenarios’ price trajectories on project viability, analyses of NPV and ROI were conducted, along with the probabilities of achieving positive NPVs. The stress tests using IPCC scenario prices yielded varied NPV outcomes for the project, presented in percentile distribution (P25, P50, and P75) in Figure 12. Since the IPCC scenarios encompass numerous sub-scenarios, the probability of achieving a positive NPV was also evaluated for each range. Scenario C1 shows less than a 50% probability of a positive NPV, a negative median NPV, and an average ROI of 4%. Conversely, scenario C4 demonstrates an 87% probability of a positive NPV, with an average return of 26% on the invested capital.
Analyzing average NPVs, instead of medians, yielded positive values for all four scenarios, ranging from $70 million in C1 to $518 million in C4. Applying IEA scenarios resulted in NPVs of $1124 million (STEPS), $354 million (APS), and -$182 million (NZE). As anticipated, the project generates positive NPVs under STEPS and APS, with ROIs of 57% and 18%, respectively, but shows a negative ROI of −9.2% under NZE.
Thus, the unfavorable scenarios for the project include C1 and NZE, which restrict the global temperature increases to 1.5 °C with a low overshoot. While scenario C1 may still yield marginal returns, the project would not be approved under NZE based on the profitability criteria. However, the project demonstrates an increased potential for approval under the scenario limiting the temperature rise to 1.5 °C with a high overshoot (C2) and may yield highly favorable outcomes in a 2.4 °C scenario (STEPS).
However, it is important to note that the decision to invest in a new upstream project under these scenarios is not solely determined by profitability metrics but also by the company’s risk appetite and the composition of its asset and project portfolio, in line with the Modern Portfolio Theory [45]. This theory emphasizes optimizing returns relative to risk by diversifying investments across a portfolio. Additionally, investments on producing projects can be compared with a risk-free asset in an upstream portfolio composition [46], when compared with new projects and especially with exploration investments, since producing projects present an expressive lower variability in their return. In a risk-averse context, where scenarios C1 or C2 may not be acceptable, companies are likely to prioritize the development of their contracted volumes, focusing efforts on maximizing oil recovery from existing producing projects as soon as possible, while adopting a more conservative approach to approving new projects or acquiring new reserves. Nevertheless, the presence of already contracted reserves and eventual sunk investments within the company’s portfolio may incentivize proceeding with the investment, even in the face of potential losses or marginal profitability, as previously discussed.
Although stress tests under 1.5 °C scenarios with a low overshoot yield unfavorable results, long-term Brent price trajectories will possibly be smoother, even if there is significant volatility along the way. Considering this, the 2023 price ($83/bbl) was interpolated with the 2050 prices obtained in this study for each scenario (Figure 13). The 2050 prices range from $28/bbl to $44/bbl. Applying these trajectories to the project yields positive NPVs in all cases, with a minimum ROI of 101% under NZE and profitability nearing 120% in scenario C4.
At the current oil price levels, projects with breakeven points of $30/bbl or even $35–40/bbl allow for substantial producer surplus. For the project under consideration, a simulation of a linear decline in prices, starting from the current level, even reaching US$ 28/bbl by 2050, makes the project viable, given the gain obtained with the high margins in the short and medium term. Due to low operating costs, this exercise allows for sustained profitability without negative cash flow, even in the project’s later economic life under NZE conditions. Thus, from this short-term perspective, the oil company could justify investing today in a project with a $30/bbl breakeven, despite potential energy transition scenarios.

5. Conclusions

The transition from fossil fuels, particularly oil, prompts discussions about already-contracted oil production and the development of exploratory frontiers. This underscores the need to identify committed volumes and assess the feasibility of exploring new discovery frontiers. Regarding contracted production, by 2030, all analyzed scenarios, including STEPS, the scenario with the highest demand, indicate a risk of oversupply. If climate policies move towards more ambitious decarbonization pathways, the oil surplus could reach up to 32 MM bpd, potentially causing an industry slowdown, oil price declines, project shutdowns, and asset write-offs. By 2050, four out of seven scenarios, all consistent with global temperature increases exceeding 1.5 °C, may require reserve replenishment. Conversely, scenarios aiming to limit warming to 1.5 °C pose risks of stranded reserves, particularly in scenarios C1 and NZE, where unused oil volumes could range from 18 to 27 MM bpd relative to the potential supply.
However, even if the fully licensed volumes are produced to their maximum potential by 2050, it may still be possible to prevent global warming from exceeding 1.5 °C by 2100 under scenario C2. This scenario assumes that the demand closely aligns with the total potential supply volume but includes temperature overshoots. Such overshoots would require significant investments in atmospheric GHG removal technologies and risks of irreversible consequences for ecosystems, as highlighted by the [47]. Furthermore, opportunities for exploring new hydrocarbon frontiers might persist in scenarios where the potential supply exceeds the demand (C1, C2, and NZE). Licensed oil reserves are not necessarily optimal regarding quality, cost, and GHG emissions, although halting their production could risk compensation claims and litigation.
In a 1.5 °C scenario, new medium or light oil projects with capital and operational costs below US$30/bbl may displace existing heavy oil production with higher costs, particularly from regions like South America, Asia, and North America. Additionally, production parcels in the Middle East, Asia, and Africa with high GHG emission intensity could lose competitiveness to projects adhering to stricter energy specifications and better methane leak controls.
By 2050, most operational assets will likely have completed capital investments and surpassed their payback periods, allowing production to continue even with oil prices below US$30/bbl. This is supported by resilience tests on a deepwater exploratory project in Brazil, where probability indicators showed a risk of over 50% for negative NPV in scenario C1 but lower risks in scenarios C2, C3, and C4. For scenario C1, the project’s average ROI was an unattractive 4%. Under the NZE scenario, the project’s value and profitability indicators turned negative. Nonetheless, despite the results not being so favorable to the project with a robustness test in the 1.5 °C scenario, it is possible that, in the long-term, the Brent price trajectory will decline smoothly, even amidst short-term volatility. Simulations assuming a linear price decline from the current levels (~US$80/bbl) to US$28/bbl by 2050 indicate project viability in all the scenarios, driven by high margins in the short-to-medium term. From this perspective, an oil company could justify investing today in a project with a breakeven of US$30/bbl, irrespective of the potential energy transition scenarios.
However, it is crucial to acknowledge that the energy transition introduces additional risks for oil producers besides demand reductions and price volatility. This study simplifies these dynamics, for instance, by using linear interpolation for the oil price, while future research may explore alternative methods, such as Monte Carlo simulations. Further research may also assess the impact on the production costs and emission intensity of an upstream project from the adoption of mechanisms like carbon pricing, from the deployment of CCUS technology for GHG mitigation, or from artificial intelligence for efficiency gains, all themes that are gaining global traction. Furthermore, this study did not assess litigation (compensation claims) risks and focused on a deepwater exemplary case study. Other frontiers could have been assessed, along with different fiscal regimes for these areas (e.g., production sharing instead of concession).

Author Contributions

Conceptualization, S.P., P.R.R.R. and A.S.; methodology, S.P. and A.S.; formal analysis, S.P. and A.S.; investigation, S.P.; writing—original draft preparation, S.P.; writing—review and editing, S.P., A.S. and P.R.R.R.; visualization, S.P.; supervision, A.S. All authors have read and agreed to the published version of the manuscript.

Funding

Financial support has been provided by Khalifa University of Science and Technology through the RICH center (project RC2-2019-007).

Data Availability Statement

This study primarily relies on data from the IPCC, IEA and Rystad Energy. The data from the IPCC scenarios [22] are hosted by IIASA and can be accessed at https://data.ece.iiasa.ac.at/ar6/#/login?redirect=%2Fworkspaces (28 January 2025). Free datasets from IEA scenarios [23] are available at https://www.iea.org/data-and-statistics/data-product/world-energy-outlook-2024-free-dataset (29 January 2025). Data from Rystad Energy [39] are subject to access restrictions. These data were obtained through a scientific–academic partnership between Rystad Energy and the Cenergia Laboratory at COPPE/UFRJ.

Acknowledgments

We express our gratitude to Rystad Energy for their scientific and academic partnership with the Centre for Energy and Environmental Economics (CENERGIA/COPPE/UFRJ), which provided access to the Ucube database, an invaluable resource for this research. We are also thankful the support of CNPq in the earlier stages of this research.

Conflicts of Interest

The authors declare no conflicts of interest.

References

  1. Hubbert, M.K. Nuclear Energy and the Fossil Fuels; Shell Development Company, Exploration and Production Research Division: Houston, TX, USA, 1956. [Google Scholar]
  2. Campbell, C.J.; Laherrère, J.H. The End of Cheap Oil. Sci. Am. 1998, 278, 78–83. [Google Scholar] [CrossRef]
  3. Arps, J.J. Estimation of Primary Oil Reserves. Trans. AIME 1956, 207, 182–191. [Google Scholar]
  4. Al-Fattah, S.M. Non-OPEC conventional oil: Production decline, supply outlook and key implications. J. Pet. Sci. Eng. 2020, 189, 107049. [Google Scholar] [CrossRef]
  5. United Nations. COP28 Ends with Call to “Transitions Away” from Fossil Fuels; UN Chief Says Phaseout Is Inevitable. Available online: https://unsdg.un.org/latest/stories/cop28-ends-call-%E2%80%98transition-away%E2%80%99-fossil-fuels-un-chief-says-phaseout-inevitable (accessed on 24 June 2024).
  6. Davis, S.J.; Lewis, N.S.; Shaner, M.; Aggarwal, S.; Arent, D.; Azevedo, I.L.; Benson, S.M.; Bradley, T.; Brouwer, J.; Chiang, Y.-M.; et al. Net-zero emissions energy systems. Science 2018, 360, eaas9793. [Google Scholar] [CrossRef]
  7. IPCC. Summary for Policymakers. In Climate Change 2023: Synthesis Report. Contribution of Working Groups I, II and III to the Sixth Assessment Report of the Intergovernmental Panel on Climate Change; IPCC: Geneva, Switzerland, 2023. [Google Scholar]
  8. IEA. World Energy Outlook 2021; IEA: Paris, France, 2021. [Google Scholar]
  9. Green, F.; von Kursk, O.B.; Muttitt, G.; Pye, S. No new fossil fuel projects: The norm we need A social-moral norm against new fossil fuel projects has strong potential to contribute to achieving global climate goals. Science 2024, 384, 954–957. [Google Scholar] [CrossRef]
  10. Tienhaara, K.; Thrasher, R.; Simmons, B.A.; Gallagher, K.P. Investor-state disputes threaten the global green energy transition. Science 2022, 376, 701–703. [Google Scholar] [CrossRef]
  11. Welsby, D.; Price, J.; Pye, S.; Ekins, P. Unextractable fossil fuels in a 1.5 °C world. Nature 2021, 597, 230–234. [Google Scholar] [CrossRef]
  12. Sanchez, F.; Linde, L. Turning out the light: Criteria for determining the sequencing of countries phasing out oil extraction and the just transition implications. Clim. Policy 2023, 23, 1182–1196. [Google Scholar] [CrossRef]
  13. Coutinho, L.C.; Império, M.; Angelkorte, G.; da Silva, G.N.; Bergman-Fonte, C.; Draeger, R.; Cunha, B.S.L.; Rochedo, P.R.R.; Szklo, A.; Schaeffer, R. Climate strategies for oil and gas production under the lens of an Integrated Assessment Model: The case of Brazil. Int. J. Greenh. Gas Control 2024, 137, 104231. [Google Scholar] [CrossRef]
  14. Petrobras. Petrobras—Strategic Plan 2050 and Business Plan 2025–2029; Petrobras: Rio de Janeiro, Brazil, 2024. [Google Scholar]
  15. Equinor. Energy Transition Plan; Equinor: Stavanger, Norway, 2022. [Google Scholar]
  16. Exxon Mobil. Annual Report 2021; Exxon Mobil: Houston, TX, USA, 2022. [Google Scholar]
  17. McGlade, C.; Ekins, P. The geographical distribution of fossil fuels unused when limiting global warming to 2 °C. Nature 2015, 517, 187–190. [Google Scholar] [CrossRef]
  18. Draeger, R.; Cunha, B.S.L.; Müller-Casseres, E.; Rochedo, P.R.R.; Szklo, A.; Schaeffer, R. Stranded crude oil resources and just transition: Why do crude oil quality, climate ambitions and land-use emissions matter. Energy 2022, 255, 124451. [Google Scholar] [CrossRef]
  19. Naef, A. The impossible love of fossil fuel companies for carbon taxes. Ecol. Econ. 2024, 217, 108045. [Google Scholar] [CrossRef]
  20. Paletta, J.; Cunha, B.S.; Draeger, R.; Schaeffer, R.; Szklo, A. Stranded assets and compensation in oil and gas upstream projects: Conceptual and practical issues. Energy Clim. Change 2025, 6, 100178. [Google Scholar] [CrossRef]
  21. May, E.F.; Marsh, K.N.; Goodwin, A.R.H. Chapter 4—Frontier Oil and Gas: Deep-Water and the Arctic. In Future Energy, 2nd ed.; Letcher, T.M., Ed.; Elsevier: Boston, MA, USA, 2014; pp. 75–93. [Google Scholar]
  22. IPCC. Climate Change 2022—Mitigation of Climate Change; Cambridge University Press: Cambridge, UK, 2022. [Google Scholar]
  23. IEA. World Energy Outlook 2024; IEA: Paris, France, 2024. [Google Scholar]
  24. Energy Institute. Statistical Review of World Energy 2024; Energy Institute: Houston, TX, USA, 2024. [Google Scholar]
  25. Xu, T.; Tian, H.; Zhu, H.; Cai, J. China actively promotes CO2 capture, utilization and storage research to achieve carbon peak and carbon neutrality. Adv. Geo-Energy Res. 2022, 6, 1–3. [Google Scholar] [CrossRef]
  26. IEA. Carbon Capture, Utilisation and Storage; IEA: Paris, France, 2024. [Google Scholar]
  27. Wen, Z.; Wang, J.; Wang, Z.; He, Z.; Song, C.; Liu, X.; Zhang, N.; Ji, T. Analysis of the world deepwater oil and gas exploration situation. Pet. Explor. Dev. 2023, 50, 1060–1076. [Google Scholar] [CrossRef]
  28. Hallack, L.N.; Kaufmann, R.K.; Szklo, A. The effect of productivity and country risk on development in the Brazilian Pre-salt Province. Energy Sources Part B Econ. Plan. Policy 2019, 14, 80–97. [Google Scholar] [CrossRef]
  29. d’Almeida, K.S.; de Souza, M.F.F.; de Castro, N.O.; Vilela, P.C.; Leggieri, R.F.; Fernandes, R.F.; Cardoso, R.d.A. Exploratory Potential of the Brazilian Equatorial Margin. In Proceedings of the Paper presented at the Offshore Technology Conference Brasil, Rio de Janeiro, Brazil, 29–31 October 2019. [Google Scholar]
  30. Pindyck, R.; Rubinfeld, D. Microeconomy; São Paulo. 2007. Available online: https://novi.uciteljneznalica.org/PDF/arhiva%20autora/642_Pindyck,%20Robert,%20S,%20Rubinfeld,%20Daniel,%20L,%20Microeconomics%20(Prvi%20deo),%20Prentice-Hall,%202000.pdf (accessed on 28 January 2025).
  31. Palmeira Braga, L.; Bentes David, O. Why the unitization process is an important issue when dealing with the Brazilian Pre-salt Polygon. J. World Energy Law Bus. 2018, 11, 17–33. [Google Scholar] [CrossRef]
  32. Nogueira Hallack, L.; Salem Szklo, A.; Olímpio Pereira Júnior, A.; Schmidt, J. Curve-fitting variants to model Brazil’s crude oil offshore post-salt production. J. Pet. Sci. Eng. 2017, 159, 230–243. [Google Scholar] [CrossRef]
  33. ANP. Painéis Dinâmicos de Produção de Petróleo e Gás Natural; Agência Nacional do Petróleo, Gás Natural e Biocombustíveis: Rio de Janeiro, Brazil, 2024.
  34. Sällh, D.; Wachtmeister, H.; Tang, X.; Höök, M. Offshore oil: Investigating production parameters of fields of varying size, location and water depth. Fuel 2015, 139, 430–440. [Google Scholar] [CrossRef]
  35. ANP. Participações Governamentais. 2020. Available online: https://www.gov.br/anp/pt-br/canais_atendimento/imprensa/kits-de-imprensa-1/participacoes-governamentais (accessed on 8 January 2025).
  36. Damodaran, A. Damodaran on Line. Available online: https://pages.stern.nyu.edu/~adamodar/ (accessed on 8 January 2025).
  37. Petrobras. Deep Dive Petrobras 2024. Available online: https://www.investidorpetrobras.com.br/apresentacoes-relatorios-e-eventos/apresentacoes/ (accessed on 5 January 2025).
  38. EIA. U.S. Energy Information Administration. Short-Term Energy Outlook. Available online: https://www.eia.gov/outlooks/steo/ (accessed on 21 December 2024).
  39. Rystad Energy. Rystad Energy Cube Browser. Available online: https://www.rystadenergy.com/downloads (accessed on 21 December 2024).
  40. IEA. Emissions from Oil and Gas Operations in Net Zero Transitions; IEA: Paris, France, 2023. [Google Scholar]
  41. World Bank. Zero Routine Flaring by 2030 (ZRF) Initiative. Available online: https://www.worldbank.org/en/programs/zero-routine-flaring-by-2030/about#:~:text=Launched%20in%202015%2C%20the%20ZRF,by%2Dproduct%20of%20oil%20production (accessed on 5 January 2025).
  42. GMP. Global Methane Pledge. Available online: https://www.globalmethanepledge.org/ (accessed on 5 January 2025).
  43. IEA. The Oil and Gas Industry in Net Zero Transitions; IEA: Paris, France, 2023. [Google Scholar]
  44. Masnadi, M.S.; El-Houjeiri, H.M.; Schunack, D.; Li, Y.; Englander, J.G.; Badahdah, A.; Monfort, J.-C.; Anderson, J.E.; Wallington, T.J.; Bergerson, J.A.; et al. Global carbon intensity of crude oil production. Science 2018, 361, 851–853. [Google Scholar] [CrossRef]
  45. Markowitz, H.M. Portfolio Selection: Efficient Diversification of Investments; Yale University Press: New Haven, CT, USA, 2008. [Google Scholar]
  46. Mutavdzic, M.; Maybee, B. An extension of portfolio theory in selecting projects to construct a preferred portfolio of petroleum assets. J. Pet. Sci. Eng. 2015, 133, 518–528. [Google Scholar] [CrossRef]
  47. IPCC: Climate Change 2022: Impacts—Adaptation, and Vulnerability. Contribution of Working Group II to the Sixth Assessment Report of the Intergovernmental Panel on Climate Change. 2022. Available online: https://www.researchgate.net/publication/362431678_Climate_Change_2022_Impacts_Adaptation_and_Vulnerability_Working_Group_II_Contribution_to_the_Sixth_Assessment_Report_of_the_Intergovernmental_Panel_on_Climate_Change (accessed on 28 January 2025).
Figure 1. Simulated project production curve (in thousand bpd). Source: elaborated by the authors based on [33].
Resources 14 00054 g001
Figure 2. Oil supply and cost curve. Source: own elaboration based on [18].
Resources 14 00054 g002
Figure 3. Oil production surpluses and deficits relative to IEA and IPCC scenarios (MM bpd). Source: Elaborated by the authors based on data from [22,23,39].
Resources 14 00054 g003
Figure 4. Bars: Oil supply stratified by density; Rhombus: Demand by scenarios. Source: Elaborated by the authors based on data from [22,23,39].
Resources 14 00054 g004
Figure 5. Geographic distribution of heavy oil supply in 2030 and 2050. Source: Compiled by the authors based on data from [39].
Resources 14 00054 g005
Figure 6. Bars: Oil supply (MM bpd) stratified by unit extraction cost (US$/boe); Rhombus: Demand by scenario (MM bpd). Source: Compiled by the authors based on data from [22,23,39].
Resources 14 00054 g006
Figure 7. Oil supply with production costs above US$ 30/bbl in 2030 and 2050 (MM bpd). Source: Compiled by the authors based on data from [39].
Resources 14 00054 g007
Figure 8. Bars: Oil supply (MM bpd) stratified by GHG emission intensity (kg CO2e/boe); Rhombus: Demand by scenario (MM bpd). Source: Compiled by the authors based on data from [22,23,39].
Resources 14 00054 g008
Figure 9. Oil supply (MM bpd) with emissions intensity above 45 kg CO2e/boe in 2030 and 2050. Source: Compiled by the authors based on data from [39].
Resources 14 00054 g009
Figure 10. Oil demand in 2050 by scenario (in millions of bpd). Source: Compiled by the authors using data from [22,23,24].
Resources 14 00054 g010
Figure 11. Distribution of marginal costs by IPCC scenarios (in US$/bbl): (a) C1 scenario; (b) C2 scenario; (c) C3 scenario; (d) C4 scenario. Source: Compiled by the authors.
Resources 14 00054 g011
Figure 12. Variation in the project’s NPV by scenario (in Millions of US$), probability of positive NPV (%), and ROI (%). Negative NPV values are shown in the red-colored zone, marginally positive values in the yellow zone and positive values in the green zone. Source: Compiled by the authors.
Resources 14 00054 g012
Figure 13. (a) Interpolated prices (US$/bbl) and (b) project profitability results (%). Source: Compiled by the authors.
Resources 14 00054 g013
Table 1. IPCC climate scenarios with oil demand in 2030 and 2050 (MM bpd).
DescriptionWarming Level and ProbabilitiesNumber of ScenariosOil Demand in 2030 and 2050 (Median) (MM bpd)
C4: below 2 °C<2 °C peak warming with >50% chance15990.7–71.6
C3: likely below 2 °C<2 °C peak warming with >67% chance31186.7–56.1
C2: below 1.5 °C with high overshoot *<1.5 °C peak warming with <33% chance and <1.5 °C end of century with >50% chance13385.5–43.9
C1: below 1.5 °C with no or limited overshoot<1.5 °C peak warming with ≥33% chance and <1.5 °C end of century with >50% chance9776.2–32.3
Source: Compiled by the authors using data from [22]. * Note: The IPCC considers overshoot a temperature increase greater than 0.1 °C, usually above 1.5 °C, which can last for a decade or more.
Table 2. IEA climate scenarios with oil demand in 2030 and 2050 (MM bpd).
DescriptionWarming Level and ProbabilitiesOil Demand in 2030 and 2050
(MM bpd)
STEPS (Stated Policies Scenario)2.4 °C with 50% chance100.8–92.2
APS (Announced Pledges Scenario)1.7 °C with 50% chance91.9–53.4
NZE (Net Zero Emissions by 2050) *1.5 °C with ≥ 50% chance77.4–22.7
Source: Compiled by the authors using data from [23]. * Note: The IEA’s NZE scenario also predicts the possibility of temporary overshoots, i.e., temperatures exceeding 1.5 °C before returning to this level by the end of the century.
Table 3. Cumulative global oil demand between 2023 and 2050 (billion bbl).
ScenariosC1C2C3C4NZEAPSSTEPS
Cumulative Demand6237317759296068171045
Source: Compiled by the authors using data from [22,23].
Table 4. Marginal costs statistics by IPCC scenario (in US$/bbl).
Scheme 1.C1C2C3C4
Mean30.9033.334.9236.52
Mode and Median27.7734.5034.5038.64
Source: Compiled by the authors.
Disclaimer/Publisher’s Note: The statements, opinions and data contained in all publications are solely those of the individual author(s) and contributor(s) and not of MDPI and/or the editor(s). MDPI and/or the editor(s) disclaim responsibility for any injury to people or property resulting from any ideas, methods, instructions or products referred to in the content.

