Article

Development of a Quantitative Assessment Algorithm for Operational Risks in Mining Engineering

1
Department of Organization and Management, St. Petersburg Mining University of Empress Catherine II, 199106 St. Petersburg, Russia
2
Educational Centre for Digital Technologies, St. Petersburg Mining University of Empress Catherine II, 199106 St. Petersburg, Russia
3
Department of Economic Theory, St. Petersburg Mining University of Empress Catherine II, 199106 St. Petersburg, Russia
*
Author to whom correspondence should be addressed.
Resources 2025, 14(4), 53; https://doi.org/10.3390/resources14040053
Submission received: 31 January 2025 / Revised: 1 March 2025 / Accepted: 18 March 2025 / Published: 25 March 2025

Abstract

:
Whenever any type of ore deposit is developed, it comes with significant risks, such as uncertain reserves, harsh climate conditions, and other uncontrollable factors. To manage these risks effectively, companies need to quickly adapt to changing conditions. This paper presents a method for evaluating risks using a simulation model. The main objective is to identify factors of operational risk and determine the project parameters that have the greatest impact on the probability of a risk event. The method includes the classification of operational risks based on the way they arise; the creation of a risk decomposition matrix dividing risks by production tasks; and the construction of a mathematical model using the identified risk factors. The method was tested by developing a simulation model of an underground mine conveyor network in Anylogic (8.9.2) software. A simulation experiment showed that conveyor shutdowns could result in an 11.23% reduction in annual revenue. Based on the results, recommendations were made on how these risks can be reduced and on the need to implement a transport system to increase resilience.

1. Introduction

The operating conditions of mining enterprises are characterized by features that complicate the preparation of projects for the development of ore deposits [1,2], such as the uncertainty in reserves; the influence of the geological parameters of the ore body on the cost of production; harsh climate conditions; the need to take into account large infrastructure costs for organizing transport accessibility; and the construction of capital facilities at an early stage of project implementation [3,4,5]. For example, the inability to achieve high accuracy in the results of geological exploration work makes it difficult to plan the exact volumes of extracted minerals, which leads to uncertainty in the production parameters and, thus, the costs and income of the enterprise [6,7]. Therefore, when preparing decisions on the development of deposits, special attention is paid to the economic assessment of risks, which ultimately are factors in production efficiency [8,9]. The aggravation of the geopolitical situation dictates the need for everyone to use their own raw material resources to provide for the national economy [10,11].
The observed decrease in the content of the useful component in the ore leads to an increase in the volume of mined and processed rock mass, which increases the load on mining equipment and its accelerated wear, increases the likelihood of emergencies (equipment failure, downtime due to logistic jams, etc.), and, as a consequence, increases the cost of production [12,13]. In addition, the introduction of fundamentally new, alternative methods of ore transportation, such as railveyors, raises the issue of comparing the economic efficiency of these methods with more traditional options [14,15], and hence, the growing demand for design tools that allow for additional verification of different technical solutions [16,17].
The development and implementation of digital tools for modeling the future production process enables risk assessment at the design stage. Such tools include, in particular, the creation of a human–machine simulation system [18,19,20]. Many authors note that in the process of Industry 4.0 and the development of digital technologies, industry has become highly automated [21,22]. There are many research papers suggesting the application of digital technologies in the mining industry. However, only a few propose methodologies to combine existing traditional risk assessment practices with new tools for analyzing large data sets. This approach results in digital technologies not being integrated into production but being “stuck” on top of a well-established process. Over time, such solutions are recognized as unsuccessful and put aside [23]. At the same time, the main application of modern means of reducing production costs through automation is at the operational level [24,25]. Nevertheless, there is active growth in the use of specialized software for the virtual modeling of the production process, including those designed at the feasibility study stage [26,27]. This is due to the fact that the quality of the technological part of a project depends on the ability of the enterprise to adapt to the emergence of specific systemic risks in the mining industry [28,29]. Therefore, the purpose of this study was to improve the methodology for the quantitative assessment of operational risks through the use of dynamic methods at the stage of preparing a project for the development of solid mineral deposits.

2. Materials and Methods

This study was based on real underground mine development projects and an analysis of the scientific literature on reducing the uncertainty in mining projects through operational risk management. The results of the content analysis and the primary experiment are described in detail in previous papers by the author’s team. This work is a continuation of a study related to modern methods for improving the quality of project risk management using digital technologies [30]. During the course of this research, the classification of operational risks based on the way they arise was studied, and a risk decomposition matrix was developed by dividing risks by production tasks. The authors also formulated an algorithm for a mathematical model in economics (aimed at the optimization of project parameters) in order to reduce the likelihood of the most critical risks and adapt the enterprise to the occurrence of systemic mining-specific risks.
To illustrate the idea of project risk assessment, we considered a potash salt deposit with a chamber and pillar mining system to optimize its conveyor network. Work was carried out simultaneously in 8 faces, each with a heading-and-winning machine and a shuttle car. The ore is transferred from the shuttle car to the heading-and-measuring bin, from where it is evenly fed to the conveyor. The general scheme of the production process is shown in Figure 1.
Experts assessed that an emergency shutdown was possible due to the accidental accumulation of too much ore on a single conveyor part during transportation. This situation can occur at the point where the conveyors and load flows from different panels converge (highlighted in red in Figure 1). The expert method established that the most probable and critical risk for the project is the risk of jamming (emergency stop) at the junction of the panel and main conveyor. The description of expert methods is not considered in this paper; the mathematical justification of the qualitative and quantitative selection of a group of experts for risk assessment is described in detail in [31].
An economic assessment of the risk of a conveyor shutdown was carried out using the improvements in a well-known methodology proposed by the authors. These additions are based on the ISO 310000-2018 standard [32] but are adapted to the risk analysis of the operational process at the design stage. The additions to the methodology include the following steps, which will be described thoroughly in Section 3 “Results”:
  • Identification of additional operational risks: The authors developed a classification of operational risks by the form of their manifestation. The classification helps to identify critical areas where risks are most likely to occur.
  • Risk decomposition for determining model parameters: The authors developed a risk decomposition matrix by types of production tasks and the nature of the influence of parameters on the project goal. This matrix helps to identify potential risk factors and select project parameters that significantly affect the probability of risk events.
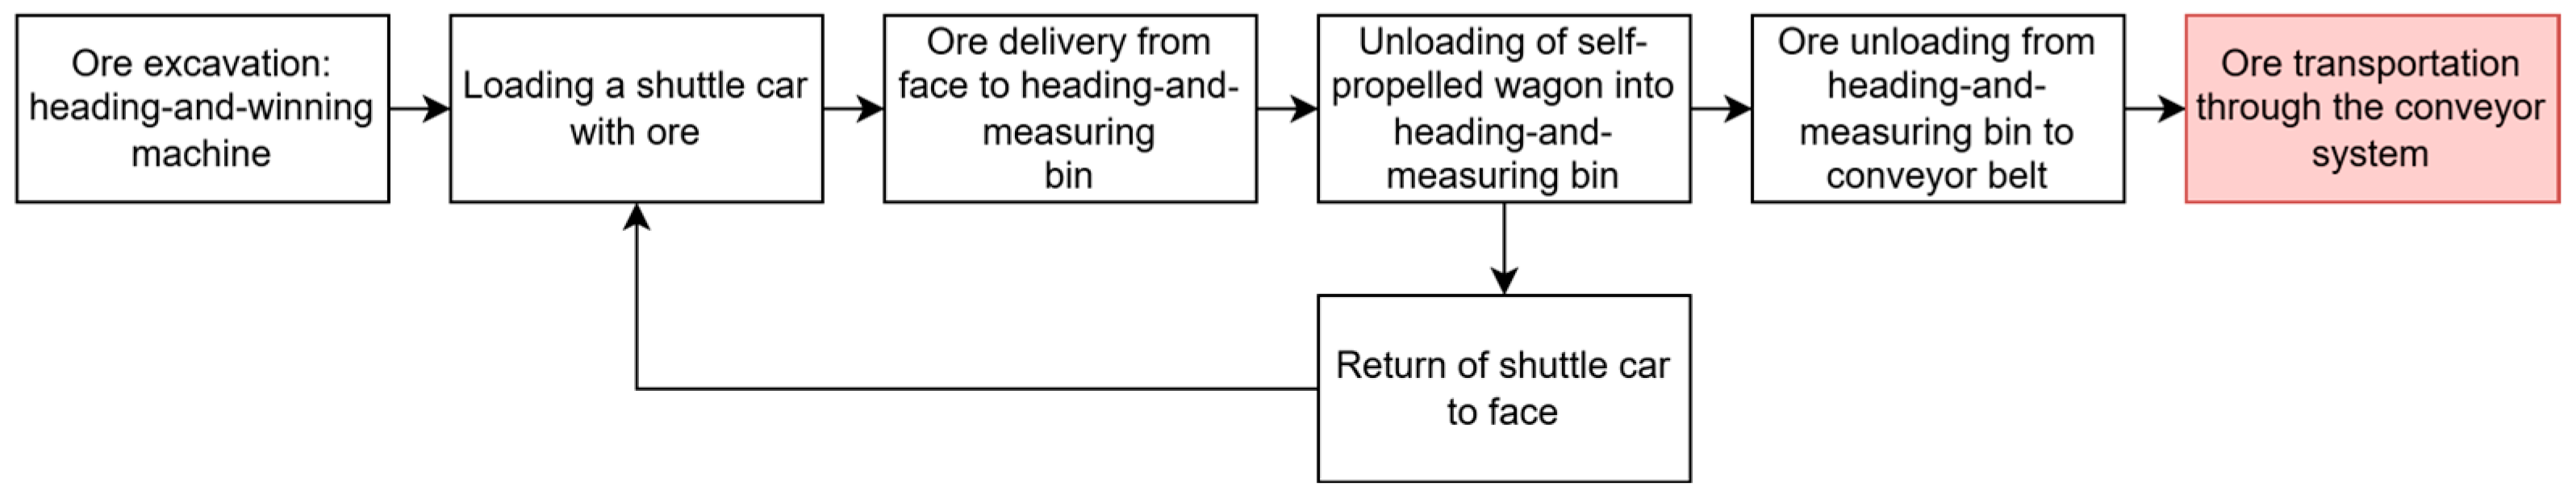
  • Building a mathematical model: using the parameters from the previous step, a functional model based on the IDEF0 notation was developed. This model was used to simulate and estimate probable damage from risk events, such as an emergency conveyor stop.
  • Verification of the model: The validation process included regression analysis with quality control of equations according to three criteria and comparison of model results with time data to ensure that the mathematical model produces the correct result.

3. Results

3.1. Identification of Additional Operational Risks

At the design stage, the main task is to determine and justify the parameters of the production process that would ensure its continuity and consistency [33,34,35]. A risk here is an event that, if it occurs, will result in long- and short-term delays in the course of work, i.e., a decrease in productivity and delays in the schedule.
Based on the results of studies devoted to analyzing mining project risks, presented in [36,37,38], the authors propose to additionally take into account the following types of risks, differentiated by the form of manifestation in the production process (Table 1).
As can be seen in Table 1, mining project risks are characterized by complexity. Parameters calculated in different parts of the design documentation may influence the occurrence of an event that results in a decrease in mine productivity. Errors or inaccuracies in calculations due to a lack of reliable information increase the likelihood of a risk. In other words, they can be accepted as risk factors.

3.2. Perform Risk Decomposition to Define Model Parameters

Model building starts with the selection of influencing parameters, which also act as risk factors. For this purpose, it is necessary to decompose the risk by types of production tasks. Risk decomposition consists of selecting the minimum acceptable set of parameters to be taken into account in the economic–mathematical model in order to achieve the modeling goal. To accomplish this, it is necessary to fill in the matrix of influencing parameters “type of production task—nature of influence on the production process”.
The development of this classification of production tasks is described in detail in the authors’ previous works. The authors formulated nine production tasks, ranked by degree of criticality for the project:
1. The cost of error elimination is large and is related to the main production: organization of excavation and cleaning works, organization of preparatory and capital works, and organization of engineering and technical support systems.
2. The costs of eliminating errors are significant and relate to auxiliary activities: production and environmental protection management, management of stacking and maintenance of excavated space, and management of capital construction facilities.
3. Inaccuracies at the design stage are acceptable; the costs of eliminating them are low: labor management, maintenance and repair, and logistics management.
Each production task consists of a set of parameters, the values of which are calculated during the preparation of design technical solutions. According to the nature of the influence of parameters on the project goal (achievement of the specified annual productivity), they can be attributed to one of the groups:
  • Quantitative parameters—reflect the number of units of mining equipment, the number of personnel involved in the process, the amount of equipment, etc.;
  • Physical property parameters—reflect the productivity of machinery, duration of operation, movement speed, mine working dimensions, total salary amounts of personnel, etc.;
  • Schedule parameters—reflect on the panel the plant operating mode, blasting schedule, safety of blasting chambers, etc.;
  • Location parameters—used to express the features of the mine geometry, the location of mine workings, the location of equipment parking areas, the location of capital construction facilities, and their impact on the features of the movement logistics within the mine.
In this study, the risk of a conveyor emergency stop is considered as an example. The analysis of this risk and its decomposition show that it fully relates to the production task “Organization of excavation and cleaning works”. The prepared table includes both a set of indicators that are considered in the model and their limitations (Table 2). To shorten this article, the authors did not include other production tasks in the table. If the risk being assessed is more complex than ours, its factors can be applied to more tasks. The greater the number of tasks related to the risk, the more abstract the model will be. The authors recommend applying parameters related to no more than three tasks. Otherwise, the risk identification and decomposition should be carried out again, and the number of parameters should be reduced.
In this case, as can be seen from the results in Table 2, all sources fall into one production task, which means that the model will have a low level of detail but high accuracy since there is no doubt about how the parameters are related to each other and how they affect the process. When expert assessments change, there is a need to assess related risks, such as the impact of the duration of the period between repairs on the number of units required. In general, the number of production tasks, the parameters of which are involved in building the model, is generally not regulated and remains at the discretion of experts, depending on the importance of the identified risk and the required degree of its correction.
In our case, it is important to calculate the following output data: cycle time, taking into account the increase in the rolling shoulder, cargo flow length in the form of time periods required to pass the bottleneck point, the number of collisions with five or more load flows, and conveyor network capacity.
Table 3 shows the adopted conventions for the selected parameters and output data.

3.3. Construction of the Mathematical Model

To simplify the perception of the technological process, let us first create a functional model of ore mining and transporting from a single face to the point where the conveyors merge (Figure 2).
At the end of the mining cycle, i.e., when the value of tsij is calculated, the value of the variable ji increases by one and the next iteration starts. The number of iterations that manage to start during the working shift (the final value of ∑ji) multiplied by x4 (ore mass per one cycle) corresponds to shift mining productivity. It is worth noting that each subsequent cycle lasts longer than the previous one due to the increase in the rolling shoulder.
The numbering of load flows is continuous within each face. That is, for example, the 15th cycle of heading-and-winning machine operation within the third face will be reflected in the calculations as index 3_15 (face number_load flow number).
Let us describe the content of the functions presented in Figure 2:
  • Calculation of the rollback distance:
dij(x1i, ji) = x1i ∗ ji
2.
Calculation of the extraction cycle duration, i.e., determination of the time of ore entering the hopper. Let us assume that the movement of the cargo flow along the conveyor after the ore enters the hopper is instantaneous:
fi(dij, …, x3ij) = dijx2ij + x3ij + (t0ji)
3.
Calculation of the end time of unloading the cargo flow onto the conveyor belt:
g i   t i j s ,   x 5 i j = x 4 i j x 5 i j + t i j s
4.
Calculation of the time taken to transport the cargo flow to the point of conveyor interconnection:
u i j s   t i j s ,   x 7 i j = t i j s + x 6 i x 7
u i j e   t i j e ,   x 7 i j = t i j e + x 6 i x 7
The “j” number of ranges is obtained as a result of the calculation, each showing in what period of time (during the working shift) the cargo flow will pass the conveyor merging point.
Now, let us replicate the obtained model for eight faces and write down an obtained time series reflecting the number of cargo flows in the “bottleneck” per unit time of the working shift (Figure 3).
Let us describe the content of the functions presented in Figure 3:
5.
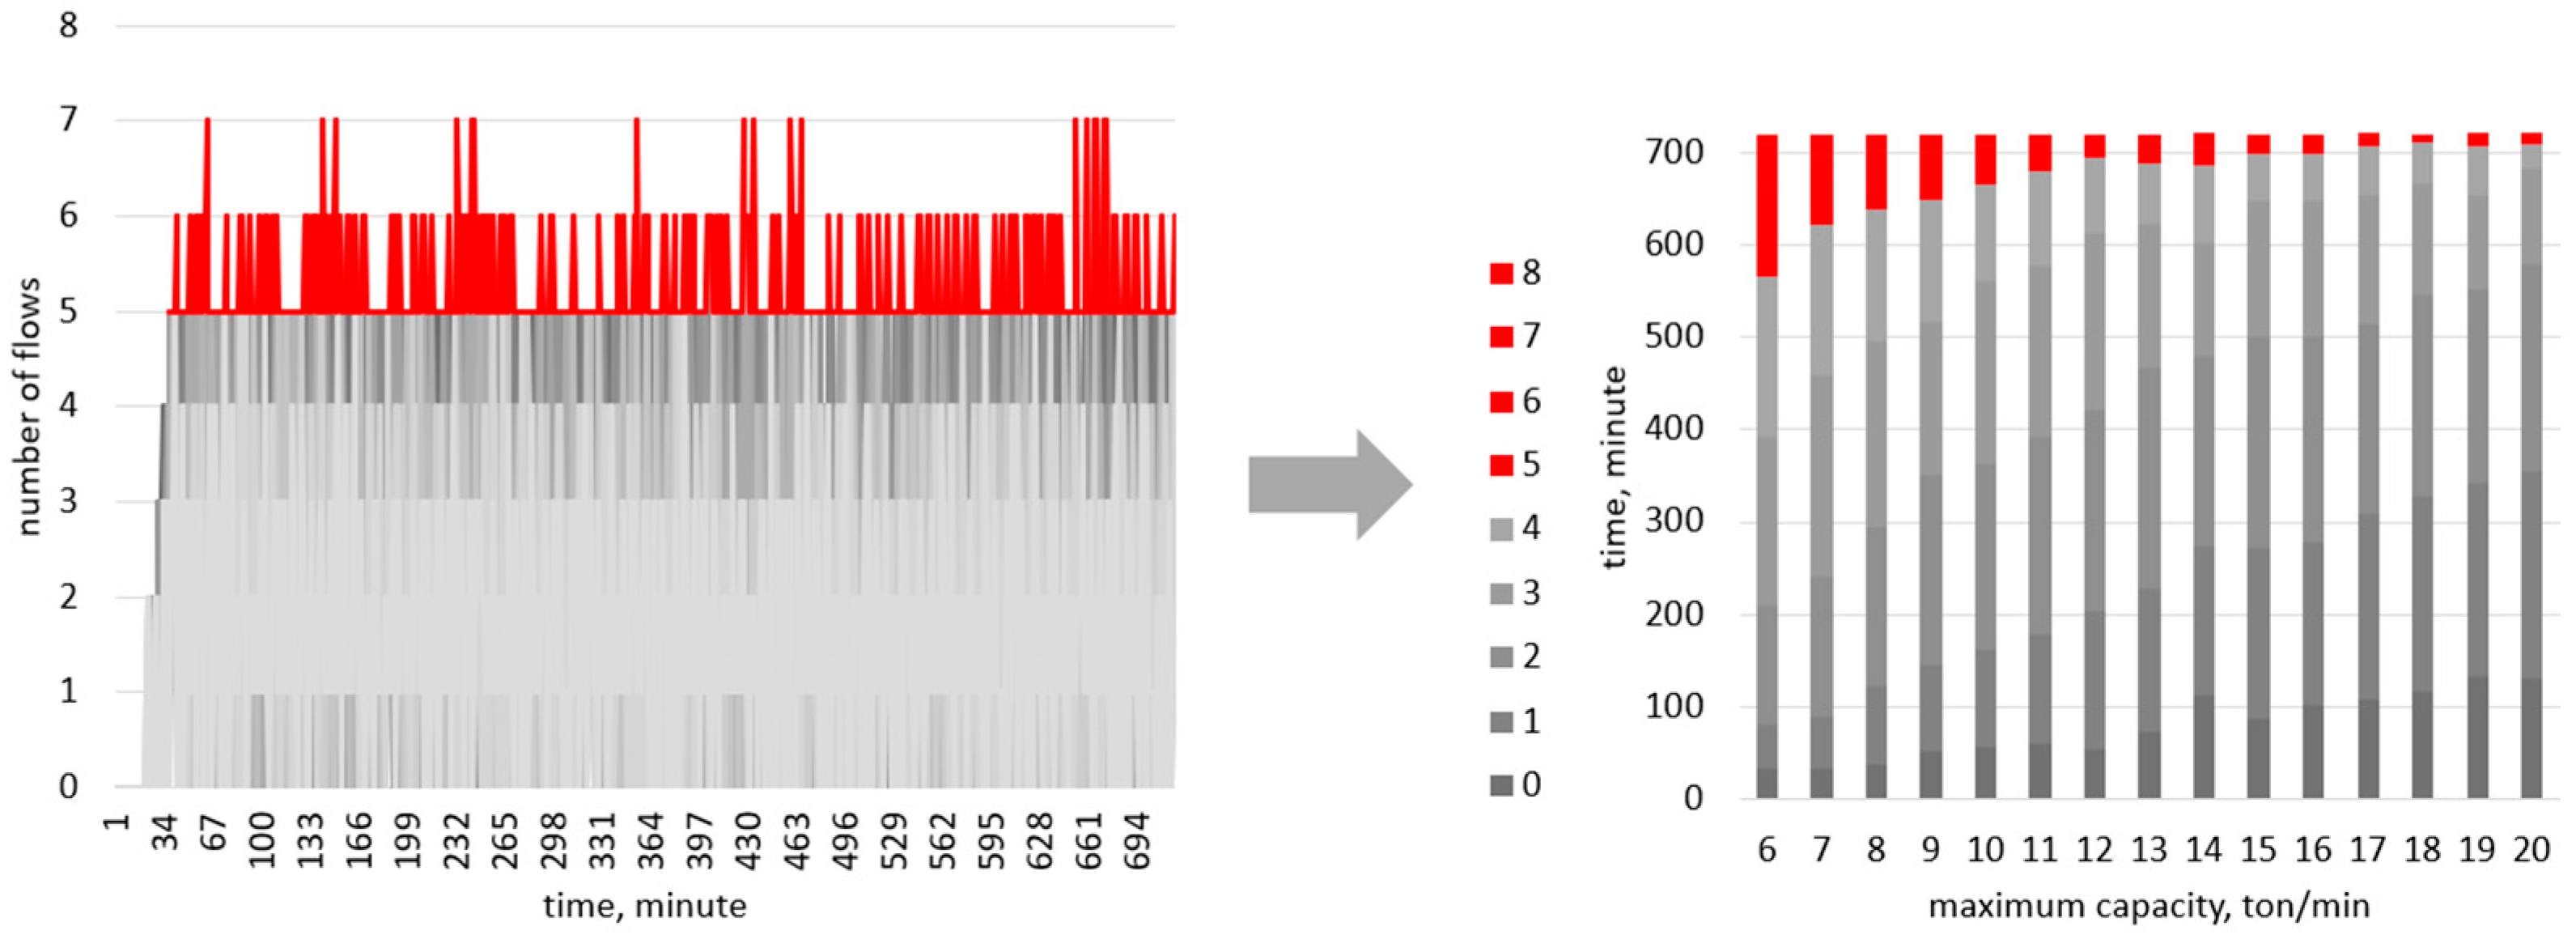
Obtaining a time series N(t): the amount of cargo flows at the bottleneck is recorded once a minute:
N(t) = n1, n2, …, nt
6.
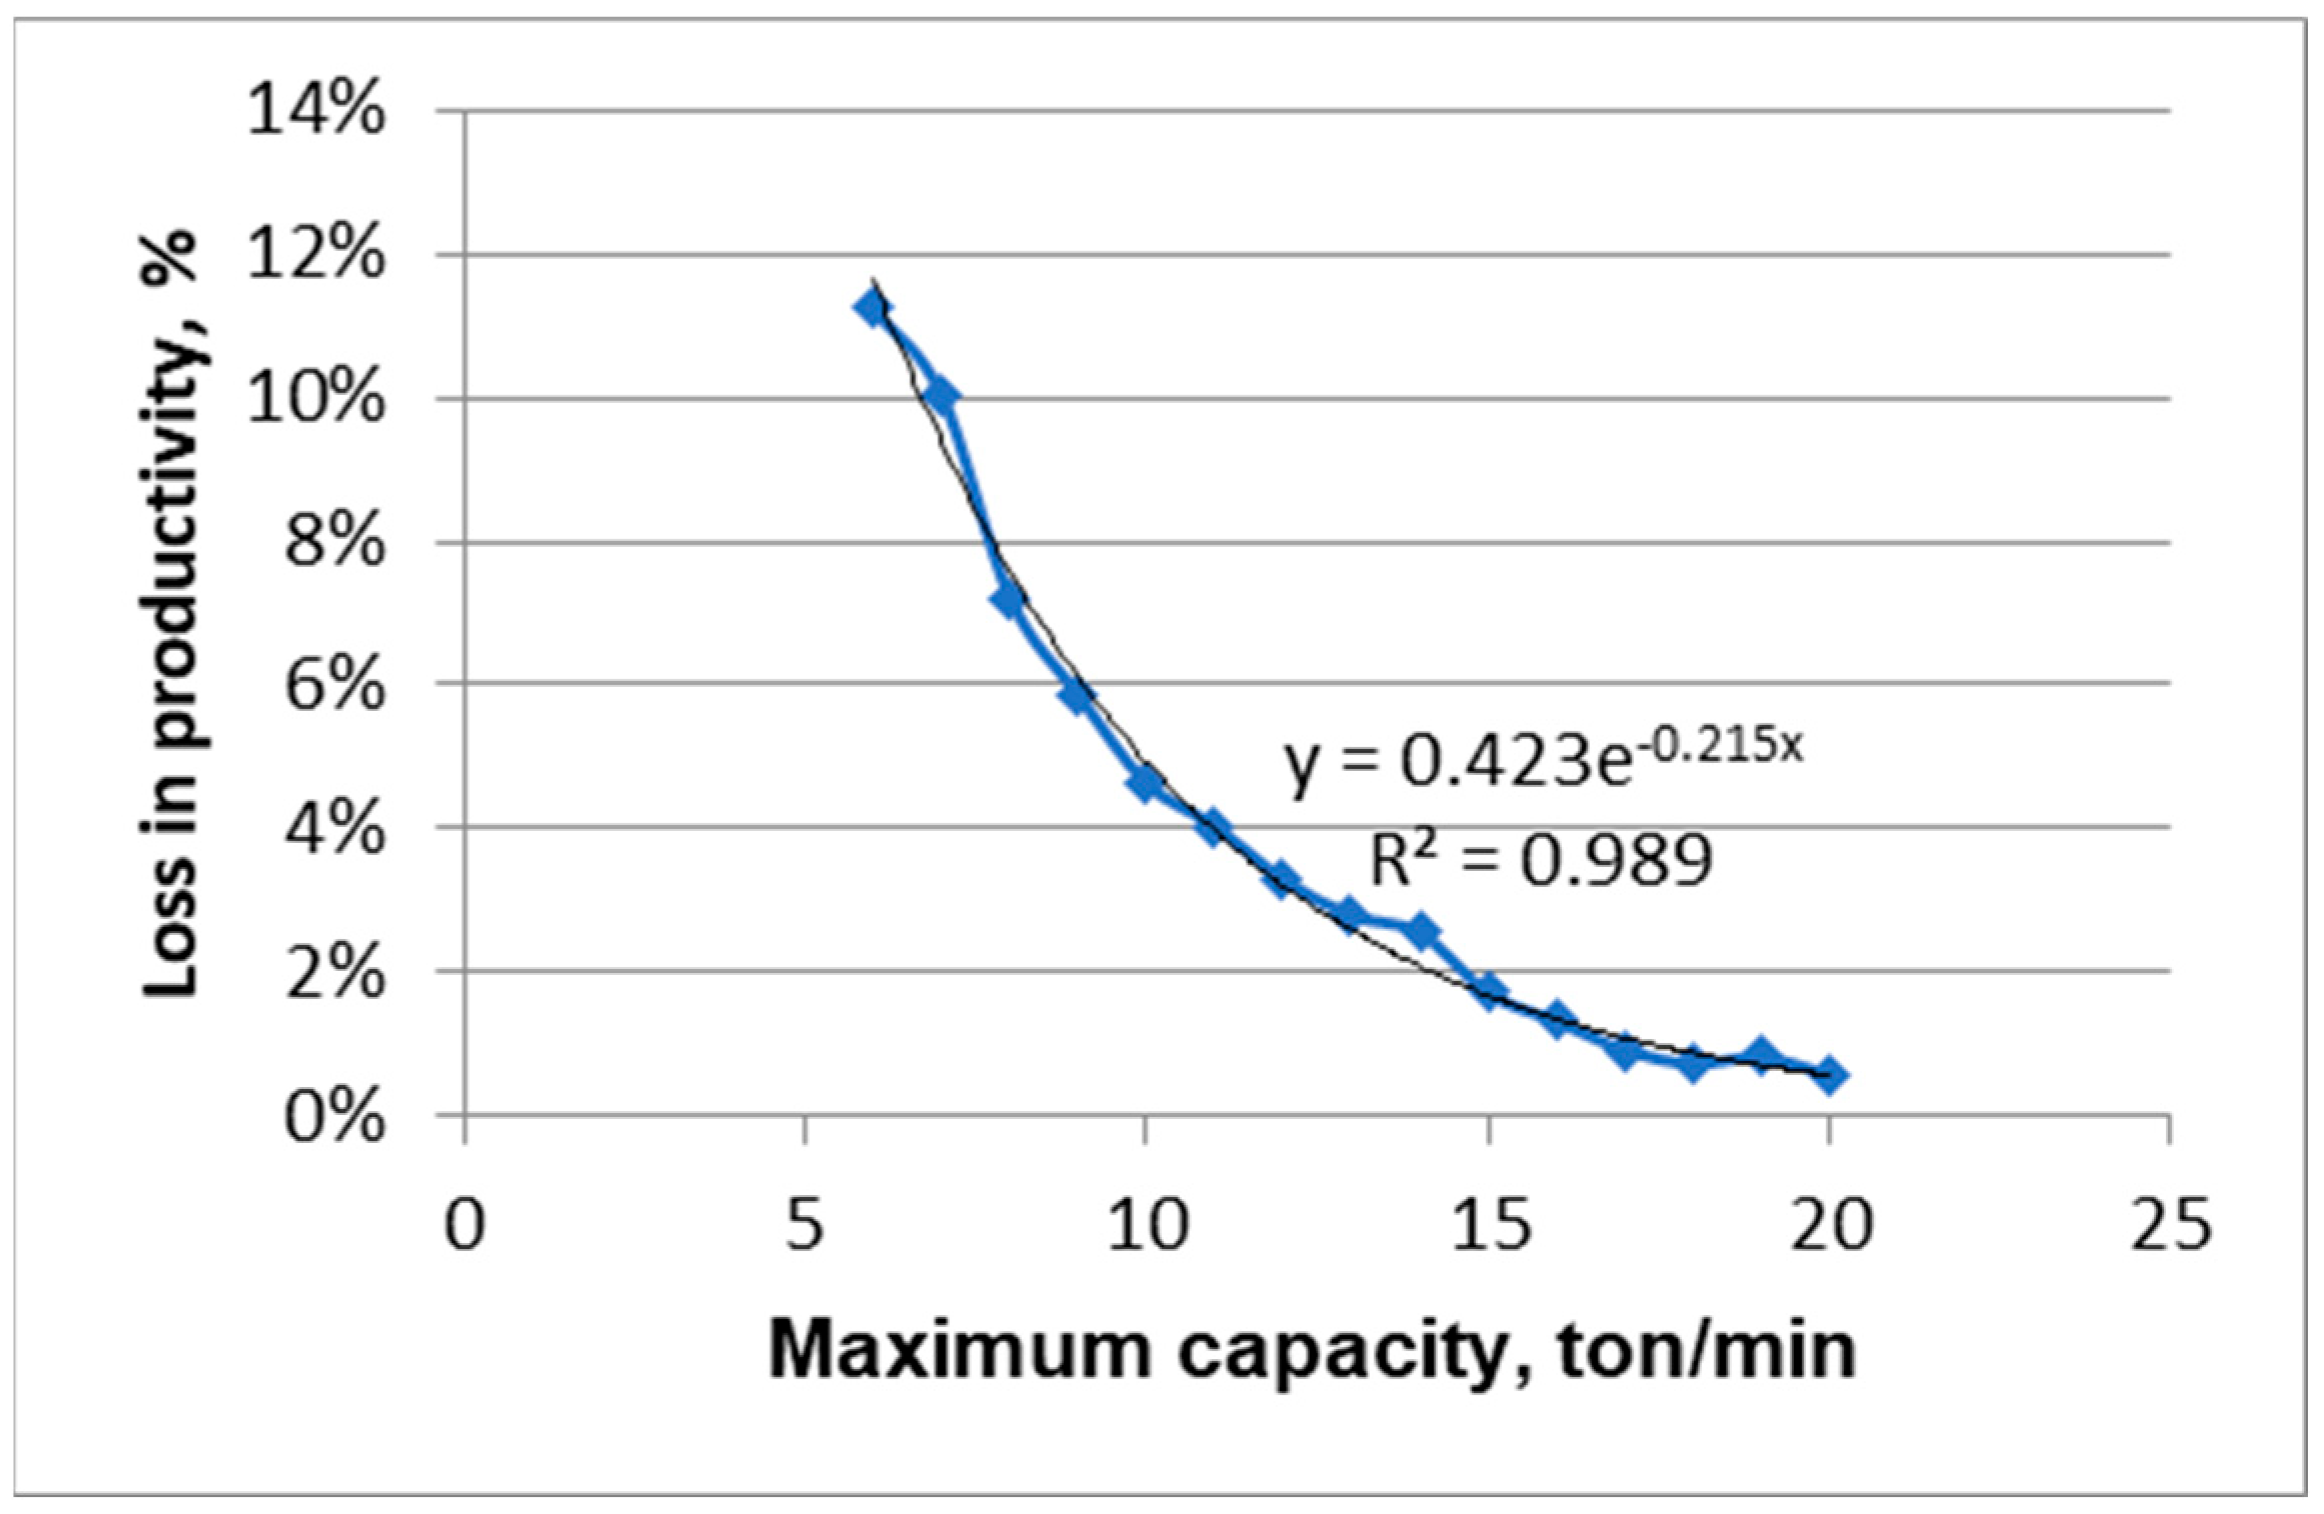
Calculating the probability of a risk situation occurring:
z ( n 1 , , n t ) = N ( a ) | n = 5 + N ( a ) | n = 6 + N ( a ) | n = 7 + N ( a ) | n = 8 t
This mathematical model assumes that the intersection of a large number of cargo flows does not cause the conveyor to stop; therefore, the time that will be spent on eliminating the accident is not taken into account. This is necessary in order to generally assess the probability of an event occurring in which cargo flows will intersect. The duration of the emergency stops will be taken into account later when calculating the potential damage in the event of a risk situation.
Because of the shuttle car speed, the duration of loading and unloading operations is subject to fluctuations, and that means that the time when the ore reaches the conveyor differs from face to face and from cycle to cycle. Therefore, given the presence of stochastic quantities in the mathematical model, as well as the need to obtain and analyze time series, it is advisable to carry out calculations by building a simulation model in AnyLogic software. A detailed description of the “model body” design and the accepted constraints is presented in the previous work by the author’s team.
The main difficulty in calculating the probability for this project is that the capacity of the heading-and-measuring bin is adjustable. This means that its value is determined and changed by specialists on site. As part of the design verification process, it is necessary to determine whether this very type of equipment with a given capacity range is suitable for this project.

3.4. Model Testing

To solve this problem, a simulation experiment was carried out using the mathematical model described above. The value of the heading-and-measuring bin performance was selected according to the normal distribution, where the mathematical expectation is the arithmetic mean between the maximum and minimum productivity, and the standard deviation is calculated through the rule of three sigma. Thus, in each experiment, the maximum value increases starting from 6...6 ton/min and ending with 6...20 ton/min. The results of the experiments are graphically presented in Figure 3.
The left part of Figure 4 shows a set of time series obtained in Anylogic during the experiment. All cases exceeding the permissible value of cargo flows at the bottleneck point (and leading to an emergency conveyor stop) are highlighted in red. The right part of Figure 4 shows the result of time series processing using MS Excel. The number of minutes when one, two, …, and eight cargo flows were in the bottleneck is summarized here. The minutes when the number of cargo flows was more or equal to five, i.e., the conveyor could stop, are highlighted in red. In Figure 4, we can see that there were no cases with the crossing of eight cargo flows simultaneously; nevertheless, the probability of conveyor emergency stops was not zero. The results of the experiment are summarized in Table 4.
As can be seen from the data presented in Table 4, when the average capacity of the loader increases, the risk of conveyor stops decreases. The results are visualized on the graph in Figure 5.
The resulting curve shows the presence of an exponential decrease in the conveyor stop probability while maintaining a higher bin capacity. Let us build a trend line and carry out regression analysis, including a significance test of the equation and regression coefficients. We determined that the probability of a conveyor stop can be described by the following distribution law:
z ( N ( t ) ) = 0.53 e 0.19 x 5
The significance of the regression equation was tested using an F-test, a t-test, and a p-value test. The results of the test showed that the relationship between the two is exponential in nature; the values of the coefficients are not random and were formed under the influence of the predictor factor.
The next step after calculating the probability of risk occurrence is to assess potential damage from it.
In this case, the damage will be the mass of ore that the conveyor network will not have time to transfer due to emergency stops. Mathematically, this can be described as follows:
s ( x 6 , . . . , n j ) = x 6 c x 7 n j | n 5
Let us set a stop of the conveyor event in the simulation model and form a graph of the mined and transported mass of ore (Figure 6). Under ideal conditions (without stops), the conditional “delay” for transport (the difference between the mined and transported mass) is 5.5%.
From the resulting graph (Figure 6), it can be seen that keeping the capacity of the heading-and-measuring bin at high values does not give high conveying speed. The duration of the conveyor stop after each risk event depends on the number of collided cargo flows, which varies from case to case.
To calculate the damage from the risk event occurrence, the percentage of the reduction in mine productivity in the presence of shutdowns is calculated relative to the modeling under “ideal conditions”:
Δ a = 1 a b a
Hence, probable damage can be calculated as a multiplication of productivity loss to annual revenue:
risk = revenue ∗ Δa
The data for the calculation and the result are presented in Table 5.
Figure 7 shows the graph of the probable damage distribution expressed in the form of productivity losses. A regression analysis was performed based on the obtained data, including a significance assessment of the equation and regression coefficients.
The graph in Figure 6 shows that the potential damage from conveyor jamming is up to an 11.23% loss in mine productivity (and therefore annual revenue). At the same time, the longer the high speed of ore unloading on the conveyor is maintained during the working shift, the lesser the consequences. Thus, the probable damage from the risk situation occurrence can be described by the following distribution law:
r i s k ( x 5 ) = 0.42 e 0.215 x 5
Hence, we can conclude that the company should consider replacing the loader with a more efficient one or introducing an automated control system to regulate the ore feed rate to the conveyor in real time.

4. Discussion

The authors proposed a methodology to improve the accuracy and efficiency of the quantitative assessment of operational risks at the stage of preparing a feasibility study for an underground mining project. The methodology of risk management is set out in the standard ISO 310000-2018 “Risk Management. Principles and guidelines” [32]. It consists of the following stages: risk identification, risk analysis, comparative risk assessment, risk treatment, monitoring and revision, documentation, and reporting.
Over the course of this study, the authors adhered to the neoclassical concept of risk as an economic category, according to which risk is an event that will occur with some probability and, if it occurs, will lead to deviation from the set goal. Since the focus of this study is on risk assessment at the project development stage, the objectives are defined as achieving the target indicators of mine productivity as well as a given project profitability. This study does not consider the assessment of risk events whose consequences result in harm to human life and health or the environment. Due to the strict requirements for the development of design documentation by the state in the field of labor protection and the environment, additional analysis of the amount of costs to reduce the likelihood of such risks and potential damage seems redundant to this research.
The novelty of this study lies in the development of a methodological approach that allows for an economic assessment of a mining enterprise’s operational risks. This method integrates traditional risk assessment techniques with modern digital tools. It focuses on identifying the minimum necessary set of parameters for a simulation model to evaluate both the probability and impact value of risks. Using this model, the optimal value of the key risk factor can be determined, which helps minimize the likelihood of negative events.
The proposed approach was developed taking into account the design features of ore deposits. A deposit with a chamber and pillar system of development was selected for testing. The reliable experimental results show that this approach can be used for any underground ore deposit, not only potash. It is preferable for the development system to be a chamber-and-pillar system. Future research by the authors will be aimed at conducting experiments on designed ore deposits with other development systems.

5. Conclusions

This study provides a robust framework for a quantitative assessment of operational risks in mining projects, emphasizing the importance of adapting to specific system risks and improving project efficiency using digital tools and simulation modeling. Thus, as a result of this study, the following conclusions can be drawn:
  • The quantitative risk assessment shows that the risk occurrence probability (as an event resulting in a conveyor system emergency stop) is no more than 21.4%. At the same time, the occurrence of a risk situation entails a 44–73% drop in transporting productivity and, consequently, in annual revenue.
  • The estimated probable damage amounts to 11.23% of the annual revenue loss. This indicates the need to develop measures to reduce the probability of risk occurrence, for example, by replacing the heading-and-measuring bin unit or introducing an automated system to control the speed of ore feeding to the conveyor.
  • The main objective of operational risk assessment at the design stage is to verify the achievement of continuity in the production process. Hence, the risk factors are the values of the parameters laid down in the project.
  • This paper proposes the classification of operational risks based on their manifestation in the production process. Within the framework of classification, risks are divided into four groups: shutdown, downtime, shortage, and violation of safe operation norms.
  • This paper proposes to decompose the sources of risk according to the matrix “type of production task—nature of parameter influence on the process”. This study formulates nine types of production tasks and four types of influence parameters.
  • The authors’ proposed methodology for assessing production and economic risks consists of the following stages: (a) risk identification using classification by the form of their manifestation in the production process; (b) risk decomposition by sources using the matrix “types of production tasks—nature of the influence of parameters on the process”; (c) determination of the parameters of the mathematical model—compiling a list of risk sources and determining the cause-and-effect relationships between them, which can lead to the manifestation of a risk event; (d) conducting experiments with the model to determine the amount of damage in the case of a risk event; and (e) calculating the probable damage from the risk occurrence.

Author Contributions

Conceptualization, M.N.; methodology, M.N. and A.S.; software, L.N.; validation, N.K., L.N. and M.N.; formal analysis, A.S.; investigation, A.S.; resources, N.K.; data curation, M.N.; writing—original draft preparation, A.S.; writing—review and editing, M.N.; visualization, A.S.; supervision, M.N.; project administration, L.N. All authors have read and agreed to the published version of the manuscript.

Funding

This research received no external funding.

Data Availability Statement

The data are contained within this article.

Conflicts of Interest

The authors declare no conflicts of interest.

References

  1. Al-Ansi, A.M.; Garad, A.; Ryabtsev, V. Intelligent Risk Analysis of Investment Projects in the Extractive Industry. J. Ind. Intell. 2024, 2, 42–53. [Google Scholar] [CrossRef]
  2. Nguyen, M.P.; Ponomarenko, T.; Nguyen, N. Energy Transition in Vietnam: A Strategic Analysis and Forecast. Sustainability 2024, 16, 1969. [Google Scholar] [CrossRef]
  3. Ashkanani, S.; Franzoi, R. Gaps in Megaproject Management System Literature: A Systematic Overview. Eng. Constr. Archit. Manag. 2023, 30, 1300–1318. [Google Scholar] [CrossRef]
  4. Stoianova, A.D.; Trofimets, V. Ya.; Matrokhina, K.V. Technical Approach to Rating of Companies in the Arctic Zone Based on Sustainable Development Indicators. Min. Informational Anal. Bull. 2024, 6, 149–162. [Google Scholar] [CrossRef]
  5. Buch, A.C.; Niemeyer, J.C.; Marques, E.D.; Silva-Filho, E.V. Ecological Risk Assessment of Trace Metals in Soils Affected by Mine Tailings. J. Hazard. Mater. 2021, 403, 123852. [Google Scholar] [CrossRef] [PubMed]
  6. Marinina, O.; Malikov, A.; Lyubek, Y.; Pasternak, S.; Reshneva, E.; Stolbovskaya, N. Selection of Enhanced Oil Recovery Method on the Basis of Clustering Wells. Processes 2024, 12, 2082. [Google Scholar] [CrossRef]
  7. Myakotnykh, A.A.; Ivanova, P.V.; Ivanov, S.L. Criteria and Technological Requirements for Creation of a Bridge Platform to Extract Peat Raw Materials for Climate-Neutral Geotechnology. Min. Ind. J. (Gorn. Promishlennost) 2024, 4, 116–120. [Google Scholar] [CrossRef]
  8. Semenova, T.; Martínez Santoyo, J.Y. Increasing the Sustainability of the Strategic Development of Oil Producing Companies in Mexico. Resources 2024, 13, 108. [Google Scholar] [CrossRef]
  9. Calvo, G.; Valero, A. Strategic Mineral Resources: Availability and Future Estimations for the Renewable Energy Sector. Environ. Dev. 2022, 41, 100640. [Google Scholar] [CrossRef]
  10. Scammacca, O.; Mehdizadeh, R.; Gunzburger, Y. Territorial Mining Scenarios for Sustainable Land-Planning: A Risk-Based Comparison on the Example of Gold Mining in French Guiana. Sustainability 2022, 14, 10476. [Google Scholar] [CrossRef]
  11. Yongbin, Y. The Comprehensive Whole Process Risk Assessment Method of Mine Multi-Factor. World J. Manag. Sci. Technol. 2024, 3, 10. [Google Scholar] [CrossRef]
  12. Botyan, E.Y.; Lavrenko, S.A.; Pushkarev, A.E. Evaluation of Complicated Mining Exploitation Conditions Influence on Service Life of Open Pit Trucks Suspensions with Remote Monitoring Systems. Int. J. Eng. 2024, 37, 2268–2275. [Google Scholar] [CrossRef]
  13. Cherepovitsyn, A.E.; Dorozhkina, I.P.; Solov’eva, V.M. Forecasts of Rare-Earth Elements Consumption in Russia: Basic and Emerging Industries. Stud. Russ. Econ. Dev. 2024, 35, 688–696. [Google Scholar] [CrossRef]
  14. Trufanova, I.; Nevzorov, D. The Use of Conveyor Trains as External Transport for Enrichment Enterprises. Min. Informational Anal. Bull. 2023, 9–1, 64–78. [Google Scholar] [CrossRef]
  15. Maksarov, V.V.; Minin, A.O.; Romanov, P.I.; Nikiforov, I.P. Influence of High-Frequency Wave Action in a Tooling System on the Machining Quality of Corrosion-Resistant Aluminum Alloys. Metalloobrabotka 2022, 32–40. [Google Scholar] [CrossRef]
  16. Kantianis, D. Construction Project Crashing with Uncertain Correlated Normal and Crash Task Durations and Costs: An Integrated Stochastic Practical Approach. Eur. Proj. Manag. J. 2023, 13, 3–22. [Google Scholar] [CrossRef]
  17. Banerjee Chattapadhyay, D.; Putta, J.; Rao, P.R.M. Risk Identification, Assessments, and Prediction for Mega Construction Projects: A Risk Prediction Paradigm Based on Cross Analytical-Machine Learning Model. Buildings 2021, 11, 172. [Google Scholar] [CrossRef]
  18. Zhu, J. Application of Artificial Intelligence Data Mining Algorithm in Enterprise Management Risk Assessment. Int. J. Inf. Syst. Supply Chain Manag. 2024, 17, 1–19. [Google Scholar] [CrossRef]
  19. Lu, Y.; Gong, P.; Tang, Y.; Sun, S.; Li, Q. BIM-Integrated Construction Safety Risk Assessment at the Design Stage of Building Projects. Autom. Constr. 2021, 124, 103553. [Google Scholar] [CrossRef]
  20. Chen, S.; Zeng, Y.; Majdi, A.; Salameh, A.A.; Alkhalifah, T.; Alturise, F.; Ali, H.E. Potential Features of Building Information Modelling for Application of Project Management Knowledge Areas as Advances Modeling Tools. Adv. Eng. Softw. 2023, 176, 103372. [Google Scholar] [CrossRef]
  21. Koteleva, N.I.; Valnev, V.V.; Korolev, N.A. Augmented Reality as a Means of Metallurgical Equipment Servicing. Tsvetnye Met. 2023, 4, 14–23. [Google Scholar] [CrossRef]
  22. Myakotnykh, A.A.; Ivanova, P.V.; Ivanov, S.L. On Classification of Peat Extraction Complexes. Min. Ind. J. (Gorn. Promishlennost) 2023, 6, 137–142. [Google Scholar] [CrossRef]
  23. Shabalov, M.Y.; Zhukovskiy, Y.L.; Buldysko, A.D.; Gil, B.; Starshaia, V.V. The Influence of Technological Changes in Energy Efficiency on the Infrastructure Deterioration in the Energy Sector. Energy Rep. 2021, 7, 2664–2680. [Google Scholar] [CrossRef]
  24. Koteleva, N.; Valnev, V. Automatic Detection of Maintenance Scenarios for Equipment and Control Systems in Industry. Appl. Sci. 2023, 13, 12997. [Google Scholar] [CrossRef]
  25. Zhukovsky, Y.; Suslikov, P. Assessment of the Potential Effect of Applying Demand Management Technology at Mining Enterprises. Sustain. Dev. Mt. Territ. 2024, 16, 895–908. [Google Scholar] [CrossRef]
  26. Iakhiaev, D.; Grigorishchin, A.; Zaikov, K.; Bezdudnaya, A.; Ukhanova, A.; Tsvetkova, A.; Fadeev, A. Methodological Approach to Assessing the Digital Infrastructure of the Northern Regions of the Russian Federation. J. Infrastruct. Policy Dev. 2024, 8, 8747. [Google Scholar] [CrossRef]
  27. RACHID, S.; TAHA, Y.; BENZAAZOUA, M. Environmental Evaluation of Metals and Minerals Production Based on a Life Cycle Assessment Approach: A Systematic Review. Miner. Eng. 2023, 198, 108076. [Google Scholar] [CrossRef]
  28. Radebe, N.; Chipangamate, N. Mining Industry Risks, and Future Critical Minerals and Metals Supply Chain Resilience in Emerging Markets. Resour. Policy 2024, 91, 104887. [Google Scholar] [CrossRef]
  29. Wang, J.; Sifamen, V. Exploring Industrial Hazards and Implementing Risk Control Measures in the Mining Sector. J. Infrastruct. Policy Dev. 2024, 8, 6255. [Google Scholar] [CrossRef]
  30. Nevskaya, M.; Shabalova, A.; Kosovtseva, T.; Nikolaychuk, L. Applications of Simulation Modeling in Mining Project Risk Management: Criteria, Algorithm, Evaluation. J. Infrastruct. Policy Dev. 2024, 8, 5375. [Google Scholar] [CrossRef]
  31. Karchina, E.I.; Ivanova, M.V.; Volokhina, A.T.; Glebova, E.V.; Vikhrov, A.E. Improving the procedure for group expert assessment in the analysis of professional risks in fuel and energy companies. J. Min. Inst. 2024, 270, 994–1003. [Google Scholar]
  32. ISO 310000:2018; Risk Managment. International Organization for Standardization: Geneva, Switzerland, 2018.
  33. Tubis, A.; Werbińska-Wojciechowska, S.; Wroblewski, A. Risk Assessment Methods in Mining Industry—A Systematic Review. Appl. Sci. 2020, 10, 5172. [Google Scholar] [CrossRef]
  34. Rashid, A.; Ayub, M.; Ullah, Z.; Ali, A.; Sardar, T.; Iqbal, J.; Gao, X.; Bundschuh, J.; Li, C.; Khattak, S.A.; et al. Groundwater Quality, Health Risk Assessment, and Source Distribution of Heavy Metals Contamination around Chromite Mines: Application of GIS, Sustainable Groundwater Management, Geostatistics, PCAMLR, and PMF Receptor Model. Int. J. Environ. Res. Public Health 2023, 20, 2113. [Google Scholar] [CrossRef] [PubMed]
  35. Galkina, N.V.; Kravchuk, I.L.; Smolin, A.V.; Peryatinski, A.Y. An Approach to the Economic Assessment of Production Risk at a Mining Enterprise. NEWS Ural State Min. Univ. 2022, 4, 151–158. [Google Scholar] [CrossRef]
  36. Deveci, M.; Varouchakis, E.A.; Brito-Parada, P.R.; Mishra, A.R.; Rani, P.; Bolgkoranou, M.; Galetakis, M. Evaluation of Risks Impeding Sustainable Mining Using Fermatean Fuzzy Score Function Based SWARA Method. Appl. Soft Comput. 2023, 139, 110220. [Google Scholar] [CrossRef]
  37. Mishra, P.C.; Mohanty, M.K. A Review of Factors Affecting Mining Operation. World J. Eng. 2020, 17, 457–472. [Google Scholar] [CrossRef]
  38. Amirudin, A.; Sukwika, T.; Ramli, S. Analysis of Performance and Safety Risks in the Nickel Mining Sector. Indones. J. Glob. Health Res. 2024, 6, 723–734. [Google Scholar]
  39. Massel, L.; Komendantova, N.; Massel, A.; Tsvetkova, A.; Zaikov, K.; Marinina, O. Resilience of Socio-Ecological and Energy Systems: Intelligent Information Technologies for Risk Assessment of Natural and Technogenic Threats. J. Infrastruct. Policy Dev. 2024, 8, 4700. [Google Scholar] [CrossRef]
Figure 1. The general scheme of the analyzed production process. Source: compiled by the authors.
Resources 14 00053 g001
Figure 2. Functional model of ore mining and transport on the example of a single face. Source: compiled by the authors.
Resources 14 00053 g002
Figure 3. Functional model of the occurrence probability for an emergency conveyor stop. Source: compiled by the authors.
Resources 14 00053 g003
Figure 4. Graphical representation of the results of the simulation experiment. Source: compiled by the authors.
Resources 14 00053 g004
Figure 5. Dependency graph of a risk situation probabilities on the maximum permissible capacity of the heading-and-measuring bin. Source: compiled by the authors.
Resources 14 00053 g005
Figure 6. Results of the mine and conveyor network productivity calculation by the simulation model—(a) maximum possible productivity per day of the considered part of the mine; (b) mass of ore transported by the conveyor under “ideal conditions” (without conveyor stops); (c) mass of ore transported by the conveyor under simulated conveyor stops. Source: compiled by the authors.
Resources 14 00053 g006
Figure 7. Dependency graph of conveyor network productivity losses on the maximum capacity of the loader. Source: compiled by the authors.
Resources 14 00053 g007
Table 1. Operational risks by form of manifestation in the production process.
Risk ManifestationExample of a Risk
Mining transport logistic issues, formation of “traffic jams”Risk of incorrect localization of ore dumps; risk of mining equipment not being able to pass through due to restrictions related to the geometric dimensions of mine shafts
Downtime of machinery and equipmentRisk of incorrect blasting schedules; risk of excessive amount of mining equipment
Insufficient productivity of machinery and equipmentRisk of insufficient number of loading and delivery vehicles to transport ore; risk of insufficient width of conveyor belt
Violation of safety regulationsRisk of disruption in the ventilation system; risk of disruption of the power supply system
Source: compiled by the authors based on data [32,36,39].
Table 2. Example of a decomposition of conveyor emergency stop risk by types of production tasks.
Production TaskQuantityPropertiesTimetablePlacement
Organization of excavation and cleaning works4 faces per panel, 8 heading-and-winning machines, 8 shuttle cars, 20 conveyors in the systemheading-and-winning machine capacity, shuttle car speed, ore weight per cycle, heading-and-measuring bin capacity, belt speedshift duration, duration of loading and unloading operationsadvance per cycle, rolling shoulder, conveyor positioning
Source: compiled by the authors.
Table 3. Symbols of model parameters.
#ParameterSymbolValue
1shift duration, minl720
2number of faces, heading-and-winning machines, shuttle carsi1...8
3number of cargo flows, number of mining cyclesjComputed parameter
4heading-and-winning machine advancement per cycle, mx10.5
5rolling shoulder, mdComputed parameter
6start time of a new cycle, mint01.6
7shuttle car speed, m/minx2normal (0.51, 98.75)
8loading and unloading time, minx3normal (0.21, 5.62)
9moment of cargo flow movement starts on the conveyor, mintsComputed parameter
10ore weight, tonx416
11heading-and-measuring bin capacity, ton/minutex56...20
12moment of cargo flows full discharge to the conveyor, minteComputed parameter
13location of conveyors—taken into account as the length of each conveyor, mx650...1135
14belt speed, m/minx7189
15number of cargo flows in case of their mergenComputed parameter
16capacity of conveyor network (without stops), tonabComputed parameter
17capacity of conveyor network (with stops), tonaCalculation
18loss in productivity, %ΔaComputed parameter
19risk, RUBriskComputed parameter
20annual revenue, RUBrevenueComputed parameter
Source: compiled by the authors.
Table 4. Experimental results obtained by calculating the probability of conveyor emergency stops.
Max. Capacity of Heading-and-Measuring Bin67891011121314151617181920
∑N(t) | n ≥ 5154978272543926323421211381310
z(n(1)..nt),%21.413.511.410.07.55.43.64.44.72.92.91.81.11.81.4
Source: compiled by the authors.
Table 5. Results of a quantitative assessment of the risk of a conveyor emergency stop.
Maximum Capacity of Heading-and-Measuring Bin, Ton/Min67891011121314151617181920
Weight extracted, ton14,73614,75214,75214,76814,80014,88014,81614,78414,72014,73614,86414,84814,83214,75214,832
Carried weight, ton (no stops)13,85613,88813,90413,92013,98414,06414,03213,93613,90413,93614,06414,08014,06413,98414,064
Carried weight, ton (with stops)454437925104524856485216531250404080592064807664790456486960
Decrease in productivity, %677363626063626471585446446051
Risk probability (by distribution), %16.7213.8111.419.427.796.435.314.393.633.002.482.041.691.401.15
risk, %11.2310.047.225.874.644.053.302.802.561.721.330.930.740.830.58
Source: compiled by the authors.
Disclaimer/Publisher’s Note: The statements, opinions and data contained in all publications are solely those of the individual author(s) and contributor(s) and not of MDPI and/or the editor(s). MDPI and/or the editor(s) disclaim responsibility for any injury to people or property resulting from any ideas, methods, instructions or products referred to in the content.

