Abstract
Background: This study aims to evaluate the quality of treated wastewater flowing in the Zarqa River to determine its suitability for agricultural use. The assessment is based on physicochemical and biological parameters in accordance with Jordanian standards (JS 893:2021), the CCME water quality index, and the weighted arithmetic water quality index (WAWQI). Additionally, a microbial assessment was conducted to identify the presence of pathogens in the treated wastewater. Methods: A total of 168 water samples were collected from seven different sites along the Zarqa River over a 24-month period. This study focused on microbial assessment and selected parameters from the JS 893:2021, including total dissolved solids (TDSs), biochemical oxygen demand (BOD), dissolved oxygen (DO), chemical oxygen demand (COD), and E. coli levels. Furthermore, data were gathered on additional physicochemical parameters such as pH, mineral content (including Na, Ca, K, Mg, and Cl), salts (HCO3, SO4, NO3, and PO4), and heavy metals (Fe, Cu, Pb, Mn, and Co). The CCME water quality index and weighted arithmetic WQI scores were calculated to determine the water quality from all seven study sites. Results: In terms of Jordanian standards, Site 1 had the lowest TDS and DO values along with E. coli concentration. Further, in terms of minerals and salts, the maximum concentrations found for the sites are given herewith: Site 2 (K+ and NO3), Site 3 (Cl−, Na+), Site 5 (Ca, HCO3), and Site 7 (Mg2+, PO4, and SO4). In terms of pH, all the study sites had pH values within the acceptable range, i.e., between 6 and 9, for irrigation purposes. The concentrations of certain heavy metals, specifically lead (Pb), manganese (Mn), and cobalt (Co), were observed to be negligible. In contrast, Site 6 exhibited the highest concentration of iron (Fe) (0.0178 mg/L), while Site 5 recorded the maximum concentration of copper (Cu) (0.0210 mg/L) among the study locations. Site 1 demonstrated the most favorable water quality among the seven sites evaluated, whereas Site 6 exhibited the poorest water quality. Overall, the water quality from the majority of the sites was deemed suitable for drainage and for irrigating crops classified under the B category. However, based on the weighted arithmetic water quality index (WQI) values, none of the sites achieved a classification of good or excellent water quality, although the water quality at these sites may still be utilized for irrigation purposes. The current study is the first to report the presence of SARS-CoV-2 in Zarqa River water samples. Conclusions: The current study outcomes are promising and provide knowledgeable insights in terms of water quality parameters, while public health aspects should be considered when planning the WWTPs in parallel to reclaiming the wastewater for irrigation purposes.
1. Introduction
Water is naturally scarce in Jordan [1], which has prompted the Ministry of Environment and the Ministry of Water and Irrigation to develop the ‘Green Growth National Action Plan 2021–2025’ [2] to ensure water security in the country. The International Trade Administration [3] reports that each person in Jordan currently has access to only 0.00009 million cubic meters (MCM) of water per year, a figure projected to decrease to 60 cubic meters by 2040. Several factors contribute to this situation, including low rainfall, high demand due to population growth (with the population projected to rise from 11 million in 2021 to 16.8 million by 2040 [4]), water leakage [5], economic development activities, deteriorating water quality, unsustainable water consumption practices, and climate change. Groundwater, surface water, and treated wastewater are the three primary sources of water in Jordan, while the 2023–2040 National Water Strategy (NWS) was proposed [6] to ensure the country’s water security, focusing on integrated water resource management. In addition to safeguarding and judiciously using groundwater and surface water, the strategy also aims to streamline non-conventional water sources and wastewater treatment plants (WWTPs) to ensure a sustainable water supply to the country.
Though surface water supply in Jordan is primarily (up to 27%) contributed by three rivers (Jordan, Yarmouk, and Zarqa), the former two are transboundary rivers. In contrast, Zarqa is the only major river under Jordan’s complete jurisdiction. However, the catchment area of the Zarqa River has more than 65% of the country’s population, while the majority (85%) of the country’s industrial and economic activities occur in this region. Though small-scale industrial-level wastewater treatment plants have been installed in 86% of industries, only half are operational. So, in 2020, it was planned to construct an industrial-scale WWTP in Zarqa since the river is one of the most highly polluted surface water bodies in the country [2].
As of 2021, Jordan has a total of 32 wastewater treatment plants for the treatment and reuse of wastewater, with a capacity of 600,000 m3/d [7]. Although most WWTPs operate with SCADA and employ new technologies such as activated sludge and trickling filters, a case study conducted by Ramtha WWTP [8] analyzed the efficiency of the existing methods and the need to install modified systems. The study’s results indicate that the existing plants are under severe hydraulic and organic loads, which can significantly deteriorate their efficiency. It recommended introducing novel technologies used in developed countries to enhance the performance of WWTPs. Currently, Jordan utilizes treated wastewater from multiple medium-sized treatment plants, with As-Samra WWTP being the largest. The treated water is mixed with fresh water before being used for irrigation purposes [5,7].
According to Qteishat et al. [8], 76% of the treated wastewater is directly discharged into the Zarqa River. Although it mixes with tributaries, leading to a significant increase in quality, the concentration of pollutants remains higher than the expected Jordanian standards. Consequently, the Ministry of Water and Irrigation [6] plans to improve the quality of treated wastewater so that reclaimed water can be used in agriculture, in accordance with the specifications set by Jordanian standards (Jordanian Standard JS 893—Reclaimed Domestic Wastewater) [9] which are regularly tested by the Water Authority of Jordan (WAJ) and other water utilities. The irrigation sector is the major water consumer, accounting for 56%, followed by the municipal and industrial sectors [6].
Though the recycled water from As-Samra WWTP is utilized for agricultural purposes, it is limited only to a level of 1 MCM/year, whereas the rest of the production (i.e., 59 MCM discharge per year) flows down the Zarqa River and reaches the King Talal Dam (KTM) prior to its entry into the Jordan Valley [5]. According to Al-Addous et al. [7], the As-Samra WWTP has an effluent biochemical oxygen demand (BOD) of 650 mg/L over five days. In the literature [10], the authors analyzed how far the dam water is appropriate for irrigation purposes and studied five prominent dams in Jordan. A few water parameters were recorded for seven years spanning 2015 and 2021 and analyzed. According to the study results, the King Talal Dam (KTD) was classified as permissible to doubtful, in which the EC (electrical conductivity) and SAR (sodium adsorption ratio) values were highest along with elements such as Cl−, SO42−, HCO3−, Na+, Ca2+, and Mg2+ concentrations (mg/L). The study concluded that water from KTD has no restrictions for agricultural use since it receives treated wastewater from As-Samra WWTP and runoff water from surrounding areas, and the presence of nitrogen, potassium, and phosphorus can positively influence crop growth. However, the water samples were categorized as having high salinity and medium sodium hazard. In previous research [11], the authors analyzed the spatial distribution and quantification of six heavy metals in treated wastewater in the Jordan Valley, such as As, Cd, Cr, Cu, Pb, and Zn, along with physical parameters. Excluding cadmium (Cd), the treated wastewater recorded high heavy metal content in the freshwater, while the respective values achieved for the heavy metals (As, Cd, Cr, Cu, Pb, and Zn) were 1.07, 2.87, 27.39, 14.46, 43.93, and 97.21 mg/L). However, the mean concentrations of the metals were found to be lower compared to WHO/FAO standards. The authors noted that the presence of Cu and Pb was due to fertilizer use.
In the study conducted earlier [12], the authors determined the usability of the reclaimed wastewater from two WWTPs in Jordan for irrigation purposes. The authors tested different physical–chemical parameters such as pH, BOD, COD, and TDS, and NO3−2, PO4−3, Cl−, Na, K, Cu, Fe, Pb, and Cd. According to the study outcomes, the average concentrations of the metals from the two WWTPs were as follows: lead—0.65 and 0.58 mg/L; iron—0.24 and 0.55 mg/L; pH—7 and 7.5; Cl—340 mg/L and no data; PO4—1.94 mg/L and no data; NO3—11.7 mg/L and 4.4 mg/L; Cu—below detection levels; Na+—116.03 mg/L and 197.56 mg/L; K—3.56 mg/L and 28.94 mg/L. The study concluded that the application of reclaimed wastewater has no adverse impact on the agricultural outcomes. Another study [13] analyzed the KTD water samples for the presence of heavy metals such as Fe, Mn, Cu, Cr, Ni, Pb, Zn, and Cd. The study found that the concentration of heavy metals showed seasonal differences, depending on the depths and the site where the samples were collected. However, Zn and Fe showed predominantly similar results across the study sites and samples. The metal concentration in the water was in the order of Ni > Fe > Cu > Pb > Mn > Cr > Zn > Cd, while its concentration levels were within the limits allowed by the Jordanian standards.
Abualhaija [14] analyzed the quality of the reclaimed wastewater discharged by the Kufranja WWTP and how far it is suitable for discharge and irrigation purposes. In this study, the authors used two measures, such as the water quality index (WQI) and the water pollution index (WPI). Further, 15 physiochemical (including pH, Ca, Mg, Na, K, HCO3, Cl, NO3, and SO4) parameters as well as biological parameters were analyzed for determining the quality of the reclaimed wastewater in line with the Jordanian standards. The outcomes confirmed that the reclaimed wastewater from the WWTP falls under the ‘good quality’ category for irrigation of industrial field crops as well as forest trees, whereas it cannot be used for other irrigation purposes or discharged into water bodies. The average removal efficiency (EFF) values of BOD and COD were 95.1% (650.5 mg/L) and 95.6% (1349.7 mg/L), respectively, followed by a high contribution of E. coli towards the WQI values. The study found that the rainy season recorded the maximum concentration of Ca and Mg, while the surface water recorded high Na and K concentrations and minimum concentrations during winter. Out of the seven heavy metals studied (including Fe, Mn, and Cu), no detectable levels were found in the water. The study concluded that the effluent quality of the plant is deteriorated and inappropriate for most applications. Radaideh [15] evaluated the appropriateness of Zarqa River water in Jordan for the purpose of irrigation using the CCME-WQI approach, in which the authors used the JS 893/2006 standards [16]. The study determined nine most commonly evaluated physiochemical and microbiological water quality parameters, such as pH, COD, TDS, TSS, total phosphate, nitrogen, nitrates, EC, and E. coli. As per the study outcomes, the water quality of the Zarqa River (ZR) was found to be of fair quality for green crop irrigation as well as of acceptable quality for the irrigation of the rest of the crops. In terms of WQI values, there were fluctuations observed between good and fair between the seasons. Huge differences were found between the average WQI values among all the study seasons spanning between 2019 and 2020 except winter 2019 and spring 2020.
Al Hadidi and Al Hadidi [17] assessed how far the reclaimed wastewater, discharged by a decentralized wastewater plant in Balqa Governorate in Jordan, is suitable for its usage in irrigation as per the Jordanian standards. For this study, the authors collected 27 samples from the WWTP and considered a few parameters such as pH, EC, BOD, COD, and TSS along with Ca, Mg, HCO3, Cl, Na, K, PO4, and NO3. The study outcomes infer that the water is slightly alkaline and mild to moderate for irrigation purposes. This study also used the US salinity laboratory classification scheme (C1 low, C2 medium, C3 high, and C4 very high, with their respective total dissolved salts (mg/L) being <150, 150–500, 500–1500, and >1500 mg/L and electrical conductivity values (uS/cm) being <250, 250–750, 750–2250, and >2250, respectively) and found that the samples had high salinity and medium sodium water. The authors recommended that the treated wastewater from this decentralized WWTP should be considered in the form of a non-conventional source for irrigation. Almanaseer et al. [18] studied the impact of reusing the treated wastewater upon the hydrology and environment, which was assessed by the authors, focusing on the vulnerable locations in the Amman-Zarqa Basin. The focus of the study was to assess from the As-Samra treatment plant to the Jerash Bridge. For this study, the authors collected datasets on groundwater, surface water, climate, land use, and soil, along with the survey among 27 farmers in the study area. At 11 defined points, the water samples were collected from the Zarqa River during late summer and early winter, and the samples were assessed for TDS, COD, BOD, DO, coliform and E. coli, pH, soluble Na, K, Ca, Mg, bicarbonate, chloride, and heavy metals such as Cu, Fe, Mn, and many more as per the JS 893/2006 standards. The study outcomes confirmed the increase in salinity in the downstream area, though the biological and microbial parameters increased along the path. The study confirmed the relationship between Na and Cl with that of the TDSs, while the pH value was found to be increased towards the downstream. To verify whether the wastewater quality of some sewage treatment plants in Jordan is suitable for the use of the treated wastewater in irrigation, Ibrahim [19] analyzed the water samples from 22 sewage treatment plants from March 2015 to February 2016 and evaluated them using the weighted arithmetic WQI approach. The samples were collected and determined for a total of 15 physiochemical and microbial parameters, and the study followed the JS 893/2006 [16] standards. The study categorized the WWTPs based on the performance from the WQI values.
The CCME water quality index (CCME WQI) provides an easy means of comprehending the complex water quality data so that the general audience can easily understand the quality of water. The index is inclusive of three elements, such as scope, frequency, and amplitude. Various studies, conducted across the globe, especially in the Arab and Middle East and North African (MENA) region [20,21,22,23,24], have preferred the CCME WQI as an index to measure the quality of water. Especially in the systematic review [25], the authors quoted that the CCME and NSF models are widely used in analyzing the WQI across the globe. In addition to this, the study also utilized the fourth edition of the Jordanian standard JS 893:2021, published in 2021, for assessing the quality of the reclaimed wastewater. The Jordanian Standard No. 893:2021 for the reclaimed domestic wastewater was issued on 30 June 2021, and according to the standards, the reuse of the reclaimed wastewater is grouped under three categories, such as the discharge of the reclaimed effluent to streams and water bodies, discharge to groundwater (recharge), and its reuse for crop irrigation [26]. In 2011 [27], the Ministry of Water and Irrigation, Jordan, assessed the wastewater quality in terms of microbial presence during different climate scenarios. This investigation analyzed heterotrophic counts and total coliform and fecal coliform (in general gastrointestinal coli) and found that the acinitobacteria and aeromonas, as well as enteric bacteria, were abundantly found in water samples. Further, an increase was also observed in heterotrophic count from one sampling site to the other. Al-Quraan et al. [28], assessed the bacterial contamination and its mutagenic potential from the wastewater reclaimed from the Al-Samra WWTP in Jordan, while the study geography was between KsWWTP and KTD. As per the study outcomes, the water samples were highly contaminated with opportunistic pathogenic bacteria as well as coliforms, though there was no specific prevalence pattern found in the study locations. The study identified the impact of temperature differences upon the coliform and bacterial count. Since all the water samples showed high and positive mutagenic activity, the study recommended increasing the disinfection efficacy at the WWTPs. Saadoun et al. [29] analyzed the presence of waterborne pathogenic viruses in the Al-Zarqa River, Jordan, in order to assess the quality of surface water. For this study, the authors collected 33 varying water environmental samples, such as effluents, river water, and raw sewage, over a span of 11 months. The study outcomes found the presence of hepatitis A virus, norovirus, astrovirus, and human adenovirus 40/41, among which the enteroviruses were found in 21 samples.
Horton introduced the concept of WQI in 1965, while the weighted arithmetic mean quality index (WAWQI) is a modified version of Horton’s formula that was proposed and validated by Brown et al. [30], comprising nine parameters such as DO, coliforms, pH, temperature, BOD, total phosphate, nitrate concentrations, solid content, and turbidity [30]. Various studies have utilized this measure in different countries and also compared it with the CCME index, such as Jordan [31,32,33,34], India [35,36], Iraq [37], Egypt [38,39], Ecuador [40], Nigeria [41], Bangladesh [42], Turkey [43], and so on. In the comparative analysis [37] conducted between CCME and WAWQI in an Iraqi setting, the authors concluded the lenient nature of the WAWQI method in determining the quality of water while also recommending it is highly appropriate to be applied in Iraqi settings, owing to the fluctuating pollution sources and its higher sensitivity pertaining to toxic contaminants than the CCME WQI method. In a Jordanian setting [34], the study concluded by giving an edge to CCME-WQI in terms of water quality and its flexibility compared to WA-WQI, though the study confirmed the presence of a statistically significant difference between the two metrics. According to Că Călmucet al. [44], some of the most commonly measured water quality parameters in WAWQI include pH, BOD, COD, DO, P-PO43−, N-NO3−, N-NO2−, N-NH4+, SO42−, Cl−, Cr-total, Pb2+, Cd2+, Ni2+, Fe-total, Mn-total, Zn2+, and As2+. The method has a few advantages, such as the importance that it provides to every parameter and its interpretation to understand the suitability of both surface and underground water for consumption. However, this measure suffers from a few drawbacks, such as it only quantifies the direct pollution effect and may not provide the real-time scenario of the water quality, while it also fails to include all the parameters that decide the water quality. On the other hand, Chidiac et al. [30] listed a few pros and cons of this method; for instance, numerous quality parameters are calculated using mathematical equations for rating and grading, while the policymakers and citizens find it easy to interpret. However, if a single parameter value goes bad, then the whole WQI gets impacted. Further, no real-time analysis and over-emphasis on a single bad parameter may affect the WQI’s outcomes.
In this introduction, the current study focuses on evaluating the quality of water flowing in the Zarqa River (ZR) to ensure its suitability for agricultural use, according to the Jordanian standards. When surveyed among adult Jordanians, most of the respondents acknowledge the benefits associated with wastewater reuse, though they prefer to accept it only after experts and health organizations’ approval [5]. So, the current study is an important contribution to this research domain in the absence of comprehensive studies. To the best of the authors’ knowledge, no other study has been conducted in this specific geographic setting and with the parameters considered for this study. Though various studies have been conducted earlier [10,14,15,16,17] assessing the quality of the reclaimed wastewater in Jordanian WWTPs under different standards [4,17,18]—JS 893:2006; [16]—JS 1766:2014 [45] and US Salinity Laboratory classification scheme), there is a dearth of holistic studies that assessed the quality of the reclaimed wastewater in the Zarqa River as per the Jordanian standards (JS 893:2021) [9], CCME water quality index, weighted arithmetic WQI, and the microbial assessment. Thus, the current study is a first-of-its-kind attempt to fill this research gap that can help the governments, policymakers, public health authorities, municipalities, industries, and water management bodies to take necessary initiatives to increase the quality of wastewater, increase the awareness about wastewater reuse, avoid the wastage of reclaimed water, mitigate the environmental issues, and create a nexus among water, energy, food, and the ecosystem by adhering to the water usage guidelines set by the Jordanian government.
2. Materials and Methods
2.1. Study Area
The Amman Zarqa River Basin, with 3900 km2 in area, is one of the most important surface water basins in Jordan, which provides water for agricultural production within the basin and beyond (Figure 1). It is about 42 Km long, and the surface runoff of this river dilutes the treated wastewater of the As-Samra wastewater treatment plant before reaching King Talal Dam (Figure 1). The Zarqa basin makes up about 4% of Jordan’s area; it includes big cities such as Amman, Zarqa, Jarash, part of Al-Mafraq, and part of Al-Balqa. The Zarqa River starts from Wadi Abdoun in Amman at Ras El-Ein spring, goes through Russeifa and Zarqa until it joins Wadi Dhulail, and ends at King Talal Dam. Seven sites were selected to represent the variable features of the river:
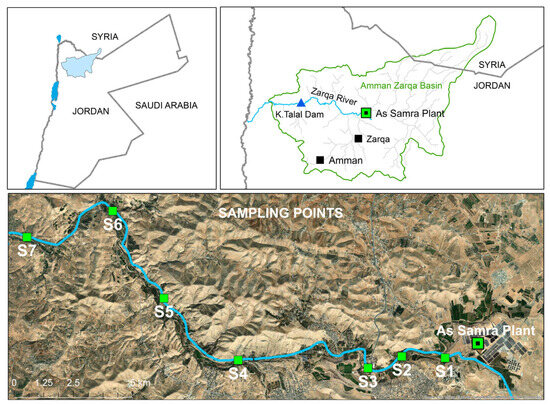
Figure 1.
Location of Amman Zarqa Basin, Zarqa River, Samra plant, and sampling locations.
- -
- S1: Effluent of the treatment plant.
- -
- S2: Near the first urban area on the river after the treatment plant.
- -
- S3: Mixing point between Zarqa River and another branch coming from Amman.
- -
- S4 to S7: Points defined near major human activities, mainly agricultural activities and poultry farms
For this study, a total of 168 samples were collected from seven different sites along the Zarqa River over a period of 24 months (October 2021 to September 2023). The standard quality is composed of 38 physiochemical and microbial parameters, with a distinct upper or lower limit for each aforementioned category. However, the data were collected for 29 physiochemical and microbial parameters cited in the JS 893:2021 [9], such as pH, TDS, DO, COD, BOD (biological oxygen demand), and E. coli. Further, the presence of Cl−, Na+, Ca, K+, Mg+2, NO3, PO4, HCO3, SO4, Fe, Cu, Pb, Mn, and Co (in mg/L) were also determined based on the methods shown in Table 1. In addition to this, this study also analyzed the water samples for the presence of microbes such as clostridium, E. coli, intestinal Enterococci, heterotrophic plate count, Clostridium perfrings, norovirus, adenovirus, SARS-CoV-2 (COVID-19), and Cryptosporidium. The collected water samples were assessed for the study parameters using the techniques with reference to the literature [14], as shown in Table A1 in Appendix A. Table A2 (shown in Appendix A) lists the categories according to the JS 893:2021 [9] in terms of discharge and irrigation purposes, which act as a reference for validating the parameters under consideration. Based on this reference limit, the collected data were validated, and the optimal sites for the best and the worst water quality were determined.

Table 1.
Descriptive statistics for five parameters for seven different sites.
The CCME WQI primarily depends on the measures of scope, frequency, and the amplitude of excursions from the guidelines. Based on the WQI values calculated, the following classification is applied for the CCME WQI categories. According to the original user manual published in 2001, four parameters sampled in a year at least four times should be used for determining the CCME WQI values. Various United Nations Environment Programs have adopted the CCME WQI to rate the quality of water. As per the recent report published in 2017, at least 8 parameters are recommended and not more than 20 parameters. Further, for rivers and streams, the recommended number of samples per year would be 10. In accordance with these guidelines, the authors collected the water samples from the Zarqa River and deduced the CCME WQI scores by following the steps briefed in the methodology section [45]. Various physicochemical parameters as per the JS 893: 2021, such as maximum concentrations of the minerals, heavy metals, and salts were found in different sites (Table 2). The categories, scores, and their respective descriptions for the water quality (Table 3).
Table 2.
Mean values for various physiochemical parameters as per the JS 893: 2021.
Table 3.
Primary values under each irritation category required for calculating CCME WQI.
2.2. Calculating the CCME WQI
As mentioned earlier, WQI has three components, for which the descriptions are given below. Scope (F1) denotes the percentage of variables that failed to fulfill the guideline values at least once in the time period considered and are declared as the failed variables with reference to the overall count of variables under study. Frequency (F2) corresponds to the percentage of individual tests that failed to fulfill the guideline values, and Equation (2) is used to calculate the frequency.
F3 (Amplitude) corresponds to the deviation value for the failed test out of the required value. For determining F3, at first, the deviation, i.e., an individual parameter value that is more or less than the baseline value, should be calculated. Equation (3) is to be used if the test value must not exceed the objective, while Equation (4) should be used if the test value should not be lower than the objective.
By summing all the deviations and dividing the value by the number of tests conducted, it is possible to arrive at the normalized sum of deviations (NSDs) as shown in Equation (5).
From these equations, the F3 (amplitude) is calculated using Equation (6).
After calculating all three values (F1, F2, and F3), the CCME WQI value is calculated as given in Equation (7).
The number ( = 1.732) ensures that the values obtained earlier are normalized in the range of 0 to 100, in which 0 is the worst and 100 represents the best in terms of water quality. Table A3 (shown in Appendix A) lists the categories, score achieved, and the description for the CCME water quality index [46]. The weighted arithmetic water quality index was mentioned in Table A4 (shown in Appendix A). In the current study, five water quality variables (TDS, COD, BOD, DO, and E. coli) were analyzed. During the study period, seven samples were collected from seven different sites on a monthly basis, from which the F1, F2, and F3 values were calculated based on the standard value from the literature. Based on these values, the CCME WQI values were calculated in the range of 0–100 and are tabulated.
2.3. Calculation of Weighted Arithmetic WQI
Weighted arithmetic WQI is calculated as briefed in this section as described elsewhere [30,31,47]. In the first step, the parameters monitored in this study are considered. In the current study, the authors considered four parameters, such as TDS, BOD, COD, and DO, while the collected data were compared against the Jordanian standards, and the WAWQI was calculated. Following is the formula (Equation (8)) used for the calculation of WAWQI. The scores, categorization, and applicability of these WAWQI scores as shown in Table 4. The classification of water quality based on the WAWQI scores was adopted from Table A4 in Appendix A
Table 4.
Water quality index (WQI) scores secured by the sites and irrigation categories.
Here, Qi denotes the water quality rating for the ith parameter, and Wi corresponds to the unit weight of the ith parameter. In this equation (Equation (9)), Qi is calculated using the following formula.
In this equation, Vi denotes the obtained values of the ith parameter at a given sample site, while Vid corresponds to the ideal value of the ith parameter in pure water, and Si denotes the standard permissible value of the ith parameter. For all the parameters, the Vid remains zero except for pH (the ideal value should be 7) and dissolved oxygen (the ideal value should be 14.6 mg/L), respectively. In Equation (8), the second component, i.e., unit weight (Wi), is inversely proportional to the recommended standard value (Si) for the parameter under consideration and is calculated using the equation (Equation (10)) given below.
Here, K denotes the constant of proportionality, whereas Si corresponds to the standard value of the ith parameter under consideration. The proportionality constant is calculated using the following equation (Equation (11)):
In addition to these two metrics (CCME WQI and WAWQI), the current study also analyzed the water samples for the presence of microbes such as clostridium, E.coli, intestinal Enterococci, heterotrophic plate count, Clostridium perfrings, norovirus (RNA), adenovirus (RT-PCR method), Cryptosporidium (real-time PCR), and SARS-CoV-2 (COVID-19) (real-time PCR). Based on the detection kit used, the interpretation of the samples is based on a characteristic amplification curve on both the FAM (sample) and HEX (internal control) channels. Samples that showed a Ct value below or equal to 40 were considered positive with internal control below or equal to 36. The obtained data for all the parameters considered in this study were analyzed for descriptive statistics using SPSS (version 25.0). The outcomes were compared against the standard values and interpreted.
3. Results
The current section discusses the results obtained from the data analysis, while three sub-sections are included, such as the analysis as per the JS 893:2021 standard, CCME WQI standards, weighted arithmetic WQI method, and microbial assessment.
3.1. Assessment of the Parameters as per the JS 893:2021 Standard
Table 1 shows the descriptive statistics for five parameters as per the JS 893:2021 standards. As shown in Table 1, Site 7 showed the highest mean value (1363), and Site 1 had the lowest mean value (1227) for TDSs, while the maximum value was still less than the Jordanian standards threshold (1500). In the case of DO, the maximum mean value (7.24) was found at Site 7, while the least (6.87) was found at Site 1. However, the mean values of all the sites were higher than the prescribed limits. In the case of COD, the mean value was the highest (103) at Site 1, while it was the lowest at Site 7 with a mean value of 66. With regard to BOD, the highest mean value (31.80) was found at Site 1, while the lowest mean value (19.31) was found at Site 7. In terms of E.coli, the highest mean value (70904) was achieved at Site 6, while Site 1 achieved the lowest mean value of 3352.04. All the sites have mean TDS values less than the threshold as per the Jordanian standards. In the case of DO, no site was able to meet the criteria, while in terms of COD, the water quality at Sites 1 and 2 can be applied for parks, playgrounds, and roadsides inside the cities (A). In terms of BOD, both Sites 1 and 2 had water quality levels that can be utilized for irrigating crop A category.
Table 2 shows the mean values for the physicochemical parameters considered in this study. From Table 2, it can be inferred that the maximum concentrations of the minerals, heavy metals, and salts were found in different sites, such as Site 2 (K+ and NO3), Site 3 (Cl−, Na+), Site 5 (Ca, Cu, and HCO3), Site 6 (pH and Fe), and Site 7 (Mg2+, PO4, and SO4). Out of these, Site 5 and Site 7 showed the highest concentrations of the minerals, while Site 1 and Site 4 attained no maximum concentration for the parameters considered. In terms of pH, all the study sites had pH values within the acceptable range (6–9) for irrigation purposes, though Site 6 recorded the highest pH (7.97) among the sites. The study sites recorded acceptable levels of Cl, Ca, and SO4 since the concentration observed in all the study sites was below 500 mg/L, 230 mg/L, and 500 mg/L, i.e., the permissible limit in the JS 893/2021 [9] standards for treated wastewater to be used for irrigation purposes. Site 7 recorded the exact permissible level for Mg2+ (60.469 mg/L), while all other sites recorded lower values for this parameter. For Na+ and NO3 concentrations, all the study sites observed values that are higher than the permissible limits of 230 mg/L and 20 mg/L, respectively. Though a few sites recorded higher values, such as Site 7 (35.58 mg/L), Site 2 (20.98 mg/L), and Site 3 (5.09 mg/L), the PO4 concentration was found to be lesser in all other study sites. As mentioned earlier, in terms of heavy metals, Fe, Pb, Mn, and Co were found to be less than or in negligible quantities in all the study sites, whereas Cu was found to be higher than or equal to the permissible level in Sites 3 and 5. According to the JS 893/2021 classification, there is no specific threshold given for potassium (K+). However, it plays an important role in boosting plant growth along with N and P. The maximum concentration of K+ was found at Site 2, followed by Site 7 and Site 1.
3.2. CCME Water Quality Index
Table 3 shows the number of failed variables versus the total number of variables and the failed tests versus the total number of tests. From these values, the F1, F2, and F3 values were determined, and using the equation quoted earlier, the WQI scores were calculated and tabulated in Table 4. As per Table 4, all the samples that were good choices to be used for irrigation purposes for the crops fall under category C (industrial crops, field crops, and forestry). The water quality at Site 1 was found to be good for drainage purposes and for irrigation crops (B), while it remains a poor choice for the categories (A and D). The water quality at Site 2 was found to be fair for drainage and irrigation crops (A). Site 3 remains a fair choice for drainage and B crop, while Sites 4 and 5 remain a fair choice for drainage and B crop. Site 6 has only marginal quality, whereas Site 7 has a fair quality for drainage and B crop. On the whole, it can be said that all the water samples collected at different sites do not meet the criteria to be used for irrigation crops A and D, i.e., parks, playgrounds, and roadsides inside the cities (A) and flowers (D), while the water quality of all the sites was good to be used for industrial crops, field crops, and forestry (C).
3.3. Weighted Arithmetic Water Quality Index (WAWQI)
Table 5 shows the mean values of all four parameters considered for the study conducted at seven different sites.
Table 5.
Mean values of all four parameters for WAWQI.
The standard permissible values of the parameters were followed as per the Jordanian standards, shown in Table 2. According to the WAWQI method, the ideal parameter value for dissolved oxygen (DO) should be 14.6, whereas the rest of the three values should be considered as zero. In line with this, the values for the proportionality constant and obtained values of the parameters were calculated. Based on these values applied in Equation (8), the following WAWQI scores have been obtained in the current study, shown in Table 5.
As shown in Table 6, the water quality for drainage purposes in all the sites was found to be within the poor water quality level and can be used for irrigation and industrial purposes. While the water found in all the seven sites cannot be used for irrigation of B and C crops, proper treatment is required before use. Though the sites had very poor water quality, the water can still be used for irrigation of A crops as per the table. None of the sites achieved good or excellent water quality, an important finding that alarms the concerned authorities to emphasize the importance of water treatment and riverbed infiltration processes.
Table 6.
WAWQI scores obtained from all seven study sites.
3.4. Microbial Assessment
The microbial data in Table 7 were analyzed using descriptive statistics, including mean, standard deviation, minimum, and maximum, to summarize the observed concentration ranges. These values reflect colony-forming units (CFUs) per 100 mL, except for heterotrophic plate count, which is expressed in CFU/mL. Table 7 shows the descriptive statistics for the microbes, such as intestinal Enterococci, heterotrophic plate count, Clostridium perfrings, and Clostridium. Among the sites under study, the highest mean value (77) for Clostridium was found at Site 7, with Site 1 being the lowest (17.88). In terms of intestinal Enterococci, the highest mean value was obtained at Site 6 (397), while the lowest mean value was obtained at Site 1 (34.08). With regard to heterotrophic plate count, Site 6 achieved the highest mean value (165,777), with Site 1 achieving the lowest value of 3719. With regard to Clostridium perfrings, the highest mean value was achieved at Site 4 (883), while Site 1 achieved the lowest value of 45.33.
Table 7.
Descriptive statistics for microbes at seven different sites.
Table 7 shows the presence of other microbes, such as norovirus, adenovirus, SARS-CoV-2, and Cryptosporidium, considered for this study and their frequency levels. In terms of norovirus, Table 8 shows that site 5 recorded the highest value (37.5%), with the lowest value (12.5%) being recorded at Site 7. With regard to adenovirus, the highest value (75%) was achieved at Site 6, whereas the lowest mean value (37.5%) was attained at Site 2. In terms of SARS-CoV-2, the highest mean value was obtained at Site 3 (70.8%), while the lowest (41.7%) was achieved at Site 7 (Table 8). Cryptosporidium was reported at high levels at Site 7 (66.7%), whereas Site 6 reported the lowest value (41.7%) (Table 8).
Table 8.
Presence of various microbes and their frequencies at different sites.
4. Discussion
The current study analyzed the quality of water flowing in the Zarqa River at seven different places for a period of 24 months by considering five parameters according to the Jordanian standard (JS 893:2021) [9] and the CCME water quality index and four parameters for the weighted arithmetic WQI, while the water samples were also analyzed for their microbial presence (nine microbes). In terms of Jordanian standards, Site 1 had the lowest TDS and DO values along with E. coli concentration, whereas it had the highest COD and BOD values. In terms of TDSs, all the sites were under the threshold set by the JS 893:2021. These findings are in line with the literature (13), in which the authors achieved TDS levels below the JS 893:2021. In terms of dissolved oxygen (DO), Site 1 had the lowest value (6.877), while the highest value was obtained at Site 7 (7.24). In previous studies [48], it was found that the annual average DO values for the WWTPs in Jordan were consistent with the treated wastewater standard (1 mg/L). The current study considered the JS 893:2021 for reclaimed wastewater to be used for irrigation purposes only. For that, any value higher than 1 or 2 can be used for drainage as well as for irrigation of all A and D types of crops. So, the water quality in all the study site samples has good dissolved oxygen for irrigation purposes. If the BOD is higher, then the oxygen in the water gets depleted rapidly, which in turn affects the aquatic life, reduces the quality of water, and damages the ecosystem. In this study, Site 1 and Site 7 had the highest and lowest mean values for BOD, respectively. From Site 1 to Site 7, the BOD values got reduced, which should be noted down since the same phenomenon was observed in an earlier study as well [17]. This phenomenon indicates that the water quality recovers downstream. In other terms, the water quality at Site 1 and Site 2 (to a negligible extent) is usable and can be applied for the irrigation of A crops, whereas the water quality at other sites does not meet the Jordanian standards for irrigation of the crops or drainage. This finding is in line with the literature [49,50], in which the authors found that the BOD tends to increase with the trendline, especially from the industrial reclaimed wastewater. Further, this study also found that the BOD tends to increase for domestic wastewater too. In previous studies [8], As-Samra and Mafraq WWTPs were found to have the lowest BOD removal efficiencies in comparison with 18 other WWTPs.
In a previous study [17], the authors confirmed the strong dependency between Na and Cl with that of the TDSs. The study further confirmed that the pH value tends to increase towards the downstream, which is found to be correlating with the current study outcomes. According to 51. Shtull-Trauring et al. [51], it is a common phenomenon to observe the presence of high concentrations of N, P, and K in treated wastewater compared to freshwater. Though the application of reclaimed wastewater is highly helpful for the farmers to accomplish irrigation in terms of additional water source and high nutrient content (N and P), it is environmentally harmful since leaching of excess nutrients occurs, which eventually results in eutrophication and the degradation of the aquatic ecosystems. In the current study, Site 2 recorded the maximum K concentration, while in all the study sites, the Cl, Ca, and SO4 levels were within the acceptable limits. As confirmed [13], the presence of heavy metals in the river water tends to vary according to the site and the season. This has been confirmed in the current study outcomes too, since the maximum levels of the parameters considered were found in different sites, such as Site 2 (K+, NO3, and Cu), Site 3 (Cl- and Na+), Site 5 (Ca and HCO3), Site 6 (pH and Fe), and Site 7 (Mg2+, PO4, and SO4). Out of these, Site 2 and Site 7 showed the highest concentrations of the minerals, while Site 1 and Site 4 attained no maximum concentration for the parameters considered. No study sites showed detectable levels of Pb, Mn, and Co.
In terms of COD, Site 1 and Site 2 had the water quality that can be used for the purpose of irrigating A category crops, while the water from Site 7 can be used in case of irrigating D category crops. All the sampling sites varied from one another in terms of COD, while a declining pattern was observed from Site 1 to Site 7. This outcome is in line with the research [17] in which the authors confirmed that both BOD and COD tend to reduce towards the downstream. If the COD value is higher, then the waterborne organic pollution also increases. The study conducted earlier [8] upon Ramtha WWTP achieved an efficiency of 75% for COD removal. But the effluents discharged by the WWTPs contained higher concentrations of COD, up to a range of 1880 mg/L. However, the updated plant was able to achieve 98% COD removal efficiency compared to the old plant. In terms of E. coli, Site 6 recorded the highest mean value (7,0904.17), while Site 1 exhibited the lowest mean value (3352.04). Based on E. coli concentration, the water from Sites 1–7, excluding Site 6, is under the threshold for irrigating B crops. So, the water can be used for irrigating fruit trees roadside outside the cities and green areas. This finding is in line with the literature [8,14,18], which confirmed that the E. coli concentration remains the highest contributor to the WQI value. Further, the study also accomplished similar results: higher E. coli concentration than the Jordanian standards. In terms of the CCME water quality index outcomes, the water quality from all the study sites was good to be used for C crop irrigation purposes (industrial crops, field crops, and forestry). The water quality and the respective choices are as follows: Site 1—drainage, crop B; Site 2—drainage, crop A; Site 3—drainage, crop B; Site 4 and Site 5—drainage and crop B; Site 6 has a negligible quality, while Site 7 can be used for drainage and crop B. On the whole, the water quality from most of the sites was found to be suitable for drainage and for irrigating the B crop category. On the other hand, none of the water samples collected from the seven sites can be applied for irrigating the crops A and D. These findings are in line with the literature [14,15] that confirmed the appropriateness of using WQI as a reliable parameter to determine the quality of water.
In terms of weighted arithmetic WQI outcomes, none of the study sites were able to achieve good or excellent water quality levels, whereas the water quality found in all seven study sites can either be used for drainage purposes or for the irrigation of A-category crops. On the other hand, the water quality in all seven study sites cannot be applied for the irrigation of B and C category crops. These findings may contradict the findings achieved by CCME values, and a few reasons might be attributed to this. As mentioned earlier [30], if a single parameter goes bad in WAWQI, then the whole WQI score gets affected, which can be understood from the current study outcomes as well. Further, the WAWQI scale has more than fifteen parameters, while the current study considered only four parameters based on the feasibility of data collection. This may have brought bias into the outcomes since the scale (WAWQI) itself suffers from overemphasizing a single bad parameter. This study limitation can be overcome by future studies since the outcomes contradict each other. In general [40], the WAWQI gets influenced by the parameters with the minimum threshold value for the parameter, while in the case of CCME-WQI, the maximum threshold value is considered for the calculations, and the bias can be understood from the current study outcomes too. In the existing studies [31,34,41], the applicability of WAWQI has been highly recommended for its sensitivity to toxic metal contaminants since the unit weight calculation method is applied in determining the WQI, while the CCME method considers the scope, frequency, and amplitude of the parameters due to which the values are moderate to all the contaminants.
All the study sites reported the presence of microbes under study, while it can be inferred that Site 6 reported the maximum number of microbes (high to low = intestinal Enterococci, heterotrophic plate count, adenovirus, Cryptosporidium), followed by Site 7 (high to low = Clostridium, Cryptosporidium, SARS-CoV-2, and norovirus), Site 5 (highest = norovirus), Site 4 (highest = Clostridium perfrings), and Site 1 (lowest = intestinal Enterococci, heterotrophic plate count, Clostridium perfrings). Though the presence of microbes is not included in the JS 893:2021 [9] standards, Andrianjakarivony et al. [52] analyzed it, as the reclaimed wastewater may contain pathogens and can affect the aquatic environment as well as other biological ecosystems. In the literature [53], the prevalence of human adenoviruses has been reported in groundwater as well as irrigation water from the discharge basins located in Riyadh, Saudi Arabia. So, it is crucial to determine the presence of adenoviruses since it is a direct threat to public health. Further, Saadoun et al. [29] found that the surface water from the Al-Zarqa River exhibited a positive response for enteroviruses, norovirus, astrovirus, human adenovirus, and so on. According to Wu et al. [54], the presence of SARS-CoV-2 remained higher in the treated wastewater collected from the major urban wastewater treatment facility in the US. Though there is no such evidence available so far in the context of Jordan, the current study is the first to report it.
The authors of [18] suggested having advanced treatment methods to reduce the concentration of E. coli in the reclaimed wastewater from the WWTPs. With the expansion of cultivable land, population growth, limited water resources, drastic reduction in groundwater levels, and climate change, it is the need of the hour to save and judiciously use the available water resources and find optimal usage of the treated wastewater. The study analyzed wastewater effluent from two Jordanian phosphate mines and compared its standards with those of the national/international standards in terms of wastewater effluent treatment process. Since the presence of heavy metals like cobalt in the treated wastewater is an alarming concern, the author suggested investing in effluent wastewater treatment methods to achieve sustainable water management [1]. This outcome was supported by an intervention introduced by a phosphate-mining company in Jordan, which achieved a 30% reduction in water consumption [55]. According to [56], it was proved that the reclaimed wastewater can fulfill the freshwater demand from the industries in three governorates, such as Amman, Zarqa, and Aqaba. The study further established the benefits of WWTPs in terms of reducing water depletion, mitigating climate change issues, and also positive energy recovery. Thus, it is of immense importance to improve the adherence to Jordanian standards for reclaimed wastewater usage. Being a waterborne intestinal parasite, Cryptosporidium has been rarely studied in the context of Jordan [57], and so, the current study found the presence of this microbe. This finding demands that the presence of this microbe be further investigated in future studies.
In the study [58], the authors validated the efficiency of Jordanian natural zeolite samples in removing the nickel from aqueous solutions, and the authors achieved a significant removal of that heavy metal. Likewise, future studies can focus on removing the heavy metals in the reclaimed wastewater so that the agricultural food chain and health nexus can be safeguarded from heavy metal contamination. The presence of high concentrations of Na and K might be attributed to high evaporation rates, fertilizer runoff from the agricultural activities, and livestock waste [30]. So, it is important for the authorities to create awareness campaigns in a holistic manner towards the disposal of agricultural waste and water treatment at their own farms. Some of the limitations of this study include limited sample size collected over a period of 24 months since only seven sites were selected; selection bias may affect the generalizability of the study outcomes across the WWTPs in Jordan. Further, the current study considered only a few parameters from the JS 893:2021 [9], while future studies must include other physiochemical parameters to determine the quality of the reclaimed wastewater from the WWTPs. The current study has considered one national (Jordanian standard) and two international standards (Canadian WQI and WAWQI), while various such standards are followed across the globe. The future studies should compare and contrast the data with the established WQI standards, especially the ones followed in the MENA region. The quantity of minerals, salts, and heavy metals in the reclaimed wastewater can be tracked down from the site where the treated wastewater is released into the river to the site where the water reaches the consumer, i.e., for irrigation purposes. Thus, it is possible to monitor the sites where the runoff from the local areas contributes to increasing or decreasing the concentration of the heavy metals [59,60].
5. Conclusions
The current study focused on evaluating the quality of reclaimed wastewater flowing in the Zarqa River (ZR) to ensure its suitability for agricultural use, according to the Jordanian and Canadian WQI and WAWQI standards. Based on the study outcomes, it can be inferred that the water quality, collected from the study sites, should be improved. In addition to the government’s initiatives, it becomes the responsibility of the general public, industries, and the farmers to be aware of the consequences of environmental pollution in terms of yield, crop failure, production, quality, and health-associated disorders. So, the governments must conduct periodical audits on the industries that are upstream and downstream of the study location in terms of pollutant discharge, wastewater treatment plants, safe removal procedures, etc. Further, there should be a comprehensive knowledge and awareness program conducted for the farmers along the Zarqa River since agrarian waste, being dumped either directly or indirectly into the river, has a primary contribution towards increasing pollution. Though the fertilizer usage increases the NPK concentration in the water, it also has serious consequences due to its high concentration in terms of leaching, turbidity, etc. So, the farmers can be introduced to and aided by the governorates to follow riverbank infiltration since the solution is an affordable yet efficient alternative for water treatment. Instead of dumping the agrarian waste directly into the river, the farmers should be advised and monitored for following riverbank infiltration procedures so as to minimize the pollution, since there are no chemicals involved in this process for cleaning the water as well as its lower cost. So, the policymakers are advised to incorporate advanced technologies for reclaiming the wastewater and adhere to the guidelines set by the Jordanian standards. The current study is a valuable contribution to this research domain, while future studies may be helpful in improving the availability of freshwater for agricultural and industrial purposes.
Author Contributions
Conceptualization, R.A. and A.P.B.; methodology, R.A. and A.P.B.; software, R.A. and A.P.B.; validation, R.A. and A.P.B.; formal analysis, R.A.; investigation, R.A.; resources, R.A. and A.P.B.; data curation, R.A.; writing—original draft preparation, R.A.; writing—review and editing, R.A.; visualization, R.A.; supervision, A.P.B.; project administration, R.A. All authors have read and agreed to the published version of the manuscript.
Funding
This research received no external funding. Open Access Funding by TU Wien.
Institutional Review Board Statement
Not applicable.
Informed Consent Statement
Not applicable.
Data Availability Statement
The data presented in this study are available upon request from the corresponding author.
Acknowledgments
The authors express their gratitude to the National Center for Agricultural Research (NARC) for supporting this research and to the Ministry of Water and Irrigation for providing access to field sites, data, and laboratories. Special thanks to Abdulmajeed Al-Ajlouni from Jordan University of Science and Technology for his assistance with PCR analyses and reporting.
Conflicts of Interest
The authors declare no conflicts of interest.
Appendix A
Table A1.
Parameters and the techniques used for calculation.
Table A1.
Parameters and the techniques used for calculation.
| S. No. | Parameter | Unit | Technique/Apparatus Used |
|---|---|---|---|
| 1. | TDS | mg/L | Portable waterproof meter (instruments: Hanna, Hl98194) |
| 2. | DO | mg/L | Titration method |
| 3. | COD | mg/L | Closed reflux colorimetric method (5220D) (instrument: spectrophotometer (DR 3900 Hach)) |
| 4. | BOD | mg/L | OxiTOP respirometric method (5210D) |
| 5. | E. coli | MPN/100 mL | Enzyme substrate test method (9223B) |
| 6. | pH | SU | Hanna waterproof pH tester |
| 7. | Bicarbonate | mg/L | Flame emission photometric method |
| 8. | Heavy metals | mg/L | ICP-OES method |
| 9. | Calcium (Ca2+) | mg/L | EDTA titrimetric method |
| 10. | Magnesium (Mg2+) | mg/L | EDTA titrimetric method |
| 11. | Sodium (Na+) | mg/L | Flame emission photometric method |
| 12. | Potassium (K+) | mg/L | Flame emission photometric method |
| 13. | Chloride (Cl−) | mg/L | Argentometric method |
| 14. | Phosphate PO43− | mg/L | Stannous chloride method |
| 15. | Nitrate (NO3−) | mg/L | Spectrophotometer (ultraviolet spectrophotometer screening method) |
Source: Hadidi and Hadidi [17].
Table A2.
Jordanian 893:2021 standards’ categories and their respective reference values for the parameters considered.
Table A2.
Jordanian 893:2021 standards’ categories and their respective reference values for the parameters considered.
| S. No. | Parameter | Discharge | Irrigation | ||||
|---|---|---|---|---|---|---|---|
| Streams, Wadis, and Water Bodies (Drainage) | Groundwater Recharge | Parks, Playgrounds, and Roadsides Inside the Cities (A) | Fruit Trees Roadside Outside the Cities and Green Areas (B) | Industrial Crops, Field Crops, and Forestry (C) | Flowers (D) | ||
| 1. | BOD5 (mg/L) | 60 | 15 | 30 | 100 | 200 | 15 |
| 2. | COD (mg/L) | 150 | 50 | 100 | 200 | 300 | 50 |
| 3. | DO (mg/L) | >1 | >2 | >2 | - | - | >2 |
| 4. | E. coli (MPN/100 mL) | 1000 | <1.1 | 100 | 10000 | - | <1.1 |
| 5. | TDS (mg/L) | 1500 | 1500 | 1500 | 1500 | 1500 | 1500 |
| 6. | pH | 6–9 | |||||
| 7. | Cl− (mg/L) | 500 | 500 | 500 | 500 | 500 | |
| 8. | Na+ (mg/L) | 200 | 230 | 230 | 230 | 230 | |
| 9. | Ca (mg/L) | 200 | 230 | 230 | 230 | 230 | |
| 10. | K+ (mg/L) | ||||||
| 11. | Mg+2 | 60 | 100 | 100 | 100 | 100 | |
| 12. | NO3 (mg/L) | 20 | - | 16 | 16 | 16 | 16 |
| 13. | PO4 (mg/L) | 5 | 10 | 10 | 10 | 10 | |
| 14. | HCO3 (mg/L) | 400 | 400 | 400 | 400 | 400 | |
| 15. | SO4 (mg/L) | 500 | 500 | 500 | 500 | 500 | |
| 16. | Fe (mg/L) | 5.0 | |||||
| 17. | Cu (mg/L) | 0.2 | |||||
| 18. | Pb (mg/L) | 0.2 | |||||
| 19. | Mn (mg/L) | 0.2 | |||||
| 20. | Co (mg/L) | ||||||
Source: [26,60].
Table A3.
CCME water quality index (2017 manual update).
Table A3.
CCME water quality index (2017 manual update).
| S. No. | Category | Description |
|---|---|---|
| 1. | Excellent: (CCME WQI value 95–100) | Water quality is protected with a virtual absence of threat or impairment conditions very close to natural or pristine levels. |
| 2. | Good: (CCME WQI value 80–94) | Water quality is protected with only a minor degree of threat or impairment; conditions rarely depart from natural or desirable levels. |
| 3. | Fair: (CCME WQI value 65–79) | Water quality is usually protected but occasionally threatened or impaired; conditions sometimes depart from natural or desirable levels. |
| 4. | Marginal: (CCME WQI value 45–64) | Water quality is frequently threatened or impaired; conditions often depart from natural or desirable levels. |
| 5. | Poor: (CCME WQI value 0–44) | Water quality is almost always threatened or impaired; conditions usually depart from natural or desirable levels. |
Source: Canadian Council of Ministers of the Environment WQI 2017 manual update.
Table A4.
Weighted arithmetic water quality index.
Table A4.
Weighted arithmetic water quality index.
| S. No. | Water Quality Category | Calculated Score | Usage Possibilities |
|---|---|---|---|
| 1. | Excellent water quality | 0–25 | Drinking, irrigation, industrial |
| 2. | Good water quality | 26–50 | Drinking, irrigation, industrial |
| 3. | Poor water quality | 51–75 | Irrigation, industrial |
| 4. | Very poor water quality | 76–100 | Irrigation |
| 5. | Unsuitable for drinking purpose | Above 100 | Proper treatment is required |
Source: Tokatli [43].
References
- Johansson, T. Sustainable Water Management in the Jordanian Phosphate Mining Industry. Available online: https://lup.lub.lu.se/luur/download?func=downloadFile&recordOId=9149101&fileOId=9149103 (accessed on 22 June 2024).
- Ministry of Environment, Hashemite Kingdom of Jordan. Water Sector Green Growth National Action Plan 2021–2025. Amman. 2020. Available online: https://www.moenv.gov.jo/ebv4.0/root_storage/ar/eb_list_page/20022_jordan_water_v02_rc_web.pdf (accessed on 15 June 2024).
- International Trade Administration. Environment and Water Sector. 2024. Available online: https://www.trade.gov/country-commercial-guides/jordan-environment-and-water-sector (accessed on 27 June 2024).
- Ministry of Water and Irrigation. National Water Strategy 2023–2040 Summary. 2023. Available online: https://www.mwi.gov.jo/EBV4.0/Root_Storage/AR/EB_Ticker/National_Water_Strategy_2023-2040_Summary-English_-ver2.pdf (accessed on 1 March 2024).
- Tarawneh, A.; Assad, S.; Alkhalil, S.; Suleiman, A. Assessing acceptance of treated wastewater reuse in Jordan: A study of knowledge and preferences. Desalin. Water Treat. 2024, 317, 100030. [Google Scholar] [CrossRef]
- Ministry of Water and Irrigation. National Water Strategy 2023–2040. 2023. Available online: https://www.mwi.gov.jo/EBV4.0/Root_Storage/AR/EB_List_Page/national_water_strategy_2023-2040.pdf (accessed on 1 January 2024).
- Al-Addous, M.; Bdour, M.; Alnaief, M.; Rabaiah, S.; Schweimanns, N. Water resources in Jordan: A review of current challenges and future opportunities. Water 2023, 15, 3729. [Google Scholar] [CrossRef]
- Qteishat, O.; Radideh, J.; Alzboon, K.; Abu-Hamatteh, Z.; Tariq, A.L.; Numan, A.B.U. Wastewater Treatment and Water Reuse Technologies for Sustainable Water Resources: Jordan as a Case Study. Civ. Environ. Eng. Rep. 2024, 34, 177–192. [Google Scholar] [CrossRef]
- JS 893:2021; Water—Reclaimed Domestic Wastewater. Jordan Standards and Metrology Organization: Amman, Jordan, 2021. Available online: https://eservice.jsmo.gov.jo/ar/Standards/IcsAmfn/1306030?title=Sewage%20water (accessed on 10 December 2024).
- Gharaibeh, M.A.; Albalasmeh, A.A.; Obeidat, M.M. Assessment of Water Quality of Key Dams in Jordan for Irrigation Purposes with Insights on Parameter Thresholds. Water 2024, 16, 1726. [Google Scholar] [CrossRef]
- Gharaibeh, M.A.; Marschner, B.; Heinze, S.; Moos, N. Spatial distribution of metals in soils under agriculture in the Jordan Valley. Geoderma Reg. 2020, 20, e00245. [Google Scholar] [CrossRef]
- Al-Mubaidin, M.; Al-Hamaiedeh, H.; El-Hasan, T. Impact of the Effluent Characteristics of Industrial and Domestic Wastewater Treatment Plants on the Irrigated Soil and Plants. Jordan J. Earth Environ. Sci. 2022, 13, 223–231. [Google Scholar]
- Abualhaija, M.M.; Shammout, M.A.W.; Mohammad, A.H.; Hilal, A.H.A. Heavy Metals in water and sediments of King talal Dam the largest Man-Made water Body in Jordan. Water Energy Int. 2019, 62, 49–62. [Google Scholar]
- Abualhaija, M. Applying the quality and pollution indices for evaluating the wastewater effluent quality of Kufranja wastewater treatment plant, Jordan. Water Conserv. Manag. 2023, 7, 6–11. [Google Scholar] [CrossRef]
- Radaideh, J.A. Evaluation of Zarqa River Water quality on suitability for irrigation using the Canadian Council of Ministers of Environment Water Quality Index (CCME WQI) approach. Evaluation 2022, 16, 354–373. [Google Scholar]
- Jordanian Institute of Standards and Metrology (JISM). Jordanian Standards and Guidelines for Reuse in Irrigation in the Hashemite Kingdom of Jordan; Jordanian Institute of Standards and Metrology: Amman, Jordan, 2006. [Google Scholar]
- Al Hadidi, N.; Al Hadidi, M. Suitability of reclaimed wastewater effluent from decentralized wastewater plant for irrigation. Appl. Water Sci. 2021, 11, 173. [Google Scholar] [CrossRef]
- Almanaseer, N.; Hindiyeh, M.; Al-Assaf, R. Hydrological and environmental impact of wastewater treatment and reuse on Zarqa River Basin in Jordan. Environments 2020, 7, 14. [Google Scholar] [CrossRef]
- Ibrahim, M.N. Effluent quality assessment of selected wastewater treatment plant in Jordan for irrigation purposes: Water quality index approach. J. Ecol. Eng. 2019, 20, 206–216. [Google Scholar] [CrossRef] [PubMed]
- Noori, A.A.S.; Hussein, H.A.; Namer, N.S. Influence of adding CuO and MoS2 nano-particles to castor oil and moulding oil on tribological properties. In IOP Conference Series: Materials Science and Engineering; IOP Publishing: Bristol, UK, 2019; Volume 518, p. 032040. [Google Scholar] [CrossRef]
- Ewaid, S.H.; Abed, S.A. Water quality index for Al-Gharraf river, southern Iraq. Egypt. J. Aquat. Res. 2017, 43, 117–122. [Google Scholar] [CrossRef]
- Fashagba, T.S.; Bessedik, M.; ElSayed, N.B.; Abdelbaki, C.; Kumar, N. Evaluating the Water Quality of the Keddara Dam (Algeria) Using Water Quality Indices. Water 2024, 16, 1291. [Google Scholar] [CrossRef]
- Woodward, K.P.; Rajan, A.; Barber, M.C.; Sullivan, E.; Richkus, J.A.; Everett, K.H.; Whaley, M.G. Application of the Canadian Council of Ministers of the Environment Water Quality Index to assess and communicate monitoring data from coastal waters in Abu Dhabi, United Arab Emirates. Aquat. Ecosyst. Health Manag. 2020, 23, 145–153. [Google Scholar] [CrossRef]
- Mahdi, F.; Razzaq, B.A.; Sultan, M. Assessment of Shatt Al-Arab Water Quality Using CCME/WQI Analysis in Basrah City of South Iraq. Iraqi J. Sci. 2023, 64, 480–491. [Google Scholar] [CrossRef]
- Uddin, M.G.; Nash, S.; Olbert, A.I. A review of water quality index models and their use for assessing surface water quality. Ecol. Indic. 2021, 122, 107218. [Google Scholar] [CrossRef]
- United States Agency for International Development. Usaid Water Engineering Services Task 6.2: Technical Support for South Amman Wwtp. 2022. Available online: https://Pdf.Usaid.Gov/Pdf_Docs/Pa00zn4w.Pdf (accessed on 2 January 2024).
- Ministry of Water and Irrigation Jordan. Assessment of Treated Wastewater Quality Under Different Climate Change Scenarios in Jordan. 2011. Available online: http://www.mdgfund.org/sites/default/files/ENV_STUDY_Jordan_AssessmentoftreatedwastewaterQuality.pdf (accessed on 1 March 2024).
- Al-Quraan, N.A.; Abu-Rub, L.I.; Sallal, A.K. Evaluation of bacterial contamination and mutagenic potential of treated wastewater from Al-Samra wastewater treatment plant in Jordan. J. Water Health 2020, 18, 1124–1138. [Google Scholar] [CrossRef]
- Saadoun, I.; Ababneh, Q.; Jaradat, Z. Genomic detection of waterborne enteric viruses as water quality indicators in Al-Zarqa River, Jordan. J. Water Health 2021, 19, 604–615. [Google Scholar] [CrossRef]
- Chidiac, S.; El Najjar, P.; Ouaini, N.; El Rayess, Y.; El Azzi, D. A comprehensive review of water quality indices (WQIs): History, models, attempts and perspectives. Rev. Environ. Sci. Bio/Technol. 2023, 22, 349–395. [Google Scholar] [CrossRef]
- Abualhaija, M.M.; Mohammad, A.H. Assessing water quality of Kufranja Dam (Jordan) for drinking and irrigation: Application of the water quality index. J. Ecol. Eng. 2021, 22, 159–175. [Google Scholar] [CrossRef] [PubMed]
- Ibrahim, M.N. Assessing groundwater quality for drinking purpose in Jordan: Application of water quality index. J. Ecol. Eng. 2019, 20, 101–111. [Google Scholar] [CrossRef]
- Al-Mahasneh, M.; Al Bsoul, A.; Al-Ananzeh, N.; Al-Khasawane, H.E.; Al-Mahasneh, M.; Tashtoush, R. The Characterization of Groundwater Quality for Safe Drinking Water Wells via Disinfection and Sterilization in Jordan: A Case Study. Hydrology 2023, 10, 135. [Google Scholar] [CrossRef]
- Hyarat, T.; Al Kuisi, M. Comparison between weighted arithmetic and Canadian council of ministers of the environment water quality indices performance in Amman-Zarqa Area, Jordan. Jordan J. Earth Environ. Sci. 2021, 12, 295–305. [Google Scholar]
- Patel, D.D.; Mehta, D.J.; Azamathulla, H.M.; Shaikh, M.M.; Jha, S.; Rathnayake, U. Application of the weighted arithmetic water quality index in assessing groundwater quality: A case study of the South Gujarat region. Water 2023, 15, 3512. [Google Scholar] [CrossRef]
- Chandra, D.S.; Asadi, S.S.; Raju, M.V.S. Estimation of water quality index by weighted arithmetic water quality index method: A model study. Int. J. Civ. Eng. Technol. 2017, 8, 1215–1222. [Google Scholar]
- Noori, M.D. Comparative analysis of weighted arithmetic and CCME Water Quality Index estimation methods, accuracy and representation. In IOP Conference Series: Materials Science and Engineering; IOP Publishing: Bristol, UK, 2020; Volume 737, p. 012174. [Google Scholar] [CrossRef]
- Goher, M.E.; Hassan, A.M.; Abdel-Moniem, I.A.; Fahmy, A.H.; El-Sayed, S.M. Evaluation of surface water quality and heavy metal indices of Ismailia Canal, Nile River, Egypt. Egypt. J. Aquat. Res. 2014, 40, 225–233. [Google Scholar] [CrossRef]
- El Sayed, S.M.; Aly, M.Y.; El-Shamy, A.S.; El-Gaar, D.M.K.; Ghallab, M.H. Water quality indices and risk assessment of consumption of nile tilapia tissues from Ismailia Canal, Egypt. Egypt. J. Aquat. Biol. Fish. 2023, 27, 305–324. [Google Scholar] [CrossRef]
- García-Ávila, F.; Zhindón-Arévalo, C.; Valdiviezo-Gonzales, L.; Cadme-Galabay, M.; Gutiérrez-Ortega, H.; del Pino, L.F. A comparative study of water quality using two quality indices and a risk index in a drinking water distribution network. Environ. Technol. Rev. 2022, 11, 49–61. [Google Scholar] [CrossRef]
- Ojukwu, C.K.; Okeah, G.O.C.; Mmom, P.C. A Comparative Analysis of the Weighted Arithmetic and Canadian Council of Ministers of the Environment Water Quality Indices for Water Sources in Ohaozara, Ebonyi State, Nigeria. Int. J. Eng. Res. Technol. 2021, 10, 498–506. [Google Scholar]
- Sarwar, S.; Ahmmed, I.; Mustari, S.; Shaibur, M.R. Use of weighted arithmetic water quality index (WAWQI) to determine the suitability of groundwater of Chaugachcha and Manirampur Upazila, Jashore, Bangladesh. Biol. Res. 2020, 2, 22–30. [Google Scholar]
- Tokatli, C. Water quality assessment of Yazır Pond (Tekirdağ, Turkey): An application of water quality index. Biyol. Bilim. Araştırma Derg. 2019, 12, 26–29. [Google Scholar]
- Că Călmuc, V.A.; Călmuc, M.; Țopa, M.C.; Timofti, M.; Iticescu, C.; Georgescu, L.P. Various methods for calculating the water quality index. Analele Universității “Dunărea de Jos” din Galați. Fascicula II, Matematică, fizică, mecanică teoretică/Annals of the “Dunarea de Jos” University of Galati. Fascicle II Math. Phys. Theor. Mech. 2018, 41, 171–178. [Google Scholar]
- JS 1766:2014; Irrigation Water Quality Guidelines. 1st ed. Jordan Institution for Standards and Metrology: Amman, Jordan, 2014.
- Ahmed, M.; Mumtaz, R.; Hassan Zaidi, S.M. Analysis of water quality indices and machine learning techniques for rating water pollution: A case study of Rawal Dam, Pakistan. Water Supply 2021, 21, 3225–3250. [Google Scholar] [CrossRef]
- Canadian Council of Ministers of the Environment. Ccme Water Quality Index User’s Manual 2017 Update. 2017. Available online: https://ccme.ca/en/res/wqimanualen.pdf (accessed on 1 June 2023).
- Awachat, A.R.; Salkar, V.D. Ground water quality assessment through WQIs. Int. J. Eng. Res. Technol. 2017, 10, 318–322. Available online: https://www.ripublication.com/irph/ijert_spl17/ijertv10n1spl_61.pdf (accessed on 2 March 2023).
- Al-Zahiri, A. Assessment of performance of wastewater treatment plants in Jordan. Int. J. Civ. Environ. Eng. 2015, 1, 1–6. [Google Scholar]
- Maddah, H.A. Predicting optimum dilution factors for BOD sampling and desired dissolved oxygen for controlling organic contamination in various wastewaters. Int. J. Chem. Eng. 2022, 2022, 8637064. [Google Scholar] [CrossRef]
- Shtull-Trauring, E.; Cohen, A.; Ben-Hur, M.; Israeli, M.; Bernstein, N. NPK in treated wastewater irrigation: Regional scale indices to minimize environmental pollution and optimize crop nutritional supply. Sci. Total Environ. 2022, 806, 150387. [Google Scholar] [CrossRef]
- Andrianjakarivony, F.H.; Bettarel, Y.; Desnues, C. Searching for a reliable viral indicator of faecal pollution in aquatic environments. J. Microbiol. 2023, 61, 589–602. [Google Scholar] [CrossRef]
- Alkathiri, A.; Eifan, S.; Hanif, A.; Nour, I.; Al-Anazi, A.E.; Maniah, K.; Alotaibi, R.; Alharbi, Y. Human Adenovirus Detection and Genetic Characterization in Irrigation Water from the Riyadh Region, Saudi Arabia. Water 2023, 15, 3318. [Google Scholar] [CrossRef]
- Wu, F.; Zhang, J.; Xiao, A.; Gu, X.; Lee, W.L.; Armas, F.; Kauffman, K.; Hanage, W.; Matus, M.; Ghaeli, N.; et al. SARS-CoV-2 titers in wastewater are higher than expected from clinically confirmed cases. Msystems 2020, 5, 10–1128. [Google Scholar] [CrossRef]
- JPMC. Jordan Phosphate Mines Company Wastewater Treatment and Reuse in the Industrial Sector. 2018. Available online: https://www.jpmc.com.jo/en/environment (accessed on 1 April 2024).
- Saidan, M.N.; Al-Addous, M.; Al-Weshah, R.A.; Obada, I.; Alkasrawi, M.; Barbana, N. Wastewater reclamation in major Jordanian industries: A viable component of a circular economy. Water 2020, 12, 1276. [Google Scholar] [CrossRef]
- Zueter, A. The status of cryptosporidiosis in Jordan: A review. East. Mediterr. Health J. 2020, 26, 1565–1569. [Google Scholar] [CrossRef]
- Taamneh, Y.; Al Dwairi, R. The efficiency of Jordanian natural zeolite for heavy metals removal. Appl. Water Sci. 2013, 3, 77–84. [Google Scholar] [CrossRef]
- Nassif, M.H.; Tawfik, M.; Abi Saab, M.T. Water Quality Standards and Regulations for Agricultural Water Reuse in MENA: From International Guidelines to Country Practices. IWMI. 2022. Available online: https://www.iwmi.cgiar.org/Publications/Books/PDF/water_reuse_in_the_middle_east_and_north_africa-a_sourcebook-chapter-5.pdf (accessed on 15 June 2024).
- Alkhaza’leh, H.; Abu-Awwad, A.; Alqinna, M. Effect of Irrigation with Treated Wastewater on Potatoes’ Yields, Soil Chemical, Physical and Microbial properties. Jordan J. Earth Environ. Sci. 2023, 14, 135–145. [Google Scholar]

Disclaimer/Publisher’s Note: The statements, opinions and data contained in all publications are solely those of the individual author(s) and contributor(s) and not of MDPI and/or the editor(s). MDPI and/or the editor(s) disclaim responsibility for any injury to people or property resulting from any ideas, methods, instructions or products referred to in the content. |
© 2025 by the authors. Licensee MDPI, Basel, Switzerland. This article is an open access article distributed under the terms and conditions of the Creative Commons Attribution (CC BY) license (https://creativecommons.org/licenses/by/4.0/).