Article

A Proposal for Redesigning the Water Quality Network of the Tunjuelo River in Bogotá, Colombia through a Spatio-Temporal Analysis

Environmental Engineering Program, Universidad Santo Tomas, Cra. 9 #51-11 Bogotá, Colombia
*
Author to whom correspondence should be addressed.
Resources 2019, 8(2), 64; https://doi.org/10.3390/resources8020064
Submission received: 2 February 2019 / Revised: 28 March 2019 / Accepted: 2 April 2019 / Published: 6 April 2019
(This article belongs to the Special Issue Multiple-Effect Water Resources Management)

Abstract

:
Bogotá is the capital of Colombia and represents the most important urban center in the country. Bogotá’s population and economic growth have accelerated exponentially in recent years and this growth has brought with it a variety of environmental impacts, including degradation of surface water quality. Government agencies have developed the water quality network of Bogotá that spans across four large rivers, including the Tunjuelo. According to measurements since 2009, water quality has changed in association with the dynamics of the city. This article utilizes a spatial and temporal analysis with multivariate statistics (Principal Components Analyses, dendograms, and Kruskal-Wallis) to propose a redesign of the Tunjuelo River water quality network. Based on these analyses, the number of monitoring stations can be reduced from nine to seven and the measurement frequency can be reduced. Together, the proposed spatial and temporal redesign would reduce the sample acquisition and analysis costs across the network by 50%.

1. Introduction

Surface water quality in urban centers is highly susceptible to contamination [1,2]. Urban water contamination is associated with point and diffuse pollution [3,4,5] sources produced through myriad activities [6,7] and as a result of territorial dynamics such as changes in land use and climate change [8]. To improve water quality, it is necessary to generate strategies for planning, administration, management, and control of urban basins [9]. Potential strategies encompass continuous or discontinuous water quality measurements [10], real-time controls [11], surveillance and monitoring of pollution sources [12], civil works, and non-structural actions [13,14,15]. Collectively, these strategies will allow for the identification of issues and development of action plans to recover river quality.
Water quality networks are widely used tools since these allow for the identification of impacts to water quality, the establishment of reference values, and the planning and development of actions to control and improve quality in both the short- and long-term [16]. According to Sanders et al. [17], the design of water quality networks should take into account the objectives of monitoring, location, frequency, and quality parameters measured. In urban rivers, these criteria are highly appropriate since the dynamics in cities include important spatio-temporal variations due to different sources of pollution and hydrological conditions.
The instrumentation and types of sensors deployed in water quality networks play a fundamental role in data quality, and additionally, vary depending on the purposes of the water quality network [11,18]. On the other hand, the data measured in a water quality network serve as a source of information for decision-making, however, bad designs reduce the importance of the network or create low value for decision-making [2].
Heterogeneous environmental and pollution conditions throughout bodies of water have led to the inclusion of more stations and a greater measurement frequency, and as a consequence, operating costs have increased. Therefore, it is vital to optimize or redesign water quality networks [19] to achieve their proposed measurement goals, while also saving on costs that can be invested in the actual recovery of urban basins. For Ongley and Ordoñes [20], redesigning a water quality network begins with the premise that the existing network has fulfilled its established function or that it requires modification due to spatio-temporal changes in the basin. Therefore, a redesign should set out a plan with specific management targets and reduction stations, to simplify the parameters measured and to optimize monitoring sites. The redesign should use existing information, such as measured water quality parameters, economic resources, topographic points, land uses, climatic variables, and flows [21,22].
Several authors have proposed different methodologies and techniques for water quality network redesigns, such as numerical models of water quality, principal component analysis [23], linear regressions [24], clusters analysis [25], information-theory [26], genetic algorithms [27], artificial neural networks [28], geostatistics [29], fuzzy logic [30], and others [31,32,33]. This article presents a proposal to redesign the water quality network of the Tunjuelo River in the city of Bogotá through the use of multivariate statistics tools.

2. Materials and Methods

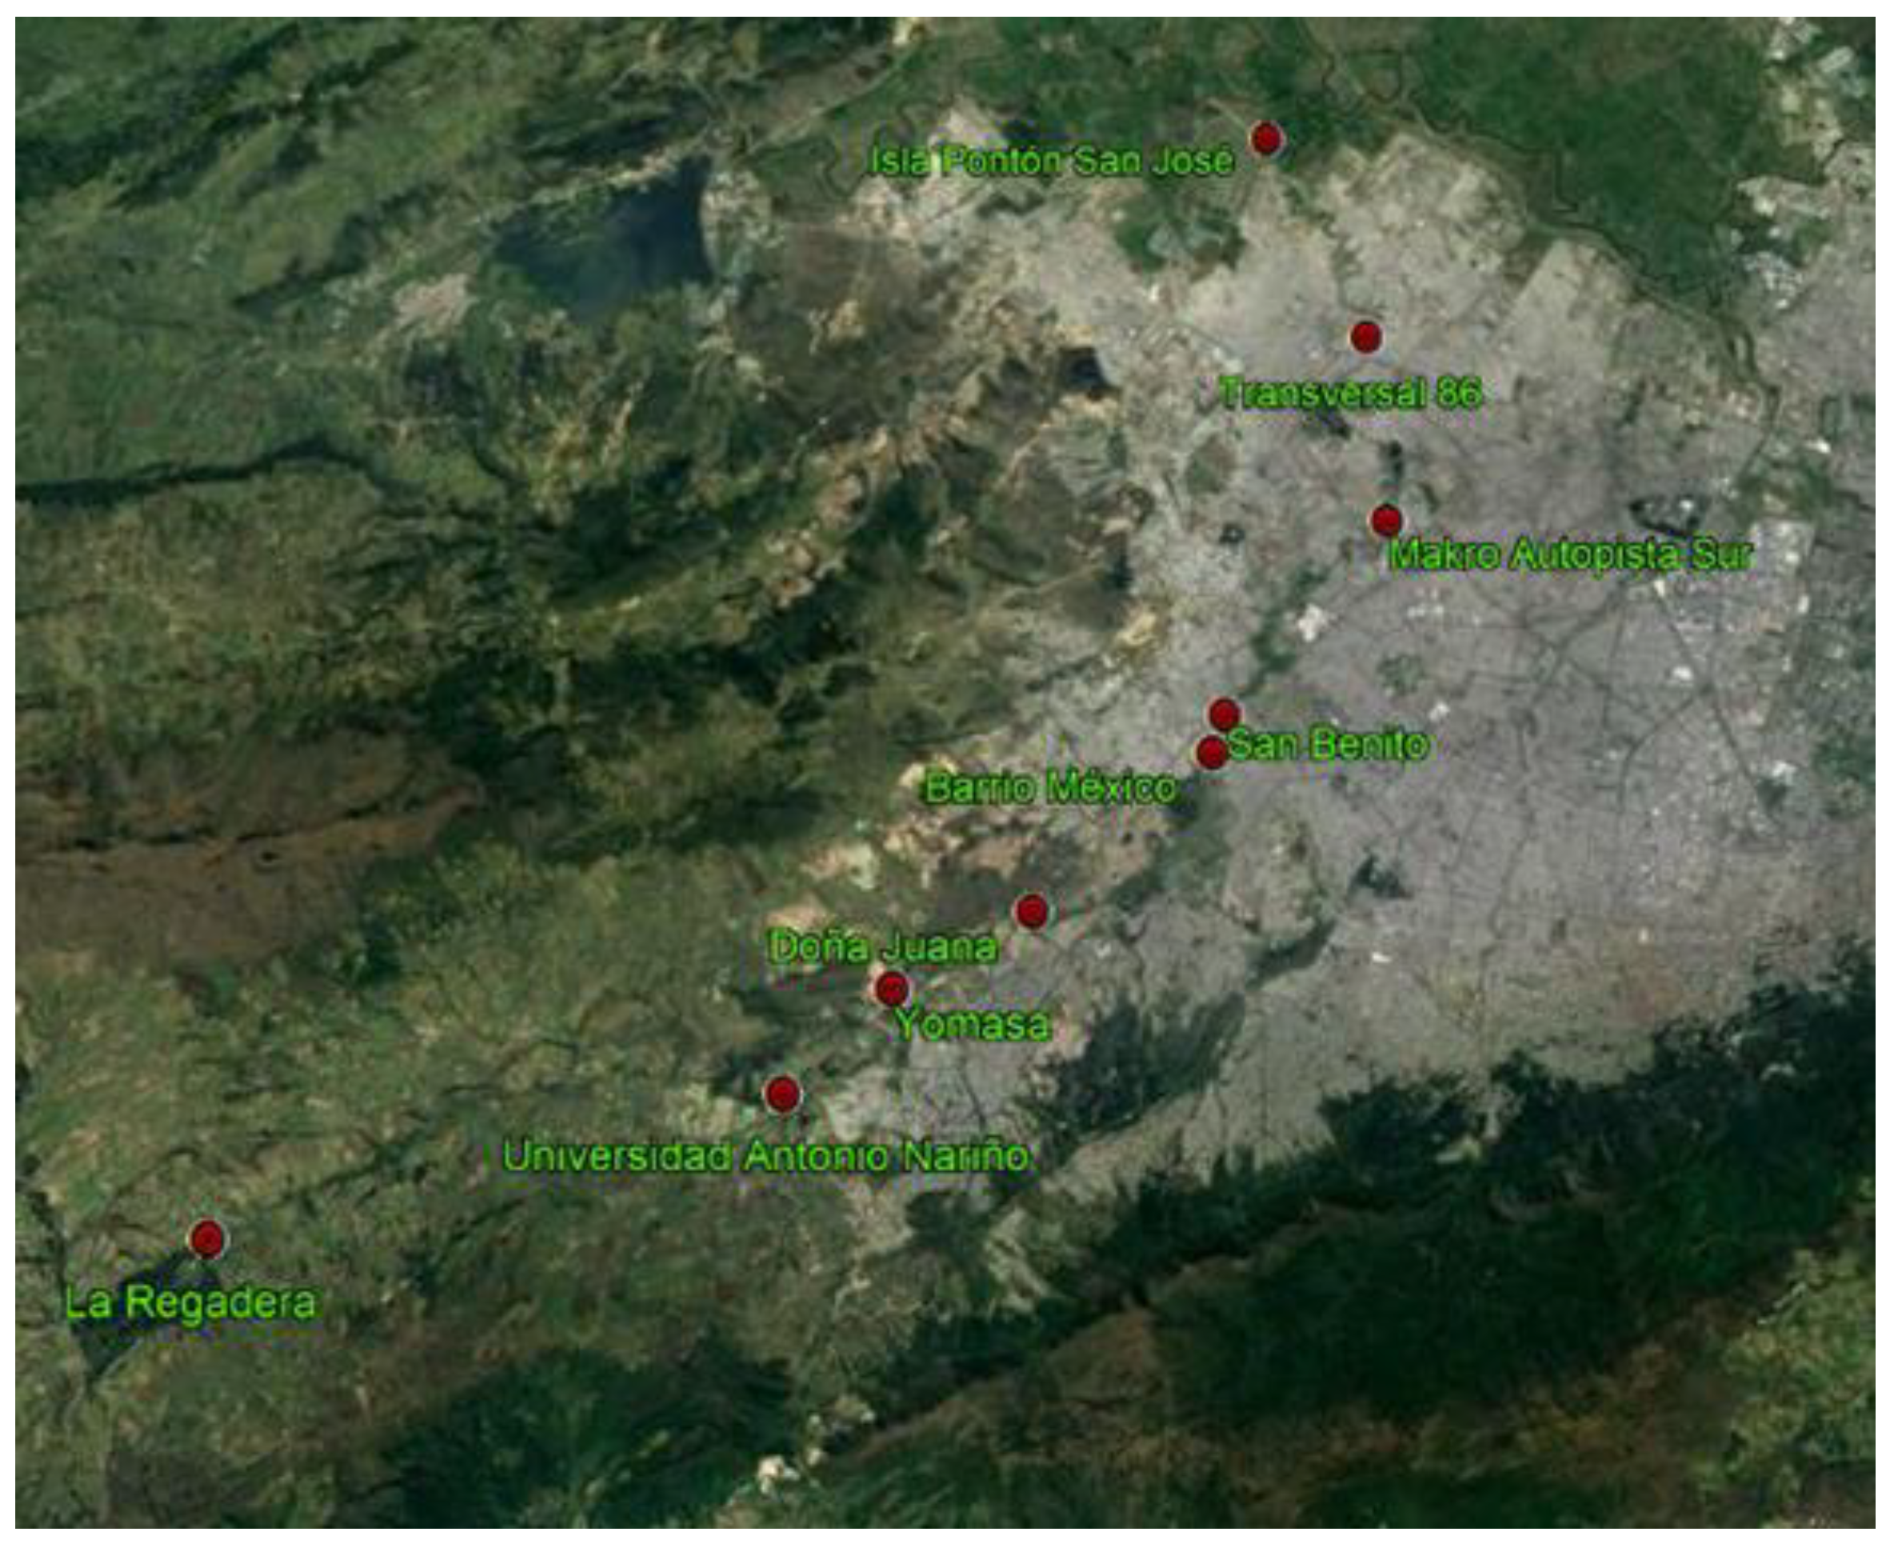
2.1. Geographic Location

Bogotá is the capital of Colombia and constitutes the main geographic, political, industrial, economic, and cultural center of the country. The accelerated increase in population growth and economic development processes in Bogotá have generated multiple environmental impacts. Surface water resources are one of the most affected [34]. The capital has four major rivers (Torca, Salitre, Fucha, and Tunjuelo) that are monitored through the water quality network of Bogotá, which has a system of independent stations on each of the rivers.
The Tunjuelo River is born in the Páramo de Sumapaz above 3700 meters above mean sea level (m.a.m.s.l) and forms part of the upper and middle basin of the Bogotá River. The Tunjuelo River drains the area south (east to west) of the city to the Bogotá River (approximate elevation of 2570 m.a.m.s.l.), with an extension of 28.27 km. The Tunjuelo watershed is made up of a 41,427 hectare urban drainage area and a 4237 hectare rural drainage area. A large quantity of domestic, industrial, and commercial wastewater from the city’s sewer system drains into the Tunjuelo River. The Tunjuelo is the only river in the city not channeled and receives the greatest volume of flow from tributary streams.
The local average annual air temperature is between 14 and 15 °C along the river and the area experiences two climatic periods. High precipitation (between 151 and 218 mm precipitation monthly) dominates the first period that corresponds to fall (April–May) and spring (October–November). The second period has characteristically low precipitation (between 29 and 54 mm precipitation monthly) and corresponds to summer (December–January) and winter (July–August).

2.2. The Tunjuelo River Water Quality Network

The river has 10 monitoring stations dispersed among four sections. With the objective of meeting water quality goals, each of the river sections has maximum permissible pollutant values set to predetermined management levels. The stations in the water quality network and their corresponding river section locations are shown in Table 1 and Figure 1.

2.3. Redesign Methodology

To develop the methodology for redesigns, 10 normative variables [pH, dissolved oxygen (DO), biochemical oxygen demand (BOD5), chemical oxygen demand (COD), total suspended solids (TSS), fats and oils (OG), fecal coliforms (Col.Fec), total nitrogen (TN), total phosphorus (TP), and methylene blue active substances (MBAS)] and flow (Q) were measured during the years 2009–2013. By year and per station, the interquartile ranges (IQR) of measured values were calculated and those outside of the IQR were eliminated as outliers from further analyses. The IQR does not assume that the data conforms to a normal distribution, and therefore, is less sensitive to extreme values, which allows for the retention of more measurements. Finally, the analysis was carried out using the 10 variables and Q without outliers, plus qualitative climatic conditions (sunny, cloudy, rainy) and date (time, day, and month of sampling).
Kruskal-Wallis tests were used to evaluate the influence of season (weather), month, and hour of sampling through comparison of means on each of these dimensions. The null hypothesis tested is the equivalence of means and the alternative hypothesis states that the means differ significantly (with an alpha of 0.05).
Principal components analysis (PCA) [35] was used to reduce data dimensionality of the data. PCA decomposes the variance of related variables and combines them into the smallest number of independent axes (i.e., principal components) that fully explain the variance across the entire variable set [36]. The first two components were used since these explained more than 60% of the total variance for the river. The first principal component (PC1) is the linear combination of the original variables that explain the greatest proportion of the variance contained in the dataset. The second principal component (PC2) is a linear combination of original variables that maximize the explanation of variance that is orthogonal to PC1 [37]. Normally, the first components explain most of the variance in a dataset, as it is in this case.
Finally, a hierarchical or dendogram analysis was used to construct the redesign itself. The possible groupings among stations were identified to assess spatial variance and among months to assess temporal variance using the method of Ward, which uses the minimum variability between conglomerates and seeks to make each conglomerate as homogeneous as possible [38,39]. The Dynamic Tree Cut method [40] was used to calculate the cut-off point in dendrograms. Cluster analysis with dendrograms is widely used for redesigning water quality networks and was applied both spatially [36,41,42] and temporally [43,44] in both urban and rural basins.
Below is a diagram of the proposed redesign process (Figure 2).

3. Results and Discussion

First there were significant (p < 0.05) differences among the stations for each of the 10 variables measured, indicating that water quality declined in the Tunjuelo River as it passed through Bogotá. Calazans et al. [45] found a similar result and they concluded that the reduction in water quality along the series of stations was statistically significant for the variables they measured. The month and hour of measurement also significantly (p < 0.05) affected each of the measured variables except fecal coliform, which was not temporally influenced by month or weather. In contrast, El Gammal [46] did find temporal differences in fecal coliform counds and recommended constant measurement of this variable throughout the year.
The PCA reduced the dimensionality of the dataset to two primary axes of variation. The variables that primarily contributed to variance in PC1 included BOD5, COD, TN, and MBAS, which were all positively correlated with PC1 and collectively contributed more than 30% of the total variance (Figure 3). Dissolved oxygen concentration was negatively correlated with PC1 and contributed less than 9% to the overall variance.
Variables that contributed to variance primarily along PC2 included TSS and TP (Figure 3). Leachate discharge from one of Bogotá’s landfills substantially altered pH and the TP, raising their values, which explains the near co-location in the PCA bi-plot (Figure 3). Likewise, TSS was elevated by large quantities of solids flowing out of a stone mining operation and into the river. Flow was largely unrelated to the first two principal components and the other measurement variables. In the two-dimensional space of the PCA, flow was placed in the negative space of both dimensions near the origin and this was associated with the loss of flow by abstraction and storage of water by flooding in mine pits (Figure 3). Finally, the variables flow, fecal coliform, pH, fats and oils, and dissolved oxygen had low squared cosine (cos2) values indicating that they were not perfectly represented on the first two principal components.
Each measured variable’s contribution to the first and second principal components was calculated as a percentage ((variable_cos2 * 100)/(total_cos2_of_the_component)). The contributions of each variable are presented in Figure 4. The largest contributors to PC1 were COD, TN, BOD5, and MBAS since these exceeded the expected average contribution (represented by the dotted red line corresponding to the expected value 1/100 = 9.09%). Only TSS and TP significantly contributed to the second component (Figure 4). It is common to observe a relationship between the first [45,47,48] or second [49] principal components and organic matter variables (COD and BOD) and an inverse relationship with DO in PCA analyses of basins contaminated by urban processes. However, as Gigues et al. [50] and Pejman et al. [51] demonstrate, different behaviors are found in rural basins.
Fats and oils (OG), dissolved oxygen (DO), and pH exhibited low variability throughout the river and did not significantly contribute to either of the first two principal components. These variables were removed from further analyses. Fecal coliform did not vary drastically in the river sections measured or at nearby stations, so it was also excluded from further analysis. The distributions of values for the remaining variables at each of the stations in the network were plotted (Figure 5).

3.1. Spatial Clustering Analysis

3.1.1. River Section 1

BOD5, TN, and MBAS formed a subgroup in a cluster analysis at the Regadera and UAN stations. The Barrio México station was additionally included, though this station is located in the second section and was associated with a reduction of pollutants (explained in the River Section 2 below). COD, TP and TSS formed a group between the Regadera and UAN stations (Figure 6).

3.1.2. River Section 2

Section 2 was composed of the Yomasa, Doña Juana, Barrio México, and San Benito stations. No groups were found for this section. The first station exhibited good quality compared to the others. The second station was a point of discharge from the landfill and mining sector, which drastically altered some parameters. Barrio Mexico was the first station after water passed through the flooded mining pits and was where macrophytes were present that eliminated substances, such as organic matter and nutrients, output from the sanitary landfill. Finally, the San Benito station takes up the dynamics in terms of dumping with which the river is presented (Figure 6).

3.1.3. River Section 3

TN and COD grouped in a cluster for the San Benito and Makro Auto Sur stations. All other variables, except TSS, at these two stations were related; however, the cutoff point in the analysis did not allow for their grouping (Figure 6).

3.1.4. River Section 4

Stations TV 86, Independent Bridge, and Isla Pontón San José grouped into a cluster for MBAS. For TP and TSS, Independent Bridge and Isla Pontón San José grouped into a cluster. For the remaining variables, including TP and TSS, clusters were formed with the TV 86, Independent Bridge, and Pontón San José Island stations (Figure 6).

3.2. Spatial Redesign of the Tunjuelo River Water Quality Network

The specific regulations were important to consider for the water quality network redesign and these included the prerequisite inclusion of at least one station, which meant that in addition to the cluster analysis, this consideration was included in the redesign.
Once clusters were identified, a new spatial design was determined for the water quality network. The Regadera station should remain as the only station in the first section, since this station measures the best water quality in the network and therefore provides a baseline measure for water quality. All stations should be maintained in section 2. The Yomasa station allows evaluation of quality at the beginning of the section. The Doña Juana station serves the purpose of evaluating the impacts of the sanitary landfill, which is particularly pertinent going forward since the population of the neighboring city and municipality continue to grow and generate waste that is dumped in the landfill. The Barrio Mexico station should be maintained to monitor any changes resulting from conditions of the mining pits (e.g., reduction of macrophytes, hydrodynamic changes) that could increase or decrease river water quality.
Since a cluster of stations formed in section 3 based on COD and MBAS, the Makro Auto Sur station can be eliminated and the San Benito station should remain. According to Peña-Guzmán and Zamora [52], COD at this station was linearly related to BOD5, TSS, MBAS, O&G TP, and TN. Finally, for section 4, the TV 86 station should be maintained since this was the point where all the concentrations increased considerably. The Isla Ponto San José station should also remain in the network since it is located at the end point of the river and presents similar concentrations to the Puente Independencia station, which can be removed without significant loss of value.
Overall, of the 10 current stations, the new design includes only seven. In the new design, there is one station in section 1, three stations in section 2, one station in section 3, and two stations in section 4.

3.3. Temporal Analysis

Once the redesign of the water quality network was proposed, the monthly behavior of the selected stations was evaluated using cluster analysis and dendogram visualization (Figure 5).

3.3.1. River Section 1

Two clusters were generated for the Regadera station. The first was composed of July, August, September, and December, which are all months during dry seasons. The second cluster contained February and November, which represent the start of the wet seasons. Two additional clusters were generated with 2 months each: May and June together representing the dry season, and April and October, which are both wet months (Figure 7).

3.3.2. River Section 2

For the Yomasa station, three temporal groups were generated: The first contained the months of June and July, the second April and October, and the third May and August. For the Doña Juana station, there was a large cluster containing April, June, November, May, and August; and two smaller clusters with February and March; and September and October. For the Barrio México station, one large cluster was generated that contained June, October, May, and September.

3.3.3. River Section 3

Three temporal groups were clearly demarcated at the San Benito station. The first group contained January, February, and December; the second April and October; and the third was a large group composed of May, June, August, September, and November.

3.3.4. River Section 4

Two temporal groups were formed at the TV 86 station: One containing April and September, and the second May and August. These two groups were characterized as rainy months and indicate high variability in the dry and semi-wet seasons. Three clusters were generated for the Ponton Island station: The first contained January and February; the second August and September; and the third May, June, August, September, and November (Figure 7).

3.4. Temporal Redesign of the Tunjuelo River Water Quality Network

The proposed monthly measurement frequency redesign is presented in Table 2.
Measurements should continue at all stations during the month of January (Table 2) since this month was associated with variability in the cluster analysis (Figure 7). Additionally, a holiday period in both the public and private sectors occurs in January, which decreases the discharge of wastewater from domestic and industrial sectors and is concurrent with the dry period. The next month with a high number of measurements proposed is March, which starts the rainy season. The intensity of rains increases in the month of April. Then, June and July again return to dry holiday periods and a decrease in residential wastewater. The months of September and October are rainy, and December is a transition period from rain to dry at the start of the holiday period. Measurements in the months February, May, August, and November were selected for fewer stations, primarily due to the overall annual variability and since these months tended to group with other months. Climatic temporality is a fundamental factor in river water quality and this variability requires consideration during the design of water quality networks since temporal grouping will depend on it [53].
Importantly, the Tunjuelo River water quality network does not have fixed stations and it functions only to measure water quality. Thus, the proposed redesign is easily applicable since there would be no loss of data quality. In regards to flow, Bogotá currently has a series of limnigraphic and rainfall stations for this purpose.
The potential savings from the Tunjuelo River water quality network redesign are substantial. With the current design, the physical acquisition and analysis of each water sample has an approximate cost of USD $300, and a full measurement campaign (i.e., one sample from each station in each moth of the year or acquiring and analyzing 120 samples) over the entire network has a cost between USD $32,000 and $33,000. With the planned redesign, a full measurement campaign over the network would cost only between USD $16,000 and $17,000, or an approximately 50% reduction in annual expenditure.

4. Conclusions

Temporal variation in water quality along the Tunjuelo River through Bogotá was largely driven by precipitation patterns. Water quality in May and June were very similar values. At the Yomasa station, three temporal clusters were formed: June and July (dry season), the months of April and October, and May and August. In contrast, little temporal variation was observed at the Doña Juana station, so the temporal groupings there contained several months.
May, June, September, and October grouped together at the Barrio México station. The strongest grouping at the San Benito station contained April and October. Two temporal groupings formed at the TV 86 station, one with April and September, and one with May and August.
A new water quality network configuration for the Tunjuelo River is proposed. The new network is composed of seven stations, including one station (Regadera) for section 1, three stations for section 2 (Yomasa, Doña Juana, and Barrio Mexico), one station for section 3 (San Benito), and two stations for section 4 (TV 86 and Ponton Island San Jose). The proposed temporal sampling frequency on this network depends directly on the particular station. This frequency was developed to capture the three major seasons. The first season is composed of January, June, and July (dry season months), the second is composed of April, September, and October (wet months), and the third is composed of March and December (transition months between dry and wet).
Finally, a 50% annual reduction in the cost of water quality sampling and analysis across the full extent of the network is achievable if this new network composition and sampling frequency are implemented. Improved water quality is possible if these savings are invested in sanitation or to create a new water quality network for another of Bogotá’s water sources.

Author Contributions

C.A.P.-G. contributed to conceptualization; C.A.P.-G., A.D. and L.S. contributed to data analysis.

Funding

This research received no external funding.

Acknowledgments

The authors thank the District Department of the Environment (governmental environmental authority for the city of Bogotá D.C.) for facilitating the recording of measurements with the Tunjuelo River water quality network.

Conflicts of Interest

The authors declare no conflict of interest.

References

  1. Hall, M.J.; Ellis, J.B. Water quality problems of urban areas. GeoJournal 1985, 11, 265–275. [Google Scholar] [CrossRef]
  2. Strobl, R.O.; Robillard, P.D.; Shannon, R.D.; Day, R.L.; McDonnell, A.J. A Water Quality Monitoring Network Design Methodology for the Selection of Critical Sampling Points: Part I. Environ. Monit. Assess. 2006, 112, 137–158. [Google Scholar] [CrossRef]
  3. Milon, J.W. Optimizing Nonpoint Source Controls in Water Quality Regulation 1. J. Am. Water Resour. Assoc. 1987, 23, 387–396. [Google Scholar] [CrossRef]
  4. Harrington, W.; Krupnick, A.J.; Peskin, H.M. Policies for nonpoint-source water pollution control. J. Soil Water Conserv. 1985, 40, 27–32. [Google Scholar]
  5. Loague, K.; Corwin, D.L. Point and NonPoint Source Pollution. In Encyclopedia of Hydrological Sciences; American Cancer Society: Atlanta, GA, USA, 2006; ISBN 978-0-470-84894-4. [Google Scholar]
  6. Gaddis, E.J.B.; Voinov, A.; Seppelt, R.; Rizzo, D.M. Spatial Optimization of Best Management Practices to Attain Water Quality Targets. Water Resour. Manag. 2014, 28, 1485–1499. [Google Scholar] [CrossRef]
  7. Todeschini, S.; Papiri, S.; Ciaponi, C. Placement Strategies and Cumulative Effects of Wet-weather Control Practices for Intermunicipal Sewerage Systems. Water Resour. Manag. 2018, 32, 2885–2900. [Google Scholar] [CrossRef]
  8. Mishra, A.K.; Coulibaly, P. Developments in hydrometric network design: A review. Rev. Geophys. 2009, 47. [Google Scholar] [CrossRef] [Green Version]
  9. Brabec, E.; Schulte, S.; Richards, P.L. Impervious Surfaces and Water Quality: A Review of Current Literature and Its Implications for Watershed Planning. J. Plan. Lit. 2002, 16, 499–514. [Google Scholar] [CrossRef]
  10. Bartram, J.; Ballance, R. Water Quality Monitoring: A Practical Guide to the Design and Implementation of Freshwater Quality Studies and Monitoring Programmes; CRC Press: Boca Raton, FA, USA, 1996; ISBN 978-0-419-22320-7. [Google Scholar]
  11. Vélez, C.; Alfonso, L.; Sánchez, A.; Galvis, A.; Sepúlveda, G. Centinela: An early warning system for the water quality of the Cauca River. J. Hydroinf. 2014, 16, 1409–1424. [Google Scholar] [CrossRef]
  12. Banik, B.K.; Alfonso, L.; Di Cristo, C.; Leopardi, A.; Mynett, A. Evaluation of Different Formulations to Optimally Locate Sensors in Sewer Systems. J. Water Resour. Plan. Manag. 2017, 143. [Google Scholar] [CrossRef]
  13. D’Arcy, B.; Frost, A. The role of best management practices in alleviating water quality problems associated with diffuse pollution. Sci. Total Environ. 2001, 265, 359–367. [Google Scholar] [CrossRef]
  14. Ellis, J.B. Sustainable surface water management and green infrastructure in UK urban catchment planning. J. Environ. Plan. Manag. 2013, 56, 24–41. [Google Scholar] [CrossRef]
  15. Ahlman, S.; Malm, A.; Kant, H.; Svensson, G.; Karlsson, P. Modelling non-structural Best Management Practices– focus on reductions in stormwater pollution. Water Sci. Technol. 2005, 52, 9–16. [Google Scholar] [CrossRef]
  16. Strobl, R.O.; Robillard, P.D. Network design for water quality monitoring of surface freshwaters: A review. J. Environ. Manag. 2008, 87, 639–648. [Google Scholar] [CrossRef]
  17. Sanders, T.G. Design of Networks for Monitoring Water Quality; Water Resources Publication: Littleton, CO, USA, 1983; ISBN 978-0-918334-51-0. [Google Scholar]
  18. Chacon-Hurtado, J.C.; Alfonso, L.; Solomatine, D.P. Rainfall and streamflow sensor network design: A review of applications, classification, and a proposed framework. Hydrol. Earth Syst. Sci. 2017, 21, 3071–3091. [Google Scholar] [CrossRef]
  19. Chen, Q.; Wu, W.; Blanckaert, K.; Ma, J.; Huang, G. Optimization of water quality monitoring network in a large river by combining measurements, a numerical model and matter-element analyses. J. Environ. Manag. 2012, 110, 116–124. [Google Scholar] [CrossRef] [Green Version]
  20. Ongley, E.D.; Ordoiiez, E.B. Redesign and Modernization of the Mexican Water Quality Monitoring Network. Water Int. 1997, 22, 187–194. [Google Scholar] [CrossRef]
  21. Alfonso, L.; Lobbrecht, A.; Price, R. Optimization of water level monitoring network in polder systems using information theory. Water Resour. Res. 2010, 46. [Google Scholar] [CrossRef] [Green Version]
  22. Alfonso, L.; Lobbrecht, A.; Price, R. Information theory–based approach for location of monitoring water level gauges in polders. Water Resour. Res. 2010, 46. [Google Scholar] [CrossRef]
  23. Ouyang, Y. Evaluation of river water quality monitoring stations by principal component analysis. Water Res. 2005, 39, 2621–2635. [Google Scholar] [CrossRef]
  24. Tirsch, F.S.; Male, J.W. River basin water quality monitoring network design: Options for reaching water quality goals. In Proceedings of the Twentieth Annual Conference of American Water Resources Associations, Middleburg, VA, USA, December 1984; American Water Resources Association: Middleburg, VA, USA, 1984; pp. 149–156. [Google Scholar]
  25. Maasdam, R.; Smith, D.G. New Zealand’s National River Water Quality Network 2. Relationships between physico-chemical data and environmental factors. N. Z. J. Mar. Freshw. Res. 1994, 28, 37–54. [Google Scholar] [CrossRef]
  26. Alfonso, L.; Ridolfi, E.; Gaytan-Aguilar, S.; Napolitano, F.; Russo, F. Ensemble Entropy for Monitoring Network Design. Entropy 2014, 16, 1365–1375. [Google Scholar] [CrossRef] [Green Version]
  27. Karamouz, M.; Karimi, M.; Kerachian, R. Design of Water Quality Monitoring Network for River Systems. In Proceedings of the World Water and Environmental Resources Congress, Salt Lake City, UT, USA, 27 June–1 July 2004. [Google Scholar]
  28. Peña-Guzmán, C.; Balaguera, P.; Hernandez, N.; Sierra, R. Redesign of Water Quality Network for the Urban Rivers in Salitre in Bogotá, Colombia, Using an Artificial Neural Network. In Proceedings of the New Trends in Urban Drainage Modelling, Palermo, Italy, September 2019; Mannina, G., Ed.; Springer International Publishing: Palermo, Italy, 2019; pp. 915–919. [Google Scholar]
  29. Beveridge, D.; St-Hilaire, A.; Ouarda, T.B.M.J.; Khalil, B.; Conly, F.M.; Wassenaar, L.I.; Ritson-Bennett, E. A geostatistical approach to optimize water quality monitoring networks in large lakes: Application to Lake Winnipeg. J. Gt. Lakes Res. 2012, 38, 174–182. [Google Scholar] [CrossRef]
  30. Karamouz, M.; Kerachian, R.; Akhbari, M.; Hafez, B. Design of River Water Quality Monitoring Networks: A Case Study. Environ. Model. Assess. 2008, 14, 705. [Google Scholar] [CrossRef]
  31. Chang, C.-L.; Lin, Y.-T. A water quality monitoring network design using fuzzy theory and multiple criteria analysis. Environ. Monit. Assess. 2014, 186, 6459–6469. [Google Scholar] [CrossRef]
  32. Cetinkaya Cem, P.; Harmancioglu Nilgun, B. Assessment of Water Quality Sampling Sites by a Dynamic Programming Approach. J. Hydrol. Eng. 2012, 17, 305–317. [Google Scholar] [CrossRef]
  33. Varekar, V.; Karmakar, S.; Jha, R.; Ghosh, N.C. Design of sampling locations for river water quality monitoring considering seasonal variation of point and diffuse pollution loads. Environ. Monit. Assess. 2015, 187, 376. [Google Scholar] [CrossRef]
  34. Peña-Guzmán, C.; Melgarejo, J.; Prats, D. El ciclo urbano del agua en Bogotá, Colombia: estado actual y desafíos para la sostenibilidad. Tecnol. Cienc. Agua 2016, 7, 57–71. [Google Scholar]
  35. Nguyen, T.H.; Helm, B.; Hettiarachchi, H.; Caucci, S.; Krebs, P. The selection of design methods for river water quality monitoring networks: A review. Environ. Earth Sci. 2019, 78, 96. [Google Scholar] [CrossRef]
  36. Khalil, B.; Ouarda, T.B.M.J. Statistical approaches used to assess and redesign surface water-quality-monitoring networks. J. Environ. Monit. 2009, 11, 1915–1929. [Google Scholar] [CrossRef]
  37. Khalil, B.; Ou, C.; Proulx-McInnis, S.; St-Hilaire, A. Statistical Analyses of the Adequacy of the Surface Water Quality Network in Saskatchewan; Saskatchewan Department of the Environment: Québec, QC, Canada, 2011; p. 333. [Google Scholar]
  38. Giridharan, L.; Venugopal, T.; Jayaprakash, M. Assessment of Water Quality Using Chemometric Tools: A Case Study of River Cooum, South India. Arch. Environ. Contam. Toxicol. 2009, 56, 654–669. [Google Scholar] [CrossRef] [PubMed]
  39. Boyacioglu, H.; Boyacioglu, H. Surface Water Quality Assessment by Environmetric Methods. Environ. Monit. Assess. 2007, 131, 371–376. [Google Scholar] [CrossRef]
  40. Langfelder, P.; Zhang, B.; Horvath, S. Defining clusters from a hierarchical cluster tree: the Dynamic Tree Cut package for R. Bioinformatics 2008, 24, 719–720. [Google Scholar] [CrossRef] [PubMed]
  41. Mei, K.; Zhu, Y.; Liao, L.; Dahlgren, R.; Shang, X.; Zhang, M. Optimizing water quality monitoring networks using continuous longitudinal monitoring data: A case study of Wen-Rui Tang River, Wenzhou, China. J. Environ. Monit. 2011, 13, 2755–2762. [Google Scholar] [CrossRef] [PubMed]
  42. Pinto, C.C.; Calazans, G.M.; Oliveira, S.C. Assessment of spatial variations in the surface water quality of the Velhas River Basin, Brazil, using multivariate statistical analysis and nonparametric statistics. Environ. Monit. Assess. 2019, 191, 164. [Google Scholar] [CrossRef] [PubMed]
  43. Mavukkandy, M.O.; Karmakar, S.; Harikumar, P.S. Assessment and rationalization of water quality monitoring network: A multivariate statistical approach to the Kabbini River (India). Environ. Sci. Pollut. Res. 2014, 21, 10045–10066. [Google Scholar] [CrossRef] [PubMed]
  44. Alves, J.D.P.H.; Fonseca, L.C.; Chielle, R.D.S.A.; Macedo, L.C.B. Monitoring water quality of the Sergipe River basin: An evaluation using multivariate data analysis. RBRH 2018, 23. [Google Scholar] [CrossRef]
  45. Calazans, G.M.; Pinto, C.C.; da Costa, E.P.; Perini, A.F.; Oliveira, S.C. The use of multivariate statistical methods for optimization of the surface water quality network monitoring in the Paraopeba river basin, Brazil. Environ. Monit. Assess. 2018, 190, 491. [Google Scholar] [CrossRef]
  46. El Gammal, H.A.A. Statistical analysis of water quality monitoring network case Study: Gharbia drainage catchments area. Adv. Environ. Biol. 2016, 10, 297–305. [Google Scholar]
  47. Simeonov, V.; Stratis, J.A.; Samara, C.; Zachariadis, G.; Voutsa, D.; Anthemidis, A.; Sofoniou, M.; Kouimtzis, T. Assessment of the surface water quality in Northern Greece. Water Res. 2003, 37, 4119–4124. [Google Scholar] [CrossRef]
  48. Vega, M.; Pardo, R.; Barrado, E.; Debán, L. Assessment of seasonal and polluting effects on the quality of river water by exploratory data analysis. Water Res. 1998, 32, 3581–3592. [Google Scholar] [CrossRef]
  49. Khalil, B.; Ouarda, T.B.M.J.; St-Hilaire, A. A statistical approach for the assessment and redesign of the Nile Delta drainage system water-quality-monitoring locations. J. Environ. Monit. 2011, 13, 2190–2205. [Google Scholar] [CrossRef]
  50. Guigues, N.; Desenfant, M.; Hance, E. Combining multivariate statistics and analysis of variance to redesign a water quality monitoring network. Environ. Sci. Process. Impacts 2013, 15, 1692–1705. [Google Scholar] [CrossRef] [PubMed]
  51. Pejman, A.H.; Bidhendi, G.R.N.; Karbassi, A.R.; Mehrdadi, N.; Bidhendi, M.E. Evaluation of spatial and seasonal variations in surface water quality using multivariate statistical techniques. Int. J. Environ. Sci. Technol. 2009, 6, 467–476. [Google Scholar] [CrossRef] [Green Version]
  52. Peña-Guzman, C.; Zamora, D. Determinación de las concentraciones de SST, DBO5, NT, PT, SAAM, GyA en el río Tunjuelo, Bogotá D.C. a través de modelos de redes neuronales tipo feed-forward. In Manejo del Riesgo en la Gestión del Agua: Retos Ante Los Riesgos Ambientales en el Ciclo del Agua, Justicia Ambiental y Conflictos; Universidad del Valle: Cali, Colombia, 2016; p. 440. ISBN 978-958-765-287-1. [Google Scholar]
  53. Ogwueleka, T.C. Use of multivariate statistical techniques for the evaluation of temporal and spatial variations in water quality of the Kaduna River, Nigeria. Environ. Monit. Assess. 2015, 187, 137. [Google Scholar] [CrossRef] [PubMed]
Figure 1. The water quality network on the Tunjuelo River.
Resources 08 00064 g001
Figure 2. Schematic flow chart for redesign process.
Resources 08 00064 g002
Figure 3. The first two principal components of a PCA with 10 water quality variables and flow rate measured at 10 stations along the Tunjuelo River through Bogotá, Colombia.
Resources 08 00064 g003
Figure 4. Variables contributions to the first (A) and second (B) principal components in a PCA with 10 water quality variables and flow rate measured at 10 stations along the Tunjuelo River through Bogotá, Colombia. The dotted red line corresponds to the expected value (1/100 = 9.09%). Note the y-axes differ in (A) and (B).
Resources 08 00064 g004
Figure 5. Distribution of values measured at each of the stations in the Tunjuelo River network for BOD5 (A), TN (B), COD (C), MBAS (D), TSS (E), and TP (F). Each of these variables contributed significantly to multi-dimensional variation along the course of the River through Bogotá, Colombia. Station abbreviations are as in Table 1. Values indicated in each of the boxplots are the median (central bar in the box), the interquartile range (the extent of the box), 1.5 times the interquartile range (whiskers), and values in excess of this range (open round symbols).
Resources 08 00064 g005
Figure 6. Dendrograms of water monitoring stations in the Tunjuelo River network created in a cluster analysis based on the similarity of the water quality variables biological oxygen demand (BOD5; A), total nitrogen (TN; B), chemical oxygen demand (C; COD), total suspended solids (TSS; D), total phosphorus (TP; E), and methylene blue active substances (MBAS; F).
Resources 08 00064 g006
Figure 7. Dendrograms of temporal (month) clusters formed at the stations selected to remain in the redesigned water quality network on the Tunjuelo River. Note that the y-axes of panels are not uniform. January (Jan), February (Feb), March (Mar), April (Apr), May, June (Jun), July (Jul), August (Aug), September (Sep), October (Oct), November (Nov), and December (Dec). (A) Regadera; (B) Yomasa; (C) Doña Juana; (D) Barrio Mexico; (E) San Benito; (F) Transversal 86; (G) Isla Ponton San Jose.
Resources 08 00064 g007
Table 1. The water quality network on the Tunjuelo River.
Station (Abbreviations)SectionDistance in Kilometers
La Regadera (Reg)1K0 + 000
UAN (UAN)1K7 + 430
Yomasa (Yom)2K12 + 881
Doña Juana (Doñ)2K15 + 760
Barrio Mexico (Mex)2K21 + 801
San Benito (Ben)3K22 + 652
Makro Auto Sur (Mak)3K31 + 839
TV 86 (T.86)4K36 + 036
Puente Independencia (ind)4K38 + 725
Isla Ponton San Jose (I.Pon)4K43 + 550
Table 2. Proposed months of water quality sampling at each station selected to remain in the Tunjuelo River water quality network after the proposed redesign.
StationMonth
Jan.Feb.Mar.Apr.May Jun.Jul.Aug.Sep.Oct.Nov.Dec.
RegaderaX XX XX X X
YomasaX X X X XX X
Doña JuanaX XX XXX X X
Barrio MexicoXX X XXXX X
San BenitoX X XXX XX X
TV 86X XX XXX X X
Isla Ponton San JoseX XX XX XX X

