Abstract
This study investigated the effect of natural compounds from Nile tilapia (Oreochromis niloticus) skin on wound healing in IL-10 knockout mice. The healing fraction, Fraction T19, was obtained through hydrolysis with trypsin. In vitro, T19 was not cytotoxic to RAW 264.7 macrophage cells, promoting increased cell proliferation and migration. In vivo, mice (n = 30) were divided into three groups with 12 mm wounds in the dorsal region: control (distilled water), T1 (T19 at 125 μg/mL), and T2 (T19 at 250 μg/mL). Daily applications were performed, with tissue removal after nine days. The results showed that T19 increased the production of nitric oxide (NO) and hydrogen peroxide (H2O2), preventing wound contamination. There was an increase in pro-inflammatory (IL-2 and IFNγ) and anti-inflammatory (IL-4) cytokines, as well as cell proliferation markers (PCNA and KI67). Antibodies CD31, CD163, and COX-2 indicated an increase in the formation of new vessels and a reduction in inflammation. Both groups treated with T19 showed better healing results, with better effects observed at higher doses. It was concluded that T19 can effectively modulate the skin repair process and represent an alternative therapeutic for improving the quality of wound skin, especially in the clinical context. Formulations using tilapia skin are safe and effective for accelerating wound healing.
Keywords:
peptides; hydrolysis; fish; tilápia Nilo; dressing; skin wounds; cell proliferation; healing 1. Introduction
The skin is the largest organ of the human body. It works as a chemical, physical, microbial, and thermoregulatory barrier, in addition to serving immune protection, sensory perception (heat, cold, touch, pain), aesthetic, and hemodynamic regulation roles [1]. Due to these many roles, the skin is exposed to aggression from intrinsic and extrinsic factors, such as wounds, which can cause structural changes. Open wounds involve the rupture of the tissue’s structure, with damage severity varying by depth and extent, potentially leading to functional disability [2]. Currently, the number of patients affected by skin wounds is high worldwide. In addition, data from recent surveys reveal that these lesions affect up to 5% of the adult population of the Western world, leading to high costs for health services [3,4,5]. This is mainly due to the growing number of associated chronic pathologies, such as diabetes and cancer [6]. Skin wounds can be considered a public health issue, since they affect the population in general, regardless of gender, age, or ethnicity, increasing the health system’s costs [7]. When the skin suffers an injury, it is necessary to repair the wound site quickly so that the body is not exposed to the external environment, which can often be hostile [8]. The repair process usually occurs in three distinct but overlapping phases—inflammation, proliferation, and remodeling—which are highly regulated by releasing various growth factors, such as cytokines, chemokines, and inflammatory and matrix cells [9]. In the first phase, there is the hemostasis phenomenon, with the recruitment of neutrophils and macrophages. These cells act as phagocytes, mediating cytokines and antimicrobial substances and releasing proteinase [10]. Thus, bleeding stops during hemostasis due to the intrinsic and extrinsic coagulation cascade. Platelets aggregate and trigger vasoconstriction to reduce blood loss, which results in hypoxia, increased glycolysis, and pH changes [11]. Vasoconstriction, triggered by platelets, helps reduce blood loss and fill the tissue gap with a blood clot that serves as a temporary wound matrix, providing a framework for different cellular factor migration [8,12]. In addition, the blood clot contains molecules of fibrin, fibronectin, vitronectin, and thrombospondins, forming the provisional matrix as a support structure for the migration of leukocytes, keratinocytes, fibroblasts, and endothelial cells supplied with growth factors [13]. Platelets influence leukocyte chemotaxis by releasing cytokines and growth factors. They initiate inflammation, stimulate collagen synthesis, activate fibroblasts into myofibroblasts, start angiogenesis, and support re-epithelialization [14].
In the next phase, known as proliferation, the wound is covered by the migration of fibroblasts along the fibrin network, followed by the restoration of the vascular network by the angiogenesis process. Thus, the temporary wound matrix is replaced [15]. During this phase, fibroblasts synthesize and deposit a new extracellular matrix, which supports cells and new blood vessels, forming granulation tissue [16]. This tissue works as a scaffold for the migration and organization of macrophages, keratinocytes, blood vessels, and collagen fibers, which partially recover the structure and function of the injured skin [15,17]. Restoring the skin’s vascular system involves a complex cascade of cellular, humoral, and molecular events in the wound bed. Growth factors bind to receptors on endothelial cells, triggering intracellular signaling and the secretion of proteolytic enzymes. These enzymes dissolve the basal lamina, enabling cell proliferation and migration to the wound site. By the end of this phase, the total number of cells decreases, especially as they mature into myofibroblasts and undergo apoptosis, ending the proliferative phase [18,19]. Furthermore, the extracellular matrix (ECM) is degraded and synthesized, replacing collagen III with collagen I, especially by the lysyl Oxidase enzyme. This process concludes inflammation and gradual remodeling of granulation tissue to form scar tissue [20,21]. This phase can last for many years after the injury, and there is usually a recovery of 80% of the original tissue strength before the injury [22]. Once a monolayer of keratinocytes covers the surface of the lesion, the epidermal migration of these cells stops, and a new stratified epidermis with an underlying basal lamina is reestablished from the edges of the wound to its inner portion [23].
Currently, several medications are used in wound care, such as silver sulfadiazine and mafenide acetate. However, these drugs have some main drawbacks, such as some serious side effects, ineffectiveness for deep wounds, the formation of visible scars, and a high cost of treatment [24,25]. Since the annual health expenditures are high for treating skin injuries, it is fundamental to develop new therapy options. Biopharmaceuticals have increased enormously since they efficiently promote the healing process and can represent a less costly treatment alternative [26,27,28,29]. Recent studies show positive results using peptides present in the skin of the tilápia Nilo (Oreochromis niloticus) in infected wounds and burns due to their antibacterial [30], antihypertensive [31], and neuroprotective [32] properties, which can also be applied for the treatment of lesions [33]. Thus, tilápia Nilo skin represents a low-cost alternative that can be beneficial for skin wound healing [34]. Tilapia fish skin has a dermis composed of compacted, long, and organized collagen bundles, predominantly type I [35], which stimulate Fibroblast Growth Factors (FGFs) and release Keratinocyte Growth Factor (KGF). These are two crucial and essential cytokines for wound closure [36]. In addition, the fish produce Marine Antimicrobial Peptides (MAPs) as part of their immune systems, such as piscidin, defensin, hepcidin, cathelicidin, and histone, which have antimicrobial effects and are essential for keeping the wound area free of infection [37]. A few studies have explored these peptides’ antioxidant and anti-inflammatory properties, which help speed up dermal healing. In addition, our study is the first to use IL-10 knockout mice. It is essential to highlight that Interleukin 10 (IL-10) is an anti-inflammatory cytokine that controls macrophage signaling to prevent chronic inflammation. In addition, it regulates angiogenesis by inducing the cell-type-dependent expression of both angiogenic and angiostatic factors. Thus, IL-10 knockout mice represent a desirable animal model, which may develop more significant inflammation and present reduced vascularization during the healing process [38]. Therefore, our objective is to study the effect of the new therapeutic formulation obtained from tilapia skin for wound healing; we believe this animal model is very valid because it allows us to examine this pathology in extreme conditions, with low vascularization and a high inflammatory profile.
2. Materials and Methods (Supplementary Figure S1)
2.1. Tilápia Nilo (Oreochromis niloticus) Preparation for Skin Extraction
Fourteen male tilápia Nilo specimens, 240 days (8 months) old, from the Nursery of the Fish Farming Sector DBA/UFV, with an average weight of 210 g, were used in the study. These animals were kept in a 250 L aquarium equipped with a mechanical and biological filter at 26 ± 1 °C for an acclimatization period of seven days. The fish were fed thrice daily, extruded commercially with 32% crude protein (CP). All experiments were approved by the Animal Ethics Committee of the Federal University of Viçosa (CEUA/UFV: 02/2020). The tilápia Nilo were weighed and euthanized at the Laboratory of Experimental Pathology (LAPEX) with an excess anesthetic of 400 mg of clove oil/L of water and a 1:9 anesthetic solution of clove oil–absolute alcohol [39]. After euthanasia, the skins were removed from the tilápia Nilo and sectioned into 12 cm2 segments at the base of the dorsal fin and washed in Hickman’s sterile saline solution (NaCl at 6.42 g/L; KCL at 0.15 g/L; CaCL2 at 0.22 g/L; MgSO4 at 0.12 g/L; NaHCO3 at 0.084 g/L, and NaH2PO4 at 0.06 g/L), the same solution as suitable for freshwater teleosts [40]. They were then stored in a freezer at −80 °C until use. The remaining carcasses of the animals were stored in a −20 °C freezer and later collected by the Waste Management Division of UFV.
2.2. Preparation of Tilápia Nilo Skin Hydrolysate for Peptide Recovery
Clean skins were homogenized with a manual homogenizer in the proportion of 1 g of clean skin to 3 mL of distilled water. Then, the homogenate was centrifuged at 10,000× g, 4 °C, for 10 min and lyophilized. The lyophilized extract was resuspended in buffer solution (0.6 g Tris-HCl and 0.01g CaCl2 prepared in 100 mL of distilled water) in a 1:1 ratio (5 mg of lyophilized extract + 5 mL of sample buffer) and centrifuged at 2500× g for 12 min. Following this, the supernatant was collected, and trypsin enzyme was added to the mixture in a 1:0.2 ratio (1000 μL of the extract + 200 μL of enzyme) and incubated in a water bath at different times (0 h, 2 h, 4 h, 6 h, and 19 h) at 38 °C, for digestion. The enzyme was deactivated by heating the mixture to 100 °C for 15 min. The mixture was cooled to room temperature and centrifuged at 9000× g for 10 min to remove debris. The supernatant was collected and stored in a −80 °C freezer until use. The peptide concentration in the hydrolysates was measured using Bradford’s method [41].
2.3. LC/MS-MS Analysis
An Amazon Ion Trap® mass spectrometer (AmaZon Speed, Bruker Daltonics, Bremen, Germany) and a Waters nanoAcquity UPLC system (Waters Corporation, Milford, MA, USA) made up the LC-MS/MS system to analyze the T19 hydrolysate sample. Chromatographic analysis was performed on the sample using a trap column and a C18 BEH130 capillary column, measuring 1.7 μm to 100 μm × 100 mm and running at a flow rate of 0.400 μL/min. With the use of a nanoESI ionization needle, the peptides were automatically eluted and fed into an online mass spectrometer. The gradient program in this step was carried out using the following mobile phase solutions: (A) water and 0.1% formic acid (v/v) and (B) acetonitrile and 0.1% formic acid (v/v). The chromatographic setup began with a desalination step that maintained 5% of (B) for five minutes. Next, a gradient was established, which consisted of a linear ascent from 50% to 90% of (B) for ten minutes, 90% of (B) for five minutes, a linear descent from 90% to 10% of (B) for five minutes, and maintenance at 10% of (B) for five minutes. Positive mode scanning was used to scan the ions for the MS1 and MS2 mass ranges, 300–1500 m/z and 70–3000 m/z, respectively. The process of acquiring the data took about 75 min. To obtain MS2 spectra for the most intense ions in each complete scan spectrum—aside from the single-charged ions—the IonTrap spectrometer was run in auto-MSn mode. The Bruker Daltonics (Germany) Hystar application, version 3.2, was used to oversee data collecting. Data Analysis, version 4.0 (AmaZon Speed, Bruker Daltonics, Bremen, Germany) was used to process the mass spectra using the normal proteomics parameters. The peak lists were produced using the CompassXport tool, version 3.0 (AmaZon Speed, Bruker Daltonics, Bremen, Germany), in extensible mark-up language format (*mzXML).
2.3.1. Protein Identification
The list masses were compared against protein sequences belonging to the Oreochromis niloticus species (uploaded on 13 September 2021, with 75,971 entries). The comparison was performed using the PEAKS software, version 7.0 (Bioinformatics Solutions Inc., Waterloo, ON, Canada) [42]. The parameters used for the research were enzymatic digestion by trypsin, not considering the occurrence of lost cleavage; carbamydomethylation of cysteine as a fixed modification; and methionine oxidation as a variable modification. Error tolerance for the parent ion and fragments was 0.2 Da, with the analysis of ions with +2, +3, and +4 charges. Proteins were considered ‘identified’ when they had at least two unique peptides with an FDR (False Discovery Rate) of less than one percent. The peptide sequences that did not align with any of the proteins were predicted by the de novo sequencing method, using the only algorithm inserted in the PEAKS application platform, version 7.0 [43].
2.3.2. Characterization of the Amino Acid Composition of MCPs
The amino acid sequences of marine collagen peptides (MCPs), obtained from mass spectrometry data, were submitted to amino acid quantification by the ProtParam—ExPASy tool (SIB Swiss Institute of Bioinformatics, Geneva, Switzerland).
2.4. In Vitro Assays
2.4.1. Cytotoxicity/Proliferation Assays
The cytotoxicity/proliferation assays were performed in triplicate with the RAW 264.7 macrophage cell line to define the compounds extracted from tilapia fish with the most promising effects for the cell proliferation and migration assay. Cells were supplemented with Dulbecco’s Modified Eagle’s Medium (DMEM, supplemented with 10% fetal bovine serum, 100 U/mL penicillin, and 100 μg/mL streptomycin) at 37 °C in an atmosphere with 5% CO2. Cells were counted in Neubauer’s chamber and plated to a 96-well culture dish for 24 h at 37 °C and 10% CO2. The cells were treated with homogenate with different hydrolysis times (0 h, 2 h, 4 h, 6 h, and 19 h) and diluted in a medium supplemented with 10% SFB for 24 h. These different hydrolysates are called T0, T2, T4, T6 and T19.
After this, the MTT assay, previously described by [44], was performed to verify cell viability. For MTT analysis, the media were removed from the wells after 22 h, and 50 μL of methylthiazolyldiphenyltetrazolium bromide (MTT) was added per well, being incubated again for 2 h at 37 °C and 5% CO2. After this period, 100 μL of the supernatant was removed, and 90 μL of DMSO was added per well. The plates were homogenized for 5 min, and the absorbance was determined at 570 nm using a Multiskan™ FC plate reader (Thermo Fisher Scientific, Waltham, MA, USA). The cell viability rate is calculated by
where the optical density (OD) values of the samples and control are coded as OD570 (sample) and OD570 (control).
Cell viability − OD570 (sample)/OD570 (control) × 100%
2.4.2. Scratch Assay
For the scratch assay, the RAW 264.7 Macrophage cell line was cultured in Dulbecco’s Modified Eagle medium (DMEM, supplemented with 10% fetal bovine serum, 100 U/mL penicillin, and 100 μg/mL streptomycin) at 37 °C in atmosphere with 5% CO2. Cells were deposited in 24-well plates at a density of 5 × 10³ cells/well and then cultured for 24 h in cell monolayers. A 1000 μL pipette tip was used to create an even scratch on the monolayer of cells. The residues of non-adhered cells were removed by washing with PBS twice. The control group was treated with DMEM + 10% FBS, and the test groups were analyzed with (the compounds T0, T2, T4, T6, and T19). Scratch closure was observed using a Leica inverted light microscope, and the scratch area was calculated using ImageJ software. The following formula calculated the scratch closure rate:
where A 0 is the area of the scratch at time 0, and A t is the area of the scratch at the designated time.
Scratch Closure Rate (%) = (A 0 − A t)/A 0 × 100%
2.5. In Vivo Assays
2.5.1. Animals
A total of 30 (C57) IL-10 knockout mice were used, with an average weight of 28 ± 2 g at 20 weeks of age. The animals were randomly allocated in groups at the Vivarium of the Department of Nutrition (Animal Nutrition Laboratory/UFV). The animals were kept in individual cages with cycles of 12 h of light and 12 h of darkness and controlled temperature (24 ± 2 °C; 60–70% humidity). The animals had access to water and commercial feed ad libitum. All procedures were approved by the Animal Ethics Committee for the Use of Animals in Research, adopted by the Federal University of Viçosa (CEUA/UFV: 02/2020).
2.5.2. Experimental Design
The animals were randomly assigned to three groups, with 10 animals in each. Group C received 50 μL distilled water (control); T1 received 25 μL of the T19 peptide compound (18.75 μg/mL); and T2 received 50 μL of the T19 peptide compound (37.5 μg/mL). Doses were chosen based on literature studies and in vitro analyses. The treatments were administered topically for nine days. After this period, the animals were euthanized due to excessive anesthetic (Figure 1).

Figure 1.
Representation of the experimental model of second intention wound healing and wound evolution concerning the time of exposure to the T19 peptide compound. The upper image shows the distribution of the excisional wound on the animal’s dorsum (F1). Photomicrographs represent the general appearance of the initial wound (day 0) and the evolution of healing on (day 9) after receiving T19. Based on scanned images, the wound area was calculated on days 0 and 9 (mean ± SD).
2.5.3. Surgical Wounds
Animals were anesthetized with an intraperitoneal injection dose of the compound containing ketamine and xylazine (10 mg/kg). After anesthesia, the dorsolateral hair removal of the mice was performed using a cutting machine, and the area was cleaned with 70% alcohol. The wound area was marked with a violet crystal and measured with an analog caliper (Mitutoyo Sul Americana Ltda®, São Paulo, Brazil) [45]. A circular second intention wound of 12 mm2 in diameter was made in the dorsolateral region of each mouse until the dorsal muscle fascia was exposed using surgical scissors. Tissue samples were obtained from the wound on days 0 and 9 after the injury. These samples were used for histological, biochemical, and immunohistochemical analyses.
2.5.4. Measure of Wound Area and Contraction Rate
The wound area and contraction rate were assessed at nine days using scanned photos with 4032 × 3024 pixels (dual camera 12 MP + 12 MP) captured by the Samsung Galaxy S9 Plus smartphone (Samsung Eletrônica da Amazônia Ltda, Manaus, Amazônas, Brazil). To calculate the ICF wound contraction index (%) [45], the following equation was used:
initial wound area (Ao) − area on a given day (Ai)/initial wound area (Ao) × 100
2.5.5. Histological Analysis
Samples taken from the wounds were fixed in Karnovsky’s solution, dehydrated in ethyl alcohol, diaphanized in xylol, and submerged in paraffin. The samples included tissue from the center of the damage and some tissue surrounding the edges of the lesions. Using a rotating microtome (Leica Multicut® 2045, Reichert-Jung Products, Jena, Germany), histological slices (4 μm thick) were produced. Hematoxylin and eosin (HE) staining was applied to the slices to analyze the cells and blood vessels [46]. A Leica DM 750 light microscope and a Leica MC170 HD digital camera were used to examine the slides and take pictures. At a 20× magnification, ten randomly selected photos with a resolution of 2048 × 1536 pixels were acquired for every HE-stained area. Using a grid of 216 intersections connected to the image analysis program Image Pro-plus 4.5 software (Media Cybernetics Corporation, Silver Spring, MD, USA), blood vessel counts were carried out.
2.6. Analysis of Oxidative Stress Markers and Antioxidant Defenses
Each wound’s tissue fragments were removed, instantly frozen in liquid nitrogen (−196 °C), and then kept in a freezer at −80 °C. After homogenizing the samples in 100 mg of phosphate-buffered saline (PBS) and 1 mL of PBS, the samples were centrifuged for 5 min at 10,000× g (12,000 rpm) while being refrigerated at 5 °C [47].
2.6.1. Hydrogen Peroxide Production
In tissue homogenate supernatants, the generation of hydrogen peroxide (H2O2) was quantified. A total of 50 μL of supernatant was treated with an equivalent volume of type II peroxidase (15 mmol/L) and 50 μL of o-phenylenediamine (OPD). Using a known concentration of H2O2, a standard curve was used to quantify the conversion of absorbance to micromolar quantities of H2O2. The findings were presented in terms of μmol/L [48].
2.6.2. Nitric Oxide Analysis
By using the conventional Griess reaction to detect the amounts of nitrite/nitrate (NO2−/NO3−), nitric oxide (NO) was indirectly measured [48]. For ten minutes, 50 μL of supernatants were incubated at room temperature with an equal volume of Griess reagent (1% sulfanilamide, 0.1% N-(1-Naphthyl) ethylenediamine, and 2.5% H3PO4). Using a standard sodium nitrite curve (0–125 μM), absorbance conversion in NO micromolar concentrations was achieved and reported as NO concentrations (μmol × L−1).
2.6.3. Determination of TBARS
Tissue fragments were collected from each wound, frozen in liquid nitrogen (−196 °C), and stored at −80 °C. Samples were homogenized in phosphate buffer and centrifuged at 5 °C at 3500× g for 10 min, and the supernatant was used for analysis of thiobarbiturate reactive substances (TBARSs) and quantified using an ELISA reader set at 532 nm. The step-by-step procedure is described below [49,50].
Preparation of solutions
TBARS Solution (Thiobarbituric Acid Reactive Substance)
- 0.375% TBA solution (Reagent: 2-thiobarbituric acid 98%, Sigma-Aldrich, St Louis, MO, USA)
- -
- Weigh 0.0375 g of TBA.
- -
- Dilute in 10 mL of distilled water.
- -
- Homogenize in a heated magnetic stirrer, as the solution requires diluting time.
- 0.25 M HCl solution (Reagent: Hydrochloric Acid 37% P.A.)
- -
- Pipette 214.6 µL of HCl.
- -
- Complete the volume with 10 mL of distilled water.
- -
- Homogenize with a magnetic stirrer.
Note: HCl must be pipetted into the Gas Exhaust Hood. - 15% TCA solution (Reagent: Trichloroacetic Acid ≥ 99%; Sigma-Aldrich)
- -
- Weigh 1.5 g of TCA.
- -
- Complete the volume with 10 mL of distilled water.
- -
- Homogenize with a magnetic stirrer.
- After preparation, combine the 3 solutions in a single bottle covered with aluminum foil to create a TBARS solution with a final volume of 30 mL. This step must be performed in a dark environment, and the solution must be prepared for use on the same day, as TCA turns to water and TBA oxidizes). The TBARS solution is transparent in color.
Construction of the Standard Curve
- To construct the curve, a 10 mM TMPO stock solution must be prepared.
- Pipette 16.47 µL of the reagent 1,1,3-Tetramethoxypropane (TMPO) [MW: 1645.2; Density: 0.997, Sigma-Aldrich].
- Dilute in 10 mL of distilled water in an amber bottle or a bottle lined with aluminum foil.
- Homogenize and store at −20 °C (in 10 mM stock solution) until the next day.
- Assemble the Standard Curve.
Sample procedure
Identify three 1.5 mL microtubes for each sample to be analyzed (the assay is carried out in triplicate). Prepare only eight samples at a time.
- -
- Add 200 µL of the sample (tissue or plasma) to each microtube (leave it on ice).
- -
- Perform the following steps for all microtubes (samples and standard):
- (1)
- Pipette 400 µL of the previously prepared solution (TBARS).
- (2)
- Mix in the vortex for at least 10 s.
- (3)
- Place in a water bath for 40 min at 90 °C (be careful not to let water enter).
- (4)
- Place in an ice bath for 5 min.
- (5)
- Add 600 µL of n-Butanol.
- (6)
- Vortex for 1 to 2 min to invert the phase (the upper part becomes pink, and the lower part clear).
- (7)
- Centrifuge at 3500 rpm for 10 min at 15 °C.
- (8)
- CAREFULLY remove 200 µL of the supernatant (upper liquid phase—light pink color).
- (9)
- Aliquot into each well of the 96-well plate (check the plate design in the diagram below).
- (10)
- Perform the reading on a plate spectrophotometer at 540 nm.
- (11)
- Expected absorbance values are between 0.1 and 1.
- (12)
- The biochemical data are normalized to total protein levels in the supernatant. The total protein levels are quantified in all homogenates [41].
2.6.4. Superoxide Dismutase Activity
Superoxide dismutase (SOD) activity was determined by the reduction of superoxide (O−2) and hydrogen peroxide, thereby decreasing the auto-oxidation of pyrogallol [51]. SOD activity was calculated as units per milligram of protein, with one unit (U) of SOD defined as the amount that inhibited the rate of pyrogallol autoxidation by 50%.
2.7. Cytokine Expression Analysis
Scar tissue samples collected on days 0 and 9 were frozen at −80 °C, homogenized in PBS buffer (pH 7.4) containing 0.05% Tween, and centrifuged at 3500× g for 30 min. The supernatant was analyzed using immunoassay kits by the BD Cytometric Bead Array (CBA)/Th1/Th2 Mouse of the BD Cytometry Notes (CBA) segment (BD Biosciences, San Diego, CA, USA). Data were collected using FACSCalibur and analyzed using the FCAP 3.0 software system (BD Biosciences, San Diego, CA, USA). The cytokines IL-2 (interleukin-2), IL-4 (interleukin-4), and IFN-γ (interferon-γ) were used for flow cytometry, according to the manufacturer’s recommendations.
2.8. Immunohistochemistry Analysis
For immunohistochemical analysis, the tissue samples were cut into small fragments and placed in buffer solution, PBS-T (1%), for 1 h and 30 min, changing the solution every 30 min to open the membrane, thus allowing the antibody’s entrance. After this step, all the buffer solution was removed, and 40 μL of diluted antibody was added, which was then stored in the refrigerator for 48 h. Primary antibody solutions were used in the following proportions (Anti-CD31—1/500, Anti-CD 163—1/500, Anti-MMP (PCNA)—1/500, Anti-COX-2—1/1000, Anti-Ki 67—1/500). Soon after, the vials were washed with TBS to remove the primary antibodies and prevent over-marking.
Then, 40 μL of fluorescein isothiocyanate (FITC) was added as a secondary antibody and left overnight. Moreover, the samples went through the process of dehydration and inclusion in the resin. All steps were carried out in the dark. After completing the immunohistochemical protocol, images were obtained using the Thermo Fisher Scientific EVOS™ M5000 Imaging System microscope. Subsequently, images were edited using GIMP version 2.10.24, so that only the structures marked by the immunohistochemistry technique remained in the images. Then, the already edited images were analyzed in the Image J program, version 1.42q, to count the marked structures.
2.9. Statistical Analysis
Each experimental group contained ten animals from 30 animals used (2 tested doses and one control group). A circular second intention wound of 12 mm2 in diameter was made in the dorsolateral region of each mouse. The total tissue collected was 30 samples cut into small fragments, and three fragments were obtained for each analysis. In addition, the analyses were done in triplicate. Statistical analysis was performed using GraphPad Prism 7 software (GraphPad Software Inc., San Diego, CA, USA). The results were expressed as mean and standard deviation (mean ± SD), and a one-way analysis of variance (ANOVA) was performed followed by the Student–Newman–Keuls parametric test. Statistical significance was set at p < 0.05.
3. Results
3.1. Enzymatic Hydrolyse
After enzymatic hydrolysis with the trypsin enzyme, five different compounds were obtained according to their incubation time: T0, T2, T4, T6, and T19. The objective was to observe if there was a dose response regarding the amount of peptides. T0 is without hydrolysis, and T19 is overnight hydrolysis–complete hydrolysis. T2, T4, and T6 were to obtain partial hydrolysis. At each point, there are different amounts of peptides.
Bradford’s analysis determined the level of peptide concentration in the dosages of 25 and 50 microliters of the T19 peptide compound, which was 18.75 μg/mL and 37.5 μg/mL, respectively.
3.2. LC/MS-MS Analysis
3.2.1. Peptide Characterization
After the T19 peptide composition analysis, a report was generated describing the proteins and amino acid sequences present in the sample. The protein/peptide ratio contains 16 proteins (identified with one or more peptides, with molecular weights less than 2 kDa) (Table 1), 2 uncharacterized proteins identified by BLASTp (Table 2), and 136 TAGs (sequences that did not align with the identified proteins) (Supplementary Materials).

Table 1.
Peptide sequences that aligned with proteins from the tilápia Nilo skin hydrolysate.
Table 2.
Peptide sequences that aligned with tilápia Nilo skin uncharacterized proteins identified through BLASTp.
3.2.2. Amino Acid Composition of MCPs
Type I collagen peptides (alpha 1, 2, and 3) from tilápia Nilo skin were analyzed in terms of composition, quantification, and the proportion (%) of amino acids, and the results are shown in Table 3. The MCPs (Marine Collagen Peptides) from the skin of tilápia Nilo contained nine essential amino acids, of which five had residues (11.76%), and thirteen non-essential amino acids, of which nine had residues (88.24%). The amount of glycine, proline, and alanine as the primary amino acids in MCPs represented 33.6%, 16%, and 16%, respectively. These were consistent with the Gly-Pro-Wing sequence. The amino acid content (glycine, proline, and alanine) in MCPs was 78 residues per 119 total amino acids. From the amino acid composition, most of the residues in MCPs were hydrophilic, such as glycine, glutamic acid, arginine, aspartic acid, lysine, serine, valine, leucine, and isoleucine, which represented more than 56% of the total residues.
Table 3.
Composition and quantification of amino acids of peptide samples aligned with type I collagen proteins (alpha 1, 2 and 3) of tilapia Nile skin were done using fourteen male tilápia Nilo specimens.
3.3. In Vitro Assays
3.3.1. Cytotoxicity/Proliferation Assays
No cytotoxicity was observed after exposure of macrophage cells to lyophilized homogenate and T19. In addition, the highest cell proliferation and migration (37.5 μg/mL) was observed after a 24 h incubation after T19 exposure (Figure 2a,b).
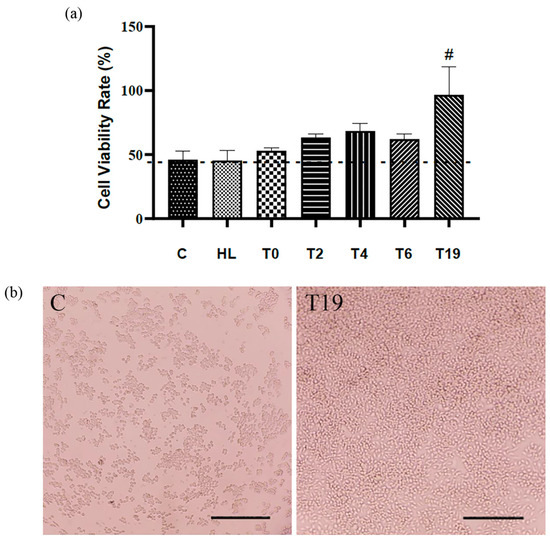
Figure 2.
Effects of hydrolysates in RAW 264.7 macrophage culture on cytotoxicity/proliferation assay. (a) Statistical graph of cell viability. (b) Photomicrographs illustrating the confluence of RAW 264.7 macrophage cells in C (control group: cells cultivated in DMEM w/10% SFB) and T19 group. Bar = 100 μm. In the graph, data are represented as mean and standard deviation. The # symbol represents a statistical difference between C (control), HL (lyophilized homogenate), T0, T2, T4, and T6. The dotted line marks the zero point between the samples, above are the significant results. Student–Newman–Keuls parametric test, p < 0.05.
3.3.2. Effect of T19 on the Scratch Assay
The effects of different hydrolysis times (T0, T2, T4, T6, and T19) on the healing process were investigated using the in vitro scratch assay with RAW 264.7 macrophage cells. The closure rate was calculated after 24 h; the result is shown in Figure 3. The non-hydrolyzed sample (T0) did not show significant results compared to the control group. Samples hydrolyzed at T2, T4, T6, and T19 potentiated cell proliferation and migration. Moreover, it was in T19 hydrolysis that the compound showed the most significant migratory potential when compared to the other groups.
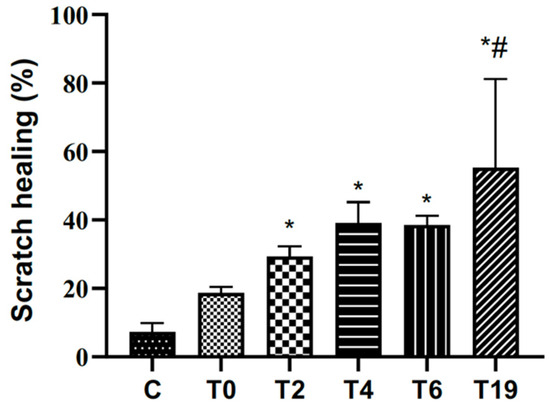
Figure 3.
Effects of different hydrolysis times in the in vitro scratching assay with RAW 264.7 macrophages. C: control group (cells cultivated in DMEM c/SFB 10%) T0, T2, T4, T6, and T19 (test groups treated with lyophilized tilápia Nilo skin homogenate at different hydrolysis times of 0 h, 2 h, 4 h, 6 h, and 19 h). Contraction was evaluated after 24 h. In the graph, data are represented as mean and standard deviation. The symbol * represents a statistical difference to C (control), and # represents a statistical difference to T0. Student–Newman–Keuls parametric test, p < 0.05.
3.4. In Vivo Assays
3.4.1. Wound Area and Wound Contraction Index
The wound area was smaller in the T2 group, treated with 50 μL of the T19 peptide compound (37.5 μg/mL), and T1, treated with 25 μL of the T19 peptide compound (18.75 μg/mL) when compared to the control group treated with 50 μL of distilled water (Figure 4a). The rate of wound contraction was higher in the T2 and T1 groups, respectively, compared to the control group on the 9th day (Figure 4b).
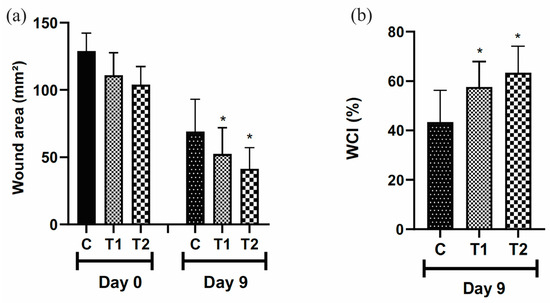
Figure 4.
Representation of wound area (mm2) (a). WCI (%) = wound contraction index in percentage (b). Group C received 50 μL of distilled water (control); T1 received 25 μL of the T19 peptide compound (18.75 μg/mL), and T2 received 50 μL of the T19 peptide compound (37.5 μg/mL). Topical dose administration. In the graphs, data are represented as mean and standard deviation. The * symbol represents the statistical difference to the C (control) group. Student–Newman–Keuls parametric test, p < 0.05.
3.4.2. Histopathological Results
On day 9, the proportion of cells and blood vessels in the T1 and T2 groups was higher than in the control group. However, the most expressive result was observed in the T2 group (Figure 5a,b). The representative distribution of cells and blood vessels in the scar tissue of the different groups is shown in Figure 5c.

Figure 5.
(a) Cellularity, (b) blood vessels results, and (c) photomicrographs showing blood vessels (arrows) in the scar tissue of IL-10 knockout mice (C57) treated with tilápia Nilo skin hydrolysate on the ninth day; bar = 100 μm. Group C: received 50 μL of distilled water (control); T1: received 25 μL of the T19 peptide compound (18.75 μg/mL); and T2: received 50 μL of the T19 peptide compound (37.5 μg/mL). In the graphs, data are represented as mean and standard deviation. The * symbol represents the statistical difference to C (control). Student–Newman–Keuls parametric test, p < 0.05.
3.5. Results of Oxidative Stress Markers and Antioxidant Defenses
3.5.1. Antioxidant Enzyme
The values for the antioxidant enzyme superoxide dismutase (SOD) were not different among the groups after exposure to the compounds (T1 and T2) compared to the control group (Figure 6).
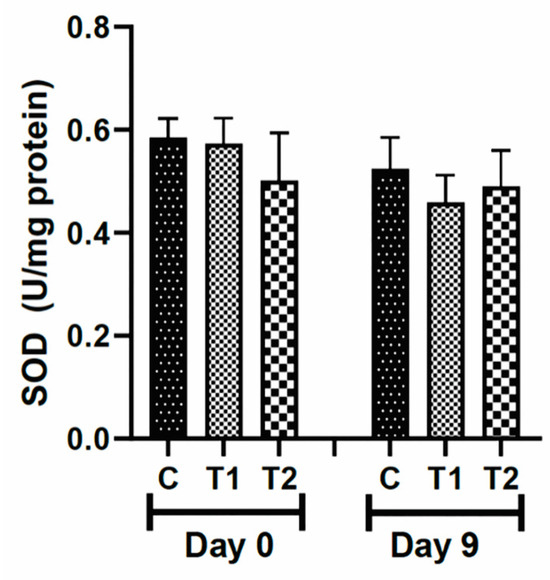
Figure 6.
Levels of superoxide dismutase (SOD) in the scar tissue of knockout IL-10 mice (C57) treated with tilápia Nilo skin hydrolysate. Group C: received 50 μL of distilled water (control); T1: received 25 μL of the T19 peptide compound (18.75 μg/mL); and T2: received 50 μL of the T19 peptide compound (37.5 μg/mL). In the chart, data are represented as mean and standard deviation. There was no statistical difference among the groups. Student–Newman–Keuls parametric test, p > 0.05.
3.5.2. Evaluation of Oxidative Stress Markers
On day 9, H2O2 levels were higher in the T1 and T2 treated groups than in the control group (Figure 7a). Nitric oxide (NO) concentrations were higher in the T1 and T2 groups compared to the control group on day 9. However, the most expressive result is observed in the T2 group (Figure 7b). Secondary lipid oxidation compound levels (substances able to react with TBA) were not significantly different during the test period (Figure 7c).
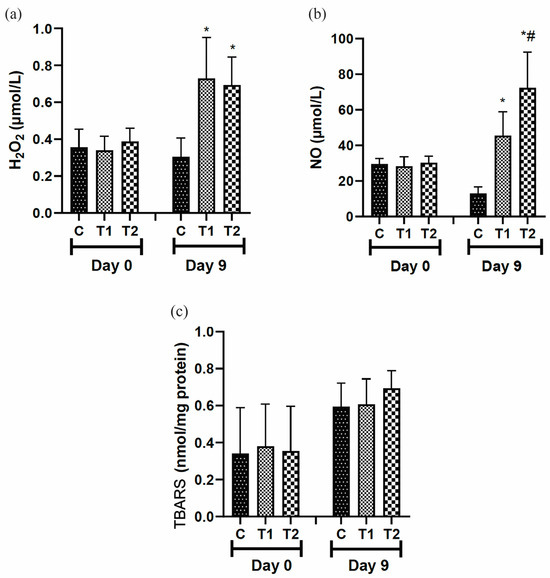
Figure 7.
Levels of (a) hydrogen peroxide (H2O2), (b) nitric oxide (NO), and (c) TBARS reaction in the scar tissue of IL-10 knockout mice (C57) treated with tilápia Nilo skin hydrolysate. Group C: received 50 μL of distilled water (control); T1: received 25 μL of the T19 peptide compound (18.75 μg/mL); and T2: received 50 μL of the T19 peptide compound (37.5 μg/mL). In the graph, data are represented as mean and standard deviation. The * symbol represents a statistical difference between C (control), and # represents a statistical difference to T1. Parametric Student–Newman–Keuls test. p < 0.05.
3.6. Analysis of Pro- and Anti-Inflammatory Cytokines in Scar Tissue
Regarding the inflammatory profile, the pro-inflammatory cytokines (IL-2 and INFγ) were higher in the T2 group on day nine compared to the other groups (Figure 8a,b). When analyzing the anti-inflammatory marker (IL-4) on day 9, the animals that received T2 had higher levels compared to T1 and the control group on the same day (Figure 8c).
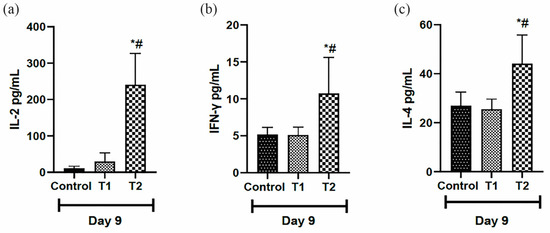
Figure 8.
Levels of pro-inflammatory cytokines: (a) Interleukin-2 (IL-2), (b) Interferon-gamma (INF-gamma) and anti-inflammatory cytokines, and (c) Interleukin-4 (IL-4) in the scar tissue of IL-10 knockout mice (C57) on day 9. Group C: received 50 μL of distilled water (control); T1: received 25 μL of the T19 peptide compound (18.75 μg/mL); and T2: received 50 μL of the T19 peptide compound (37.5 μg/mL). In the chart, data are represented as mean and standard deviation. The * symbol represents a statistical difference to C (control), and # represents a statistical difference to T1. Student–Newman–Keuls parametric test, p < 0.05.
3.7. Immunohistochemistry
On day 9, CD31 and PCNA marker levels were higher in the T1 and T2 groups than in the control group (Figure 9a,e). The levels of CD163 and COX-2 markers were lower in the T1 and T2 groups compared to the control group on day 9, with the greatest difference observed in T2 (Figure 9b,c). The level of the Ki67 marker was higher in the T2-treated group when compared to the T1 and the control group (Figure 9d).
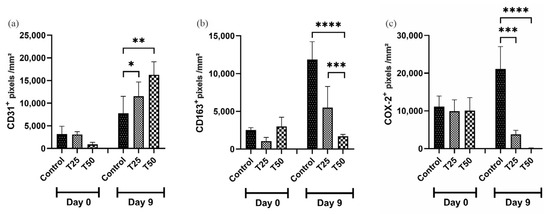
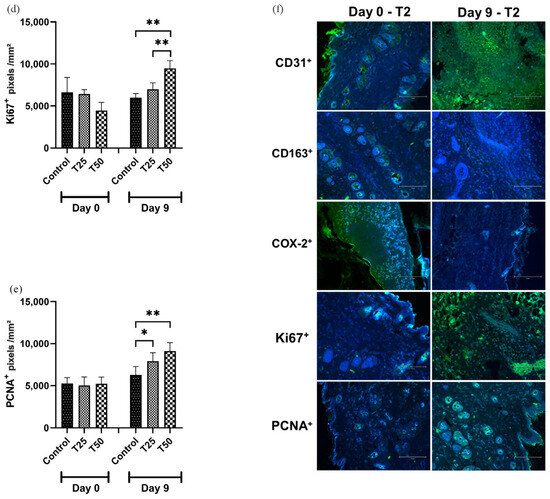
Figure 9.
Levels of positive markings. (a) CD31+; (b) CD163+; (c) COX-2+; (d) Ki67+; (e) PCNA+; and (f) photomicrograph illustrating the markers in the tissue of IL-10 knockout (C57) mice on days 0 and 9. Group C: received 50 μL of distilled water (control); T1: received 25 μL of the T19 peptide compound (18.75 μg/mL); and T2: received 50 μL of the T19 peptide compound (37.5 μg/mL). The results are presented as the number of pixels per mm2 per field analyzed. In the chart, data are represented as mean and standard deviation. The symbols *, **, *** and **** represent the levels of statistical difference to C (control), and # represents a statistical difference to T1. Student–Newman–Keuls parametric test, p < 0.05.
4. Discussion
Identifying animal peptides with healing properties has opened a new perspective for treating skin wounds [29,52,53]. In our study, the hydrolyzed compound of tilápia Nilo fish skin (T19) showed effective results in the skin repair process. According to Alves et al. (2020), positive results regarding the decrease in wound area were observed after peptides obtained from tilápia Nilo were applied to infected wounds [54]. This result possibly occurred because some AMPs (Antimicrobial Peptides), present in the skin of tilapia Nilo fish, have a potent microbicidal effect, in addition to participating in the indirect modulation of the host’s defense system through the enhancement of the immune system and cellular response [55]. This characteristic has been associated with the presence of the peptides piscidin 3 (TP3) and piscidin 4 (TP4), both originating from the species O. niloticus [56]. In addition, recent studies have suggested that peptides obtained from the hydrolysis of tilápia Nilo skin also exhibit anti-inflammatory, proliferative, antioxidant, antibacterial, and antihypertensive activities that can positively alter tissue repair [34]. The implications of these findings extend to the prospect of developing targeted therapies in the future. Understanding the pathways activated after tilapia skin exposure can improve the treatment of wounds, allowing for more precise and personalized approaches to treatment. These insights open avenues for the advancement of regenerative medicine strategies, offering hope for improved therapeutic outcomes.
Various peptide groups can be obtained at different digestion times through the enzymatic hydrolysis of the collagen from the tilápia Nilo skin [57]. Of the 16 proteins in T19, type I collagen peptides (alpha 1, 2, and 3), known as MCPs (Marine Collagen Peptides), were identified. Different enzymes are involved in the production of peptides from collagen, namely bromelain, ficain, papain, pepsin, trypsin, and chymotrypsin [58]. Gbogouri et al., 2004, and Hu et al., 2017, analyzed the peptides extracted from the tilápia Nilo skin and described components with less than 1, 3, and 5 kDa, representing 73.92%, 95.84%, and 99.14%, respectively, which showed that the collagen peptides of the tilapia skin were mainly composed of a series of polypeptides with small molecular weights [34,58]. Collagen generally contains about 30% glycine, 12% proline, and 11% alanine [59,60,61,62]. In the present study, the amount of glycine, proline, and alanine as the primary amino acids in MPCs represented 33.6%, 16%, and 16%, respectively [59,60,61,62]. These were consistent with the Gly-Pro-Ala sequence often observed in collagen sequences (3.4–5.5%) [61,63]. The hydrophilic properties of MCPs can be used to improve histocompatibility and absorption [34,59]. In the procedure of preparation and identification of MCPs, so far, no studies have been found using only the enzyme trypsin, only a protease complex containing 7% trypsin, 65% papain, and 28% alkaline protease, to extract peptides from the skin of Chum Salmon (Oncorhynchus keta) [26]. In another study, as mentioned above, neutral protease and papain enzymes were used to extract MCPs from the skin of tilápia Nilo (O. niloticus) [34]. Trypsin is a serine protease that acts by cleaving at the C-terminal end of lysine and arginine amino acids [64]. In the present study, only the trypsin potential for MCP production was evaluated. In both the present study and previous studies, the composition of collagen peptides includes a high percentage of glycine, proline, and alanine. This consistency in composition suggests that MCPs (Marine Collagen Peptides) from different collagen sources share similar structural and functional properties. Collagen peptides extracted from Nile tilapia skin have small molecular weights (<1, 3, and 5 kDa). This characteristic is a standard feature found in other studies, indicating that efficient enzymatic hydrolysis produces low-molecular-weight peptides, which are desirable due to their high bioactivity and ease of absorption by the body. In summary, methodological differences, mainly focusing on the exclusive use of trypsin, may highlight new properties and benefits of Nile tilapia-derived MCPs. Potential advantages include improved biocompatibility, absorption efficiency, and a sustainable source of bioactive peptides.
The in vitro assay to evaluate cells’ cytotoxicity/proliferation and migratory potential is an essential tool for understanding the action of a compound in the wound healing process. Thus, it has been used as a guide concerning the dose and exposure time of the compounds, serving as a model for conducting in vivo studies [27,65]. In our research, the T19 fraction showed greater proliferative and migration capacity in these cells than the other hydrolysates; this compound did not show a cytotoxic effect. Furthermore, a higher proliferative and migratory capacity was also observed after exposure to 50 μL (37.5 μg/mL). We observed that the in vivo analyses showed that the dose of 50 μL (37.5 μg/mL) administered in the T2 group provided (1) a more effective wound closure; (2) an increase in the wound contraction rate index; and (3) corroboration of the in vitro results. This finding is possibly associated with inflammatory modulation promoted by the compound [28,29,30,66].
As mentioned earlier, the wound healing process is based on three different phases overlapping each other. In the initial phase, we observe an increase in the number of cells essential for mediator synthesis that promotes the evolution of the healing process [9]. In this step, cells have high metabolic activity and need to receive nutrients and oxygen for cellular functions to be maintained; the tissue also has many blood vessels that maintain cellular homeostasis [67,68]. In the present study, it was observed that on day nine, there was an increase in cellularity and tissue vascularization after exposure to 50 μL of T19 at the dosage of (37.5 μg/mL) compared to the other groups.
These results demonstrate the promising effect of T19, especially in the inflammatory and proliferation phases of the healing process, where cell recruitment and good tissue vascularization are essential for the correct closure of the injury, as well as for the synthesis of granulation tissue, an important framework for the synthesis of other components of the extracellular matrix [69,70]. Nile tilapia peptides can stimulate cell proliferation and migration, essential for wound healing, and act in the inflammatory, proliferative, and remodeling phases. Unlike many synthetic or mammal-derived agents, Nile tilapia peptides have a lower risk of transmitting zoonotic diseases and causing allergies. Its specific amino acid sequences confer unique bioactive properties that can improve cellular response. Nile tilapia is a fish farmed on a large scale that offers a sustainable and economical alternative to the production of peptides. The use of Nile Tilapia skin in burn treatments has already demonstrated safety and biocompatibility, favoring its acceptance in new clinical contexts. Furthermore, Nile tilapia peptides can accelerate healing more effectively and with a lower risk of adverse effects, making it a safe and low-cost option compared to expensive biotechnological treatments.
Immunohistochemistry data corroborated our results on the cellularity on day nine, since CD31, Ki67, and PCNA marker rates increased in the T1 and T2 groups. CD31 is a platelet endothelial adhesion molecule (PECAM-1), generally considered a sensitive endothelial-specific marker [71]. These markers’ augmentation show that T19 stimulates neoangiogenesis. Consequently, this also provides a suitable environment for cellular metabolism in the early stages of the wound-healing process. In addition to adequate nutrition and oxygenation, increased CD31 expression is closely related to the synthesis of matrix components, especially granulation tissue, which provides the wound with a favorable matrix for the synthesis and deposition of other essential compounds for the formation of a solid and resistant tissue [72,73]. The morphological increase in cellularity was supported by the increase in the Ki67 marker, an essential marker of cell proliferation [74], which was also increased after exposure to T19. This marker’s increase is associated with the CD31 increase; for the cell to divide and repopulate a particular tissue, it needs nutrients and oxygen. In addition, our compound also promoted an increase in the expression of PCNA. This non-histone nuclear protein is actively expressed in the cell cycle, especially in the S phase of the process. This protein functions as an auxiliary protein for DNA polymerase, aiding in the regulation of passages through the different stages of the cell cycle. An increase is related to the cell’s greater capacity to cycle and, consequently, to divide [75,76]. The critical role of these proteins in the evolution of the cell cycle is already known. However, the increase in their expression after exposure to compounds obtained from tilapia skin has never been reported before, which shows the innovative potential of our study. These results show that T19 is effective in skin injury therapy, especially in the early stages of the wound healing process.
Interestingly, after exposure to T1 and T2 compounds, a decrease in CD163 and COX-2 markers was observed. CD163 is a unique marker of monocyte/macrophage cells, often expressed in activated macrophages [77]. CD163-positive macrophages are known to be found during acute inflammation and in chronic inflammation [78]. According to Akila et al. (2012), CD163-positive macrophages are essential in resolving inflammation, since they are found at high rates in inflamed tissues. The CD163 protein and mRNA expression are upregulated during the phagocytic period, most commonly in the resolution of inflammation [79]. Our findings show that CD163 expression was significantly reduced in the T2 group on day nine compared to the control group. This reduction may indicate that T19 promoted the resolution of the inflammatory process quickly and effectively, since the control group showed a considerable increase in CD163 in 9 days. Corroborating this result, we also observed a decrease in the expression of COX-2, which is predominantly expressed in inflammatory cells and upregulated in chronic and acute inflammation [80]. COX-2 expression is stimulated by different growth factors, such as cytokines and prostaglandins, related to the inflammatory response [81]. When analyzed together, CD163 and COX-2 showed significant control of the inflammatory process, meaning that our compound was effective in preventing the development of chronic inflammation and consequently promoted a control of cytokines and other compounds that are important for the early phases of the inflammatory process; however, if they persist, they can cause tissue damage and thus compromise the tissue healing process.
During phagocytosis, inflammatory cells, especially macrophages and neutrophils, produce several mediators, cytokines, free radicals, and ROSs. These are important to enhance the microbicidal capacity of phagocytes [82,83]. However, if this process persists, some harmful compounds can leak out and damage adjacent tissues [84]. Among the ROSs released into the tissue is hydrogen peroxide (H2O2), which can cause degenerative processes and cell death in the tissues, promoting their function [85,86]. Surprisingly, there was an increase in H2O2 and NO after exposure to T19. Nevertheless, when analyzing the action of lipid peroxidation in the tissue, we did not observe significant differences among the groups. This probably occurred because the H2O2 and NO produced were retained within the phagocytes to increase their microbicide potential and were not extravasated into the tissues and thus not damaging to the cell membranes of the tissues analyzed. Nonetheless, studies on the gene expression of these compounds and other tissue injury markers and antioxidant compounds are essential to confirm this hypothesis. This could establish a possible mechanistic pathway that justifies these findings. These potential advantages highlight the novelty of Nile tilapia skin-derived peptides as therapeutic agents and suggest that they represent a promising approach to treating infections and inflammation. However, more studies are needed to fully understand the mechanisms of action and evaluate the clinical effectiveness.
Cytokines are another critical mediator and an essential marker in skin repair. They are fundamental to driving the inflammatory response to the sites of infection and injury, favoring proper wound healing [87]. IL-2 is a 15 kDa protein produced mainly by CD4-T cells and, to a lesser extent, by CD8+ T-cells. It acts through IL-2Rα, IL-2Rβ, and IL-2Rγ receptors, using the intracellular pathway JAK/STAT (Janus family of tyrosine kinases/transcription factors) to stimulate the growth and proliferation of T-lymphocytes and B-cells. It also induces the production of other cytokines, such as IFNγ (interferon-gamma) and TNFβ (tumor necrosis factor-beta), which results in the activation of monocytes, neutrophils, and NK cells [87]. Thus, it is evident that IL-2 contributes to generating and propagating antigen-specific immune responses and promoting the inflammatory process [88,89]. Our results showed an increase in the production of IL-2 and IFN-gamma after nine days of exposure to T19. Intriguingly, animals used in our research were knockout for IL-10, a cytokine that is mainly produced by activated CD8+ cells. The primary function of IL-10 is to inhibit the production of IL-2, IL-12, and IFN. Our results showed that even though the animals were knockout, there was an increase in the production of IL-2 and IFN-gamma, which demonstrates the potential of T19 to promote tissue inflammation, especially in the early stages of the process.
The development of inflammation is the basis for the skin repair process to occur harmoniously and safely, so the inflammatory process should happen in a coordinated and controlled manner [90,91]. Thus, the release of IL-2 and IFN is desirable in the early stages of the process, acting on the modulation of the immune response from Th1 to Th2. Th1 cells are responsible for synthetizing IL-2, IFN-gamma, IL-12, IL-16, and IL-18. This process increases inflammatory response, while Th2 produces IL-4, IL-5, IL-6, IL-10, and IL-13, which can act in defense against parasites. Furthermore, IFN-γ can induce IL-2 production by acting on the Th2 to Th1 immune response profile [88]. All these interactions demonstrate the important role that modulation in producing these cytokines can play in controlling inflammation and, consequently, in the tissue repair process. Thus, the development of new compounds, such as T19, that promote modulation in the inflammatory process is very desirable, as they indirectly promote a modulation in cell proliferation and migration as well as in matrix synthesis and result in improvement in the innate immune response in the wound area [92,93,94,95].
5. Conclusions
Thus, our results indicated that the hydrolyzed tilápia Nilo skin compound T19 is effective for tissue repair through its proliferative potential, accelerating wound healing in IL-10 knockout mice (C57). The hydrolyzed compound T19 effectively modulated the inflammatory phase by reducing COX-2 and increasing IL-4, thus accelerating the remodeling phase. In addition, T19 increased the expression of markers of cell proliferation and angiogenesis, which are fundamental in the healing of skin wounds. Further molecular analyses should be performed to understand better the additional mechanisms of the cellular processes involved.
Supplementary Materials
The following supporting information can be downloaded at: https://www.mdpi.com/article/10.3390/cosmetics11040133/s1, Figure S1: A flowchart for visualizing experimental workflow; Table S1: Sequences that did not align for any protein (TAGs).
Author Contributions
Conceptualization, R.R.C.; methodology, M.M.S.; software, R.R.C.; validation, R.V.G., R.D.N. and L.L.d.O.; formal analysis, R.R.C.; investigation, R.R.C.; resources, R.V.G.; data curation, S.L.P.d.M.; writing—original draft preparation, R.R.C.; writing—review and editing, R.V.G.; visualization, L.L.d.O.; supervision, R.V.G.; project administration, R.V.G.; funding acquisition, S.L.P.d.M. All authors have read and agreed to the published version of the manuscript.
Funding
This research was funded by FAPEMIG (processes APQ-03519-22 and APQ-04164-22) and Conselho Nacional de Desenvolvimento Científico e Tecnológico (310413/2023-0—306733/2023-4—403194/2023-7). This study was financed in part by the Coordenação de Aperfeiçoamento de Pessoal de Nível Superior—Brasil (CAPES)—Finance Code 001.
Institutional Review Board Statement
The animal study protocol was approved by the Ethics Committee of Universidade Federal de Viçosa (Process number 02/2020; 14 August 2020) for studies involving humans.
Informed Consent Statement
Not applicable.
Data Availability Statement
The data can be made available upon request through the email: Reggiani.goncalves@ufv.br.
Conflicts of Interest
The authors declare no conflicts of interest. The funders had no role in the design of the study; in the collection, analyses, or interpretation of data; in the writing of the manuscript; or in the decision to publish the results.
References
- Swann, G. Editorial. J. Vis. Commun. Med. 2010, 33, 148–149. [Google Scholar] [CrossRef] [PubMed]
- Eklouh-Molinier, C.; Gaydou, V.; Froigneux, E.; Barlier, P.; Couturaud, V.; Manfait, M.; Piot, O. In Vivo Confocal Raman Microspectroscopy of the Human Skin: Highlighting of Spectral Markers Associated to Aging via a Research of Correlation between Raman and Biometric Mechanical Measurements. Anal. Bioanal. Chem. Anal. Bioanal. Chem. 2015, 407, 8363–8372. [Google Scholar] [CrossRef] [PubMed]
- Karimkhani, C.; Dellavalle, R.P.; Coffeng, L.E.; Flohr, C.; Hay, R.J.; Langan, S.M.; Nsoesie, E.O.; Ferrari, A.J.; Erskine, H.E.; Silverberg, J.I.; et al. Global Skin Disease Morbidity and Mortality. JAMA Dermatol. 2017, 153, 406. [Google Scholar] [CrossRef] [PubMed]
- Reichenberg, J.; Davis, M. Venous Ulcers. Semin. Cutan. Med. Surg. 2005, 24, 216–226. [Google Scholar] [CrossRef] [PubMed]
- Cavassan, N.R.V.; Camargo, C.C.; De Pontes, L.G.; Barraviera, B.; Ferreira, R.S.; Miot, H.A.; Abbade, L.P.F.; Santos, L.D.D. Correlation between Chronic Venous Ulcer Exudate Proteins and Clinical Profile: A Cross-Sectional Study. J. Proteom. 2019, 192, 280–290. [Google Scholar] [CrossRef] [PubMed]
- Buster, K.J.; Stevens, E.I.; Elmets, C.A. Dermatologic Health Disparities. Dermatol. Clin. 2012, 30, 53–59. [Google Scholar] [CrossRef] [PubMed]
- PLISA. Plisa Plataforma de Información en Salud Para Las Américas—Indicador de Estado de Salud. Available online: http://www.paho.org/data/index.php/es/?option=com_content&view=article&id=515:indicadoresviz&Itemid=347 (accessed on 22 May 2020).
- Reinke, J.M.; Sorg, H. Wound Repair and Regeneration. Eur. Surg. Res. 2012, 49, 35–43. [Google Scholar] [CrossRef] [PubMed]
- Dehkordi, A.N.; Babaheydari, F.M.; Chehelgerdi, M.; Dehkordi, S.R. Skin Tissue Engineering: Wound Healing Based on Stem-Cell-Based Therapeutic Strategies. Stem Cell Res. Ther. 2019, 10, 111. [Google Scholar] [CrossRef] [PubMed]
- Tziotzios, C.; Profyris, C.; Sterling, J. Cutaneous Scarring: Pathophysiology, Molecular Mechanisms, and Scar Reduction Therapeutics. J. Am. Acad. Dermatol. 2012, 66, 13–24. [Google Scholar] [CrossRef]
- Mechanism Action of Platelets and Crucial Blood Coagulation Pathways in Hemostasis. Available online: http://www.ncbi.nlm.nih.gov/pubmed/29340130 (accessed on 27 June 2020).
- Qin, Y. Functional Wound Dressings. In Elsevier eBooks; Elsevier: Amsterdam, The Netherlands, 2016; pp. 89–107. [Google Scholar]
- Davis, J. Smart Bandage Technologies. In Elsevier eBooks; Elsevier: Amsterdam, The Netherlands, 2016. [Google Scholar]
- Serra, M.B.; Barroso, W.A.; Da Silva, N.N.; Silva, S.D.N.; Borges, A.C.R.; Abreu, I.C.; Da Rocha Borges, M.O. From Inflammation to Current and Alternative Therapies Involved in Wound Healing. Int. J. Inflamm. 2017, 2017, 3406215. [Google Scholar] [CrossRef]
- Cañedo-Dorantes, L.; Cañedo-Ayala, M. Skin Acute Wound Healing: A Comprehensive Review. Int. J. Inflamm. 2019, 2019, 3706315. [Google Scholar] [CrossRef] [PubMed]
- Greaves, N.S.; Ashcroft, K.J.; Baguneid, M.; Bayat, A. Current Understanding of Molecular and Cellular Mechanisms in Fibroplasia and Angiogenesis during Acute Wound Healing. J. Dermatol. Sci. 2013, 72, 206–217. [Google Scholar] [CrossRef] [PubMed]
- Landén, N.X.; Li, D.; Ståhle, M. Transition from Inflammation to Proliferation: A Critical Step during Wound Healing. Cell. Mol. Life Sci. 2016, 73, 3861–3885. [Google Scholar] [CrossRef] [PubMed]
- Blakaj, A.; Bucala, R. Fibrocytes in Health and Disease. Fibrogenes. Tissue Repair 2012, 5, 548–556. [Google Scholar] [CrossRef] [PubMed]
- Xue, M.; Jackson, C.J. Extracellular Matrix Reorganization during Wound Healing and Its Impact on Abnormal Scarring. Adv. Wound Care 2015, 4, 119–136. [Google Scholar] [CrossRef] [PubMed]
- De Oliveira Gonzalez, A.C.; Costa, T.F.; De Araújo Andrade, Z.; Medrado, A.R.A.P. Wound Healing—A Literature Review. An. Bras. Dermatol. 2016, 91, 614–620. [Google Scholar] [CrossRef] [PubMed]
- Black, E.H.; Nesi, F.A.; Calvano, C.J.; Gladstone, G.J.; Levine, M.R. Smith and Nesi’s Ophthalmic Plastic and Reconstructive Surgery; Springer Science & Business Media: Berlin/Heidelberg, Germany, 2012. [Google Scholar]
- Desmouliere, A.; Darby, I.A.; Laverdet, B.; Bonté, F. Fibroblasts and Myofibroblasts in Wound Healing. Clin. Cosmet. Investig. Dermatol. 2014, 301, 301–311. [Google Scholar] [CrossRef] [PubMed]
- Chen, P.; Parks, W.C. Role of Matrix Metalloproteinases in Epithelial Migration. J. Cell. Biochem. 2009, 108, 1233–1243. [Google Scholar] [CrossRef]
- Shanmugasundaram, N.; Uma, T.S.; Lakshmi, T.S.R.; Babu, M. Efficiency of Controlled Topical Delivery of Silver Sulfadiazine in Infected Burn Wounds. J. Biomed. Mater. Research. Part A 2008, 89A, 472–482. [Google Scholar] [CrossRef]
- Johnson, R.M.; Richard, R. Partial-Thickness Burns: Identification and Management. Adv. Ski. Wound Care 2003, 16, 178–187. [Google Scholar] [CrossRef]
- Pei, X.; Yang, R.; Zhang, Z.; Gao, L.; Wang, J.; Xu, Y.; Zhao, M.; Han, X.; Liu, Z.; Li, Y. Marine Collagen Peptide Isolated from Chum Salmon (Oncorhynchus keta) Skin Facilitates Learning and Memory in Aged C57BL/6J Mice. Food Chem. 2010, 118, 333–340. [Google Scholar] [CrossRef]
- Felice, F.; Zambito, Y.; Belardinelli, E.; Fabiano, A.; Santoni, T.; Di Stefano, R. Effect of Different Chitosan Derivatives on in Vitro Scratch Wound Assay: A Comparative Study. Int. J. Biol. Macromol. 2015, 76, 236–241. [Google Scholar] [CrossRef] [PubMed]
- Huang, H.-N.; Chan, Y.-L.; Hui, C.-F.; Wu, J.-L.; Wu, C.-J.; Chen, J.-Y. Use of Tilapia Piscidin 3 (TP3) to Protect against MRSA Infection in Mice with Skin Injuries. Oncotarget 2015, 6, 12955–12969. [Google Scholar] [CrossRef] [PubMed]
- Huang, H.-N.; Pan, C.-Y.; Wu, H.-Y.; Chen, J.-Y. Antimicrobial Peptide Epinecidin-1 Promotes Complete Skin Regeneration of Methicillin-Resistant Staphylococcus Aureus-Infected Burn Wounds in a Swine Model. Oncotarget 2017, 8, 21067–21080. [Google Scholar] [CrossRef]
- Ennaas, N.; Hammami, R.; Gomaa, A.; Bédard, F.; Biron, É.; Subirade, M.; Beaulieu, L.; Fliss, I. Collagencin, an Antibacterial Peptide from Fish Collagen: Activity, Structure and Interaction Dynamics with Membrane. Biochem. Biophys. Res. Commun. 2016, 473, 642–647. [Google Scholar] [CrossRef]
- Kim, S.-K.; Ngo, D.-H.; Vo, T.-S. Marine Fish-Derived Bioactive Peptides as Potential Antihypertensive Agents. Adv. Food Nutr. Res. 2012, 65, 249–260. [Google Scholar]
- Xu, L.; Dong, W.; Zhao, J.; Xu, Y. Effect of Marine Collagen Peptides on Physiological and Neurobehavioral Development of Male Rats with Perinatal Asphyxia. Mar. Drugs 2015, 13, 3653–3671. [Google Scholar] [CrossRef] [PubMed]
- Costa, C.F.; De Sousa, G.C.; Rodrigues, A.C.E.; De Sousa Vieira, F.; Viana, D.D.S.F.; Costa, E.D.S.; Oliveira, D.É.P.; Santos, S.S.D.; Santos, A.D.R.S.; Da Costa, A.C.M. Perfil de Pacientes Que Sofreram Queimaduras No Brasil: Uma Revisão Integrativa. Rev. Eletrônica Acervo Saúde 2017, 2178, 2091. [Google Scholar] [CrossRef]
- Hu, Z.; Yang, P.; Zhou, C.; Li, S.; Hong, P. Marine Collagen Peptides from the Skin of Nile Tilapia (Oreochromis niloticus): Characterization and Wound Healing Evaluation. Mar. Drugs 2017, 15, 102. [Google Scholar] [CrossRef]
- Mostaço-Guidolin, L.; Rosin, N.; Hackett, T.-L. Imaging Collagen in Scar Tissue: Developments in Second Harmonic Generation Microscopy for Biomedical Applications. Int. J. Mol. Sci. 2017, 18, 1772. [Google Scholar] [CrossRef]
- Tang, J.; Saito, T. Biocompatibility of Novel Type I Collagen Purified from Tilapia Fish Scale: An In Vitro Comparative Study. BioMed Res. Int. 2015, 2015, 139476. [Google Scholar] [CrossRef] [PubMed]
- Masso-Silva, J.; Diamond, G. Antimicrobial Peptides from Fish. Pharmaceuticals 2014, 7, 265–310. [Google Scholar] [CrossRef] [PubMed]
- Del Rosario Loyo Casao, T.; Pinheiro, C.G.; Sarandy, M.M.; Zanatta, A.C.; Vilegas, W.; Novaes, R.D.; Gonçalves, R.V.; Leite, J.P.V. Croton Urucurana Baillon Stem Bark Ointment Accelerates the Closure of Cutaneous Wounds in Knockout IL-10 Mice. J. Ethnopharmacol. 2020, 261, 113042. [Google Scholar] [CrossRef] [PubMed]
- Óleo de Cravo: Um Anestésico Alternativo Para o Manejo de Peixes.—Portal Embrapa. Available online: https://www.embrapa.br/busca-de-publicacoes/-/publicacao/681655/oleo-de-cravo-um-anestesico-alternativo-para-o-manejo-de-peixes (accessed on 11 December 2019).
- Hoar, W.S. A Laboratory Companion for General and Comparative Physiology; Prentice-Hall: Upper Saddle River, NJ, USA, 1967. [Google Scholar]
- Bradford, M. A Rapid and Sensitive Method for the Quantitation of Microgram Quantities of Protein Utilizing the Principle of Protein-Dye Binding. Anal. Biochem. 1976, 72, 248–254. [Google Scholar] [CrossRef] [PubMed]
- Ma, B.; Zhang, K.; Hendrie, C.; Liang, C.; Li, M.; Doherty-Kirby, A.; Lajoie, G. PEAKS: Powerful Software for Peptide de Novo Sequencing by Tandem Mass Spectrometry. Rapid Commun. Mass Spectrom. 2003, 17, 2337–2342. [Google Scholar] [CrossRef] [PubMed]
- Pan, C.; Park, B.H.; McDonald, W.H.; Carey, P.A.; Banfield, J.F.; VerBerkmoes, N.C.; Hettich, R.L.; Samatova, N.F. A High-Throughput de Novo Sequencing Approach for Shotgun Proteomics Using High-Resolution Tandem Mass Spectrometry. BMC Bioinform. 2010, 11, 118. [Google Scholar] [CrossRef] [PubMed]
- Mosmann, T. Rapid Colorimetric Assay for Cellular Growth and Survival: Application to Proliferation and Cytotoxicity Assays. J. Immunol. Methods 1983, 65, 55–63. [Google Scholar] [CrossRef] [PubMed]
- Gonçalves, R.V.; Novaes, R.D.; Matta, S.L.P.; Benevides, G.P.; Faria, F.R.; Pinto, M.V.M. Comparative Study of the Effects of Gallium-Aluminum-Arsenide Laser Photobiomodulation and Healing Oil on Skin Wounds in Wistar Rats: A Histomorphometric Study. Photomed. Laser Surg. 2010, 28, 597–602. [Google Scholar] [CrossRef] [PubMed]
- Ågren, M.S.; Mertza, P.M.; Franzén, L. A Comparative Study of Three Occlusive Dressings in the Treatment of Full-Thickness Wounds in Pigs. J. Am. Acad. Dermatol. 1997, 36, 53–58. [Google Scholar] [CrossRef]
- Sarandy, M.M.; Miranda, L.L.; Altoé, L.S.; Novaes, R.D.; Zanuncio, V.V.; Leite, J.P.V.; Gonçalves, R.V. Strychnos pseudoquina Modulates the Morphological Reorganization of the Scar Tissue of Second Intention Cutaneous Wounds in Rats. PLoS ONE 2018, 13, e0195786. [Google Scholar] [CrossRef]
- Oliveira, J.M.; Losano, N.F.; Condessa, S.S.; De Freitas, R.M.P.; Cardoso, S.A.; Freitas, M.B.; De Oliveira, L.L. Exposure to Deltamethrin Induces Oxidative Stress and Decreases of Energy Reserve in Tissues of the Neotropical Fruit-Eating Bat Artibeus lituratus. Ecotoxicol. Environ. Saf. 2018, 148, 684–692. [Google Scholar] [CrossRef] [PubMed]
- Diaz De Leon, J.A.; Borges, C.R. Evaluation of Oxidative Stress in Biological Samples Using the Thiobarbituric Acid Reactive Substances Assay. J. Vis. Exp. 2020, 159, 61122. [Google Scholar] [CrossRef]
- Szydłowska-Czerniak, A.; Tułodziecka, A.; Szłyk, E. Evaluation of Antioxidant Activity of Food Additives and Its Inhibitory Effect on Lipid Oxidation in Food Products. Food Chem. 2017, 234, 211–218. [Google Scholar] [CrossRef]
- Tsikas, D. Analysis of Nitrite and Nitrate in Biological Fluids by Assays Based on the Griess Reaction: Appraisal of the Griess Reaction in the l-Arginine/Nitric Oxide Area of Research. J. Chromatogr. B 2007, 851, 51–70. [Google Scholar] [CrossRef] [PubMed]
- Dieterich, S.; Bieligk, U.; Beulich, K.; Hasenfuss, G.; Prestle, J. Gene Expression of Antioxidative Enzymes in the Human Heart. Circulation 2000, 101, 33–39. [Google Scholar] [CrossRef] [PubMed]
- Bian, W.; Meng, B.; Li, X.; Wang, S.; Cao, X.; Liu, N.; Yang, M.; Tang, J.; Wang, Y.; Yang, X. OA-GL21, a Novel Bioactive Peptide from Odorrana andersonii, Accelerated the Healing of Skin Wounds. Biosci. Rep. 2018, 38, BSR20180215. [Google Scholar] [CrossRef] [PubMed]
- Ebaid, H.; Abdel-Salam, B.; Hassan, I.; Al-Tamimi, J.; Metwalli, A.; Alhazza, I. Camel Milk Peptide Improves Wound Healing in Diabetic Rats by Orchestrating the Redox Status and Immune Response. Lipids Health Dis. 2015, 14, 132. [Google Scholar] [CrossRef] [PubMed]
- Alves, R.S.; Alves, L.B.; Altoé, L.S.; Sarandy, M.M.; Freitas, M.B.; Silveira, N.J.F.; Novaes, R.D.; Gonçalves, R.V. Peptides from Animal Origin: A Systematic Review on Biological Sources and Effects on Skin Wounds. Oxidative Med. Cell. Longev. 2020, 2020, 4352761. [Google Scholar] [CrossRef] [PubMed]
- Fox, J.L. Antimicrobial Peptides Stage a Comeback. Nat. Biotechnol. 2013, 31, 379–382. [Google Scholar] [CrossRef]
- Vijaykrishnaraj, M.; Prabhasankar, P. Marine Protein Hydrolysates: Their Present and Future Perspectives in Food Chemistry—A Review. RSC Adv. 2015, 5, 34864–34877. [Google Scholar] [CrossRef]
- Fu, Y.; Therkildsen, M.; Aluko, R.E.; Lametsch, R. Exploration of Collagen Recovered from Animal By-Products as a Precursor of Bioactive Peptides: Successes and Challenges. Crit. Rev. Food Sci. Nutr. 2018, 59, 2011–2027. [Google Scholar] [CrossRef] [PubMed]
- Gbogouri, G.A.; Linder, M.; Fanni, J.; Parmentier, M. Influence of Hydrolysis Degree on the Functional Properties of Salmon Byproducts Hydrolysates. J. Food Sci. 2004, 69, C615–C622. [Google Scholar] [CrossRef]
- Yamamoto, S.; Deguchi, K.; Onuma, M.; Numata, N.; Sakai, Y. Absorption and Urinary Excretion of Peptides after Collagen Tripeptide Ingestion in Humans. Biol. Pharm. Bull. 2016, 39, 428–434. [Google Scholar] [CrossRef]
- Sun, X.; Chai, Y.; Wang, Q.; Liu, H.; Wang, S.; Xiao, J. A Natural Interruption Displays Higher Global Stability and Local Conformational Flexibility than a Similar Gly Mutation Sequence in Collagen Mimic Peptides. Biochemistry 2015, 54, 6106–6113. [Google Scholar] [CrossRef] [PubMed]
- Ramshaw, J.A.M.; Shah, N.K.; Brodsky, B. Gly-X-Y Tripeptide Frequencies in Collagen: A Context for Host–Guest Triple-Helical Peptides. J. Struct. Biol. 1998, 122, 86–91. [Google Scholar] [CrossRef] [PubMed]
- Dölz, R.; Heidemann, E. Influence of Different Tripeptides on the Stability of the Collagen Triple Helix. I. Analysis of the Collagen Sequence and Identification of Typical Tripeptides. Biopolymers 1986, 25, 1069–1080. [Google Scholar] [CrossRef] [PubMed]
- Glattauer, V.; Werkmeister, J.A.; Kirkpatrick, A.; Ramshaw, J.a.M. Identification of the Epitope for a Monoclonal Antibody That Blocks Platelet Aggregation Induced by Type III Collagen. Biochem. J. 1997, 323, 45–49. [Google Scholar] [CrossRef] [PubMed]
- Zubarev, R.A. Electron-Capture Dissociation Tandem Mass Spectrometry. Curr. Opin. Biotechnol. 2004, 15, 12–16. [Google Scholar] [CrossRef] [PubMed]
- Jang, S.I.; Mok, J.Y.; Jeon, I.H.; Park, K.-H.; Nguyen, T.T.T.; Park, J.S.; Hwang, H.M.; Song, M.-S.; Lee, D.; Chai, K.Y. Effect of Electrospun Non-Woven Mats of Dibutyryl Chitin/Poly(Lactic Acid) Blends on Wound Healing in Hairless Mice. Molecules 2012, 17, 2992–3007. [Google Scholar] [CrossRef]
- Aydin, A.; Reis, R.; Sipahi, H.; Zeybekoðlu, G.; Çelik, N.; Kírmízíbekmez, H.; Kaklíkkaya, N. Hydroxytyrosol: The Phytochemical Responsible for Bioactivity of Traditionally Used Olive Pits. Euroasian J. Hepato-Gastroenterol. 2018, 8, 126–132. [Google Scholar] [CrossRef]
- Okur, M.E.; Ayla, Ş.; Polat, D.Ç.; Günal, M.Y.; Yoltaş, A.; Biçeroğlu, Ö. Novel Insight into Wound Healing Properties of Methanol Extract of Capparis ovata Desf. Var. Palaestina Zohary Fruits. J. Pharm. Pharmacol. 2018, 70, 1401–1413. [Google Scholar] [CrossRef] [PubMed]
- De Castro Campos Pinto, N.; Cassini-Vieira, P.; De Souza-Fagundes, E.M.; Barcelos, L.S.; Castañon, M.C.M.N.; Scio, E. Pereskia Aculeata Miller Leaves Accelerate Excisional Wound Healing in Mice. J. Ethnopharmacol. 2016, 194, 131–136. [Google Scholar] [CrossRef] [PubMed]
- Larouche, J.; Sheoran, S.; Maruyama, K.; Martino, M.M. Immune Regulation of Skin Wound Healing: Mechanisms and Novel Therapeutic Targets. Adv. Wound Care 2018, 7, 209–231. [Google Scholar] [CrossRef] [PubMed]
- Bodnar, R.J. Chemokine Regulation of Angiogenesis during Wound Healing. Adv. Wound Care 2015, 4, 641–650. [Google Scholar] [CrossRef] [PubMed]
- Ley, K.; Laudanna, C.; Cybulsky, M.I.; Nourshargh, S. Getting to the Site of Inflammation: The Leukocyte Adhesion Cascade Updated. Nat. Rev. Immunol. 2007, 7, 678–689. [Google Scholar] [CrossRef] [PubMed]
- Aliste, C.; Peñaranda, J.M.S. Atypical Fibroxanthoma Showing Diffuse Staining for CD31. J. Cutan. Pathol. 2011, 38, 679–680. [Google Scholar] [CrossRef] [PubMed]
- Requena, L.; El-Shabrawi-Caelen, L.; Walsh, S.N.; Segura, S.; Ziemer, M.; Hurt, M.A.; Sangüeza, O.P.; Kutzner, H. Intralymphatic Histiocytosis. A Clinicopathologic Study of 16 Cases. Am. J. Dermatopathol. 2009, 31, 140–151. [Google Scholar] [CrossRef] [PubMed]
- Gaetti Jardim, E.C.; Manrique, G.R.; De Mendonça, J.C.G.; Hanssessian, A.; De Barros, R.M.G. Uso de Técnicas de Análise Histológica e Imunohistoquímica Em Odontologia. Arch. Health Investig. 2013, 2, 40–49. [Google Scholar]
- Crompton, R.; Williams, H.; Ansell, D.; Campbell, L.; Holden, K.; Cruickshank, S.; Hardman, M.J. Oestrogen Promotes Healing in a Bacterial LPS Model of Delayed Cutaneous Wound Repair. Lab. Investig. 2016, 96, 439–449. [Google Scholar] [CrossRef]
- Gupta, A.; Dai, T.; Hamblin, M.R. Effect of Red and Near-Infrared Wavelengths on Low-Level Laser (Light) Therapy-Induced Healing of Partial-Thickness Dermal Abrasion in Mice. Lasers Med. Sci. 2013, 29, 257–265. [Google Scholar] [CrossRef]
- Lau, S.K.; Chu, P.G.; Weiss, L.M. CD163: A Specific Marker of Macrophages in Paraffin-Embedded Tissue Samples. Am. J. Clin. Pathol. 2004, 122, 794–801. [Google Scholar] [CrossRef]
- Dijkstra, C.D.; Döpp, E.A.; Vogels, I.M.C.; Van Noorden, C.J.F. Macrophages and Dendritic Cells in Antigen-Induced Arthritis. Scand. J. Immunol. 1987, 26, 513–523. [Google Scholar] [CrossRef]
- Akila, P.; Prashant, V.; Suma, M.N.; Prashant, S.N.; Chaitra, T.R. RETRACTED: CD163 and Its Expanding Functional Repertoire. Clin. Chim. Acta 2012, 413, 669–674. [Google Scholar] [CrossRef]
- Ferrer, M.D.; Busquets-Cortés, C.; Capó, X.; Tejada, S.; Tur, J.A.; Pons, A.; Sureda, A. Cyclooxygenase-2 Inhibitors as a Therapeutic Target in Inflammatory Diseases. Curr. Med. Chem. 2019, 26, 3225–3241. [Google Scholar] [CrossRef]
- O’Banion, M.K.; Winn, V.D.; Young, D.A. cDNA Cloning and Functional Activity of a Glucocorticoid-Regulated Inflammatory Cyclooxygenase. Proc. Natl. Acad. Sci. USA 1992, 89, 4888–4892. [Google Scholar] [CrossRef] [PubMed]
- Ito, J.-I.; Nagayasu, Y.; Hoshikawa, M.; Kato, K.H.; Miura, Y.; Asai, K.; Hayashi, H.; Yokoyama, S.; Michikawa, M. Enhancement of FGF-1 Release along with Cytosolic Proteins from Rat Astrocytes by Hydrogen Peroxide. Brain Res. 2013, 1522, 12–21. [Google Scholar] [CrossRef] [PubMed]
- Loo, A.E.K.; Wong, Y.T.; Ho, R.; Wasser, M.; Du, T.; Ng, W.T.; Halliwell, B. Effects of Hydrogen Peroxide on Wound Healing in Mice in Relation to Oxidative Damage. PLoS ONE 2012, 7, e49215. [Google Scholar] [CrossRef] [PubMed]
- Mittal, M.; Siddiqui, M.R.; Tran, K.; Reddy, S.P.; Malik, A.B. Reactive Oxygen Species in Inflammation and Tissue Injury. Antioxid. Redox Signal. 2014, 20, 1126–1167. [Google Scholar] [CrossRef]
- Fang, F.C. Antimicrobial Reactive Oxygen and Nitrogen Species: Concepts and Controversies. Nat. Reviews. Microbiol. 2004, 2, 820–832. [Google Scholar] [CrossRef]
- Möller, M.N.; Li, Q.; Lancaster, J.R.; Denicola, A. Acceleration of Nitric Oxide Autoxidation and Nitrosation by Membranes. IUBMB Life 2007, 59, 243–248. [Google Scholar] [CrossRef]
- De Oliveira, C.M.B.; Sakata, R.K.; Issy, A.M.; Gerola, L.R.; Salomão, R. Citocinas e Dor. Rev. Bras. Anestesiol. 2011, 61, 260–265. [Google Scholar] [CrossRef]
- Curfs, J.H.; Meis, J.F.; Hoogkamp-Korstanje, J.A. A Primer on Cytokines: Sources, Receptors, Effects, and Inducers. Clin. Microbiol. Rev. 1997, 10, 742–780. [Google Scholar] [CrossRef] [PubMed]
- Raeburn, C.D.; Sheppard, F.; Barsness, K.A.; Arya, J.; Harken, A.H. Cytokines for Surgeons. Am. J. Surg. 2002, 183, 268–273. [Google Scholar] [CrossRef] [PubMed]
- Grunau, A.; Escher, U.; Bereswill, S.; Heimesaat, M.M. Toll-like Receptor-4 Dependent Inflammatory Responses Following Intestinal Colonization of Secondary Abiotic IL10-Deficient Mice with Multidrug-Resistant Pseudomonas Aeruginosa. Eur. J. Microbiol. Immunol. 2017, 7, 210–219. [Google Scholar] [CrossRef]
- Lennon, E.M.; Borst, L.B.; Edwards, L.L.; Moeser, A.J. Mast Cells Exert Anti-Inflammatory Effects in an IL10−/−Model of Spontaneous Colitis. Mediat. Inflamm. 2018, 2018, 7817360. [Google Scholar] [CrossRef] [PubMed]
- Bueno, F.G.; Panizzon, G.P.; De Leite Mello, E.V.S.; Lechtenberg, M.; Petereit, F.; De Mello, J.C.P.; Hensel, A. Hydrolyzable Tannins from Hydroalcoholic Extract from Poincianella pluviosa Stem Bark and Its Wound-Healing Properties: Phytochemical Investigations and Influence on in Vitro Cell Physiology of Human Keratinocytes and Dermal Fibroblasts. Fitoterapia 2014, 99, 252–260. [Google Scholar] [CrossRef] [PubMed]
- Coelho, G.D.P.; Martins, V.S.; Amaral, L.V.D.; Novaes, R.D.; Sarandy, M.M.; Gonçalves, R.V. Applicability of Isolates and Fractions of Plant Extracts in Murine Models in Type II Diabetes: A Systematic Review. Evid. Based Complement. Altern. Med. 2016, 2016, 3537163. [Google Scholar] [CrossRef]
- Gonçalves, R.V.; Novaes, R.D.; Sarandy, M.M.; Leite, J.P.V.; Vilela, E.F.; Cupertino, M.D.C.; Da Matta, S.L.P. Schizocalyx Cuspidatus (A. St.-Hil.) Kainul. & B. Bremer Extract Improves Antioxidant Defenses and Accelerates the Regression of Hepatic Fibrosis after Exposure to Carbon Tetrachloride in Rats. Nat. Prod. Res. 2016, 30, 2738–2742. [Google Scholar] [CrossRef]
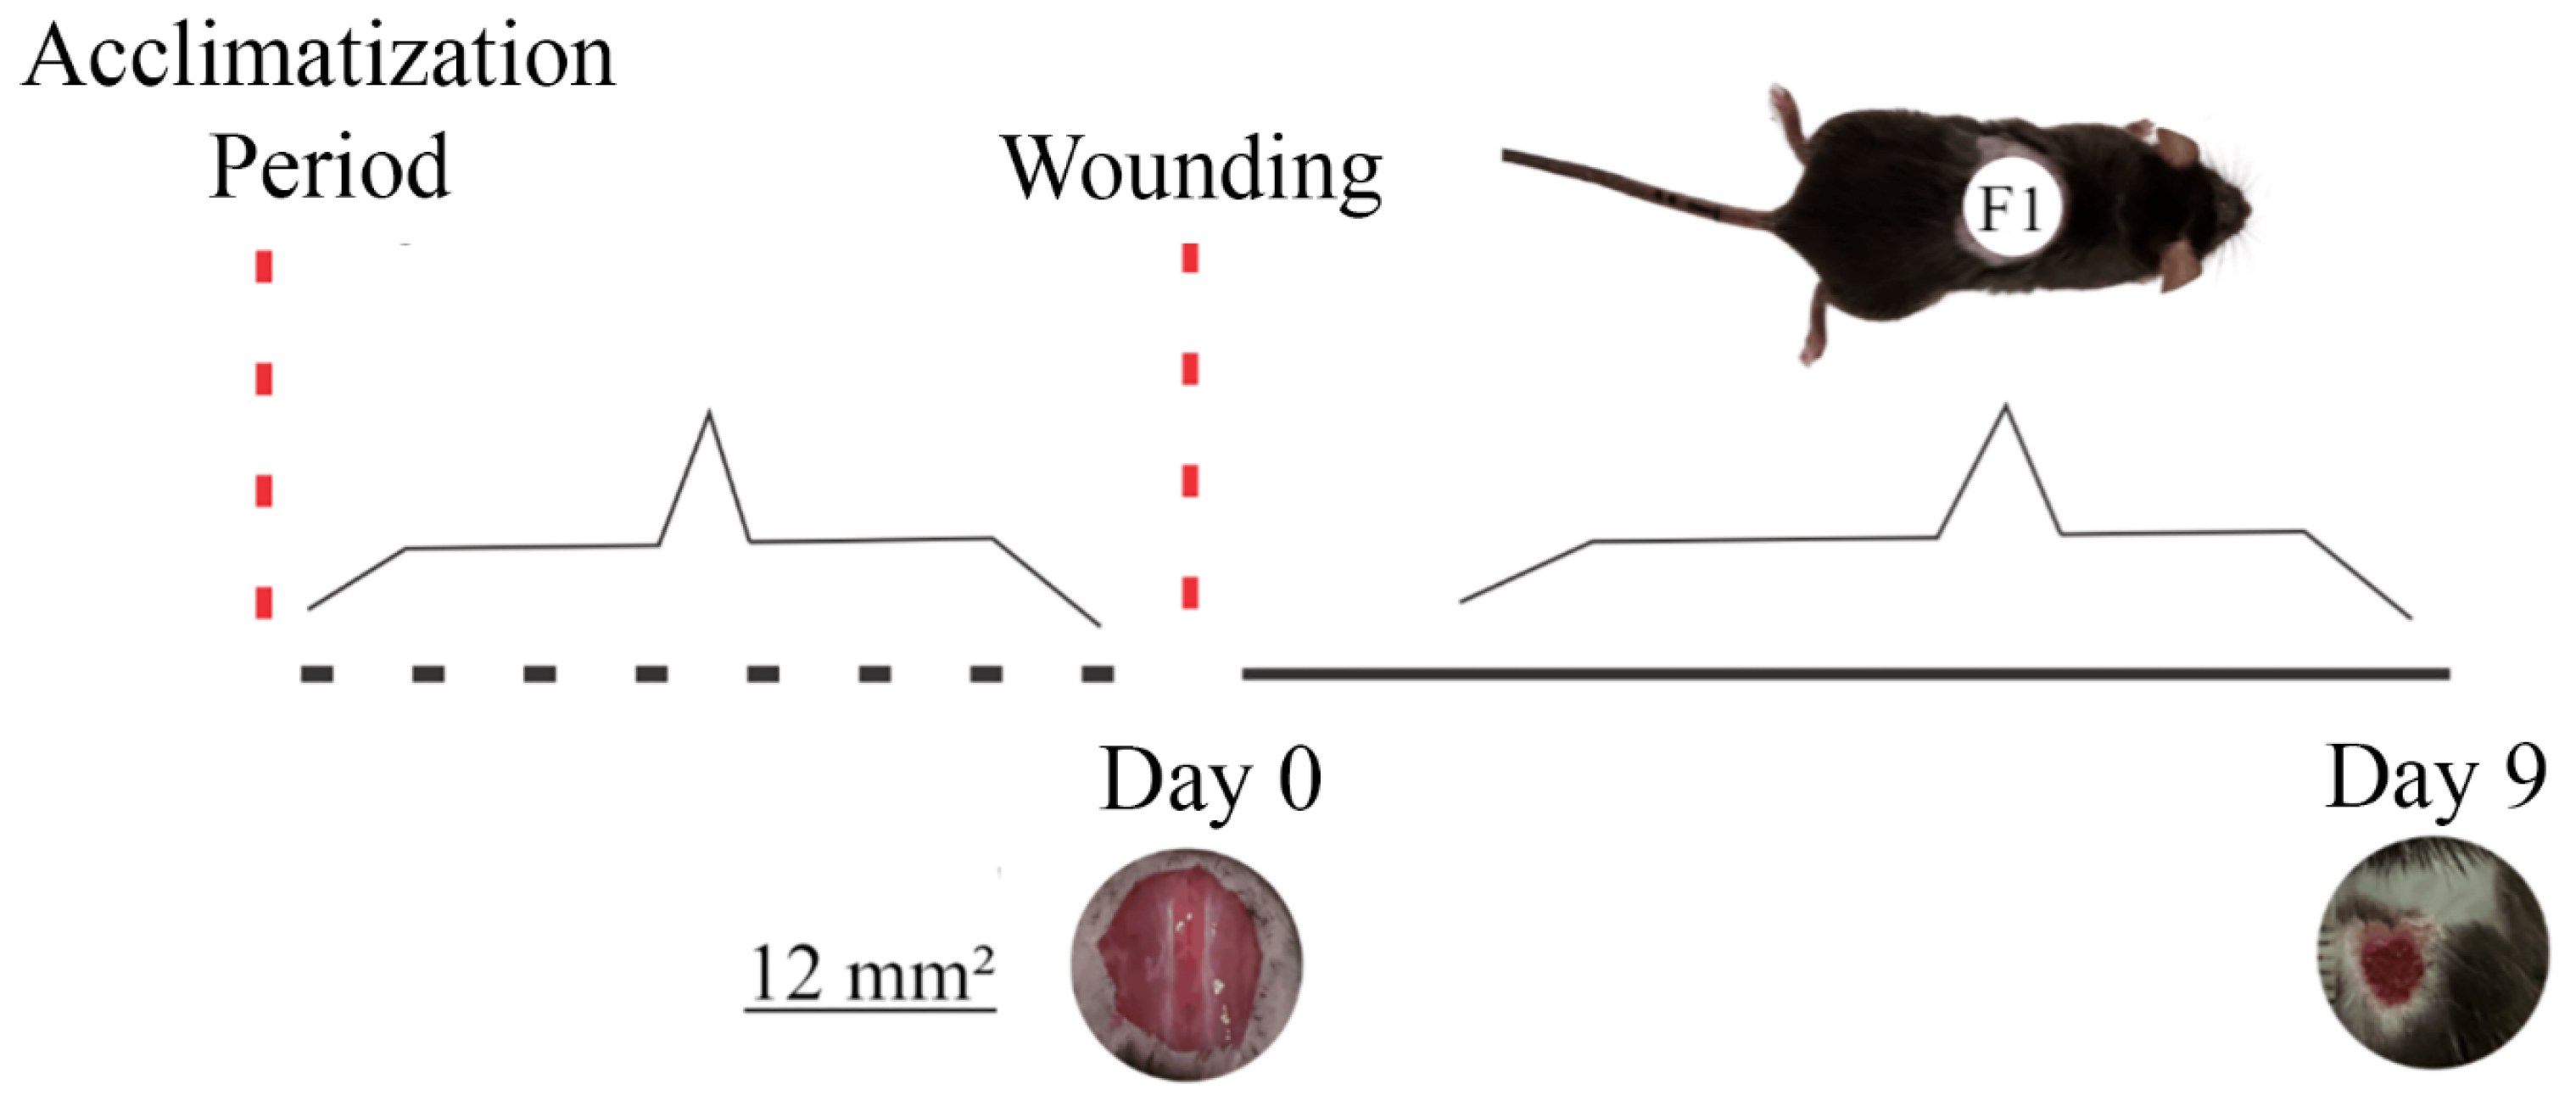
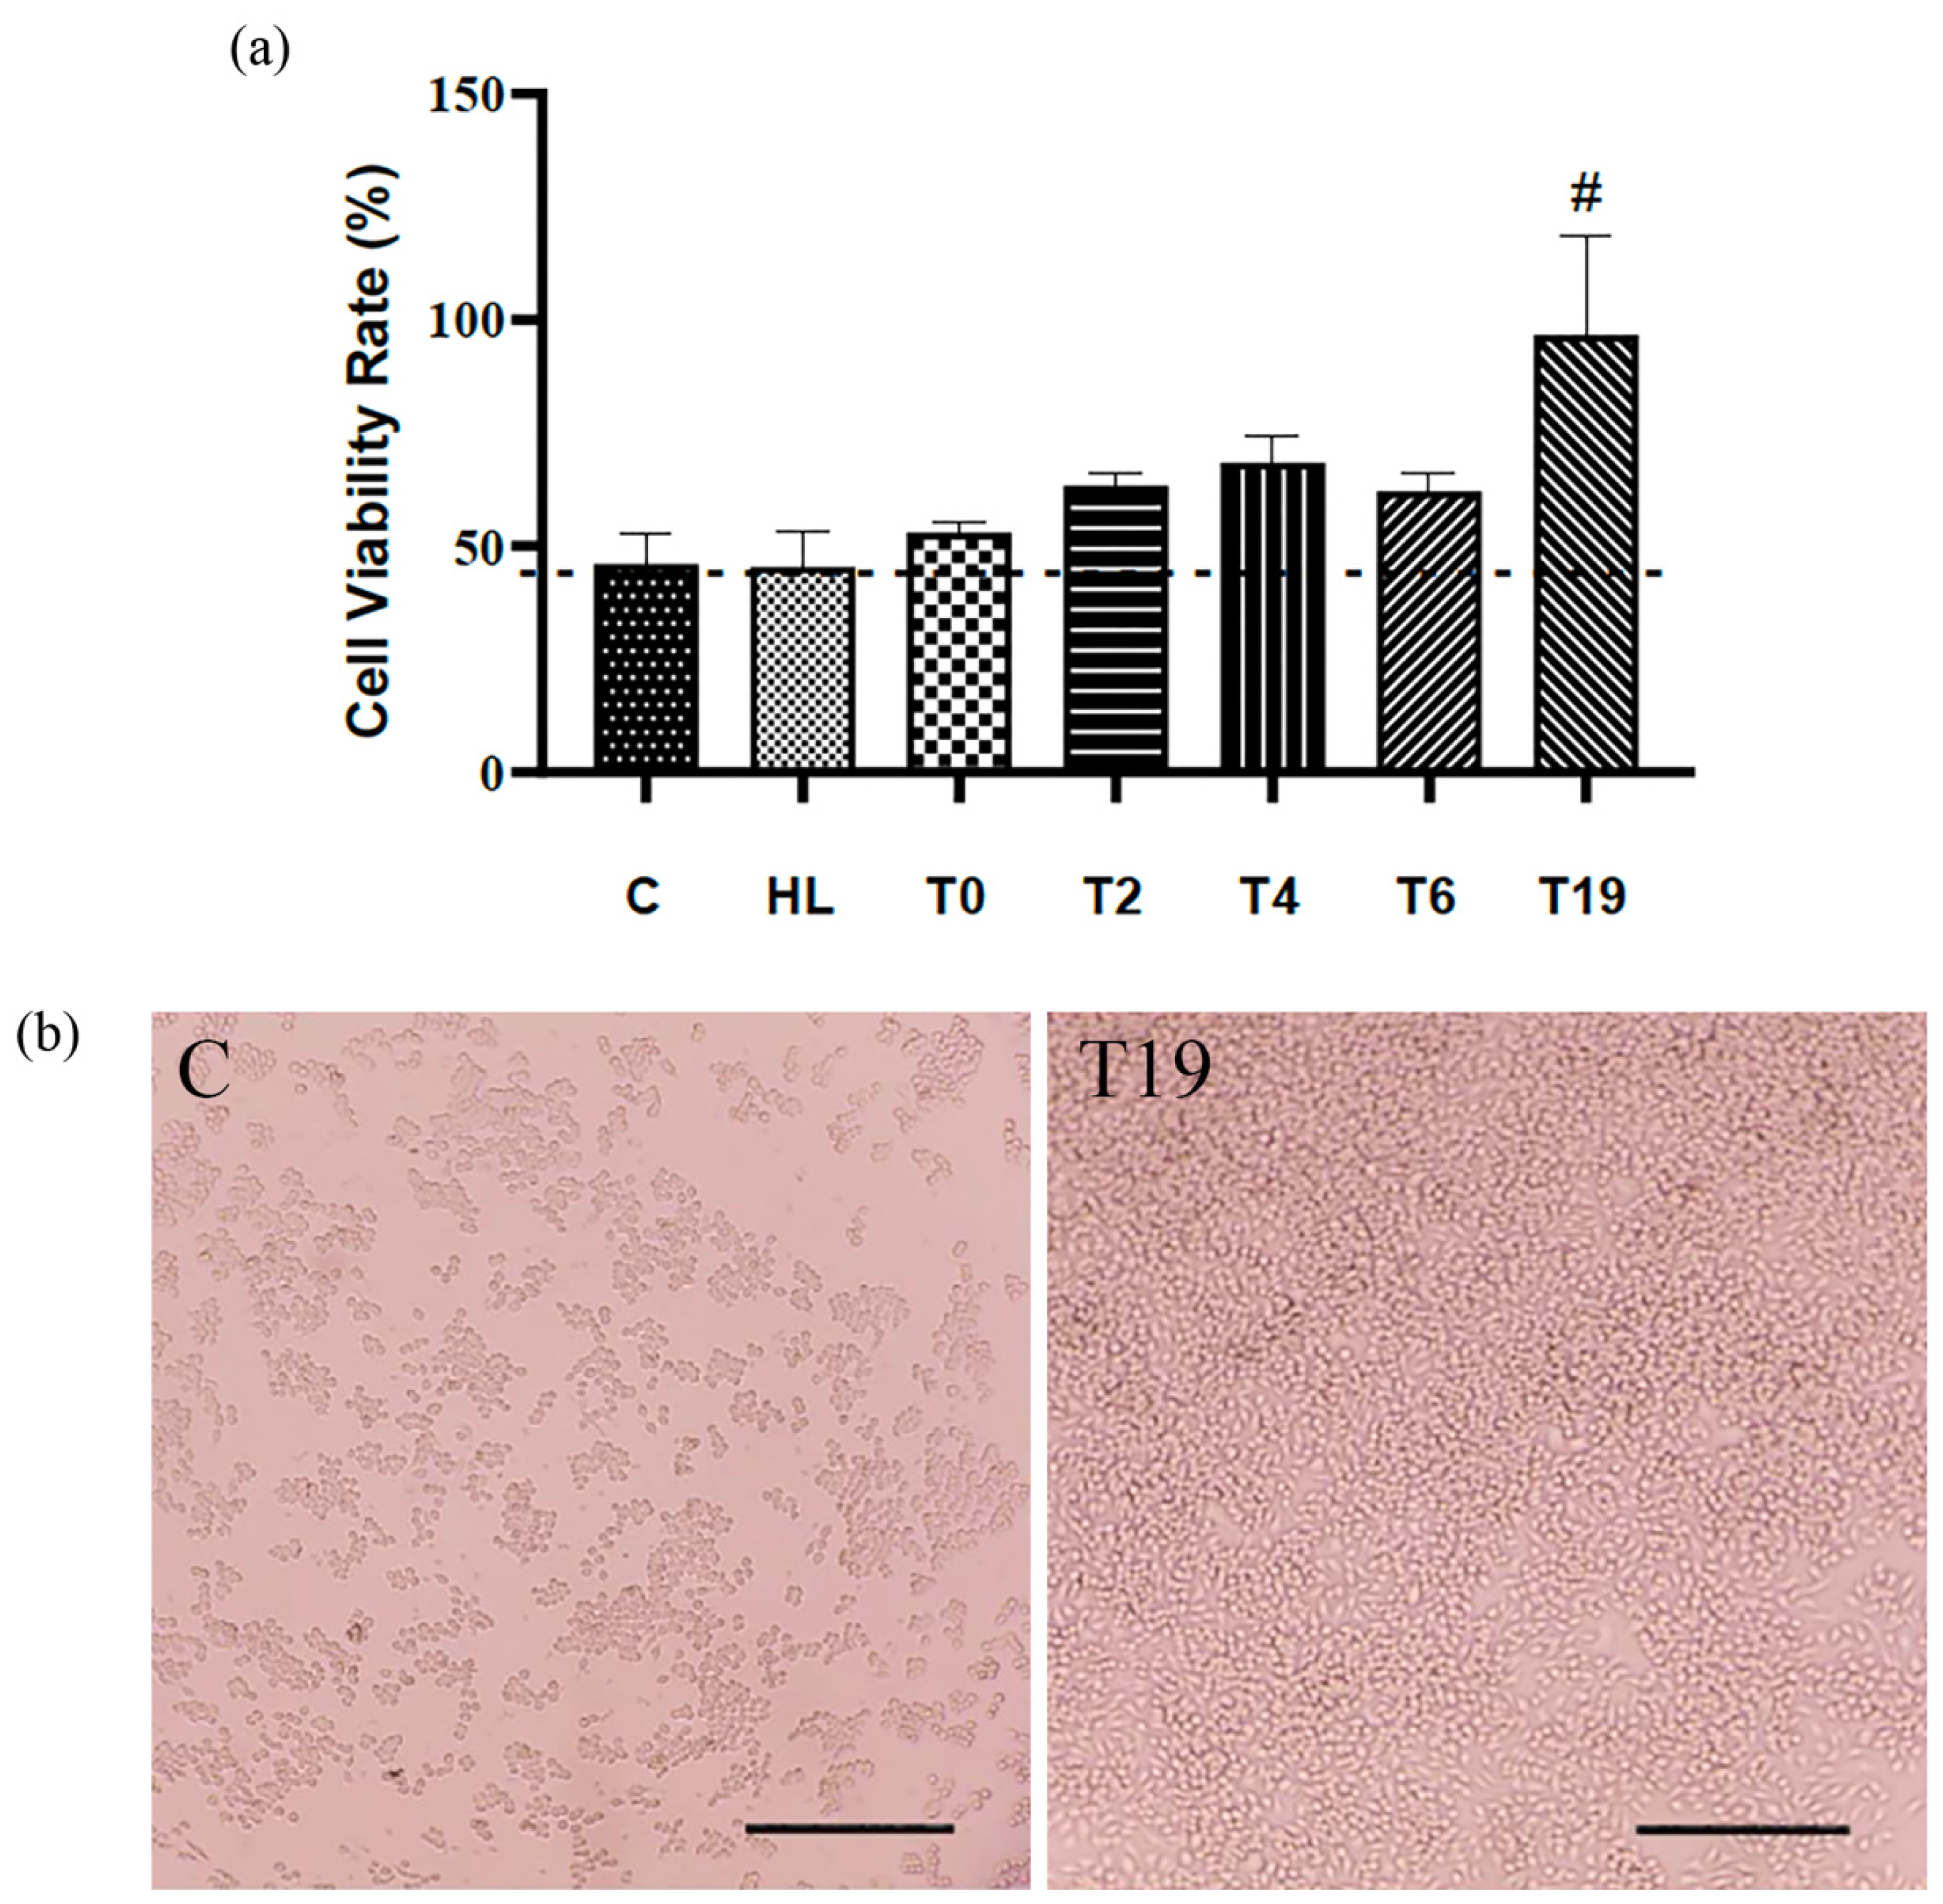
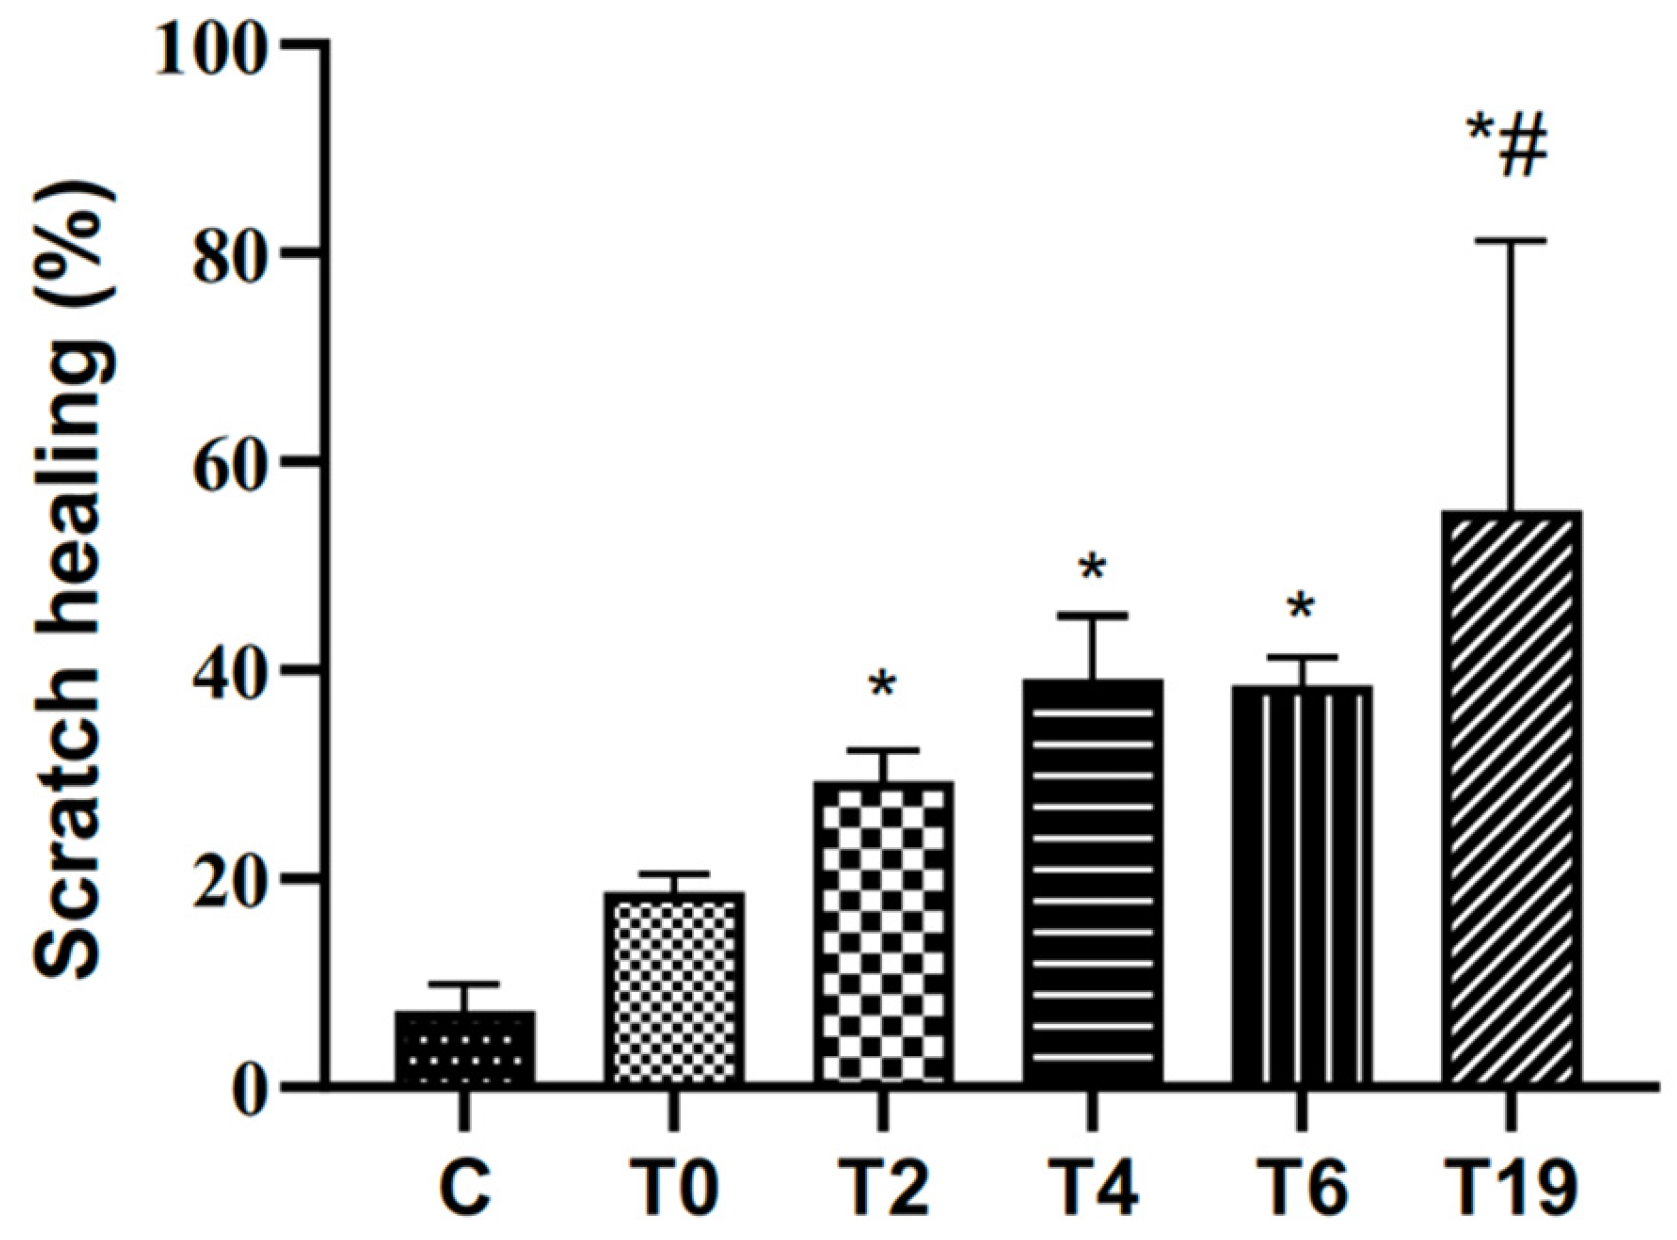
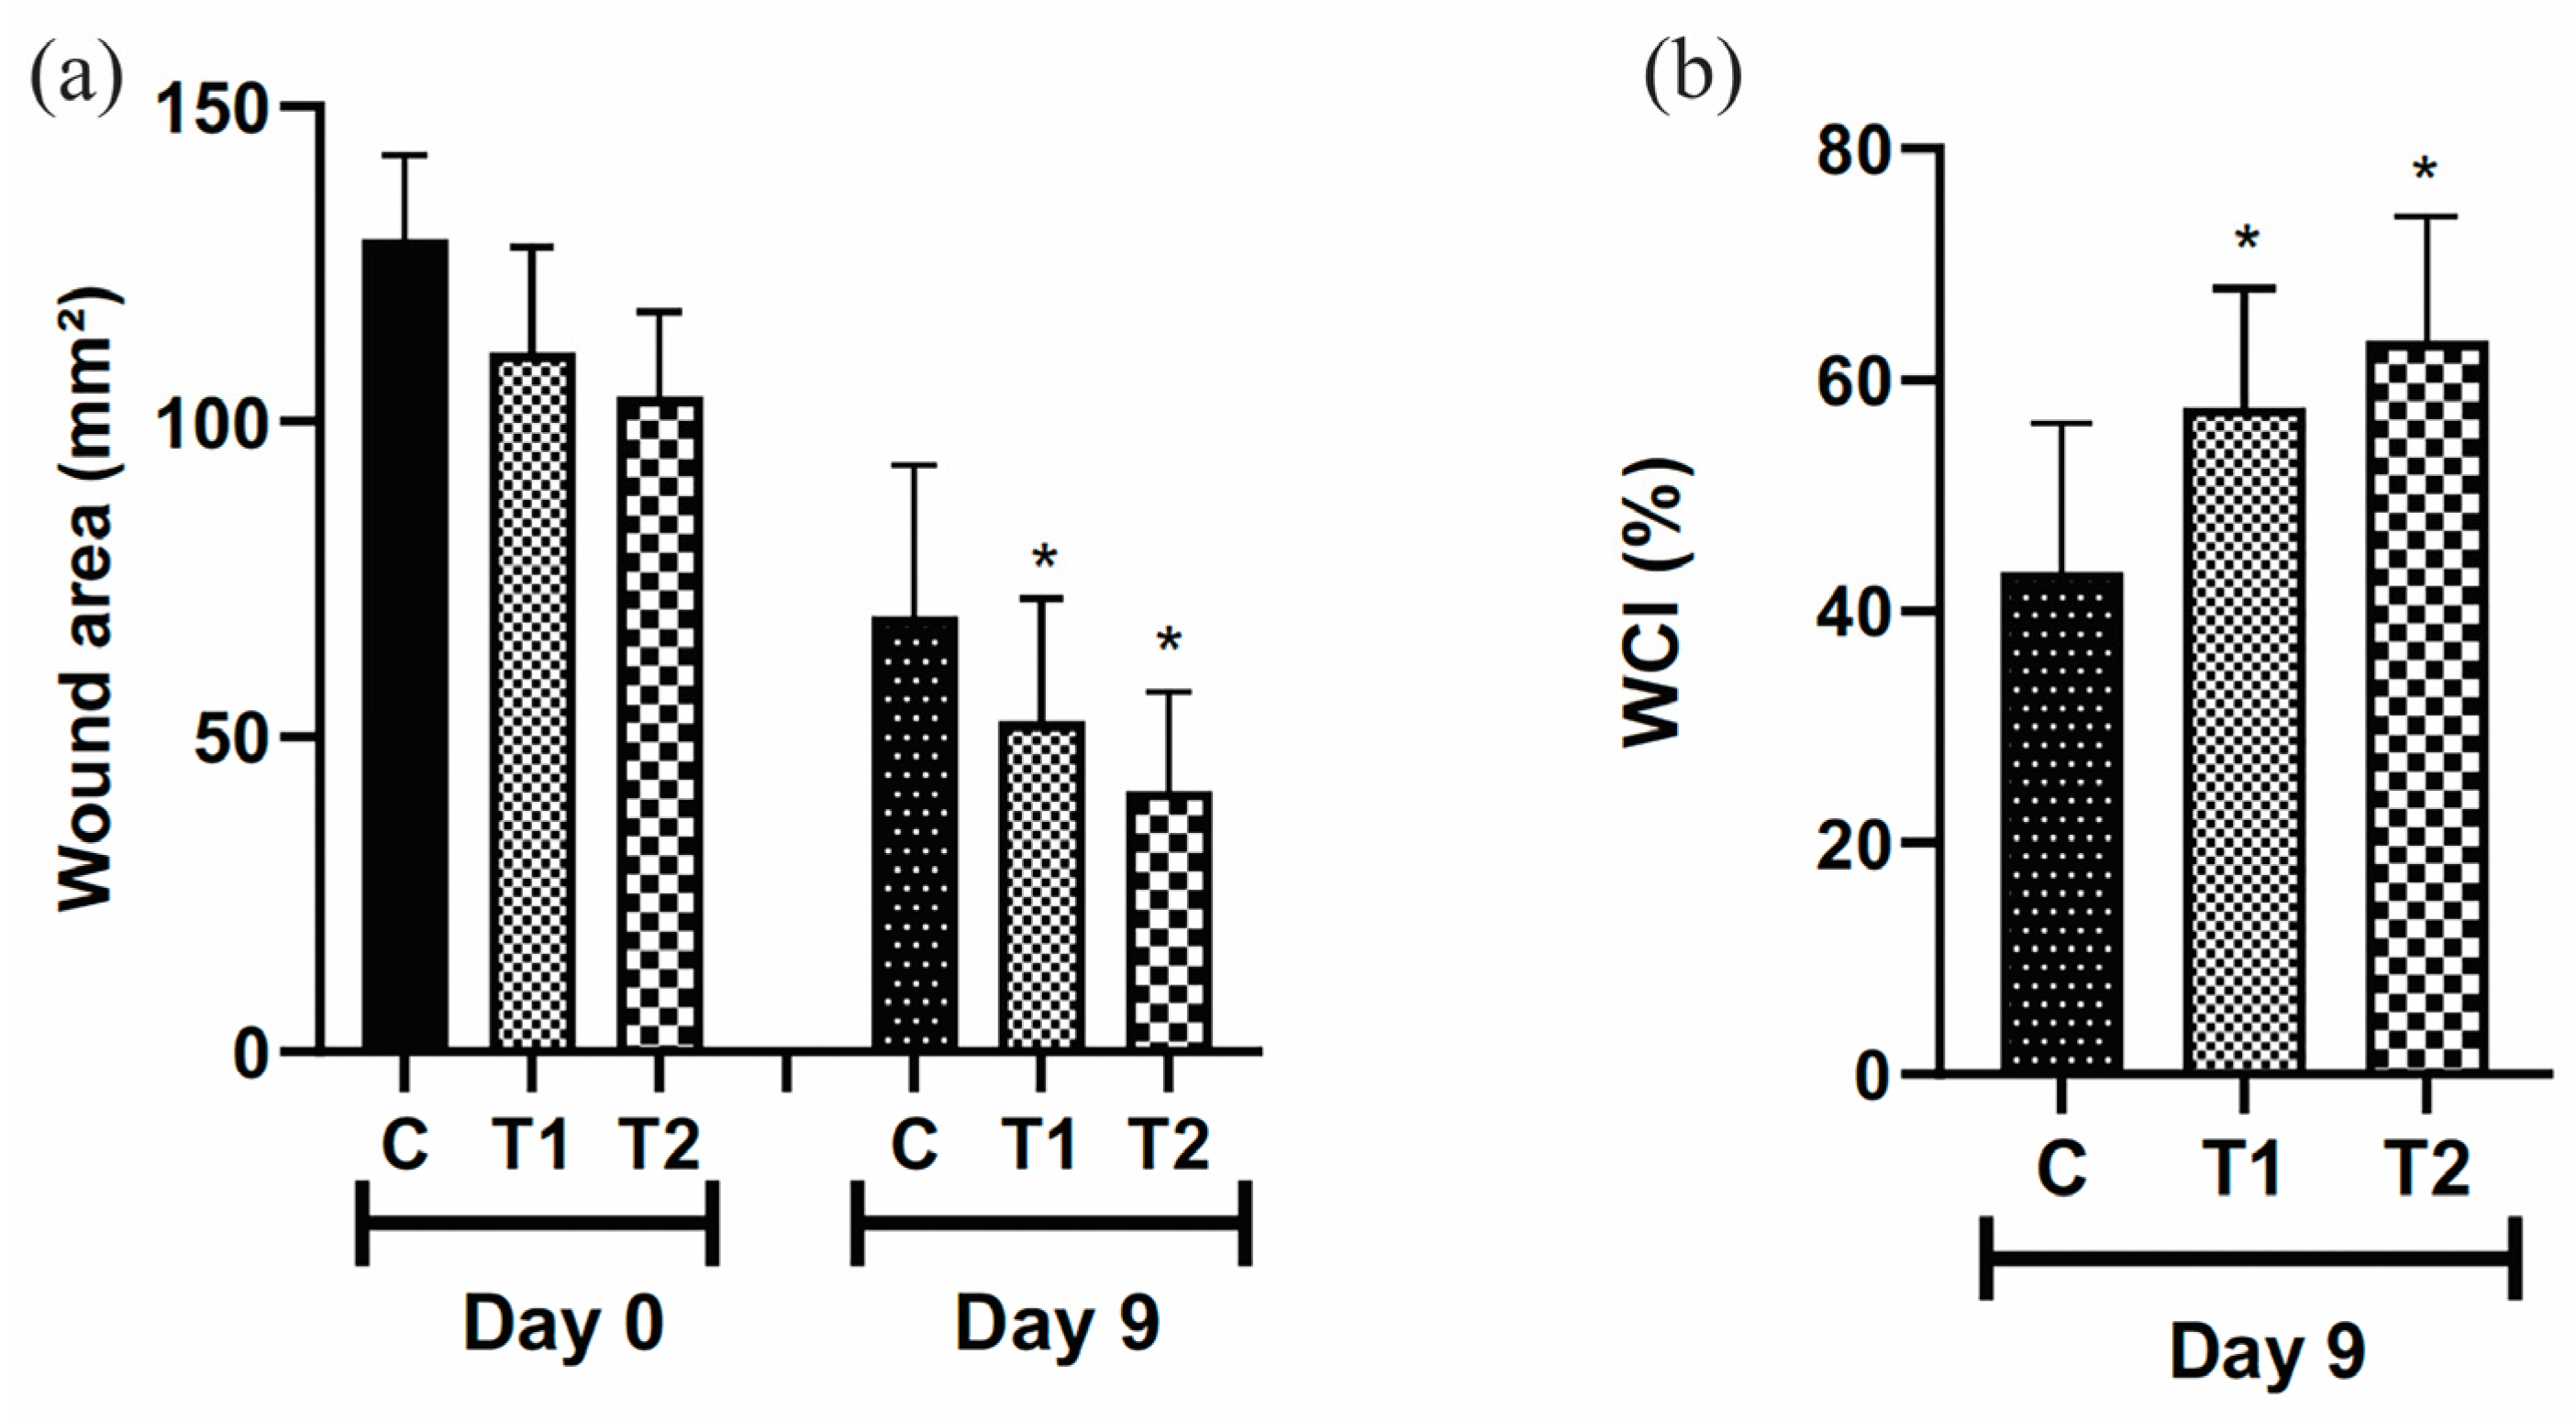
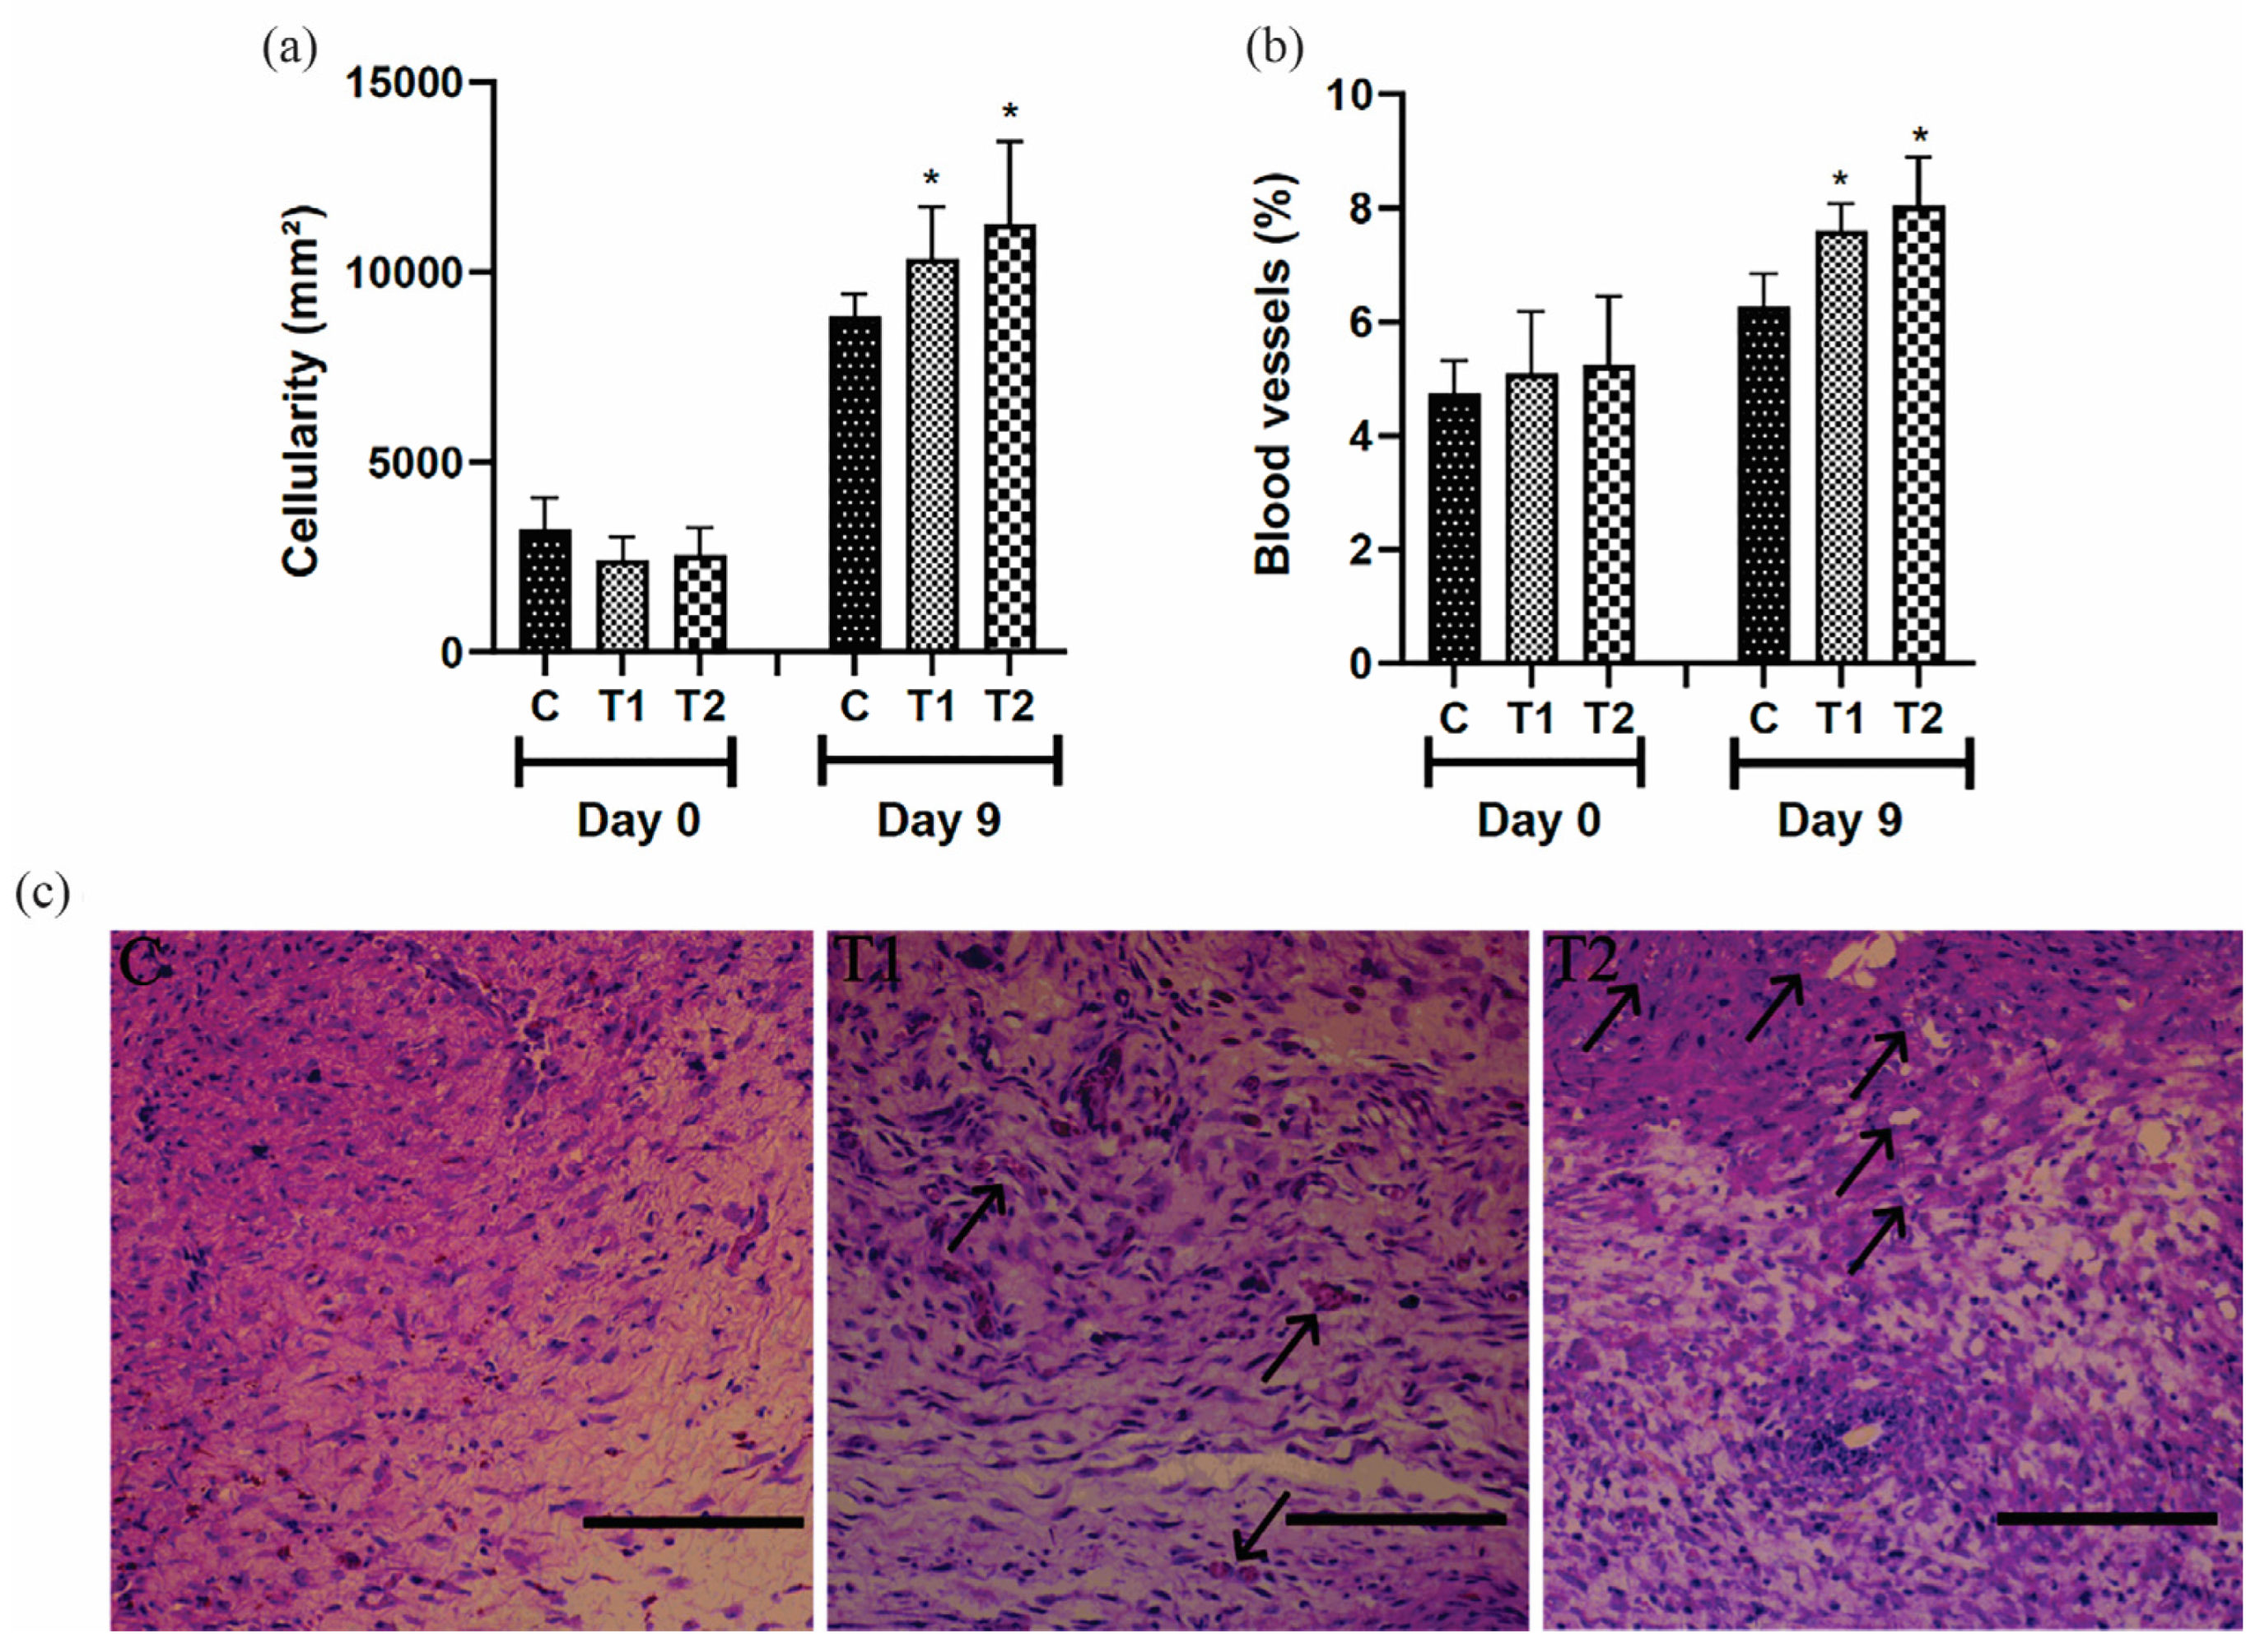
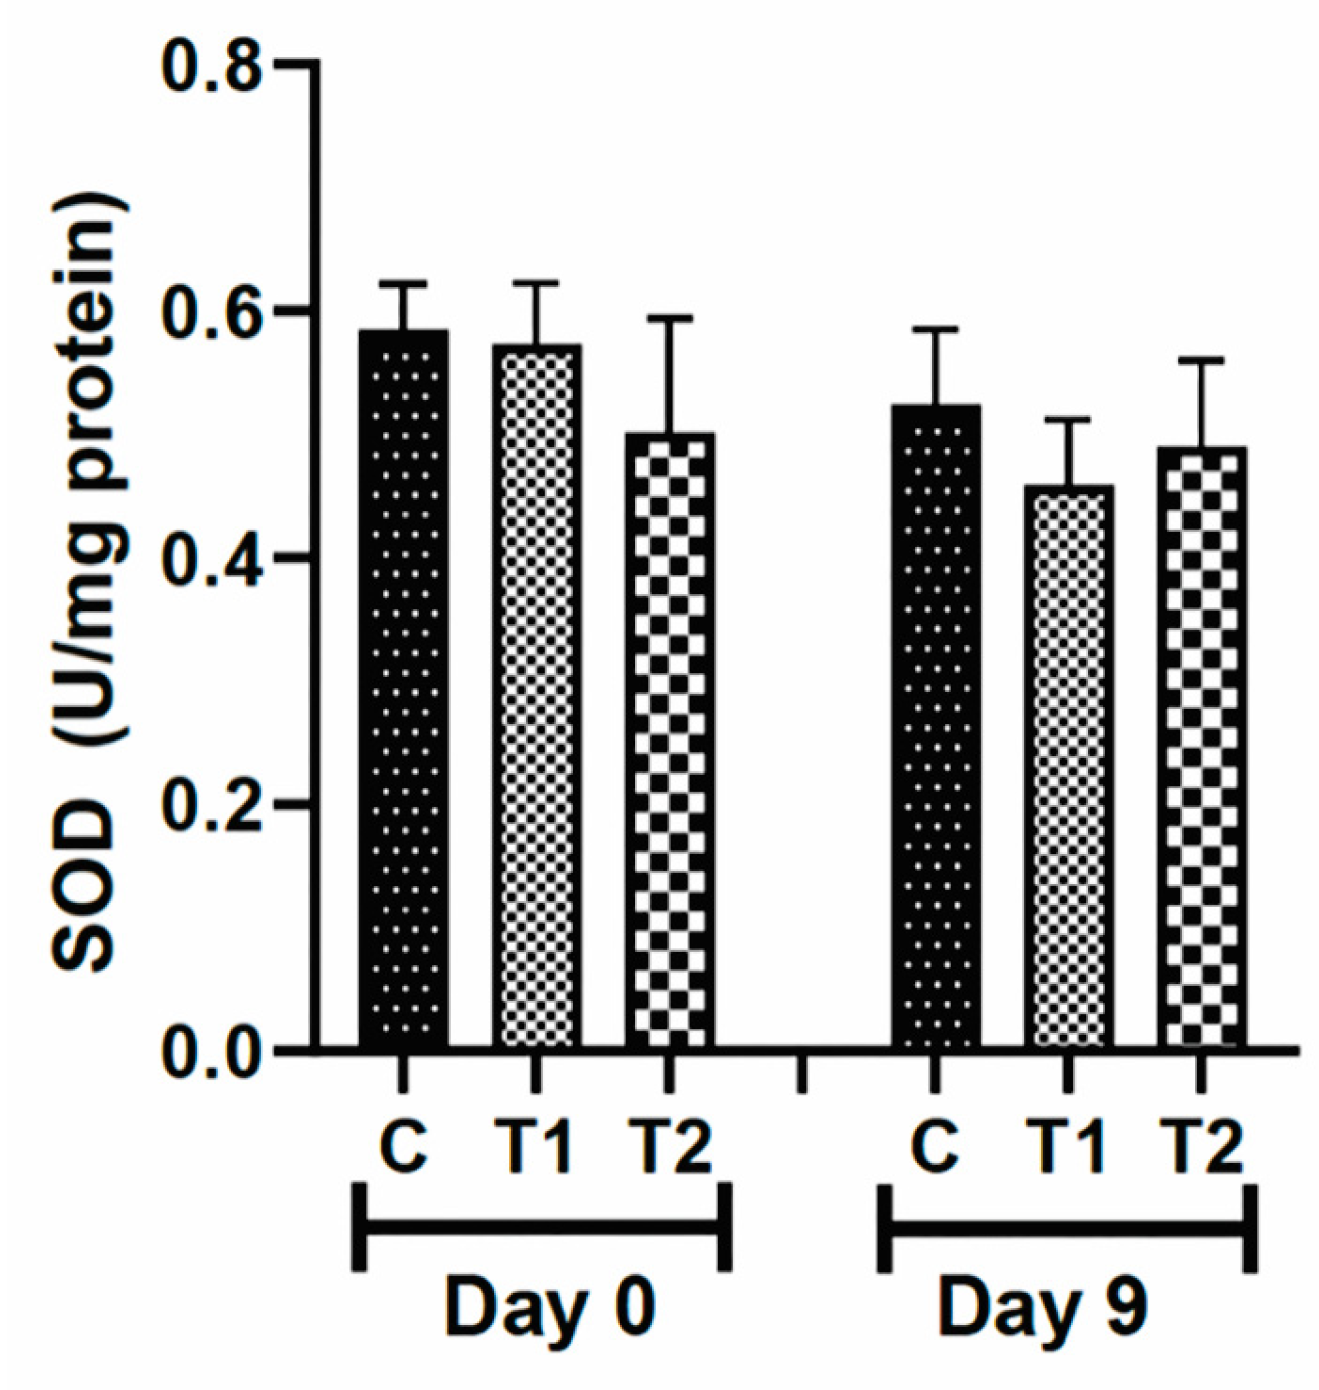
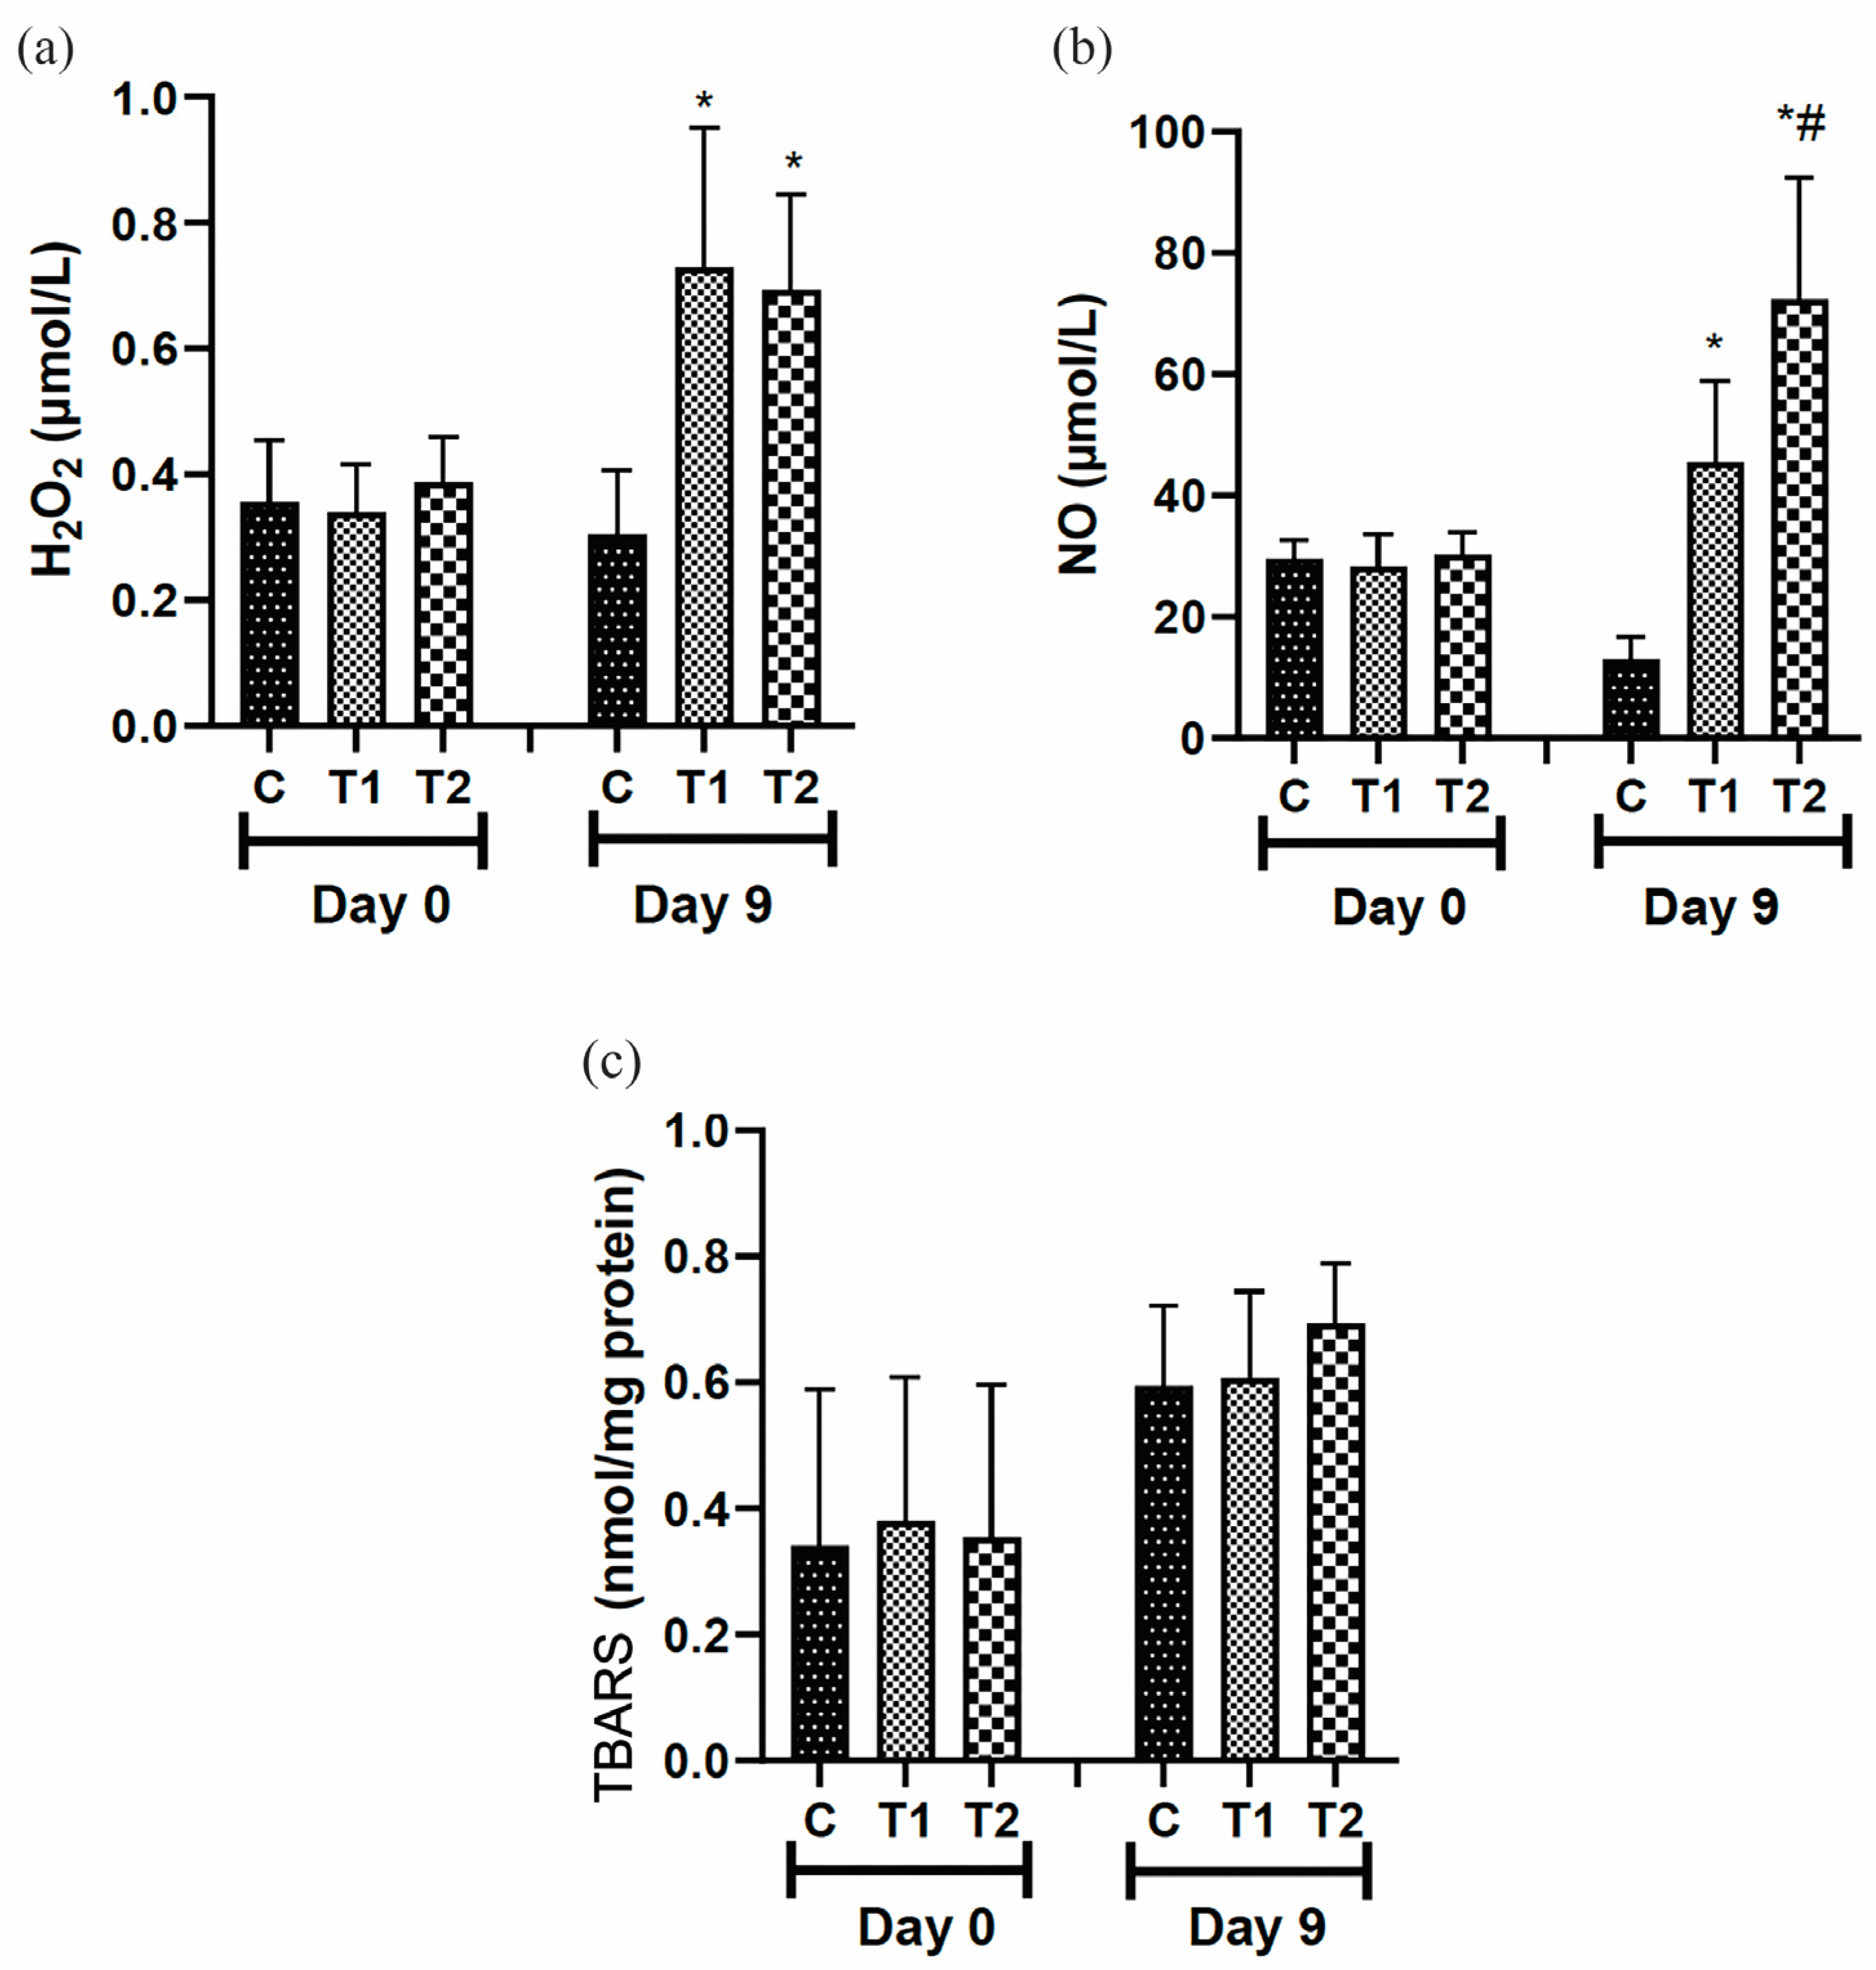
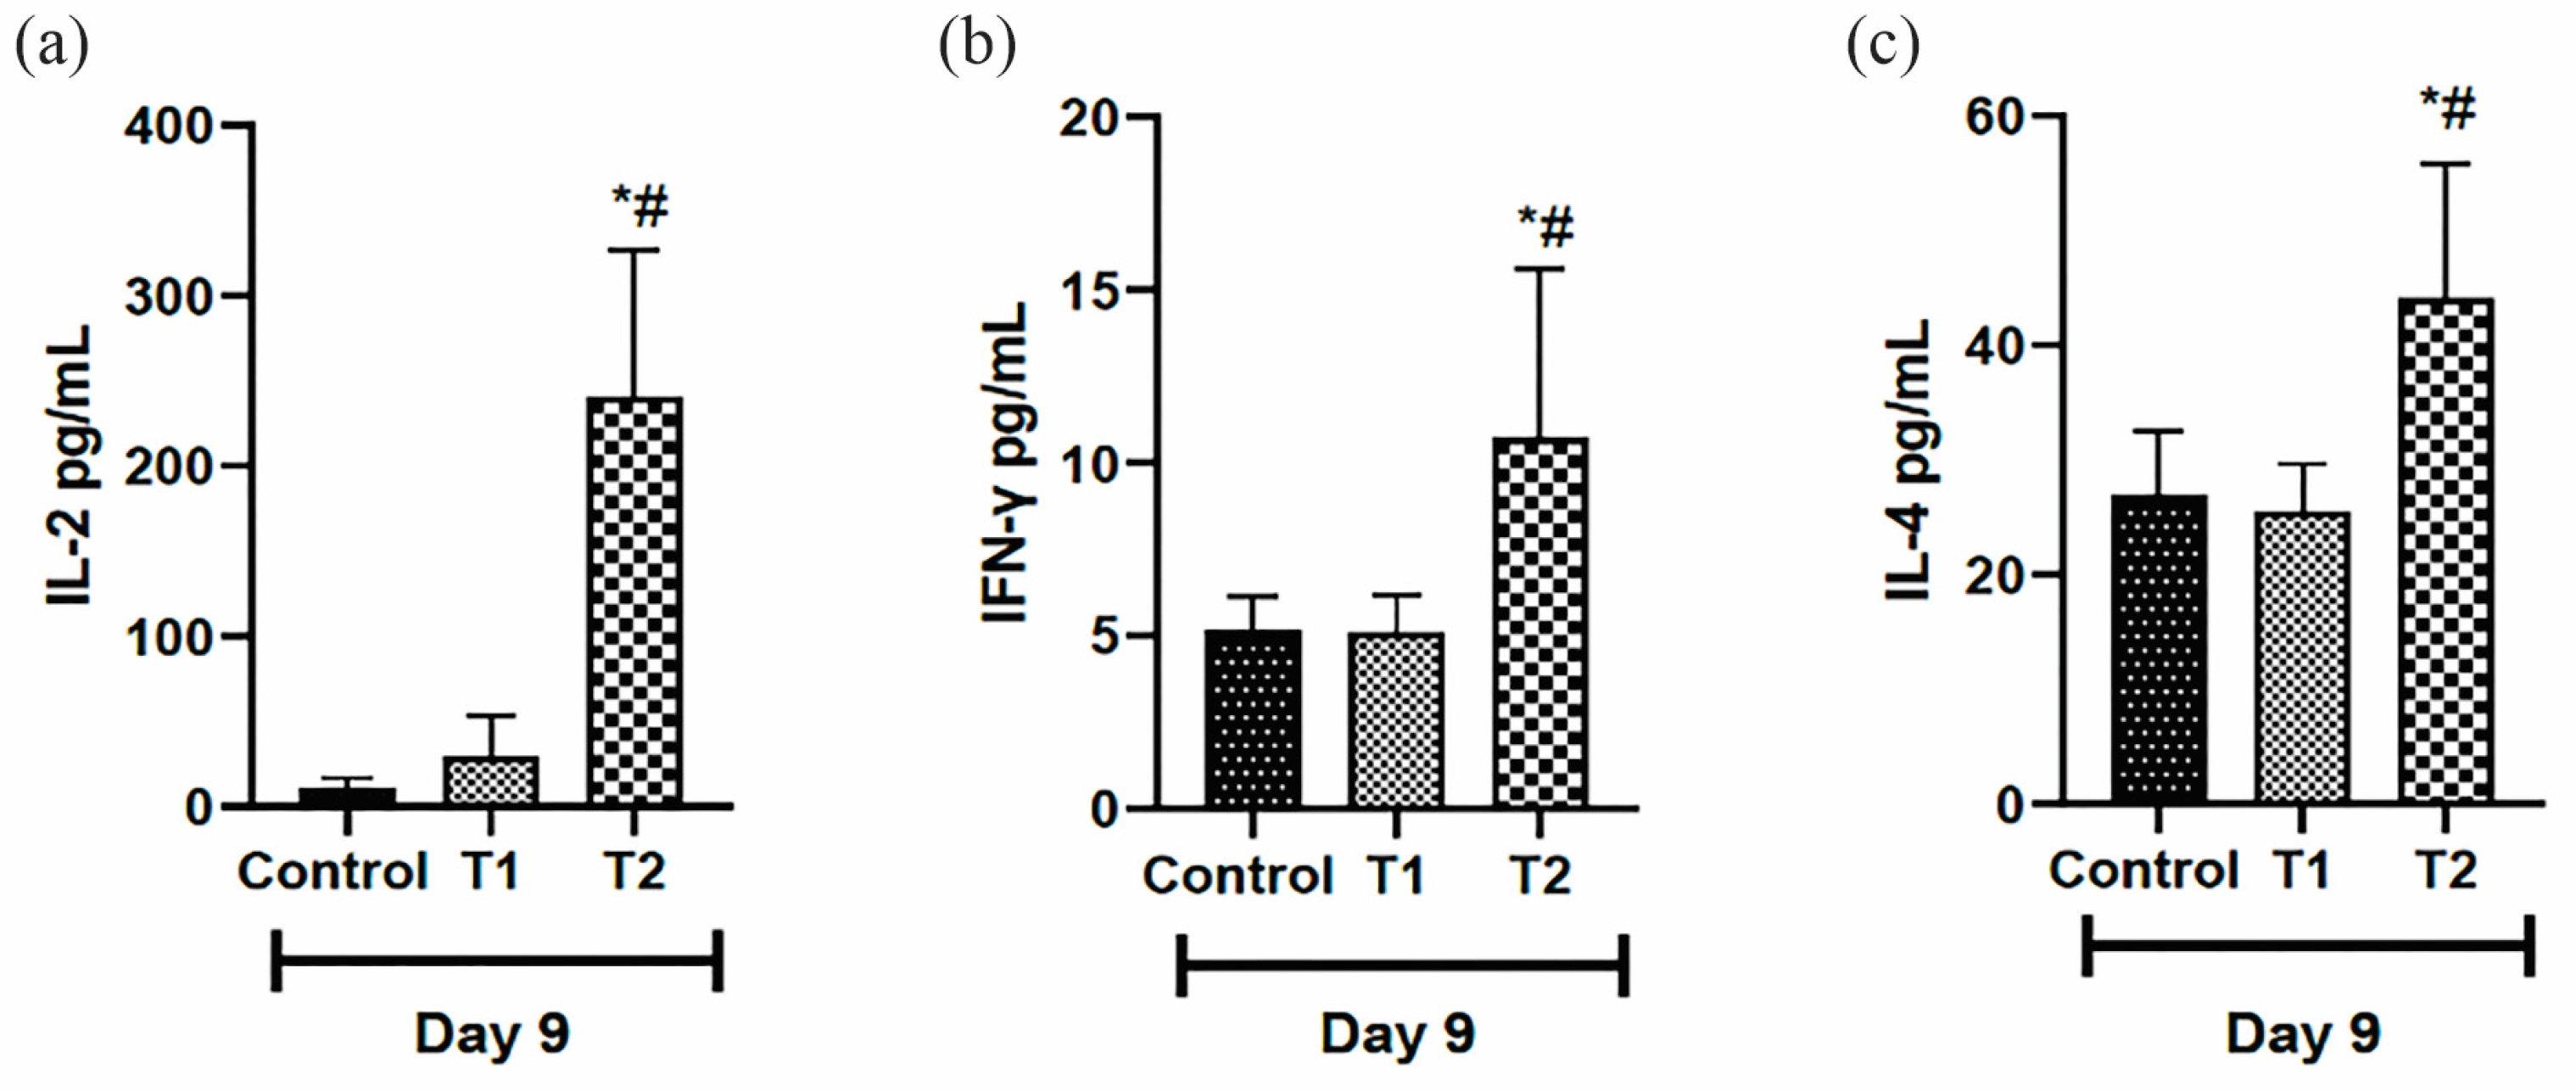
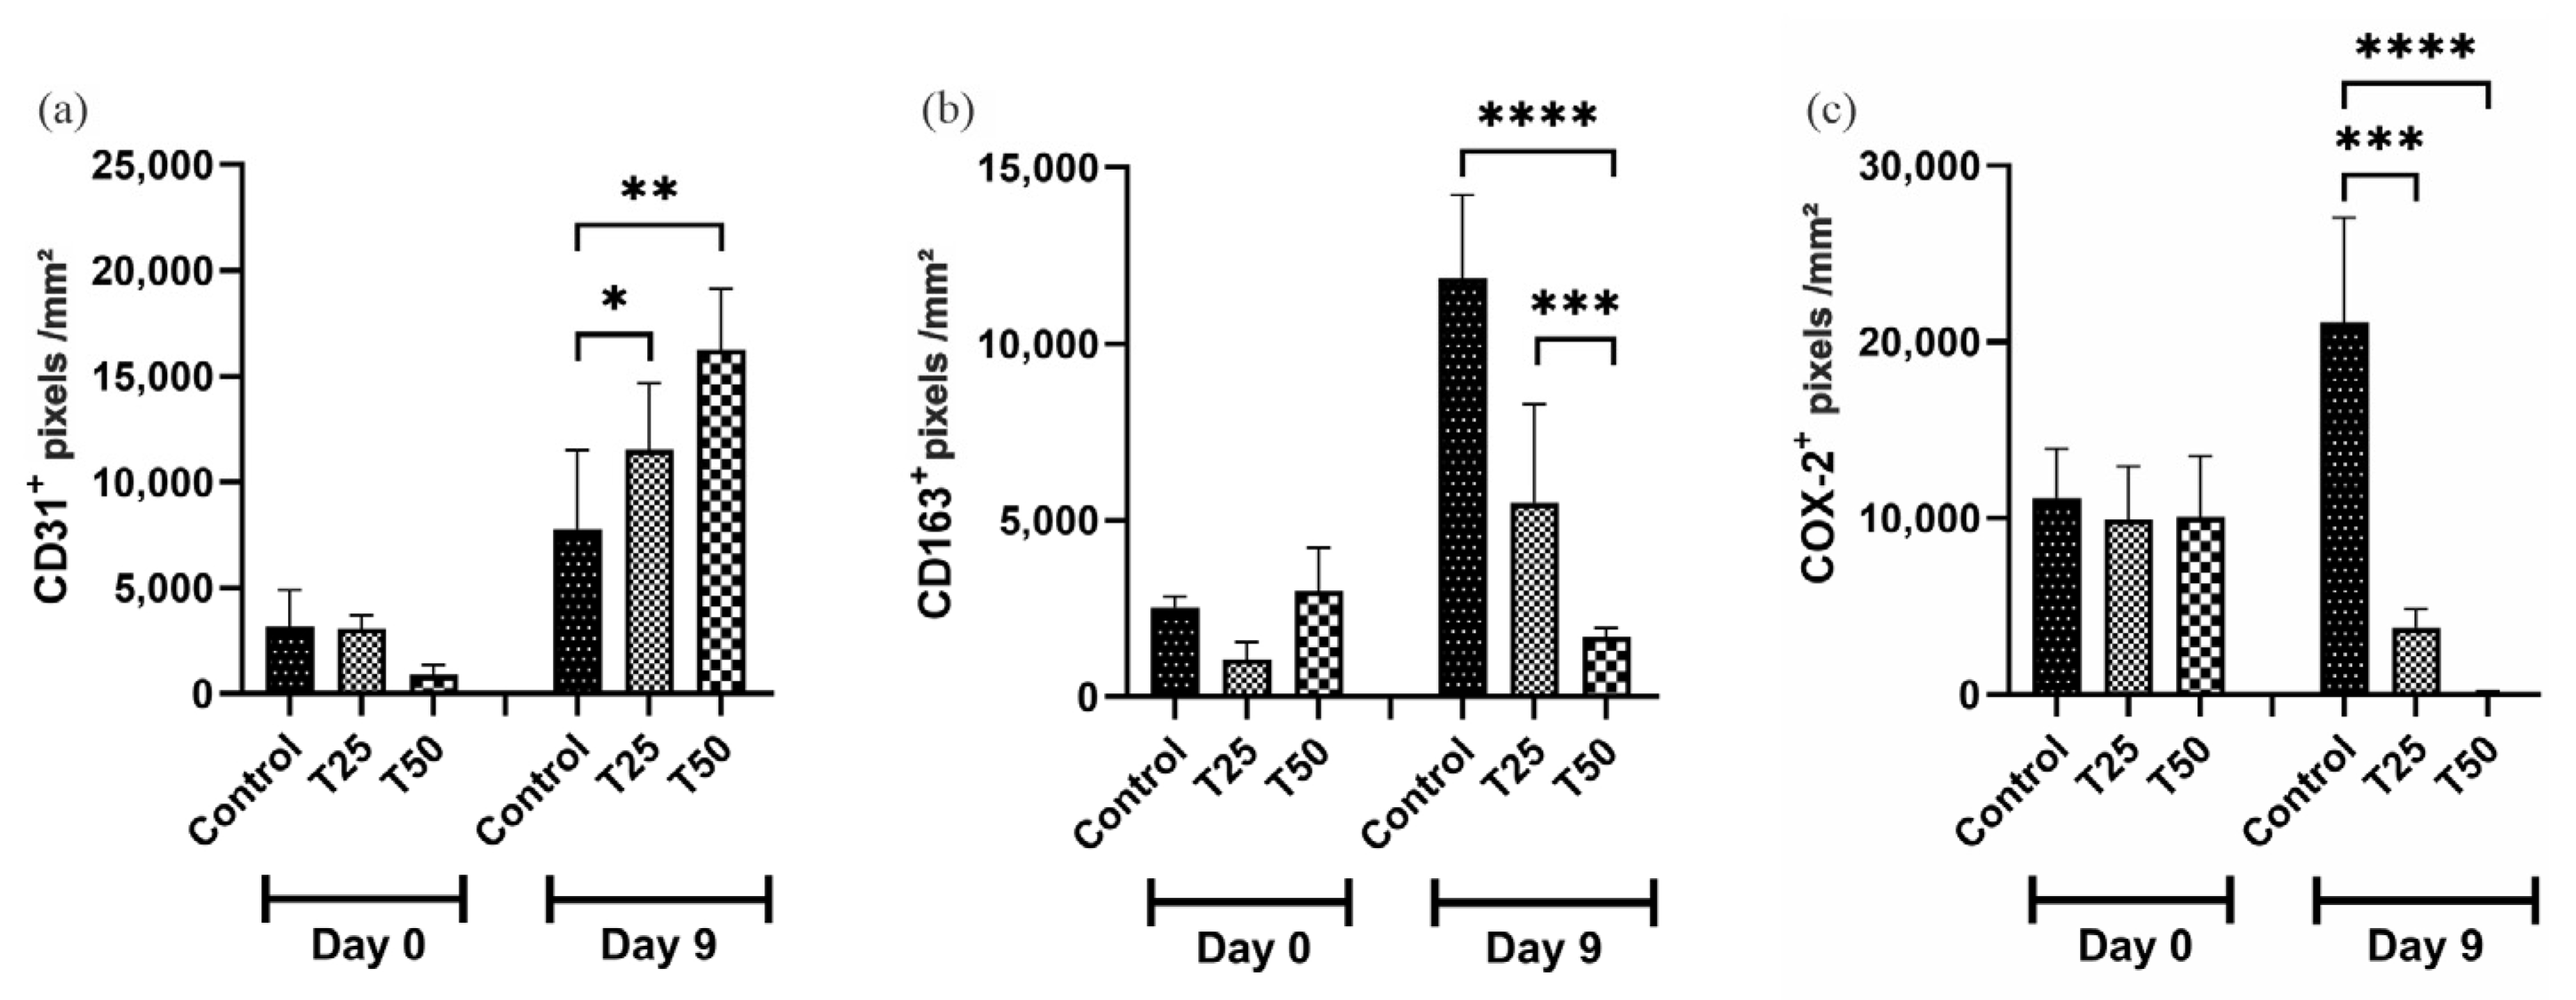

Disclaimer/Publisher’s Note: The statements, opinions and data contained in all publications are solely those of the individual author(s) and contributor(s) and not of MDPI and/or the editor(s). MDPI and/or the editor(s) disclaim responsibility for any injury to people or property resulting from any ideas, methods, instructions or products referred to in the content. |
© 2024 by the authors. Licensee MDPI, Basel, Switzerland. This article is an open access article distributed under the terms and conditions of the Creative Commons Attribution (CC BY) license (https://creativecommons.org/licenses/by/4.0/).