1. Introduction
Dry, sensitive, xerotic skin is the most common dermatological disorder impacting up to around 50% of the world’s population [
1,
2]. The way in which it develops as a result of both internal and external factors is a complex process, and a ‘dry skin cycle’ has been proposed for its evolution [
3]. When formulating products to tackle dry skin, assessment of what it does to the skin is an important aspect of characterizing its behavior as this enables the benefits to be communicated to the consumer.
Over the last 35 years, there has been a rapid expansion in the number and type of non-invasive biophysical methods capable of measuring a wide variety of skin parameters [
4,
5]. The use of these techniques has become an integral part of research into topical skin products and clinical testing for both the consumer and pharmaceutical markets. Along with the development of new methodologies, there comes a need to understand what aspects of the skin they can assess, the relevance of new information they provide, and how the data they provide relate to actual consumer feedback about topical product usage.
Although visual grading is still widely used to assess skin hydration, a wide range of biophysical methods claim to measure skin hydration, most of which use the skin’s electrical properties to infer the hydration level. Examples of such devices are the Corneometer
®, Skicon
®, Dermalab
® Combo, Nova DPM
TM, and MoistureMeter [
6,
7,
8,
9,
10]. These types of measurements are still used extensively for the assessment of the impact of topical products on skin hydration during both exploratory product testing and for supporting product efficacy claims.
The devices mentioned above produce a number related to the hydration state of the skin, based on the average of its properties over the measurement area. The use of two-dimensional (2D) skin capacitance imaging systems, firstly the SkinChip [
11,
12,
13,
14] which was not available commercially, and more recently the Epsilon
TM E100, and MoistureMap 100, which are commercially available, has opened up the potential to learn more about skin hydration on a micro level and how the use of topical products can impact it [
15,
16,
17,
18,
19].
In previous work the authors reported the initial results from a 3-week in vivo study looking at the effects of a multi-functional topical moisturizing formulation on a wide range of parameters associated with dry skin [
14,
15]. The study contained two devices—Epsilon
TM E100 2D hydration measurement, and Visioscan
® VC 20plus dry skin camera—for which it was only possible to include very top-level data assessment in the initial publications. Further analysis has since been carried out on the data and images provided by both devices, and how it relates to the subject feedback on the product collected during the study. This paper outlines the results of a novel approach to data analysis from a 2D skin hydration device—Epsilon
TM E100 (Biox Systems Ltd., London, UK)—and how the information it provided related to subject feedback after use of a topical cosmetic product designed for use on dry skin. New insights into how these types of devices can be used to monitor skin properties are discussed, with the aim of providing a more in-depth assessment than a simple ‘single number’ approach to skin hydration. The second article takes a deeper look at the data from the study provided by another skin measurement device—the Visioscan
® VC 20plus (Courage and Khazaka GmbH, Köln, Germany)—and also examines at how the range of skin parameters it can assess related to the reported subject feedback. This research is aimed at providing new insights for two skin measurement devices and establishing how the biophysical data they generate can be used to understand consumer feedback from the use of topical moisturizing products.
2. Materials and Methods
Subjects for the in vivo testing were recruited by proDERM GmbH, Schenefeld, Germany and the study complied with the World Medical Association’s Declaration of Helsinki (2000) concerning biomedical research involving human subjects. The study protocol was approved by an Institutional Review Board of proDERM GmbH (Schenefeld, Germany, approval number 2020/005). Sixteen subjects (average subject age was 46.3 +/− 4.3 years, and Caucasian and Asian skin types—Fitzpatrick I-III) with dry skin (overall dry skin grade 1–3 and Corneometer
® scores < 35 a.u. at Day 1 of the study) were recruited for the study. One subject withdrew from the study and fifteen subjects completed the study. A summary of the biophysical assessment part of the study protocol has been reported previously along with a list of the ingredients present in the test formulation [
20,
21]. Although the entire study ran for a period of 3 weeks product usage, for simplicity only the results after 1 week are discussed here, as the results at the end of Week 2 and Week 3 followed a similar trend.
After a 1-week washout phase, in which the subjects abstained from moisturizer usage and used a standard wash product, subjects then applied the products themselves twice daily to one lower leg (morning and evening) throughout the study after being taught correct product usage and application at the study center. Four adverse events were reported during the study (each one on a different subject), with all reported as being mild in severity. None were related to the use of the test product, and all were followed until resolution. One cosmetic moisturizer (Treated) and one non-treatment control site (Untreated) were used, and the sites to which the product was applied—left or right lower leg—were determined by the randomization plan. Each subject gave written informed consent and received a copy of the ingredient list for the test product. Product dosage was based on a dose per unit area of approximately 2 mg cm
−2. Subjects were told not to apply products to the skin on the morning of any days before measurements were performed at the study center. Subjects were also instructed not to use any other moisturizers or other wash products over the course of the study, and to refrain from caffeinated drinks for at least 2 h before any measurement. This was to exclude possible changes in skin water levels due to the pharmacological effect of caffeine [
22]. 16 Subjects were acclimatized for at least 30 min in a temperature-controlled room (21 ± 1 °C, humidity 50 ± 5%) prior to measurements.
Two-dimensional capacitance imaging of the skin was carried out using an EpsilonTM model E100 (Biox Sytems Ltd., London, England). The settings for the measurement were: Capture Mode, Event Trigger: 0.5, Delay Time: 2 s; permittivity [ε] was measured for the test area (1.2 cm × 1.5 cm, 256 × 300 Pixel resolution), and one measurement was taken per test area and assessment time. Further analysis of the images was carried out using the devices software, using the Group Analysis option, and will be discussed within the Results section.
On day 1 of the study before any product was applied to the skin, the subjects were asked a series of questions regarding the condition of their skin on both legs to determine whether they perceived both legs similarly. Answers to the questions were given using a numerical scale with a range of +3 (very much agree) to −3 (very much disagree) for each attribute. On day 8, after 1 week of product usage, the subjects were asked to compare the condition of the skin on both legs using a questionnaire with a Visual Assessment Score (VAS) with a scale between −50 and +50 (−50 = untreated leg much more; 0 = no difference; 50 = treated leg much more).
A significance level of 0.05 (alpha) was chosen for statistical analysis of the EpsilonTM data. Comparisons of treatment and untreated sites were performed on differences to baseline scores using multifactorial analysis of variants (ANOVA) with product, subject and side as factors, and the baseline values as covariates. This was carried out with commercially available statistics software (Statgraphics Centurion 18). Subject self-assessment data analysis was shown as mean response for the baseline comparison between the sites and the VAS scores. In addition, the percentage of data in the top 2 box (+3 and +2) and bottom 2 box (−3 and −2) was calculated for the baseline data. Subject data were analyzed using Microsoft Excel 2016 and JMP v15.
3. Results and Discussion
It has been previously reported that the Epsilon
TM E100 can assess the changes to skin dryness as a result of usage of a topical moisturizer [
20,
21]. However, in the previously reported work, a simple average score for the electrical permittivity of the skin was used for the analysis. The value of using 2D hydration assessment, compared with the more traditional ‘single number’ approach to assessing skin hydration, comes from its ability to capture a high-resolution map of the skin in contact with the measurement sensor, with each pixel of the image containing data on the electrical properties in that small area. Example images from the Epsilon
TM for normal and dry skin are shown in
Figure 1a,b.
Each image is split into two parts. On the left is the image of the entire test area (256- × 300-pixel resolution—76,800 total pixels). Within the image is a red circle which outlines a user-defined region of interest (ROI) which can be analyzed if needed. On the right-hand side of the image is a histogram showing the distribution of permittivity values of the entire measurement area in green and from within the ROI in red, expressed as a percentage of the measurement area. Dry skin has a greater proportion of the image with low electrical permittivity scores, whereas with normal hydrated skin the histogram is shifted more towards the higher permittivity scores. It is these scores which are used to derive the overall average permittivity score for either the entire image or the ROI when the device is used in its basic form.
Use of an ROI avoids the information at the edge of the measurement area where there is poor contact between the skin and the Epsilon
TM device, and this was how the previously reported data were analyzed [
20,
21]. However, by assessing the entire image frame it is possible to derive information on the flexibility of the skin and how well it can conform to the measurement head. Each measurement with the Epsilon
TM captures an image of the entire measurement area with a spatial resolution of approximately 50 µm, enabling assessment of the variation in skin hydration to be carried out at much higher resolution than is possible with the traditional type of electrical skin hydration measurement devices. Similar to the Corneometer
®, the Epsilon
TM measurement head is spring loaded, meaning as it is pressed against the skin, the skin itself will flex [
23]. As dry skin is less flexible than hydrated skin it is less able to fully conform to the measurement head when it is pressed against the skin [
18]. Increasing skin hydration through the use of humectants such as glycerine and dexpanthenol [
24,
25] would increase the flexibility of the skin and, therefore, result in a greater proportion of the measurement area being taken up by the skin itself, and less of the image being comprising the air gaps around the edge of the image and from the dermatoglyphic lines [
24,
25]. Improving the skin barrier through the formation of skin barrier lipids would also be expected to increase the degree of skin hydration by the slowing water loss. The test formulation contains niacinamide and dexpanthenol which have been reported to increase the levels of ceramides and fatty acids [
26,
27], and would thus be expected to strengthen the skin barrier, as was observed in this study [
20,
21].
The regions of the image which comprise air gaps appear as areas with very low permittivity scores. The change from baseline condition in the amount of the image in the permittivity range of 0–3 for the treated and untreated areas of the skin after 1 week of treatment is shown in
Figure 2.
The untreated site showed no change in the image with pixels corresponding to the permittivity range of 0–3 at week 1. The number of pixels in that range for the treated site significantly decreased, with the reduction corresponding to approximately 15% of the entire measurement area. This showed that treatment with the test product resulted in a greater ability of the skin to be able to conform to the surface of the measurement device, indicating that this approach can be used to understand about changes in skin flexibility as a result of product usage.
Removal of the parts of the image corresponding to where the skin is not in contact of the sensor leaves the permittivity region from 3 to 85. The changes in the number of pixels and the average permittivity change in that remaining region for the treated and untreated sites are given in
Figure 3a,b.
In addition to the increase in the number of pixels in contact with the sensor in the 3–85 permittivity region, the average permittivity within that region has also increased; therefore, it can be said that the average hydration of the parts of the skin that are in contact with the sensor has increased. It is important at this stage to understand what that means and how it is different to a standard skin hydration measurement. A standard skin hydration measurement device based on changes in electrical properties of the skin such as the Corneometer
® or Skicon measures the average electrical properties across the whole area of the measurement probe [
6,
7,
23,
28]. Therefore, this is a composite measurement of the electrical properties of the skin itself along with and the relative amount of skin and air which is in contact with the sensor. As these types of devices produce a single number based on the overall measured change, it is not possible to differentiate whether any observed change during a study is due to a change in the degree of contact between the device and the skin, or a variation in the hydration level of the skin which is in contact with the device. There is strong evidence to support the use of the traditional electrical-based skin hydration measurement devices, as they have shown good correlation with visual grading of dry skin [
20,
21,
29] and they will no doubt continue to be of use in this regard, but with the advent of 2D hydration measurement devices it is possible to understand more about the mechanisms which are contributing to the observed changes.
To understand further about the changes in hydration level of skin as a result of using the test product, the permittivity range was split into regions—0–3, 3–20, 20–40, 40–60, 60–80, and 80–85—and the change in the number of pixels and the average permittivity change within each region assessed for the treated and untreated site (
Figure 4a,b).
After 1 week, the average number of pixels in the different permittivity regions did not change on the untreated site; however, at the treated site there was a significant reduction in the number of pixels in the 0–3 permittivity region (
Figure 4b). There was a corresponding increase in the number of pixels in the other regions, with the largest increase in the region with permittivity scores between 20 and 40. The average permittivity change in each region can also be calculated as shown in
Figure 4a. The average permittivity in the 3–20 and 20–40 region increased for the treated site. It should be noted that average permittivity for the 60–80 and 80–85 regions could not be calculated as insufficient subjects had values in those areas to enable statistical assessment to be made for the average permittivity scores. Based on this, it appears that use of the test product impacts hydration in areas of the skin differently depending on the starting hydration levels, opening up the possibility of further understanding the mechanisms by which moisturizers are hydrating the skin.
Reducing the size of the permittivity regions down to a single unit and analyzing using an ROI enables a full histogram of the hydration state of the skin to be determined after 1 week of treatment, as shown in
Figure 5 in the form of a hydration histogram.
It should be noted here that the data in
Figure 5 have not been subtracted from the baseline and are presented as the average percentage of the image for each permittivity unit for the treated and untreated site across all the subjects. No statistical analysis has been carried out on the data in
Figure 5 to determine differences between the treated and untreated areas, but it demonstrates the differences between the treated and untreated sites, and the shift towards regions of higher permittivity after product usage. It should also be noted that the y-axis is shown as a logarithmic scale to aid comparison between the treated and untreated sites. Even on the treated site, the majority of the skin has relatively low permittivity scores, and use of a logarithmic scale enables the differences to be more readily observed. It also highlights that there appear to be relatively subtle changes in the electrical properties of skin when it changes from dry to hydrated skin.
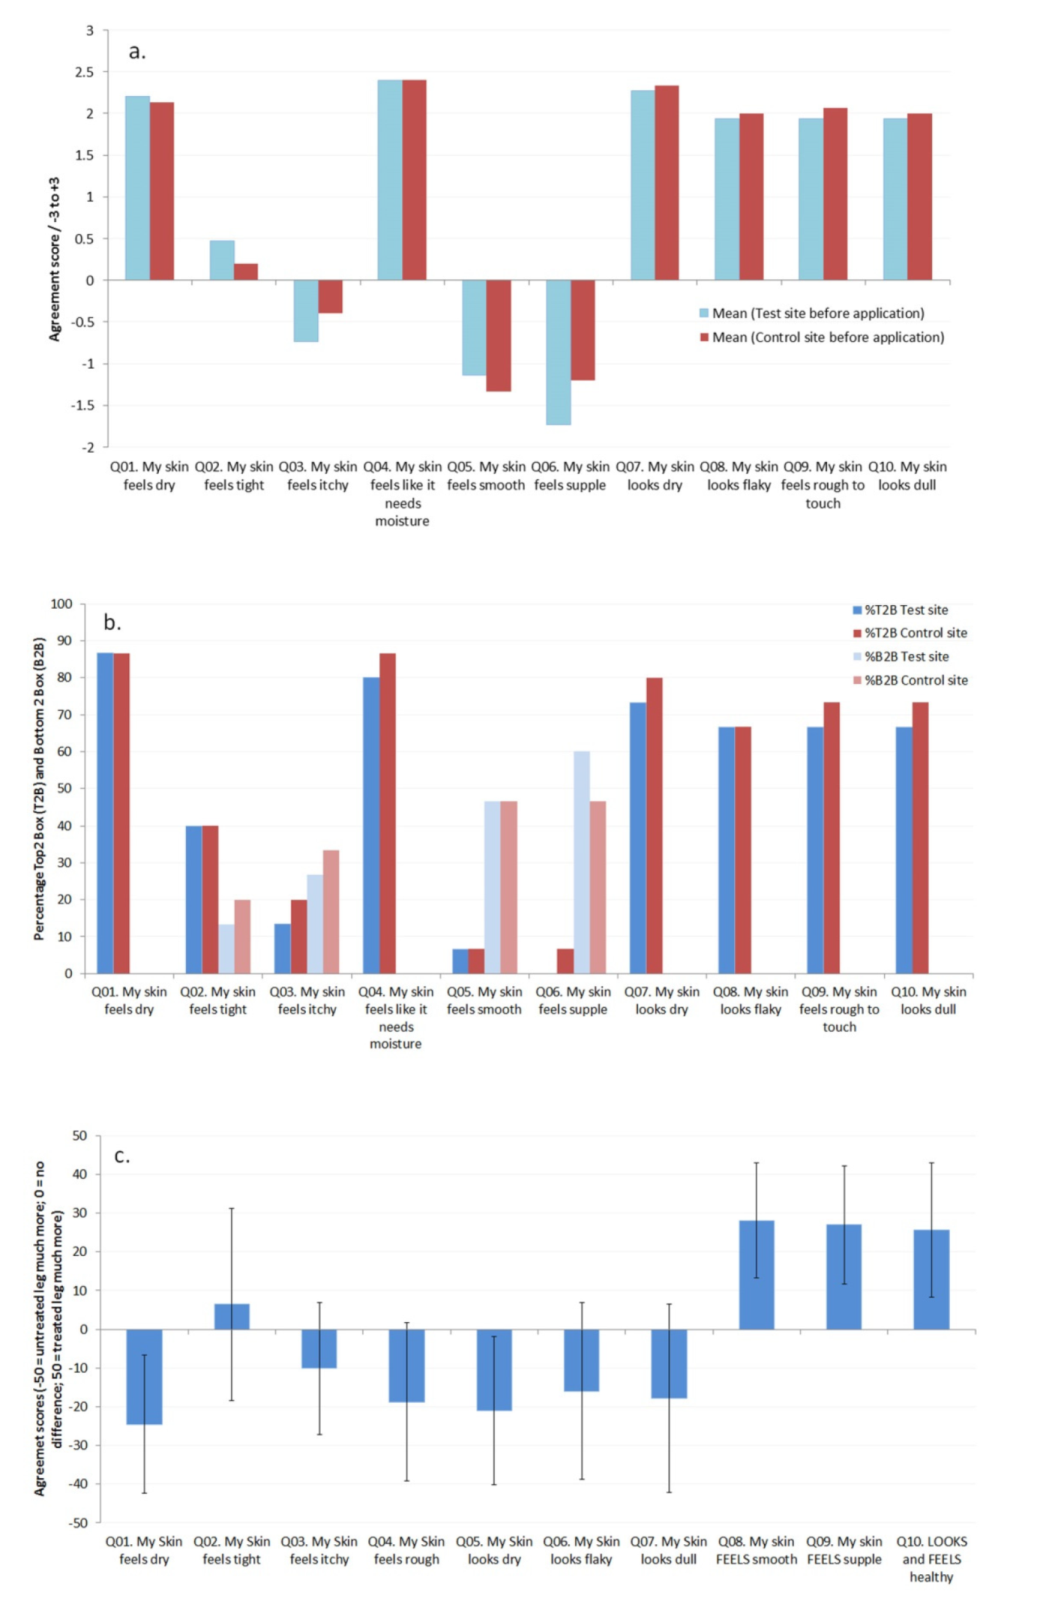
Before product usage began the subjects were asked to rate the condition of the skin on both of their legs based on a series of questions. As can be seen in
Figure 6a,b, both legs were rated equivalently at baseline before the use of the product began (and
t-test data showed no significant differences between the two sites for each attribute), with an overall consensus that their skin felt dry and rough and had reduced suppleness, as well as looking dry and flaky.
Average responses to the questions and Top 2 box (T2B; +3 and +2) and Bottom 2 box (B2B; −3 and −2) analysis of the responses are given in
Figure 6a,b, respectively. After 1 week of product usage comparison of the treated and untreated sites revealed that the subjects had noticed reduced dryness, increased flexibility and suppleness, and reduced roughness,
Figure 6c. The data from the Epsilon
TM showed an improvement in skin hydration (reduced dryness), which would be expected after the use of a topical moisturizing product, but also using the approach discussed here an increase in the flexibility and suppleness of the skin as a result of using the test product. By including subject questionnaires in the study, it is possible to obtain feedback on the use of topical products in addition to biophysical data, demonstrating how biophysical methods can be related to characteristics of the skin which the subjects can perceive [
30,
31].
The limitations with regard to the study will now be discussed. The choice of permittivity scores for the different regions assessed here was carried out based on visual assessment of the images. Visual assessment of the images from the device showed that scores of 0 to 3 corresponded to regions where there was no contact between the skin and the sensor of the device, such as in the dermatoglyphic lines. Similar results were obtained with the use of scores between 0 and 2 instead of 0 to 3 (data not shown here). The other regions—3–20, 20–40, 40–60, 60–80 and 80–85—were chosen to give a range of regions across the measurement scale of the device. Further work is planned to look at how different products and formulation types behave when analyzed in this manner.


 ,
, 