Article

SmartFit: Smartphone Application for Garment Fit Detection

1
Department of Electrical and Computer Engineering, Texas Tech University, Lubbock, TX 79409, USA
2
Department of Hospitality and Retail Management, Texas Tech University, Lubbock, TX 79409, USA
*
Author to whom correspondence should be addressed.
Electronics 2021, 10(1), 97; https://doi.org/10.3390/electronics10010097
Submission received: 16 October 2020 / Revised: 26 December 2020 / Accepted: 28 December 2020 / Published: 5 January 2021
(This article belongs to the Special Issue Smart Bioelectronics and Wearable Systems)

Abstract

:
The apparel e-commerce industry is growing day by day. In recent times, consumers are particularly interested in an easy and time-saving way of online apparel shopping. In addition, the COVID-19 pandemic has generated more need for an effective and convenient online shopping solution for consumers. However, online shopping, particularly online apparel shopping, has several challenges for consumers. These issues include sizing, fit, return, and cost concerns. Especially, the fit issue is one of the cardinal factors causing hesitance and drawback in online apparel purchases. The conventional method of clothing fit detection based on body shapes relies upon manual body measurements. Since no convenient and easy-to-use method has been proposed for body shape detection, we propose an interactive smartphone application, “SmartFit”, that will provide the optimal fitting clothing recommendation to the consumer by detecting their body shape. This optimal recommendation is provided by using image processing and machine learning that are solely dependent on smartphone images. Our preliminary assessment of the developed model shows an accuracy of 87.50% for body shape detection, producing a promising solution to the fit detection problem persisting in the digital apparel market.

1. Introduction

Recently, societal demands for purchasing apparel products online have increased with technological progress. As a result, the apparel e-commerce industry is booming more than ever before [1]. Therefore, the online presence of apparel companies is necessary for the business to succeed. This is especially during the COVID-19 pandemic, while online apparel shopping for consumers is quickly and gradually increasing [2]. The revenue in apparel e-commerce in 2020 is USD 110.6 billion and is expected to increase to USD 153.6 billion by 2024 [3]. However, one of the main obstacles to the path of increasing revenue in this industry is the large amount of returns. In addition, the industry faces issues with the cost of merchandising, shipping, and processing [4]. There has been a study showing that around 30% of the apparel purchased online is returned due to poor fit [5]. The current existing online shopping websites do not provide any means of measuring body size and shape. Tech startups like True Fit (www.truefit.com) and Fits.me (www.fits.me) have developed virtual fitting rooms using virtual mannequins to mimic the body measurements of shoppers and display what a certain garment, i.e., apparel, might look like when it is worn by the consumer [6]. However, these types of solutions fail in the practical size assessment at the industrial level due to technical barriers such as an overcomplicated process, inefficient technology, low user adaption and costly expenses required to adopt the technology [7]. Even advanced technologies such as Sizer (www.sizer.me) and MTailor (www.mtailor.com) do not always provide actual fit information and size measurements, failing to completely solve the poor fit issue [8].
Online apparel fit detection has been a burning issue due to the lack of technology that can detect consumer body shapes. Consumers’ garment fit largely depends on their individual body shapes [9]. Therefore, there is a tremendous amount of profit loss due to the poor fit and associated return issues. In fact, 50% of the time, online purchases result in returns, which in turn, cost time and money to both the consumer and retailer. Returns may cost around USD 10–15 in total per garment, which is a huge burden to be split among the consumers as well as businesses [10].
As most of the garments are made universally in conventional body shapes and sizes, there is a need to solve fit issues in a personalized way starting from apparel manufactures all the way to the retailers and consumers. Aside from tailoring apparel stores, apparel manufacturers are adapting to the patterns of producing garments based on shape-based anthropometric data [11,12]. The four most common traditional body shapes for females [13], namely inverted triangle, pear, hourglass, and rectangle [14] are shown in Figure 1. The body shape plays an important role in understanding the optimal fit of garments for individual consumers [15]. However, current technologies cannot provide the body shape information related to the garment fit [10].
In this paper, we proposed a novel body shape detection algorithm for garment fit, which extracts consecutive feature points using speeded up robust features (SURF) [16], detects visual words from extracted features points using the bag-of-features model [17], and classifies body shapes using a machine learning technique, such as the k-nearest neighbor (k-NN) [18]. We also propose a convolutional neural network (CNN)-based [19] body shape detection algorithm. Specifically, we suggested a unique combination of image processing and machine learning based body shape detection using 2D smartphone images. Especially, SURF feature detection, the bag-of-features model, and machine learning technique have not been proposed to differentiate the body shapes for garment fit. The conventional method for body shape detection is limited to a physical measurement-based approach [20] or a multiple photo-based 3D reconstruction approach [15], which are mostly inaccurate and impractical due to the expensive computation [21]. Therefore, in this paper, we suggest a unique combination of image processing and machine learning based body shape detection using 2D smartphone images. Figure 2 describes the overall procedure of the proposed method.
This paper is organized as follows: Section 2 describes data acquisition and pre-processing procedures. Our proposed method consisting of feature detection and classification algorithms is explained in Section 3. Results and discussions are presented in Section 4 and Section 5, respectively.

2. Data Acquisition and Pre-Processing

Experimental images have been acquired following the IRB protocol (IRB2020-482) at Texas Tech University which allows for the usage of the images acquired from public online data. A total of 160 images were originally acquired from online sources (Hourglass body shape, Available from: www.abeautifulbodyshape.com/hourglass-body-shape-explained/, Pear body shape, Available from: www.bodyvisualizer.com/) and the Google search engine, which are publicly available (Our acquired dataset, Available from: www.youtu.be/204kb29laBo). Then, a total of 80 images were manually selected among them by the expert in apparel design based on the body shape determinant criteria [22]. These images were selected because they fell into the four types of body shapes for females we particularly focused on, namely: inverted triangle, pear, hourglass, and rectangle, since females have more issues with the fit and these are the most common body shapes for them. Based on the reference [23], the authors chose 80 images (20 for each category) for the proof-of-concept study in this paper. The major vote method [24] was used to define the label of the images and the voting criteria came from the conventional measurement method [25]. Specifically, we used the major vote among four individuals including two experts of apparel design and merchandising and two individuals trained by the expert in apparel design. The conventional method we used in this paper is based on the relations among four body measurement areas, i.e., shoulder, bust, waist, and hip [13,22,26]. First, the inverted triangle body shape was identified if the shoulders are wider than the hips. Second, the pear body shape was determined when the hips were wider than the shoulders. Third, the hourglass body shape was classified when the width of shoulders and hips were similar, but the waist was significantly smaller. Fourth, the rectangle body shape was determined when the sizes of the shoulder, bust, waist, and hip appear to be similar.
For the homogeneous processing of the body shape detection, we first performed preprocessing techniques including image resizing (Image Resize, Available from: www.mathworks.com/help/images/ref/imresize.html), edge detection, and smoothing on the acquired images using MATLAB (MATLAB 2020, Available from: www.mathworks.com/products/matlab.html). Specifically, the image resizing changes different sizes of images into the same size, i.e., 300 × 600 pixels. To focus on the outer borderline in body shape detection, the edges are detected on the same sized-images using an edge detection algorithm, e.g., Sobel filter [27]. For smoothing, the Gaussian 2D image filter whose filter response at the point (x, y) of the image I is applied and given in Equation (1) [28]:
G σ ( x ,   y ) =   1 2 π σ 2 e x 2 + y 2 2 σ 2 ,
where σ is the standard deviation of the Gaussian distribution. Using the Gaussian filter, the edge detected image is smoothed for noise reduction [29]. The sigma for the Gaussian image filter is taken as σ = 0.5. Figure 3 shows an example of smoothing using the Gaussian filter on one of the body shape images in our database. Specifically, we applied this Gaussian filter with σ = 0.5 to the edge detected image shown in Figure 3a, and Figure 3b shows its smoothing outcome.
In this paper, we considered four types of body shapes: inverted triangle, pear, hourglass, and rectangle shapes. Each category of body shape consists of 20 labeled images. The obtained database was divided into training and testing sets. For validation, both hold-out and leave-one-out approaches were assessed. For the hold-out validation approach, 70% of the total number of images was used to train the model and 30% was used for validation [30] (see Figure 4). Hence, 14 images from each category resulting in 14 × 4 = 56 images were used for training the model. On the other hand, 30% of the data were randomly held out for validation [31]. As a result, the remaining 24 images (six for each category) has been used to validate the model. The leave-one-out method was also assessed where the machine learning model is applied once for each image from the database, using all other images as the training data, and the selected image as a single test image [32]. Therefore, the algorithm was simulated 80 times, each time taking 79 images as training data and remaining image as the testing image, consecutively.

3. Methods

Our proposed method first extracts the feature points from the preprocessed images obtained in Section 2, and then uses the extracted features to classify the images into body shape categories. The feature extraction procedure is described in Section 3.1 and Section 3.2, and the body shape classification procedure is explained in Section 3.3.

3.1. Feature Points Detection

SURF feature points were extracted from the preprocessed images to use them as input for the classifier. We adopted SURF since it is widely used in computer vision [33] due to its faster and more accurate characteristics compared to other methods, such as SIFT [34] and Harris corner detection [35] methods. The SURF feature point extracting procedure consists of the generation of the integral image, the approximation of the Hessian determinant and performing non-maximal suppression [36] as shown in Figure 5.
The integral image was used for the fast calculation of the sum of the pixel values in a given image or a rectangular subset of the given image. The characteristics of the integral image permit the fast computation of box convolution filters [37]. The box filter was used for detecting blobs or finding points of interest in the image [38,39].
Specifically, corners, edges, and blobs required for body shape detection can be found using the box filter. The box filter is interpolated in the scale (the up-scaling filter size, i.e., 9 × 9, 15 × 15, 21 × 21, 27 × 27, etc.). The scale space model is implemented as up-scaling box filters, with a resulted image convoluted with box filters of different sizes, which are shown in Figure 6. Each detected feature point in the range of filter size scales is detected and stored in a feature vector.
The non-maximal suppression is required to localize the most dominant feature in the scale space model. For the localization of feature points, a non-maximum suppression in a 3 × 3 × 3 neighborhood [40] is used to find the local maxima in a (x, y, σ ) space applied at the scale of the detected feature point as shown in Figure 7a. Figure 7b shows the input image with detected feature points using non-maximal suppression.
In this paper, a database of training body images with their corresponding SURF features is formed. Figure 8 shows the strongest 40 feature points (see green points) with corresponding scales (shown in green circles) and orientation which are automatically detected using SURF from an image.
Feature points are the dominant attribute of an image. Particularly, the feature points are the dominant marks on the outline of the preprocessed images of the subjects. However, they do not provide information about the body shape. These feature points are used in the further procedure to extract body shape information and it is explained in Section 3.2 below.

3.2. Bag-of-Features

In our proposed method, the bag-of-features model is utilized to categorize body shape categories. The bag-of-features model is an image patch-based classification method, where most occurring image patches are used to classify an image [41]. The bag-of-features algorithm first obtains image patches from the feature points detected using the SURF algorithm (described in Section 3.1). Then, from the feature points in the training images, we get feature vectors. Balancing the number of features is done across all image categories to improve clustering. Among the categories, the minimum number n of the strongest number of features is chosen to calculate the total number of descriptors using Equation (2):
Number   of   Features = Number   of   Category × n ,
where one of the categories has the least number of strongest descriptors of n.
The descriptors of each feature from all the training image database are then clustered for developing the ‘visual words.’ Each SURF descriptor provides a vector with a length of 64. A total of 500 visual words was obtained, each of which is determined by the center of the clustered feature descriptors in the known category of body shapes (inverted triangle, pear, hourglass, and rectangle) using k-means clustering [32]. In our body detection experiment, the numbers of descriptors and clusters were around 78,000 and 500 words, respectively, and the dimension of each word was 64 [42]. The visual words were then included in a visual dictionary. The number of visual words in the dictionary was taken as an experimental parameter. If the number was too small, visual words would not represent all patches, and if too large, quantization artifacts and overfitting will occur. Figure 9 shows the feature classification of the k-NN algorithm with decision boundaries (feature descriptors are mapped in two dimensions) for all the images of the four types of body shapes in our database.

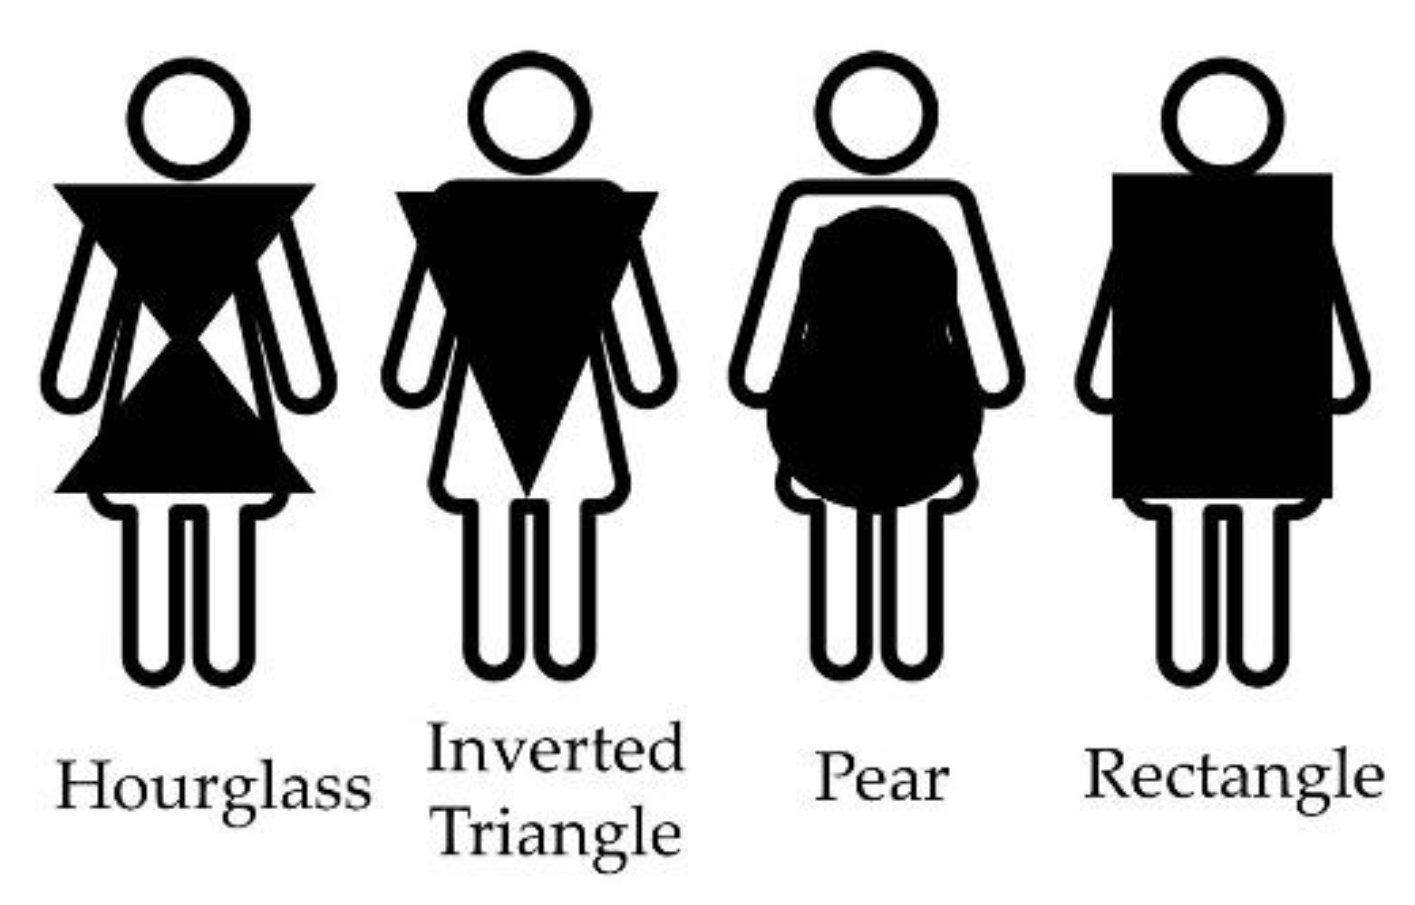
3.3. Body Shape Classification

3.3.1. k-Nearest Neighborhood (k-NN)

The dictionary of visual words was used to classify a subject’s body shape category which is developed from training images. To classify an input image, the proposed method detects and extracts features from the input image and then using the k-nearest neighbor algorithm, constructs a histogram of features for each image with 500 words. The visual words (cluster centers of feature descriptors) are always the same and obtained from all the images. The feature histogram uses the k-NN algorithm to calculate the frequency of occurrence of individual visual words. Equation (3) shows the Euclidean distance equation [43] for error correction for accurate classification using k-NN:
d = i = 1 k ( x i y i ) 2 ,
where k is the number of nearest neighbors, x is the data point, y is the neighboring point and d is the distance. An input image is classified by determining the maximum occurrence of the visual words (feature patches) that corresponds to a specific body shape category. The occurrence of those visual words in that image is calculated using k-NN. Figure 10 shows the histogram of the visual word vocabulary occurring in the input image, with the bar heights corresponding to the frequency of occurrence.
The bag-of-features model provides a method for counting the visual word occurrences in an image by encoding the image into a feature vector. For classification, each input image is assigned the majority class of the k-nearest visual words in the descriptor space, using the Euclidian distance mentioned in Equation (3). The parameter k controls how many of the nearest neighbors vote for the output class. The histogram bins are incremented based on the distance of the feature descriptor to a particular cluster center. The histogram length corresponds to the number of visual words of the dictionary.
The k-nearest neighbor algorithm was trained on our training dataset. The extracted features from the training images were used to develop the feature map. The k-nearest neighbor was calculated using the Euclidian distance from Equation (3). When a new image is obtained, the feature is extracted from the image and mapped on the feature map. The distance is calculated among the adjacent points for the new image. The distance is then sorted, and the k-nearest neighbors are taken. A major voting system was used to classify the new image to one of the four classes. The following block diagram in Figure 11 describes the k-NN algorithm for body shape detection.
For the classification, we considered four different types of body shapes: inverted triangle, pear, hourglass, and rectangle. Hence, a feature point consisting of multiple dimension parameters is then sorted into the specific class that is closest to the visual word following the k-NN rule. In this way, our proposed algorithm detects the body shape.

3.3.2. Convolutional Neural Network (CNN)

The CNN algorithm uses a neural network consisting of input layers, hidden layers, and output layers with a bank of the convolutional filter and pooling operations. CNN applies convolutional filters to an input image to create the feature map of summarized features detected in the input. To reduce dimensionality, a pooling layer was used. Changing the values of weights of the neurons when applied through the neural network enables CNN to differentiate between classes. The block diagram of CNN for body shape detection is given below.
The convolutional layers extract the feature maps using convolution filters, and fully connected layers are used to adjust the weights of a classifier. Here, the Alexnet architecture [44] has been adopted, which has eight layers including s convolutional layers with n depths and m max pooling layers, as shown in Figure 12. The activation function for each node in the fully connected layers is a sigmoid function which is expressed in Equation (4):
σ ( x ) = ( 1 + e x ) 1
where x is the input value and σ ( x ) is the output value between 0 and 1. In each stage, the convolution function is used to extract features, and the activation function is used for classification.
Figure 13 shows the training and testing process of the CNN. In the proposed method, the CNN model was trained on 56 images taken randomly with labels from the database as training data. For each of the input training images, this operation enables updating the weight values of the CNN. For testing, the remaining 24 were taken and validated with the labels.
Figure 14 shows the body shape classification procedure of our proposed CNN algorithm. The trained CNN differentiates the body shapes of input test images, as shown in Figure 14.

4. Results

In our proposed method, k-NN or CNN is adopted for a body shape detection algorithm due to their relatively high accuracy performance. k-NN is a representative of a group of machine learning classifiers which is widely used in classifications in various fields including handwritten digit recognition from images [45] and tumor classification from images [46] and simple in procedure, calculating the Euclidian distance between dataset input images [47]. Both k-NN and CNN are implemented in a computer having Intel (R) CoreTM i5-8250U CPU @ 1.60 GHz (eight CPUs) ~ 1.8 GHz (Intel Corporation, Santa Clara, California, USA) and 8192 MB RAM.
The k-NN was implemented with the input of the bag-of-features model. A minimum of 252,343 features were taken from each category, resulting in a total of 1,009,372 features (252,343 features/category × 4 categories) for the whole database (see Equation (2)). The proposed machine learning method with bag-of-features model and k-NN classifier results in an 87.50% accuracy whereas the support vector machine (SVM) [48] and multilayer perceptron (MLP) [49] delivers 72.17% and 62.50% accuracy, respectively. Therefore, our proposed method performs better in terms of accuracy (17.52% and 28.57% for SVM and MLP, respectively). The accuracy comparison of the proposed method to SVM and MLP is given in Table 1.
Figure 15 shows the prediction accuracy of two body shape categories using the bag-of-features model and k-NN classifier. As shown in Table 2, our classifier detects the inverted triangle and rectangle body shape with 100% accuracy, and the hourglass and pear with 67 and 83% accuracy, respectively, resulting in an overall 87.50% testing accuracy on average. It takes 133.13 s to train the k-NN with the training datasets.
Our simulation results show that the leave-one-out approach gives 88.75% accuracy while the hold-out approach gives 87.50% accuracy. In terms of computational time, the hold-out approach took around 60 times less compared to the leave-one-out approach.
The CNN model developed for body shape detection was trained on the same database. The training procedure uses nine epochs (the number of complete cycles through the training dataset) with a minimum batch size (the number of sample images processed before the model is updated for the next iteration) of six. The initial learning rate, which is the amount that the weights are updated during training as the step size, is taken as 0.0001. As shown in Table 3, the CNN classifier detects an inverted triangle, pear, hourglass, and rectangle body shape with 100% accuracy. It takes 59 s for the CNN to train itself with the training datasets.

5. Discussion

The conventional technology to detect body shapes relies on body measurements. The dimensional body scanning model depends on these characteristics to classify body shapes. For example, the inverted triangle is detected by this scanner when the heaviest part is the upper body, shoulders are wider than hips with the actual measurements [50]. In [22], the body shape detection method based on the parameters of female body measurements is suggested. However, our proposed method does not depend upon body measurements, instead using only the acquired image to detect the body shape. Our proposed method is more convenient as it does not require exact body measurements taken manually from users. Conventional methods have limitations in that incorrect measurements can be taken for body shape detection since the actual measurement is necessary to calculate the body shape, requiring the rigorous measurements of the shoulder, bust, hips and waist of a person. Collecting this measurement information is usually inconvenient and difficult to acquire due to the lack of measurement tools or professional tailor measurement skills. Since there is no universal body measurement table for predicting the body shape of a person, each method relies on different measurement criteria for the parameters for predicting the body shape, which is widely inaccurate [11]. However, our approach is an image processing and machine learning-based method which does not require any measurement input from the user’s perspective and detects the actual body shape from a smartphone camera image. The major vote method [51] was used to assess the label of the subject, i.e., the body shape category. The labels are also supported by the traditional method of measurements [25], introducing repeatability among different observers. Our proposed technology does not rely on any precalculated criteria. The comparative evaluation of the proposed method with the state-of-art methods is presented in Table 4. Hidayati et al. [11] introduced a study on body shape detection and styling using measurements of 3150 female celebrities obtained from a website (www.bodymeasurements.org). The gold standard of the body shape labels was not defined in the paper, rather an unsupervised feature learning method was used by combining different measurements. The intention to use unsupervised learning is to extract the natural grouping of a set of body measurements. Therefore, the clustering of measurement data, e.g., affinity propagation, has been presented as a viable solution for body shape detection. As shown in Table 4, the accuracy of our proposed method is higher than the method proposed by Hidayati et al. [11].

6. Conclusions

In this paper, we proposed an effective method to detect body shapes using a smartphone, which will solve overall fit issues, increase consumer convenience and improve overall online apparel shopping experiences for consumers. Our proposed method has been shown to provide 87.50% accuracy on average in classifying four different body shapes: inverted triangle, pear, hourglass, and rectangle. The proposed methods expect to increase the feasibility of smartphone-based online apparel shopping by providing optimal fit garment suggestions in a more accurate and personalized way [52], which will finally benefit online apparel retailers by increasing their revenue and decreasing returns due to poor fit. The results of this study show the potential contribution to the textile and apparel industry by providing contact-free body shape detection with high accuracy. Further development of the proposed method will generate a model enabling the detection of other body types, incorporating with additional data on other existing body shapes. The next step of this research is to analyze the shape and fit of the garment itself to match this with the body shape detection data, so that it can provide optimal fit garment information for consumers.

7. Limitations and Future Research

There are some limitations of this study which can be explored in the future research. First, we only classified the four body shapes of females. Hence, future research should be conducted for body shapes of males as well as additional body shapes for female, such as the round shape. Second, we used 2D images to determine the body shapes. However, height and side silhouette in addition to front silhouette, which was examined in this paper, can affect the fit issues. Hence, further research of fit detection related to the height and side silhouette is needed. In addition, the examination of body shape detection with a larger sample size can increase the accuracy of the results.

Author Contributions

K.H.F. designed the analysis, developed the software, wrote the original and revised manuscript, and conducted data analysis and details of the work. H.J.C. designed the research experiment, verified data, and conducted statistical analysis. F.B. collected the data and conducted the analysis. J.W.C. conceptualized and designed the research experiment, wrote the original/revised drafts, designed, re-designed, and verified image data analysis, and guided direction of the work. All authors have read and agreed to the published version of the manuscript.

Funding

This research received no external funding.

Institutional Review Board Statement

The study was conducted following the Institutional Review Board (IRB) protocol (IRB2020-482) at Texas Tech University.

Informed Consent Statement

Not applicable.

Data Availability Statement

No new data were created or analyzed in this study. Data sharing is not applicable to this article.

Conflicts of Interest

The authors declare no conflict of interest.

References

  1. Wagner, G.; Schramm-Klein, H.; Steinmann, S. Online retailing across e-channels and e-channel touchpoints: Empirical studies of consumer behavior in the multichannel e-commerce environment. J. Bus. Res. 2020, 107, 256–270. [Google Scholar] [CrossRef]
  2. Ecola, L.; Lu, H.; Rohr, C. How Is COVID-19 Changing Americans’ Online Shopping Habits? RAND Corporation: Santa Monica, CA, USA, 2020. [Google Scholar]
  3. Fashion-Ecommerce. Online Apparel Industry Market US. Available online: https://www.statista.com/statistics/278890/us-apparel-and-accessories-retail-e-commerce-revenue (accessed on 8 December 2020).
  4. Tuunainen, V.K.; Rossi, M. eBusiness in apparel retailing industry-critical issues. In Proceedings of the ECIS 2002, Gdańsk, Poland, 6–8 June 2002; p. 136. [Google Scholar]
  5. De Leeuw, S.; Minguela-Rata, B.; Sabet, E.; Boter, J.; Sigurðardóttir, R. Trade-offs in managing commercial consumer returns for online apparel retail. Int. J. Oper. Prod. Manag. 2016, 36, 710–731. [Google Scholar] [CrossRef]
  6. Dabolina, I.; Silina, L.; Apse-Apsitis, P. Evaluation of Clothing Fit; IOP Publishing: Bristol, UK, 2018; Volume 459, p. 012077. [Google Scholar]
  7. Gunatilake, H.; Hidellaarachchi, D.; Perera, S.; Sandaruwan, D.; Weerasinghe, M. An ICT Based Solution for Virtual Garment Fitting for Online Market Place. Int. J. Inf. Technol. Comput. Sci. 2018, 10, 60–72. [Google Scholar] [CrossRef] [Green Version]
  8. Kim, D.-E.; Labat, K. An exploratory study of users’ evaluations of the accuracy and fidelity of a three-dimensional garment simulation. Text. Res. J. 2012, 83, 171–184. [Google Scholar] [CrossRef]
  9. Petrova, A.; Ashdown, S.P. Three-dimensional body scan data analysis: Body size and shape dependence of ease values for pants’ fit. Cloth. Text. Res. J. 2008, 26, 227–252. [Google Scholar] [CrossRef]
  10. Ashdown, S.P.; Calhoun, E.; Lyman-Clarke, L.; Piller, F.T.; Tseng, M.M. Virtual Fit of Apparel on the Internet: Current Technology and Future Needs. In Handbook of Research in Mass Customization and Personalization; World Scientific Pub Co Pte Lt.: Singapore, 2009; Volume 2, pp. 731–748. [Google Scholar]
  11. Hidayati, S.C.; Hsu, C.-C.; Chang, Y.-T.; Hua, K.-L.; Fu, J.; Cheng, W.-H. What dress fits me best? Fashion recommendation on the clothing style for personal body shape. In Proceedings of the 26th ACM International Conference on Multimedia, Seoul, Korea, 22–26 October 2018; pp. 438–446. [Google Scholar]
  12. Zakaria, N.; Ruznan, W.S. Developing apparel sizing system using anthropometric data: Body size and shape analysis, key dimensions, and data segmentation. In Anthropometry, Apparel Sizing and Design; Elsevier B.V.: Woodhead Publishing: Cambridge, UK, 2020; pp. 91–121. [Google Scholar]
  13. Connell, L.J.; Ulrich, P.V.; Brannon, E.L.; Alexander, M.; Presley, A.B. Body Shape Assessment Scale: Instrument Development Foranalyzing Female Figures. Cloth. Text. Res. J. 2006, 24, 80–95. [Google Scholar] [CrossRef]
  14. Pisut, G.; Connell, L.J. Fit preferences of female consumers in the USA. J. Fash. Mark. Manag. Int. J. 2007, 11, 366–379. [Google Scholar] [CrossRef]
  15. Sattar, H.; Pons-Moll, G.; Fritz, M. Fashion Is Taking Shape: Understanding Clothing Preference Based on Body Shape from Online Sources. In Proceedings of the 2019 IEEE Winter Conference on Applications of Computer Vision (WACV), Waikoloa Village, HI, USA, 7–11 January 2019; pp. 968–977. [Google Scholar]
  16. Bay, H.; Ess, A.; Tuytelaars, T.; Van Gool, L. Speeded-Up Robust Features (SURF). Comput. Vis. Image Underst. 2008, 110, 346–359. [Google Scholar] [CrossRef]
  17. Stanciu, S.G.; Xu, S.; Peng, Q.; Yan, J.; Stanciu, G.A.; Welsch, R.E.; So, P.T.C.; Csucs, G.; Yu, H. Experimenting Liver Fibrosis Diagnostic by Two Photon Excitation Microscopy and Bag-of-Features Image Classification. Sci. Rep. 2014, 4, 1–12. [Google Scholar] [CrossRef] [Green Version]
  18. Amato, G.; Falchi, F.; Gennaro, C. Geometric consistency checks for kNN based image classification relying on local features. In Proceedings of the Fourth International Conference on Similarity Search and Applications, Lipari, Italy, 30 June–1 July 2011; pp. 81–88. [Google Scholar]
  19. Yamashita, R.; Nishio, M.; Do, R.K.G.; Togashi, K. Convolutional neural networks: An overview and application in radiology. Insights Imaging 2018, 9, 611–629. [Google Scholar] [CrossRef] [PubMed] [Green Version]
  20. Vuruskan, A.; Bulgun, E.Y. Identification of female body shapes based on numerical evaluations. Int. J. Cloth. Sci. Technol. 2011, 23, 46–60. [Google Scholar] [CrossRef]
  21. Hu, P.; Kaashki, N.N.; Dadarlat, V.; Munteanu, A. Learning to Estimate the Body Shape Under Clothing from a Single 3D Scan. IEEE Trans. Ind. Inform. 2020, 1. [Google Scholar] [CrossRef]
  22. Devarajan, P.; Istook, C.L. Validation of female figure identification technique (FFIT) for apparel software. J. Text. Appar. Technol. Manag. 2004, 4, 1–23. [Google Scholar]
  23. Manju, B.; Meenakshy, K.; Gopikakumari, R. Prostate Disease Diagnosis from CT Images Using GA Optimized SMRT Based Texture Features. Procedia Comput. Sci. 2015, 46, 1692–1699. [Google Scholar] [CrossRef] [Green Version]
  24. Chong, J.W.; Dao, D.; Salehizadeh, S.M.A.; McManus, D.D.; Darling, C.E.; Chon, K.H.; Mendelson, Y. Photoplethysmograph Signal Reconstruction Based on a Novel Hybrid Motion Artifact Detection–Reduction Approach. Part I: Motion and Noise Artifact Detection. Ann. Biomed. Eng. 2014, 42, 2238–2250. [Google Scholar] [CrossRef]
  25. Yin, L.; Annett-Hitchcock, K. Comparison of body measurements between Chinese and U.S. females. J. Text. Inst. 2019, 110, 1716–1724. [Google Scholar] [CrossRef]
  26. Body Shape Calculator. Available online: https://www.harperloren.com/fashion/calculate-your-body-shape/ (accessed on 16 December 2020).
  27. Vincent, O.; Folorunso, O. A Descriptive Algorithm for Sobel Image Edge Detection. In Proceedings of the 2009 InSITE Conference, Macon, GA, USA, 12–15 June 2009; pp. 97–107. [Google Scholar]
  28. Deng, G.; Cahill, L. An adaptive Gaussian filter for noise reduction and edge detection. In Proceedings of the 1993 IEEE Conference Record Nuclear Science Symposium and Medical Imaging Conference, San Francisco, CA, USA, 31 October–6 November 1993; pp. 1615–1619. [Google Scholar]
  29. Kharlamov, A.; Podlozhnyuk, V. Image Denoising; NVIDIA: Santa Clara, CA, USA, 2007. [Google Scholar]
  30. Sakr, S.; Elshawi, R.; Ahmed, A.; Qureshi, W.T.; Brawner, C.; Keteyian, S.; Blaha, M.J.; Al-Mallah, M.H. Using machine learning on cardiorespiratory fitness data for predicting hypertension: The Henry Ford ExercIse Testing (FIT) Project. PLoS ONE 2018, 13, e0195344. [Google Scholar] [CrossRef] [Green Version]
  31. Hsiao, W.-L.; Grauman, K. ViBE: Dressing for Diverse Body Shapes. In Proceedings of the 2020 IEEE/CVF Conference on Computer Vision and Pattern Recognition (CVPR), Virtual, Seattle, WA, USA, 14–18 June 2020; pp. 11056–11066. [Google Scholar]
  32. Yadav, S.; Shukla, S. Analysis of k-Fold Cross-Validation over Hold-Out Validation on Colossal Datasets for Quality Classification. In Proceedings of the 2016 IEEE 6th International Conference on Advanced Computing (IACC), Bhimavaram, India, 27–28 February 2016; pp. 78–83. [Google Scholar]
  33. Pang, Y.; Li, W.; Yuan, Y.; Pan, J. Fully affine invariant SURF for image matching. Neurocomputing 2012, 85, 6–10. [Google Scholar] [CrossRef]
  34. Lindeberg, T. Scale Invariant Feature Transform. Scholarpedia 2012, 7, 10491. [Google Scholar] [CrossRef]
  35. Mistry, S.; Patel, A. Image stitching using Harris feature detection. Int. Res. J. Eng. Technol. 2016, 3, 2220–2226. [Google Scholar]
  36. Bay, H.; Tuytelaars, T.; Van Gool, L. Surf: Speeded up robust features. In Proceedings of the European Conference on Computer Vision, Graz, Austria, 7–13 May 2006; pp. 404–417. [Google Scholar]
  37. Derpanis, K.G. Integral image-based representations. Dep. Comput. Sci. Eng. York Univ. Pap. 2007, 1, 1–6. [Google Scholar]
  38. Teke, M.; Temizel, A. Multi-spectral Satellite Image Registration Using Scale-Restricted SURF. In Proceedings of the 2010 20th International Conference on Pattern Recognition, Istanbul, Turkey, 23–26 August 2010; pp. 2310–2313. [Google Scholar]
  39. Fragoso, V.; Srivastava, G.; Nagar, A.; Li, Z.; Park, K.; Turk, M. Cascade of Box (CABOX) Filters for Optimal Scale Space Approximation. In Proceedings of the 2014 IEEE Conference on Computer Vision and Pattern Recognition Workshops, Columbus, OH, USA, 24–27 June 2014; pp. 126–131. [Google Scholar]
  40. Sledevic, T.; Serackis, A. SURF algorithm implementation on FPGA. In Proceedings of the 2012 13th Biennial Baltic Electronics Conference, Tallinn, Estonia, 3–5 October 2012; pp. 291–294. [Google Scholar]
  41. Arora, G.; Dubey, A.K.; Jaffery, Z.A.; Rocha, A. Bag of feature and support vector machine based early diagnosis of skin cancer. Neural Comput. Appl. 2020, 1–8. [Google Scholar] [CrossRef]
  42. Mukherjee, J.; Mukhopadhyay, J.; Mitra, P. A survey on image retrieval performance of different bag of visual words indexing techniques. In Proceedings of the 2014 IEEE Students’ Technology Symposium, Kharagpur, India, 28 February–2 March 2014; pp. 99–104. [Google Scholar]
  43. Hu, L.-Y.; Huang, M.-W.; Ke, S.-W.; Tsai, C.-F. The distance function effect on k-nearest neighbor classification for medical datasets. SpringerPlus 2016, 5, 1–9. [Google Scholar] [CrossRef] [PubMed] [Green Version]
  44. Alom, M.Z.; Taha, T.M.; Yakopcic, C.; Westberg, S.; Sidike, P.; Nasrin, M.S.; Van Esesn, B.C.; Awwal, A.A.S.; Asari, V.K. The history began from alexnet: A comprehensive survey on deep learning approaches. arXiv 2018, arXiv:1803.01164 2018. [Google Scholar]
  45. Makkar, T.; Kumar, Y.; Dubey, A.K.; Rocha, Á.; Goyal, A. Analogizing time complexity of KNN and CNN in recognizing handwritten digits. In Proceedings of the 2017 Fourth International Conference on Image Information Processing (ICIIP), Shimla, India, 21–23 December 2017; pp. 1–6. [Google Scholar]
  46. Rani, K.V.; Jawhar, S.J. Novel Technology for Lung Tumor Detection Using Nanoimage. IETE J. Res. 2019, 1–15. [Google Scholar] [CrossRef]
  47. Liu, F.; Yang, S.; Ding, Y.; Xu, F. Single sample face recognition via BoF using multistage KNN collaborative coding. Multimed. Tools Appl. 2019, 78, 13297–13311. [Google Scholar] [CrossRef]
  48. Noble, W.S. What is a support vector machine? Nat. Biotechnol. 2006, 24, 1565–1567. [Google Scholar] [CrossRef]
  49. Ruck, D.W.; Rogers, S.K.; Kabrisky, M. Feature selection using a multilayer perceptron. J. Neural Netw. Comput. 1990, 2, 40–48. [Google Scholar]
  50. Istook, C.L. Female figure identification technique (ffit) for apparel part I: Describing female shapes. J. Text. Appar. Technol. Manag. 2004, 4, 1–16. [Google Scholar]
  51. Tabei, F.; Zaman, R.; Foysal, K.H.; Kumar, R.; Kim, Y.; Chong, J.W. A novel diversity method for smartphone camera-based heart rhythm signals in the presence of motion and noise artifacts. PLoS ONE 2019, 14, e0218248. [Google Scholar] [CrossRef] [PubMed] [Green Version]
  52. Saarijärvi, H.; Sutinen, U.-M.; Harris, L.C. Uncovering consumers’ returning behaviour: A study of fashion e-commerce. Int. Rev. Retail. Distrib. Consum. Res. 2017, 27, 284–299. [Google Scholar] [CrossRef]
Figure 1. Four common body shapes for female.
Electronics 10 00097 g001
Figure 2. Our proposed body shape detection method which uses image processing and machine learning algorithms with our database. The proposed detection method first trains itself with training images (see (a) Training), and then the trained machine predicts the body shapes of unknown input images (see (b) Prediction).
Electronics 10 00097 g002
Figure 3. (a) The edge detected image, and (b) Gaussian smoothed image with σ = 0.5.
Electronics 10 00097 g003
Figure 4. Training and validation datasets: 30% of the data were held out for validation.
Electronics 10 00097 g004
Figure 5. Block diagram of the SURF feature point detection. The SURF feature point extracting procedure consists of the generation of an integral image, the approximation of Hessian determinant, and performing non-maximal suppression [36].
Electronics 10 00097 g005
Figure 6. Scale invariance due to scale space model. The box type convolution filters are upscaled. The filtered images are given. Size of the box filters 9 × 9, 15 × 15 and 21 × 21 are applied.
Electronics 10 00097 g006
Figure 7. Non-maximal suppression in a neighborhood of 26 points: (a) the detected feature point is in the center, and their corresponding scale space model, and (b) the input image with the detected feature points.
Electronics 10 00097 g007
Figure 8. SURF feature points detected (shown as green colored dots) from a sample input image. The neighborhoods of feature points are drawn by green circles.
Electronics 10 00097 g008
Figure 9. The k-nearest neighbor algorithm for body shape classification. The bag-of-features descriptors are mapped in 2 dimensions in the figure, each cluster center pointing to one visual word using k-means clustering, and the k-nearest neighbor is used for generating the histogram of visual words.
Electronics 10 00097 g009
Figure 10. (a) Input image of body shape hourglass, (b) histogram of visual words occurrence for the input image with a vocabulary of 500 visual words with 3 most frequently occurring visual words, and (c) the location of the 3 visual words occurring in the input image (index and location marked in the input image). Note that the maximum occurrence of visual words corresponding to a body shape classifies the image to that category.
Electronics 10 00097 g010
Figure 11. The k-nearest neighbor block diagram for classifying body shape.
Electronics 10 00097 g011
Figure 12. Training procedure of convolutional neural network (CNN).
Electronics 10 00097 g012
Figure 13. Training and testing procedure of the CNN model using the acquired database.
Electronics 10 00097 g013
Figure 14. The convolutional neural network for body shape detection. The convolution layers are obtained by subsampling and pooling, and the fully connected layer classifies the input image.
Electronics 10 00097 g014
Figure 15. Prediction accuracy for the example of 2 body shape types using k-NN classifier with bag-of-features: (a) inverted triangle and (b) hourglass.
Electronics 10 00097 g015
Table 1. Comparative analysis of the accuracy of the proposed method support vector machine (SVM) and multilayer perceptron (MLP).
MethodAccuracy
SVM72.17%
MLP62.50%
Proposed Method87.50%
Table 2. Confusion matrix for the classification of 4 body shapes using the k-NN classifier with the bag-of-features.
Confusion MatrixPredicted Class
Inverted Triangle PearHourglass Rectangle
Actual ClassInverted Triangle 100%0%0%0%
Pear 17%83%0%0%
Hourglass 33%0%67%0%
Rectangle0%0%0%100%
Table 3. Confusion matrix for the classification of 4 body shapes using the CNN model.
Confusion MatrixPredicted Class
Inverted Triangle PearHourglass Rectangle
Actual ClassInverted Triangle 100%0%0%0%
Pear 0%100%0%0%
Hourglass 0%0%100%0%
Rectangle0%0%0%100%
Table 4. Comparison of the proposed method with the conventional method.
CriteriaHidayati et al. [11]Proposed Method with Bag-of-Features Model and k-NNProposed Method (CNN)
Body Shape Detection AlgorithmMeasurement Based on Combination of CriteriaImage Processing and Machine LearningImage Processing and Deep Learning
Requires Exact MeasurementYesNoNo
Testing Accuracy76.83%87.5%100%
Publisher’s Note: MDPI stays neutral with regard to jurisdictional claims in published maps and institutional affiliations.

