Review

Sub-THz and THz SiGe HBT Electrical Compact Modeling

by
Bishwadeep Saha
1,2,
Sebastien Fregonese
1,
Anjan Chakravorty
2,
Soumya Ranjan Panda
1,2 and
Thomas Zimmer
1,*
1
CNRS UMR 5218, IMS Laboratory, University of Bordeaux, 33400 Talence, France
2
Department of Electrical Engineering, Indian Institute of Technology Madras (IIT Madras), Chennai 600036, India
*
Author to whom correspondence should be addressed.
Electronics 2021, 10(12), 1397; https://doi.org/10.3390/electronics10121397
Submission received: 12 May 2021 / Revised: 4 June 2021 / Accepted: 7 June 2021 / Published: 10 June 2021
(This article belongs to the Section Microelectronics)

Abstract

:
From the perspectives of characterized data, calibrated TCAD simulations and compact modeling, we present a deeper investigation of the very high frequency behavior of state-of-the-art sub-THz silicon germanium heterojunction bipolar transistors (SiGe HBTs) fabricated with 55-nm BiCMOS process technology from STMicroelectronics. The TCAD simulation platform is appropriately calibrated with the measurements in order to aid the extraction of a few selected high-frequency (HF) parameters of the state-of-the-art compact model HICUM, which are otherwise difficult to extract from traditionally prepared test-structures. Physics-based strategies of extracting the HF parameters are elaborately presented followed by a sensitivity study to see the effects of the variations of HF parameters on certain frequency-dependent characteristics until 500 GHz. Finally, the deployed HICUM model is evaluated against the measured s-parameters of the investigated SiGe HBT until 500 GHz.

1. Introduction

The silicon-germanium heterojunction bipolar transistor (SiGe HBT) is one of the key contenders in millimeter wave, high frequency and wireless circuit applications for its unique and mature demand fulfillment capabilities in process integration and yield [1,2]. In terms of performance, cost and functional integration, BiCMOS technology is superior to the CMOS technology and finds commercial applications in automotive, radar and optical communication and is expected to cover sixth-generation (6G) networks [3]. State-of-the-art high-speed SiGe HBTs fabricated with 130 nm and 55 nm BiCMOS technology can deliver f T / f M A X / B V C E 0 /gate delay of 505 GHz/720 GHz/1.6 V/1.34 ps [4] and 325 GHz/375 GHz/1.5 V/2.34 ps [5], respectively. Moreover, additional studies reveal that the expected f T / f M A X values are heading towards the THz frequency range [6,7].
Designing very high frequency circuits using these SiGe HBTs requires physics-based reliable compact models of such devices including the non-trivial high-frequency effects in order to ensure first pass success and thus save overall fabrication cost and time. An accurate high-frequency model demands a very accurate quasi-static model including the dc and junction capacitances of the internal transistor that determine the fundamental behavior of the transistor. As the frequency of operation increases and reaches near the cut-off frequency ( f T ), the vertical non-quasi-static (VNQS) effects begin to influence the frequency-dependent small-signal and transient large-signal characteristics due to the delay in the response of the stored minority charge. Such delays are observed at the input (Input NQS effect) as well as at the output (output NQS effect) dynamic (high frequency or fast transient) characteristics. Other than these VNQS effects, the holes in the base of n-p-n SiGe HBT experience a delay while laterally traveling through the internal base region due to a finite voltage drop across them. The dc counterpart of this effect is the so-called emitter current crowding and is known as the ac current crowding or lateral NQS (LNQS) effect in the high-frequency operation. Along with these NQS effects, high-frequency effects can also be dominated by the parasitic base-emitter (BE) and base-collector (BC) capacitances and their accurate partitioning between the internal and external components, which are not precisely investigated so far. In this paper, we attempt to present a deeper investigation of the very high frequency behavior of a modern SiGe HBT through actual measurements, TCAD simulation and a state-of-the-art industry-standard compact model, HICUM. HICUM incorporates the input and output NQS effects considering delay times for excess stored charge (using a C-R subcircuit) and transfer current (using an LCR subcircuit), respectively [8,9,10]. Modeling LNQS effect involves 2-D current flow at the high-frequency regime [11]. In HICUM, a parallel RC (C R B i in parallel to R B i ) network has been considered to cater the small-signal LNQS effect. It was also found out that a multi-transistor network can accurately model the LNQS effect [12] although it is not preferred in compact model implementation. Instead, a two-section model [13] employing charge partitioning across the internal base resistance (R B i ) shows results with comparable accuracy in the small- as well as large-signal domain. However, in most of the reported results, the model comparison is done either with only TCAD simulation or with actual data measured at not so high frequency. In this paper, we attempt to demonstrate the efficacy of the state-of-the-art SiGe HBT model, HICUM, not only with calibrated TCAD simulation, but also with high frequency de-embedded measured data until 500 GHz.
This paper is organized as follows. In Section 2, we describe the measurement techniques, TCAD device calibration and quasi-static modeling using HICUM. High-frequency model related parameter extraction is presented in Section 3 including the sensitivity analysis of the parameters. In Section 4, we present the very high frequency modeling results until 500 GHz. Finally, we conclude in Section 5.

2. Measurement Setup, TCAD Calibration and Quasi-Static Modeling

In this work, the device under investigation is a SiGe HBT fabricated in 55 nm self-aligned trench isolated BiCMOS process from ST Microelectronics [5]. Measurements up to 500 GHz have been carried out using four different measurement benches. First, we used an E8361A Vector Network Analyzer (VNA) from Agilent working up to 110 GHz and using extenders (N5260-60003) above 67 GHz. Then, for the different frequency bands 140–220 GHz, 220–330 GHz and 325–500 GHz, measurements were carried out with a four port Rohde and Schwarz ZVA24 VNA, coupled with Rohde and Schwarz VNA extenders (ZC220-ZC330-ZC500). Figure 1a shows a block diagram of the 140 GHz to 500 GHz measurement set-up. The extenders are installed on a PM8 Cascade probe station. Figure 1b shows a photograph of the probe station for the 140 GHz to 500 GHz measurements. The power level is approximately set to less than −32 dBm at the output of the mmW head in the four bands for the measurement of active and passive elements. The probes used in this work are Picoprobe with a 50 µm pitch (GGB industries) in each frequency band except below 110 GHz where the probes have a 100 µm pitch. We then applied an on-wafer TRL calibration with an impedance correction based on [14] followed by a short-open de-emebedding. The reference plane of the TRL has been moved horizontally as close as possible to the vias to which the transistor is connected. Indeed, this procedure allows suppressing the distributed behavior of the de-embedding structures by eliminating the contribution of the access line. The RF measurement setup is utilized for both dc and s-parameter characterization following state-of-the-art calibration and de-embedding techniques [15,16].
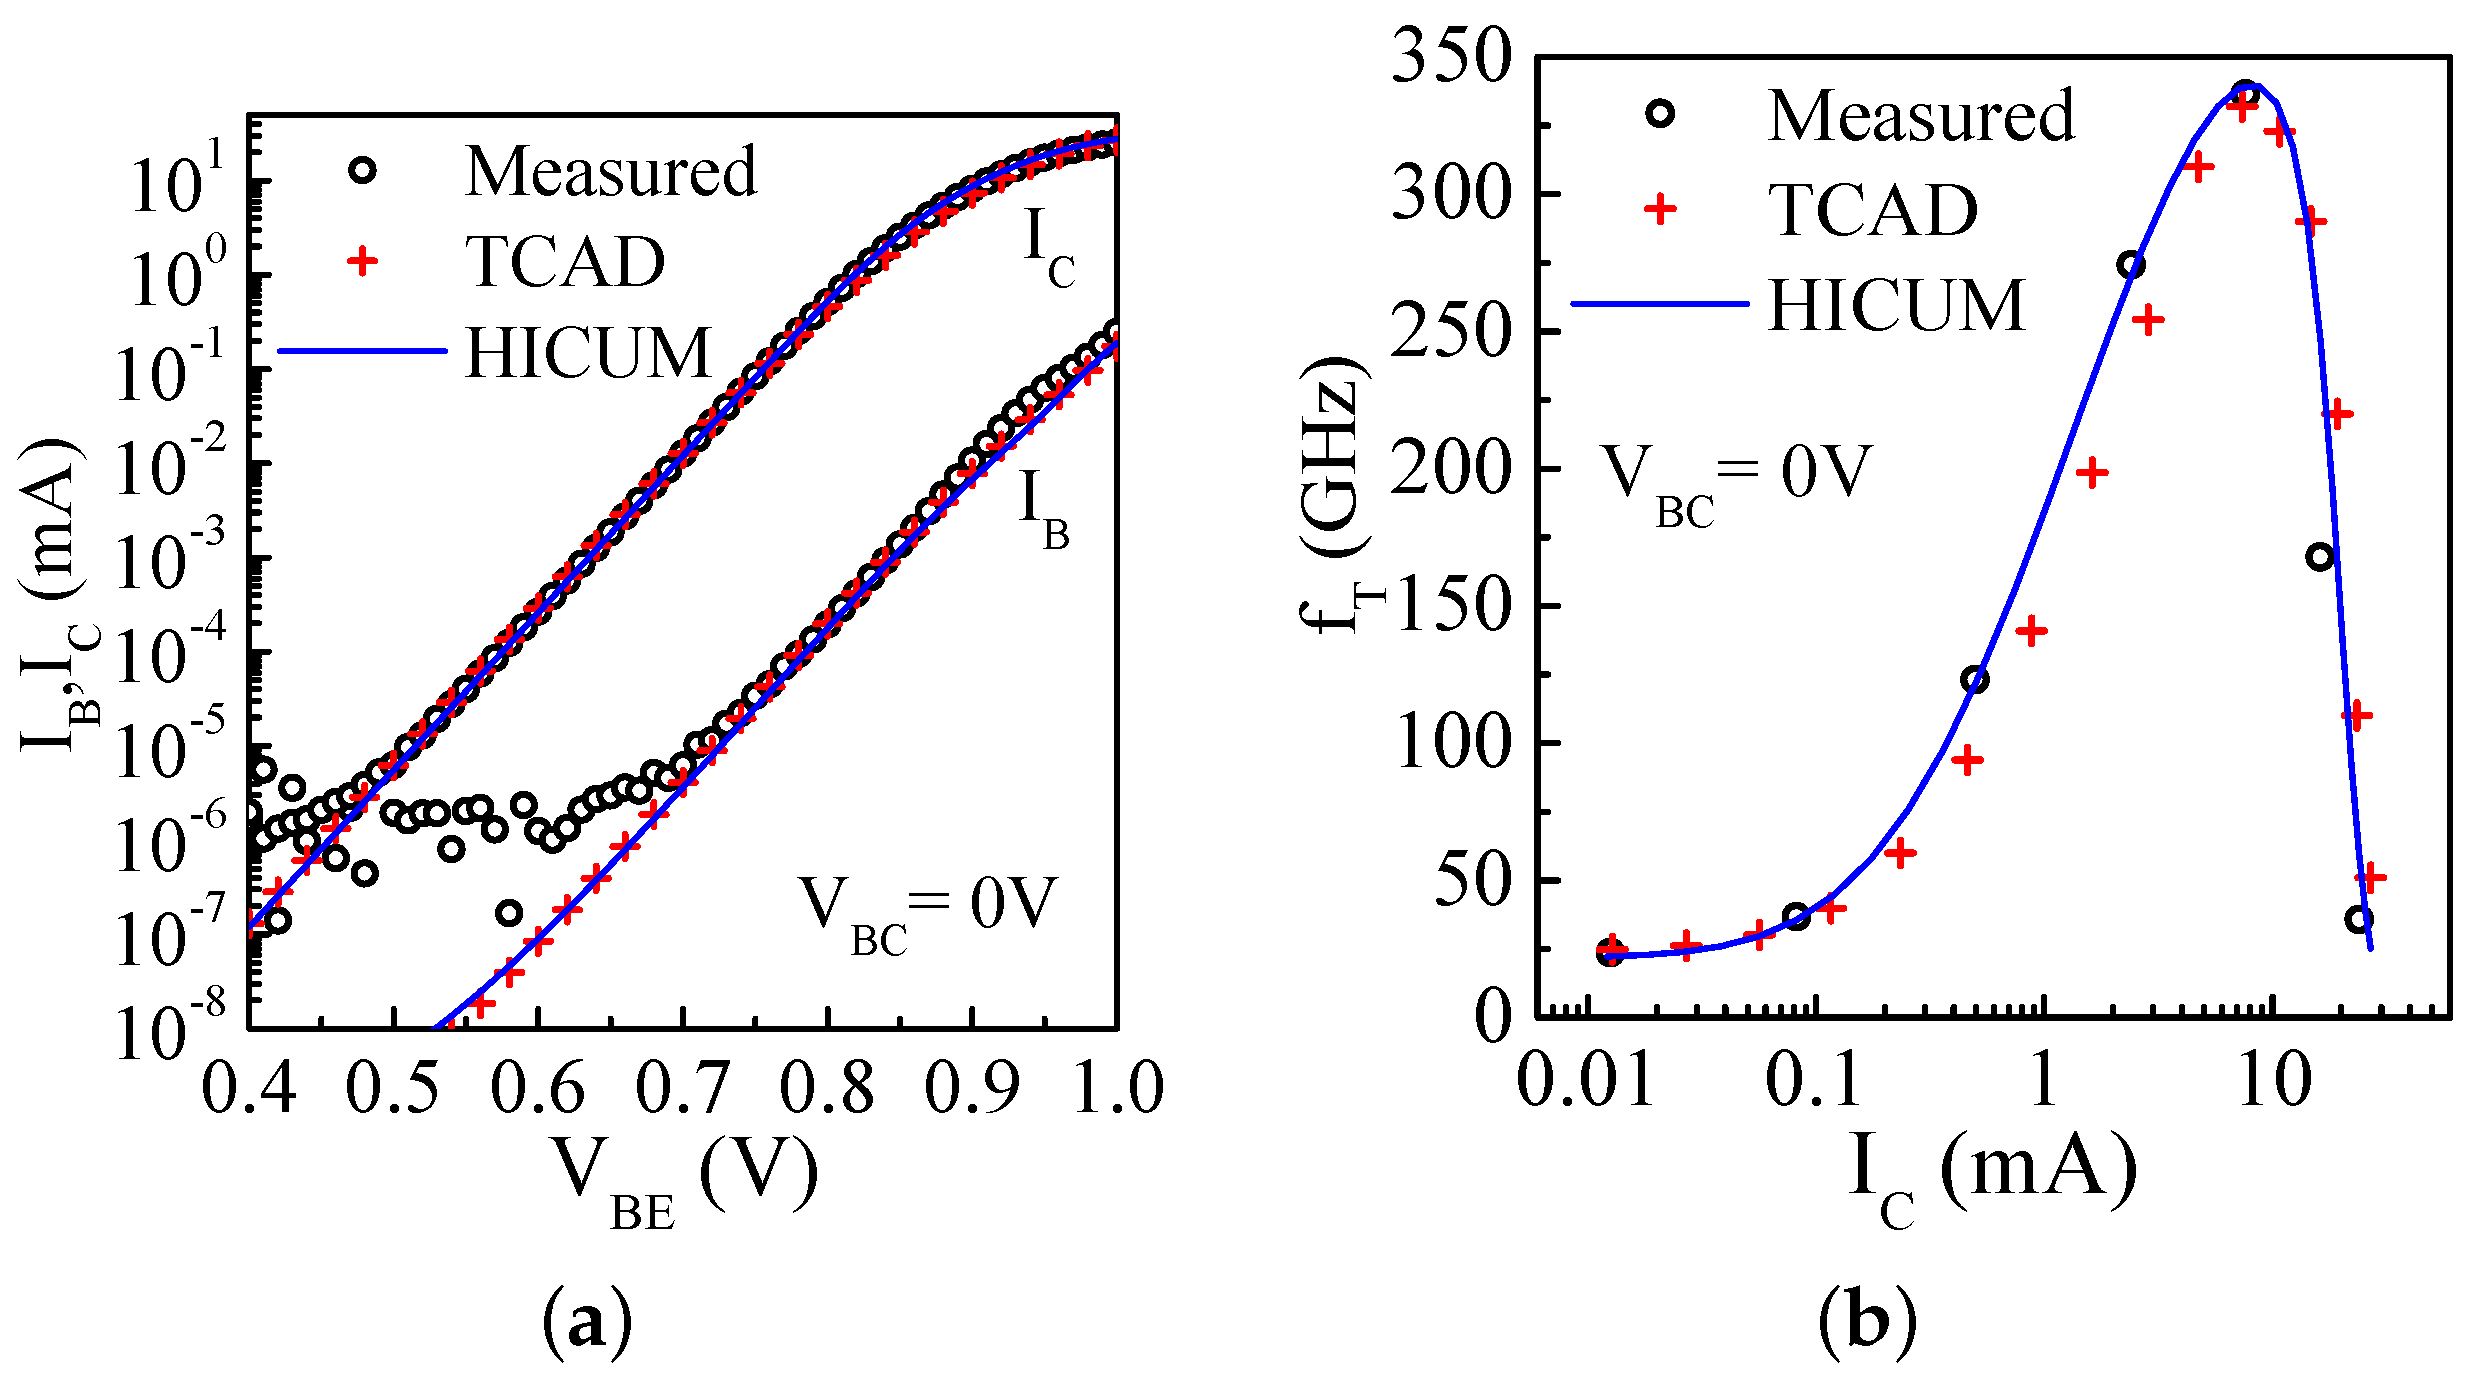
For a detailed TCAD simulation with appropriate calibration, the device doping and layout information extracted in [18] and presented in Table 1 are used. Following the TEM captured device structure and geometry [19] (Figure 2a), a corresponding device structure has been designed in Sentaurus TCAD [20] (Figure 2b). The suitable meshing and corresponding adjustment in TCAD model parameters have already been performed in [20]. Figure 3a,b demonstrate a highly accurate TCAD device calibration with measured data via base-emitter voltage ( V B E ), dependent base ( I B ) and collector currents ( I C ) (i.e., Gummel plot), and I C -dependent f T characteristics, respectively.
Prior to investigating the high-frequency behavior of HICUM, we extract the dc and low-frequency model parameters including the junction capacitances using the extraction schemes reported in [21,22,23]. Quasi-static simulation of the HICUM model is carried out using the latest HICUM verilog-A code in Cadence. In Figure 3, we also present the high level of model agreement for HICUM with already calibrated TCAD simulation and measured data for Gummel and transit frequency characteristics. We have additionally used TCAD to benchmark the quasi-static HICUM model at this level in order to facilitate a more in-depth investigation and extraction of HICUM model specific parameters from the TCAD simulation in the subsequent sections.

3. High-Frequency Model Parameter Estimation

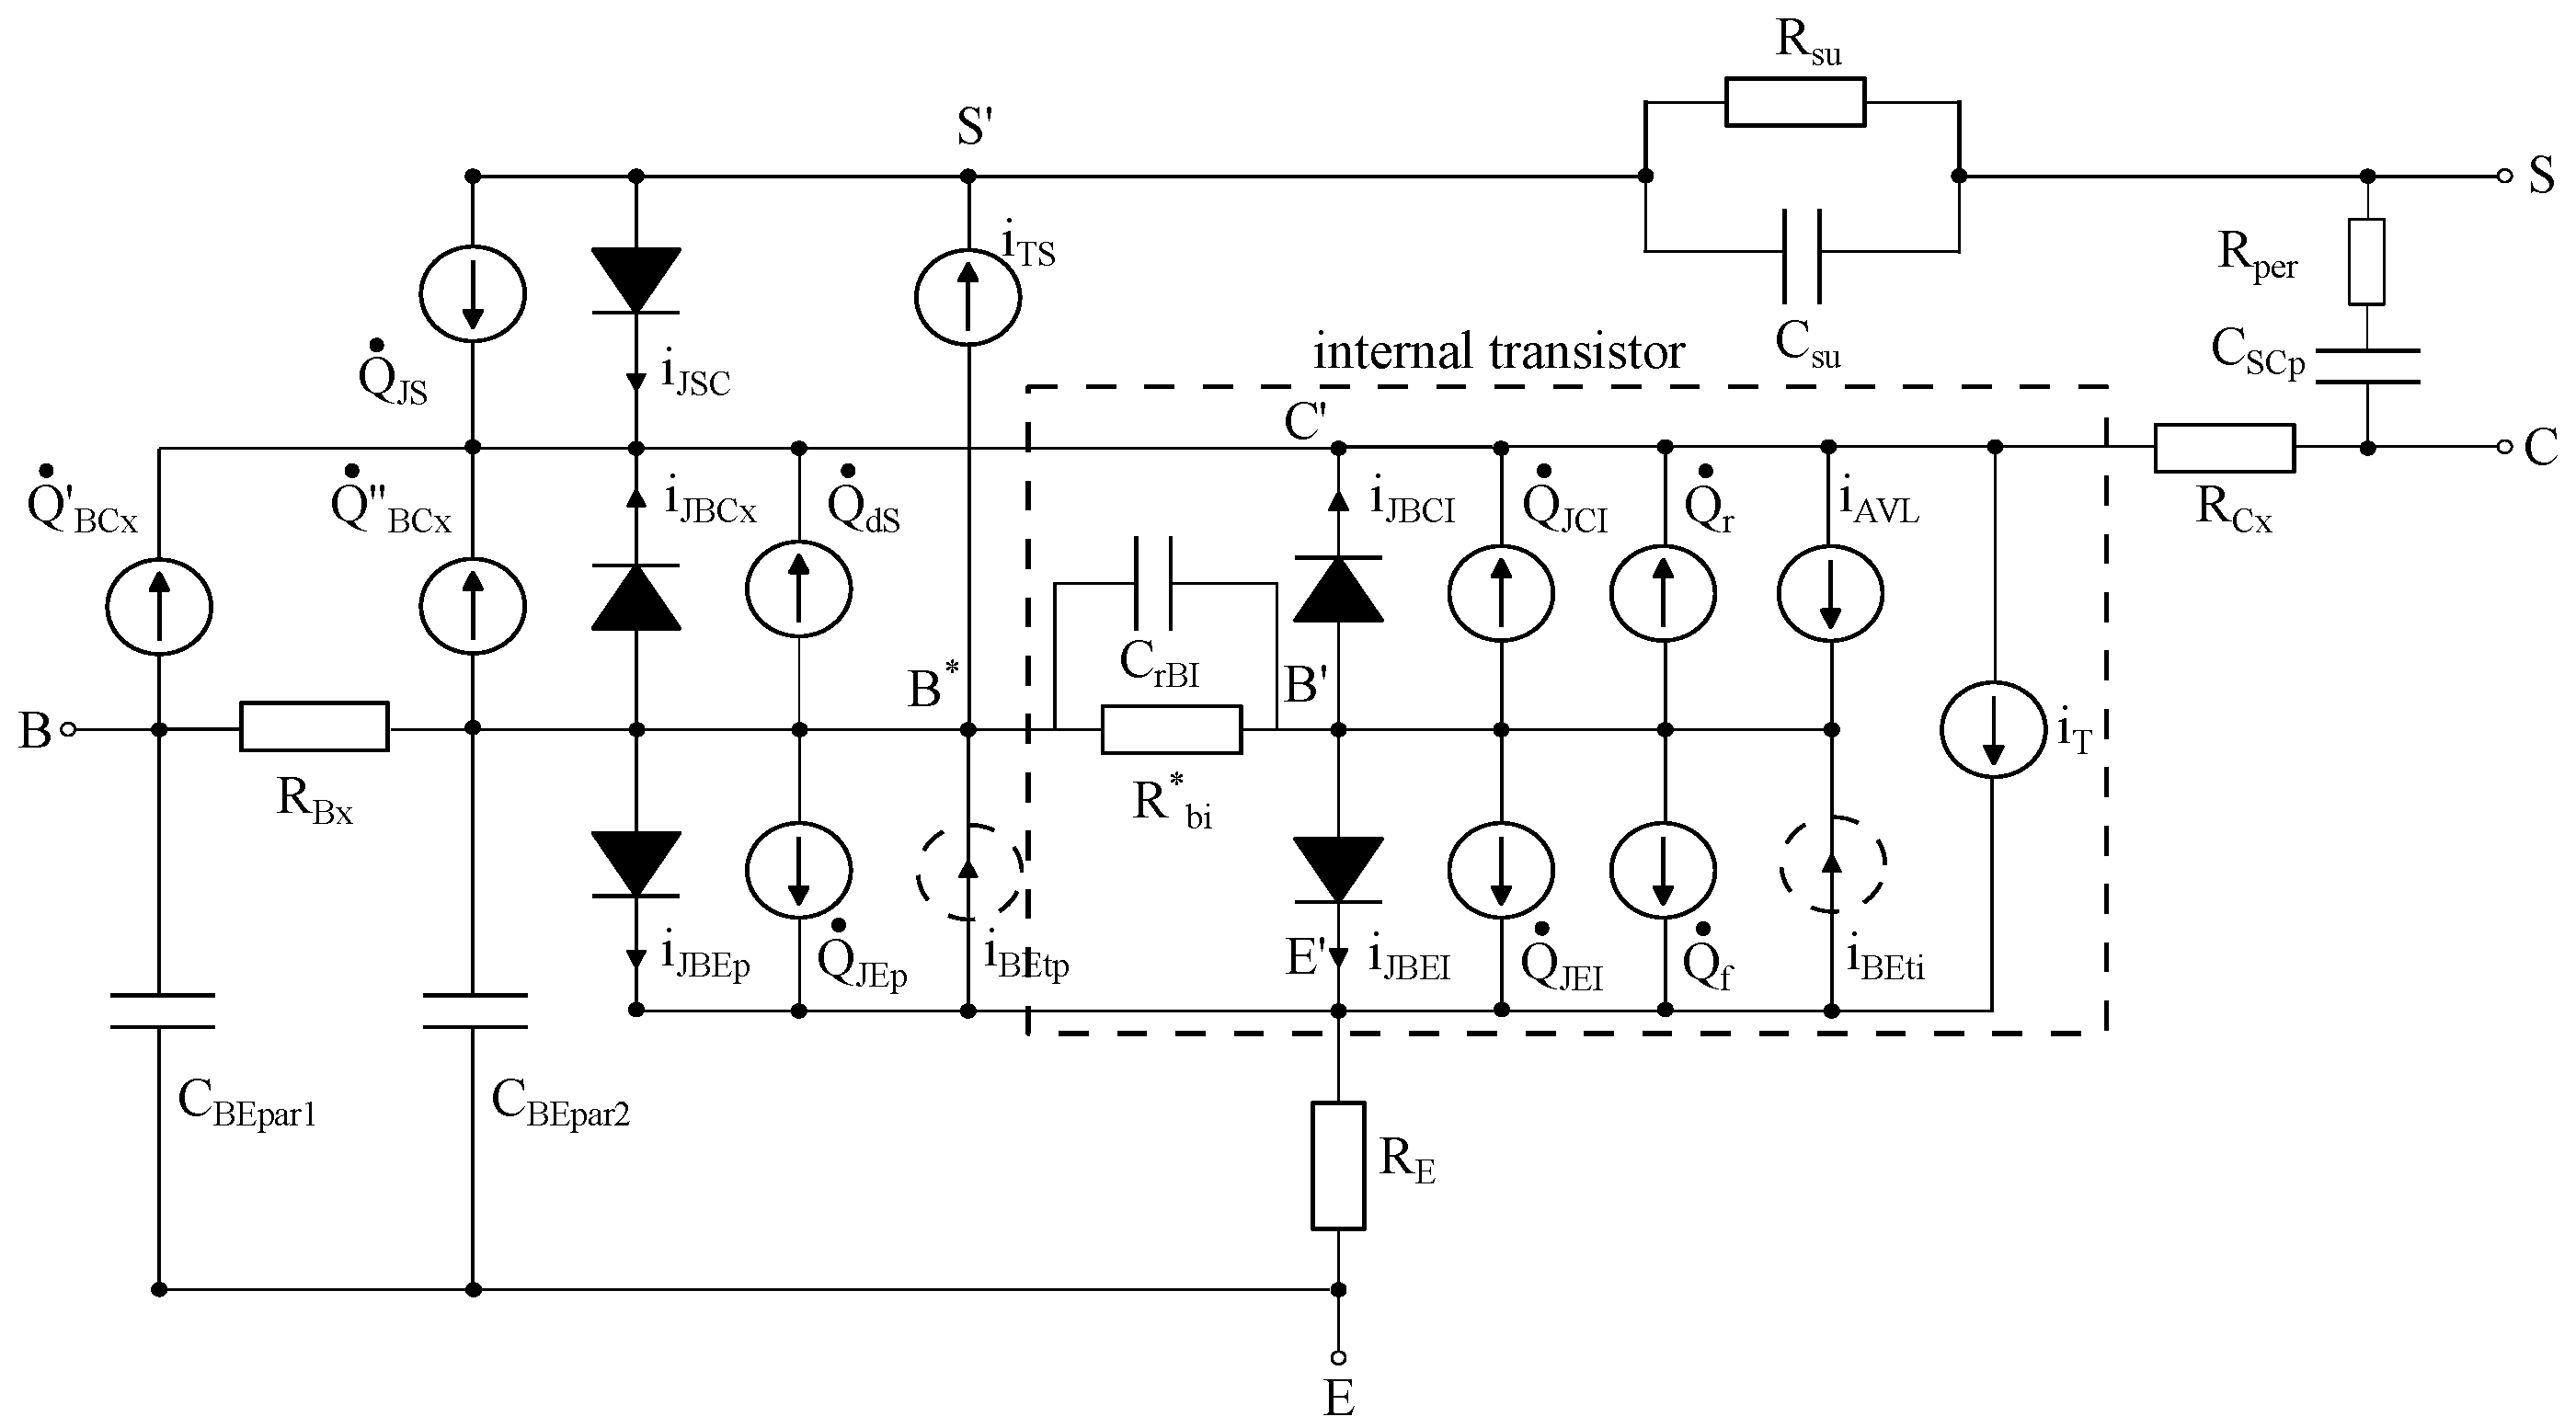
Figure 4 shows the equivalent circuit of the bipolar transistor compact model, HICUM [24]. The circuit elements within the dashed box represent the internal transistor and the remaining ones are used to capture the external and parasitic components. Most of the elements in the equivalent circuit are implemented using appropriate model equations derived from a physical basis. In order to customize the HICUM model for a given transistor fabricated in specific technology, one has to extract the parameters associated with each model equation. Except for a few parameters responsible for the accurate prediction of high-frequency behavior of SiGe HBTs, HICUM extraction strategies are well documented and reported in the literature [23,25]. These outlier sets of a few parameters are related to the vertical (alit, alqf) and lateral NQS effects (fcrbi) as well as BE and BC parasitic capacitance partitioning factors (fbepar, fbcpar). Extraction of these five parameters is not straightforward and mostly certain (manual or automatic) optimization procedures are followed to determine their values. We took the help of TCAD, as described in the following subsections, in order to obtain physically reliable parameter values.

3.1. Parasitic Capacitance Parameters

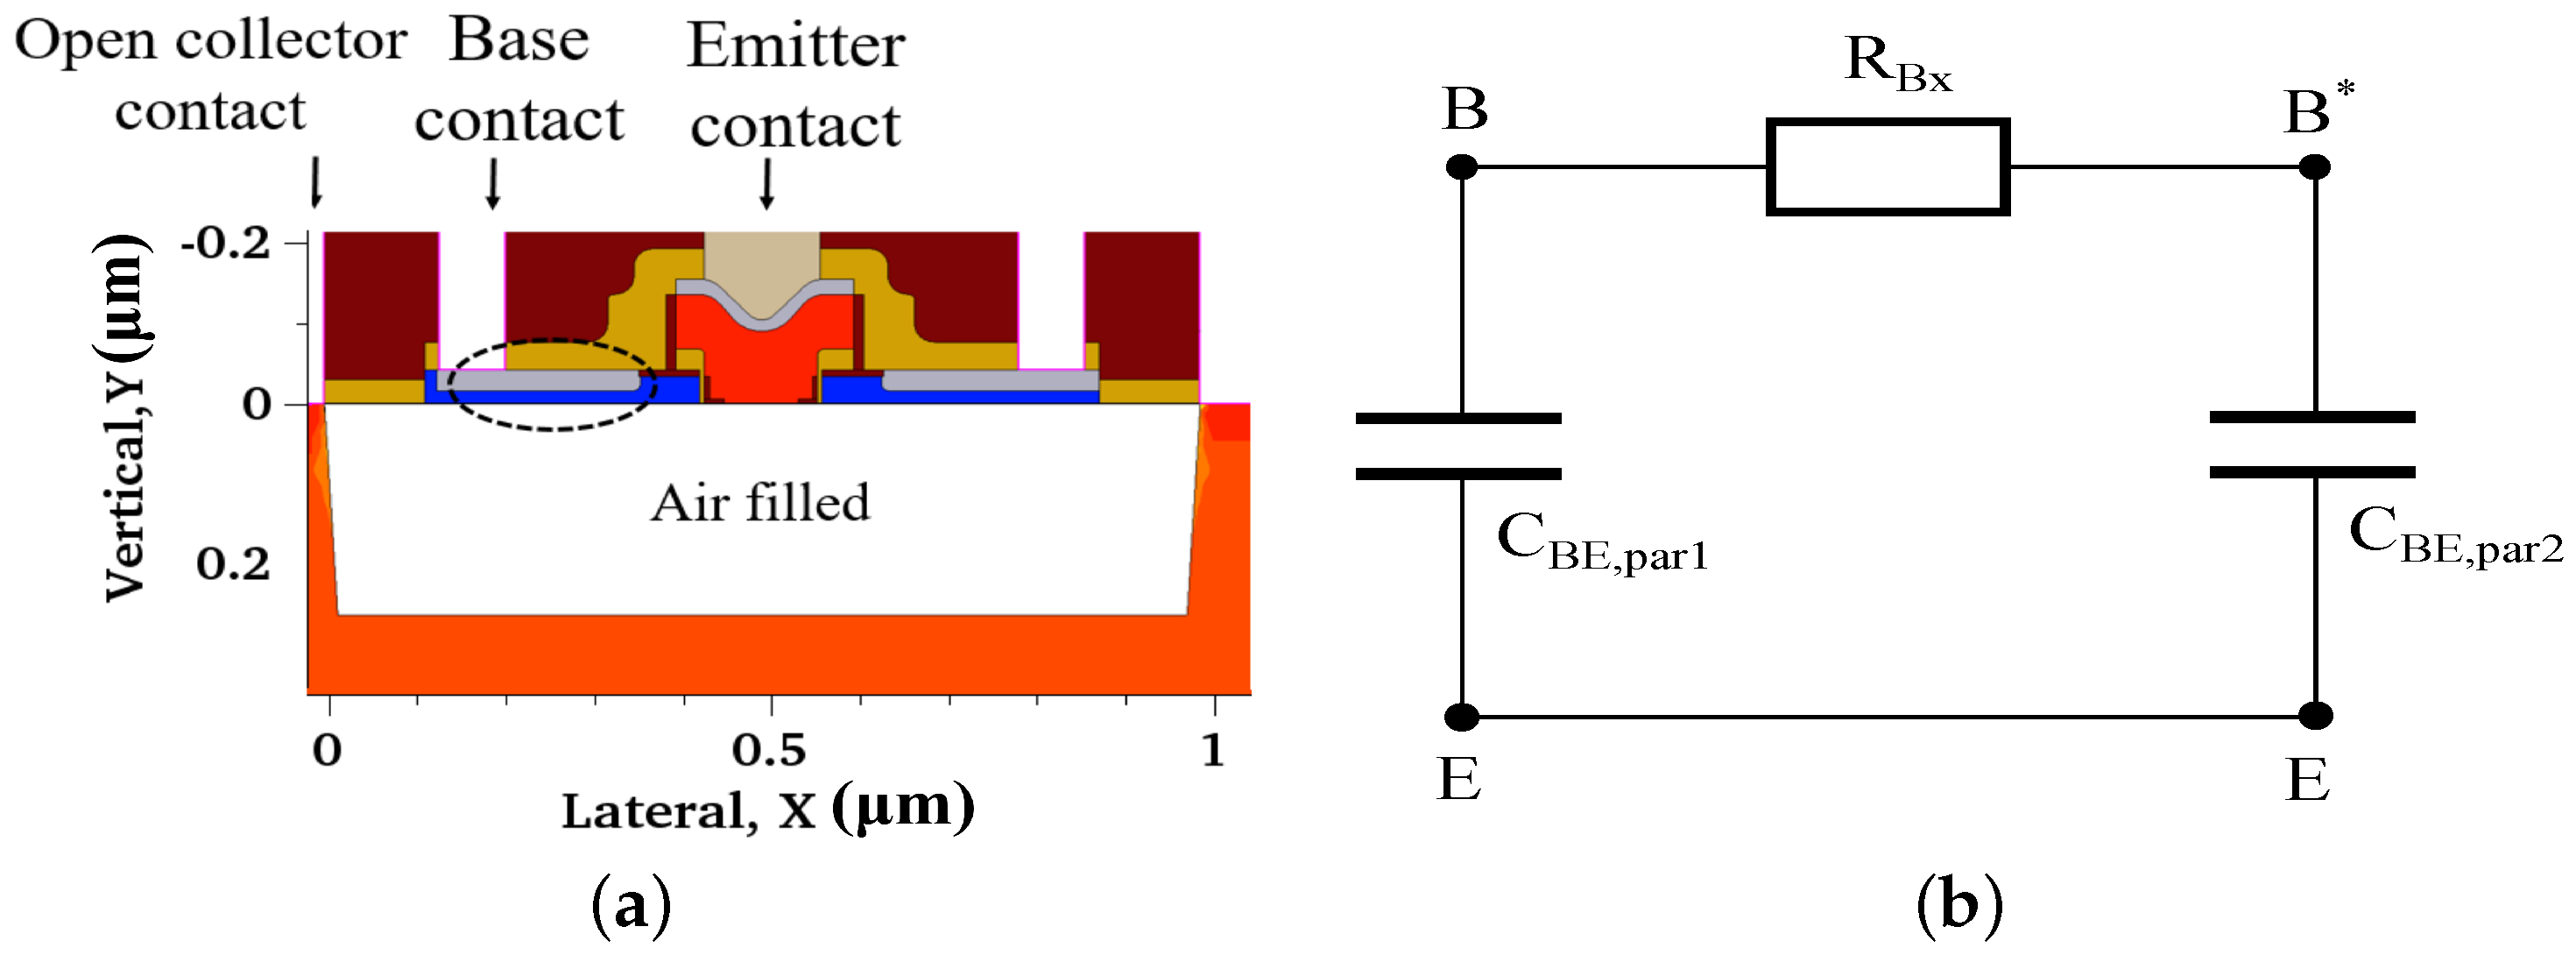
The parasitic capacitances are to be minimized in order to obtain desired transistor behavior [26]. In a given device geometry, there are mainly two types of parasitic capacitances associated with the SiGe HBTs, namely BE and BC parasitic capacitances (C B E , p a r and C B C , p a r ). From the TCAD structure, we have extracted the HICUM base-emitter (fbepar) and base-collector partitioning factors (fbcpar) for C B E , p a r and C B C , p a r . To determine fbepar associated with C B E , p a r , we have considered the structure shown in Figure 5a and simulated at V B E = 0 V keeping the collector terminal open. Note that here the structural portion corresponding to the shallow trench, epi-collector and internal transistor region have been removed and replaced by air with a dielectric constant, ϵ = 1. Hence, the impacts of these regions on the transistor characteristics are absent leaving behind only the effects of C B E , p a r along with the external base resistance R B x as shown in the equivalent circuit of Figure 5b. The effective C B E , p a r obtained from the simple RC network from base to emitter terminal becomes frequency-dependent and can be expressed as
C B E , p a r , e f f = ( C 1 + C 2 ) + ω 2 C 1 C 2 2 R B x 2 1 + ω 2 C 2 2 R B x 2
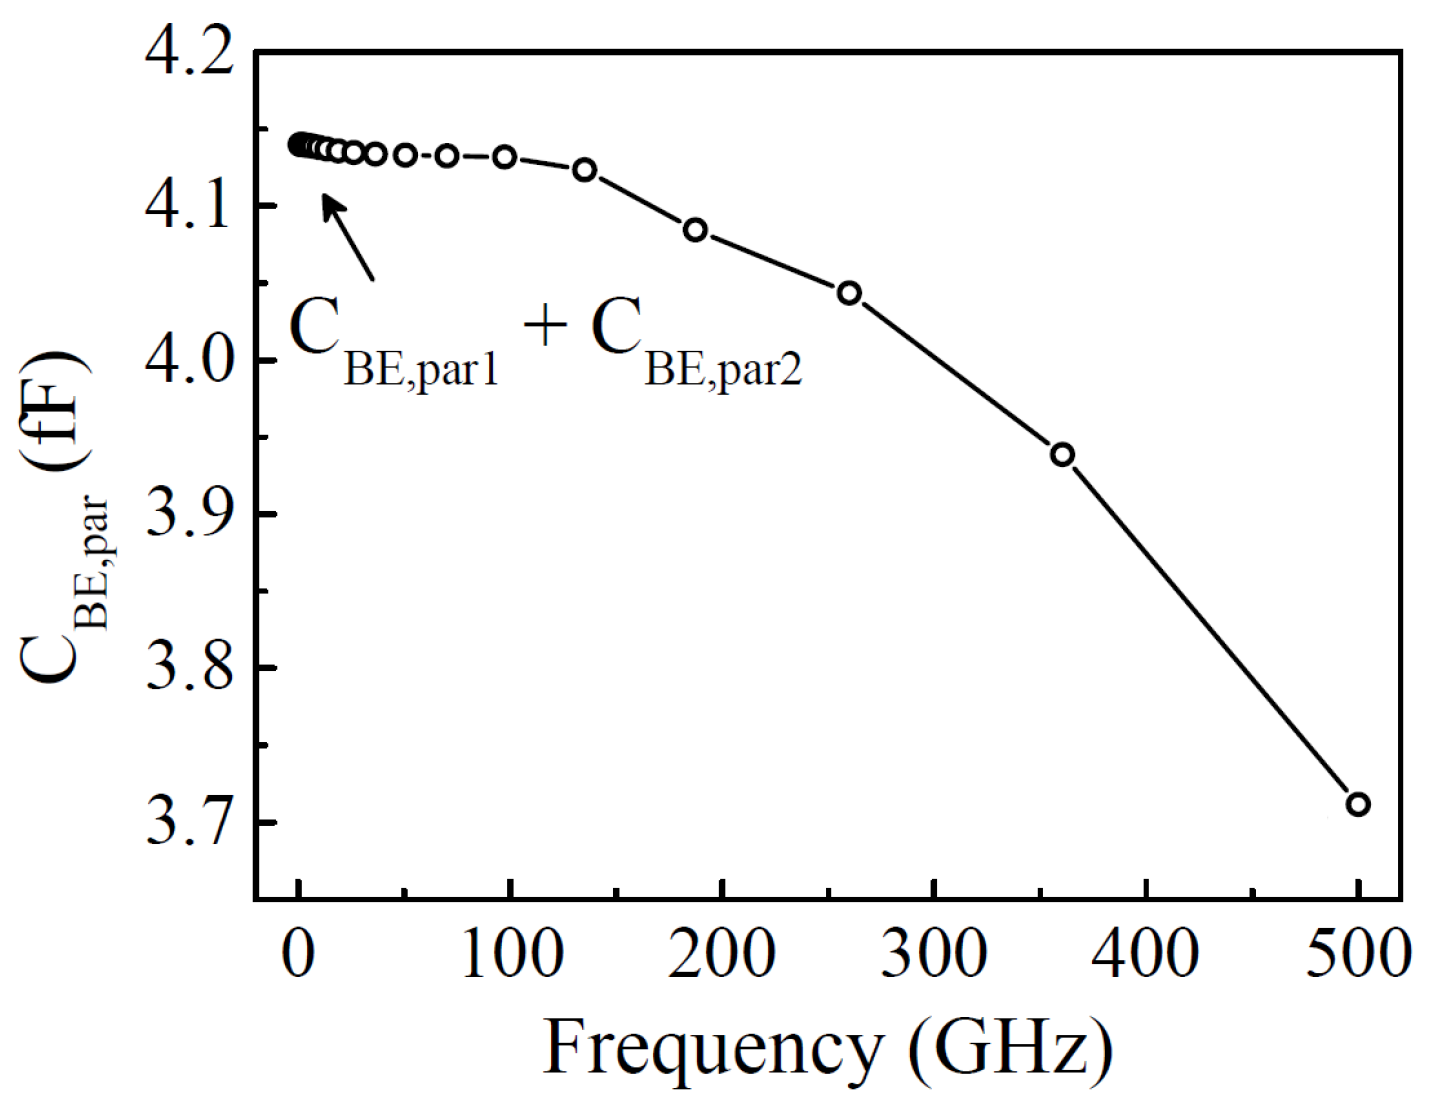
with C 1 = C B E , p a r , 1 and C 2 = C B E , p a r , 2 . Formulation (1) yields C B E , p a r 1 + C B E , p a r 2 when ω 0 and C B E , p a r 1 when ω . The partitioning factor (fbepar) has been extracted directly from the TCAD simulated capacitance versus frequency characteristics (Figure 6) obtained from the customized structure (Figure 5a). The calculated value of the parameter fbepar (=C B E , p a r 2 /(C B E , p a r 1 + C B E , p a r 2 )) is 0.93. Therefore, according to the equivalent circuit of HICUM, most of the C B E , p a r is assigned to the internal transistor with C B E , p a r 2 = 3.2 fF and C B E , p a r 1 = 0.35 fF.
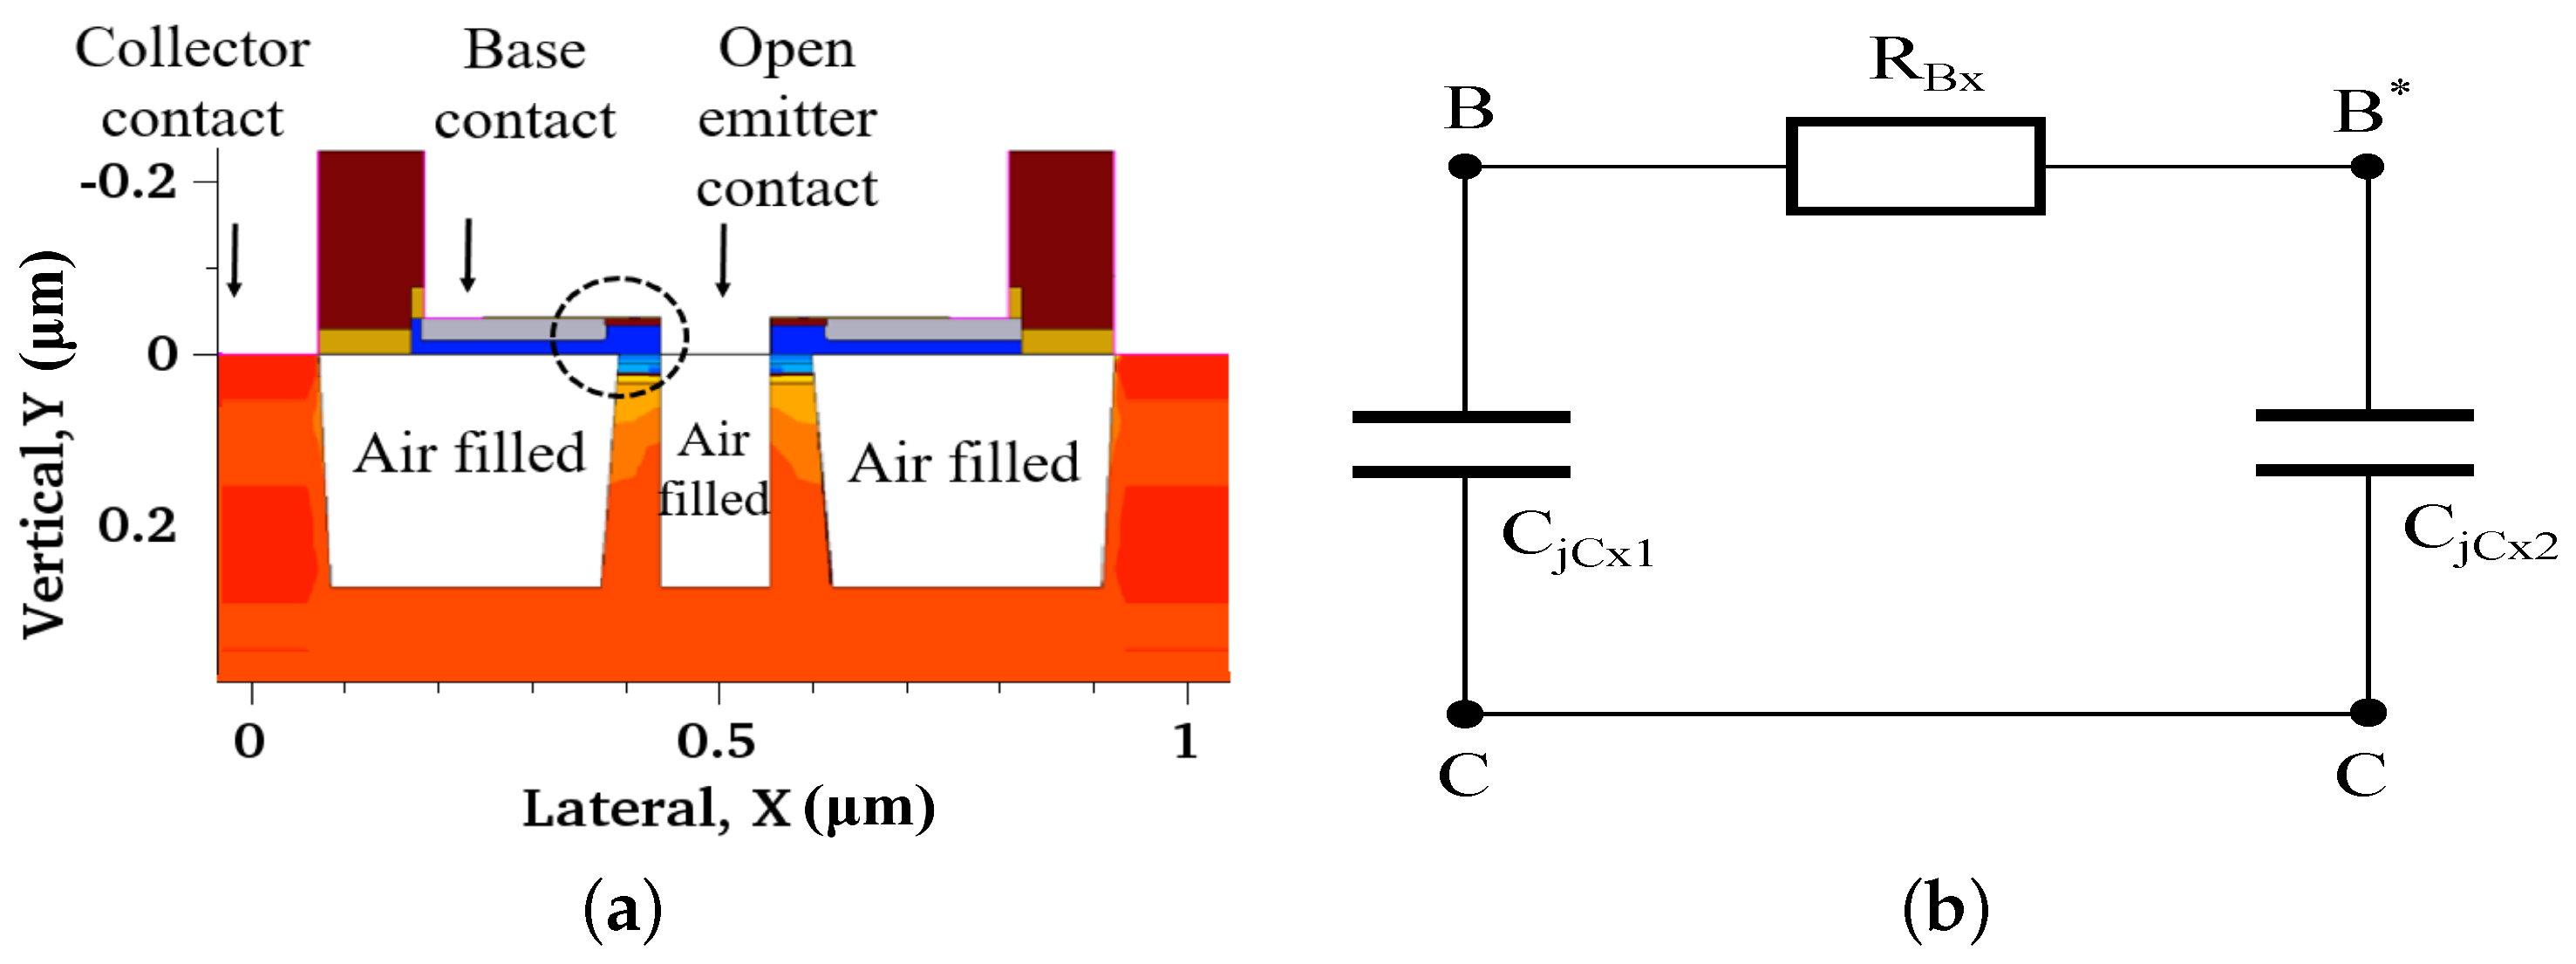
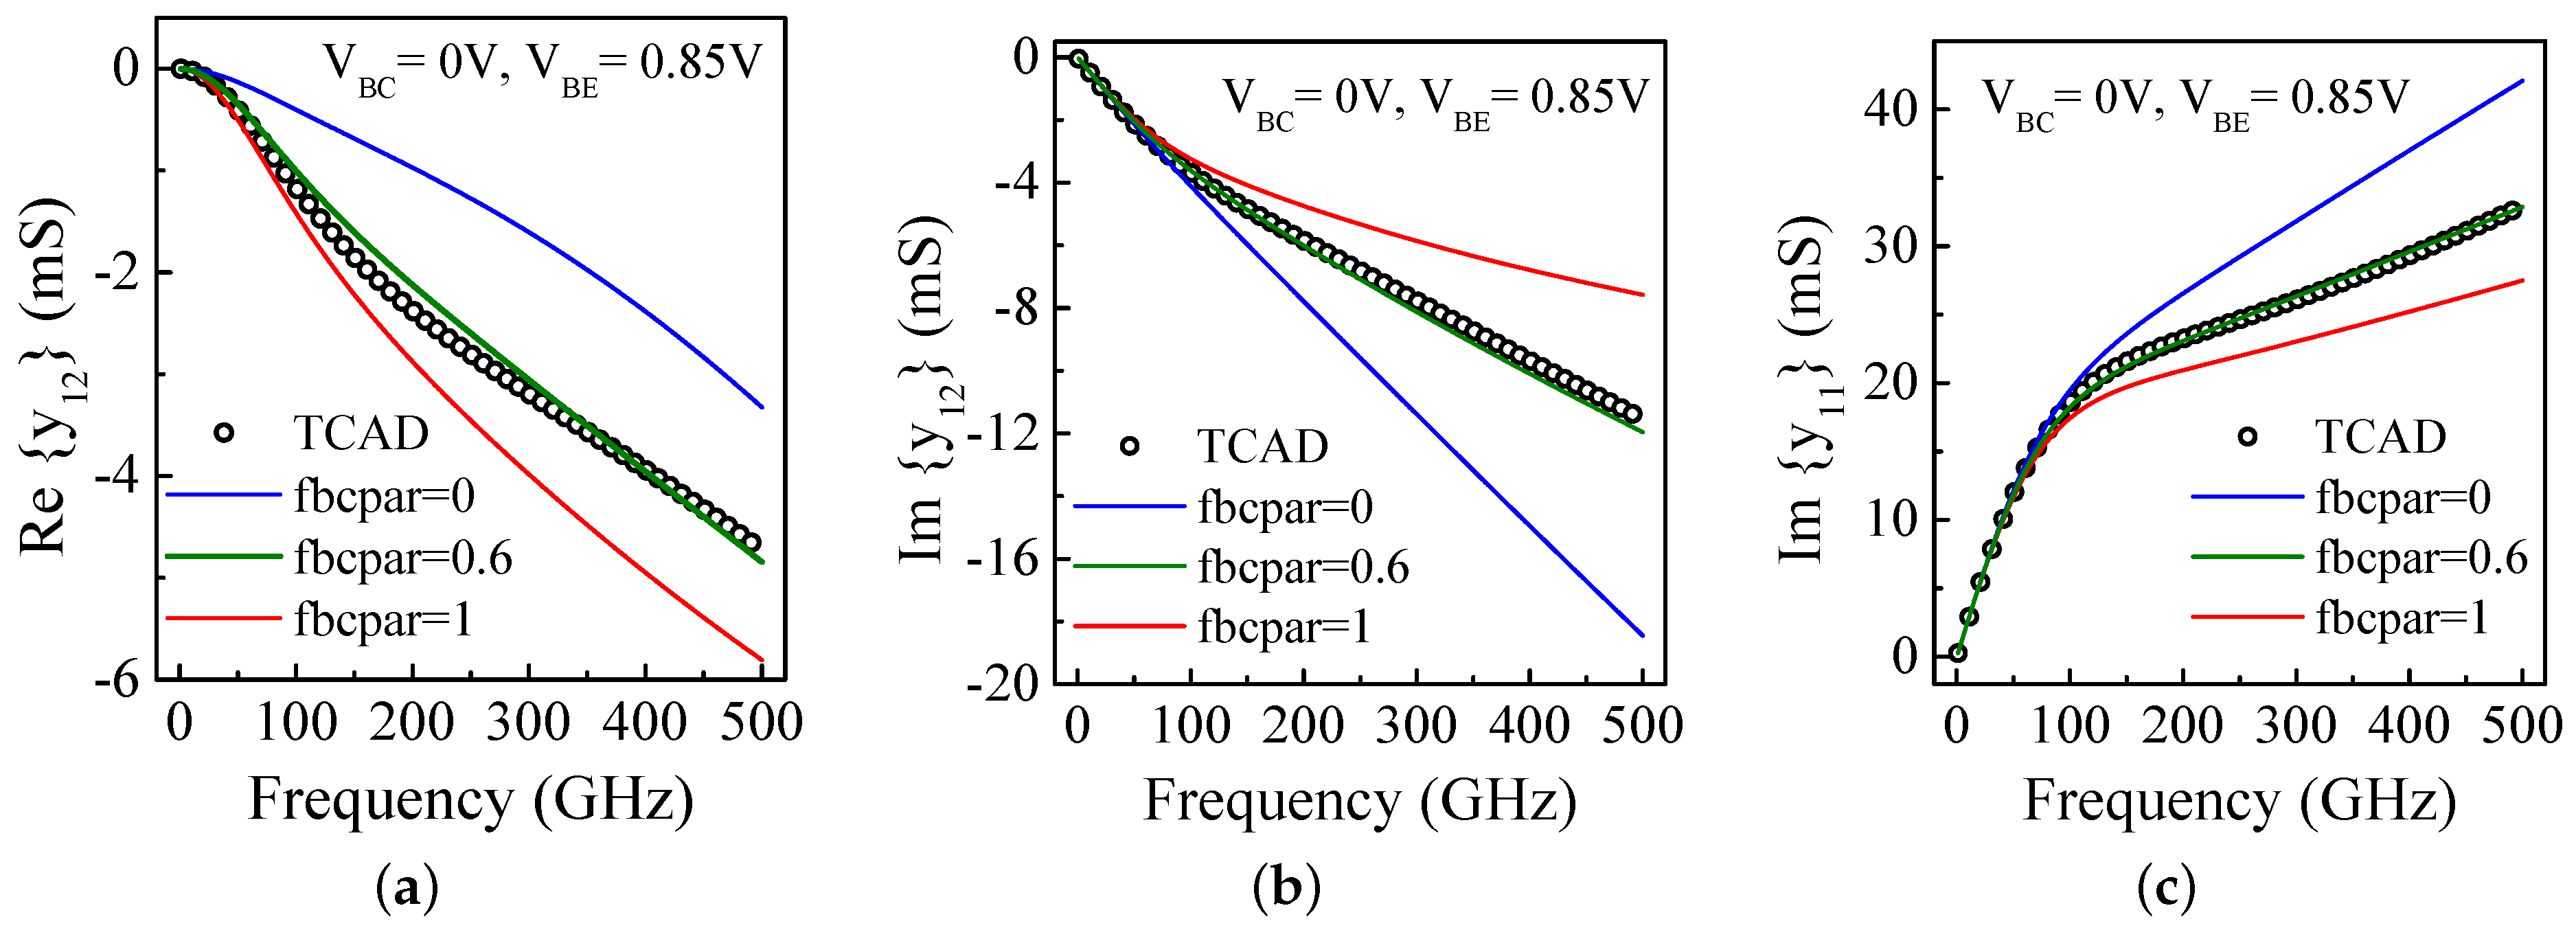
Similar to fbepar estimation, fbcpar is also extracted from the TCAD simulated frequency-dependent capacitance characteristics as discussed below. As can be seen from Figure 4, the total external base-collector capacitance (C B C x ) has two components: C B C x 1 from Q’ B C x and C B C x 2 from Q” B C x . Each of these components is again divided into two parts: namely the external base-collector junction capacitance (C J C x ) and parasitic base-collector capacitance (C B C , p a r ). In order to get rid-off the parasitic base-collector capacitance (C B C , p a r ), the TCAD structure shown in Figure 7a has been used for estimating the partitioning of C J C x only. Here, the shallow trench oxide has been removed and replaced by air. The corresponding equivalent circuit takes the form of a π -network with R B x and two partitioning capacitances (Figure 7b). Knowing now the external base-collector junction capacitance, the full TCAD structure of Figure 8a is used to calculate the partitioning of C B C , p a r together as obvious from the corresponding π -equivalent circuit shown in Figure 8b. While carrying out the TCAD simulation of both the structures (Figure 7a and Figure 8a), the emitter terminal is kept open and V B C = 0 V is used. Figure 9a,b show the TCAD simulated frequency-dependent capacitance plots of the structures of Figure 7a and Figure 8a, respectively. In (1), if C 1 = C j C X 1 and C 2 = C j C X 2 are used, one obtains the low-frequency approximation as C j C x 1 + C j C x 2 from Figure 9a and C j C x 1 by fitting formulation (1). Similarly, Figure 9b yields the low-frequency capacitance as C B C x = C B C x 1 + C B C x 2 and high-frequency capacitance as C B C x 1 . From these TCAD results, we obtain C B C x 1 = 0.85 fF, C B C x 2 = 2.75 fF, C j C x 1 = 0.05 fF and C j C x 2 = 2.75 fF. Therefore, one obtains C B C p a r 1 = 0.8 fF and C B C p a r 2 = 0 fF. Since the capacitance C B C x 1 is close to Metal-1, an additional 1 fF capacitance has been added to C B C x 1 . From this information, the value of the parameter fbcpar (=C B C x 2 /(C B C x 1 + C B C x 2 )) is calculated as 0.6. This led to the values of the capacitances as C B C x 2 = 2.75 fF and C B C x 1 = 1.8 fF. Note that the total external base-collector capacitance including the C B C , p a r appears to be dominated by the internal part, i.e., C B C x 2 .
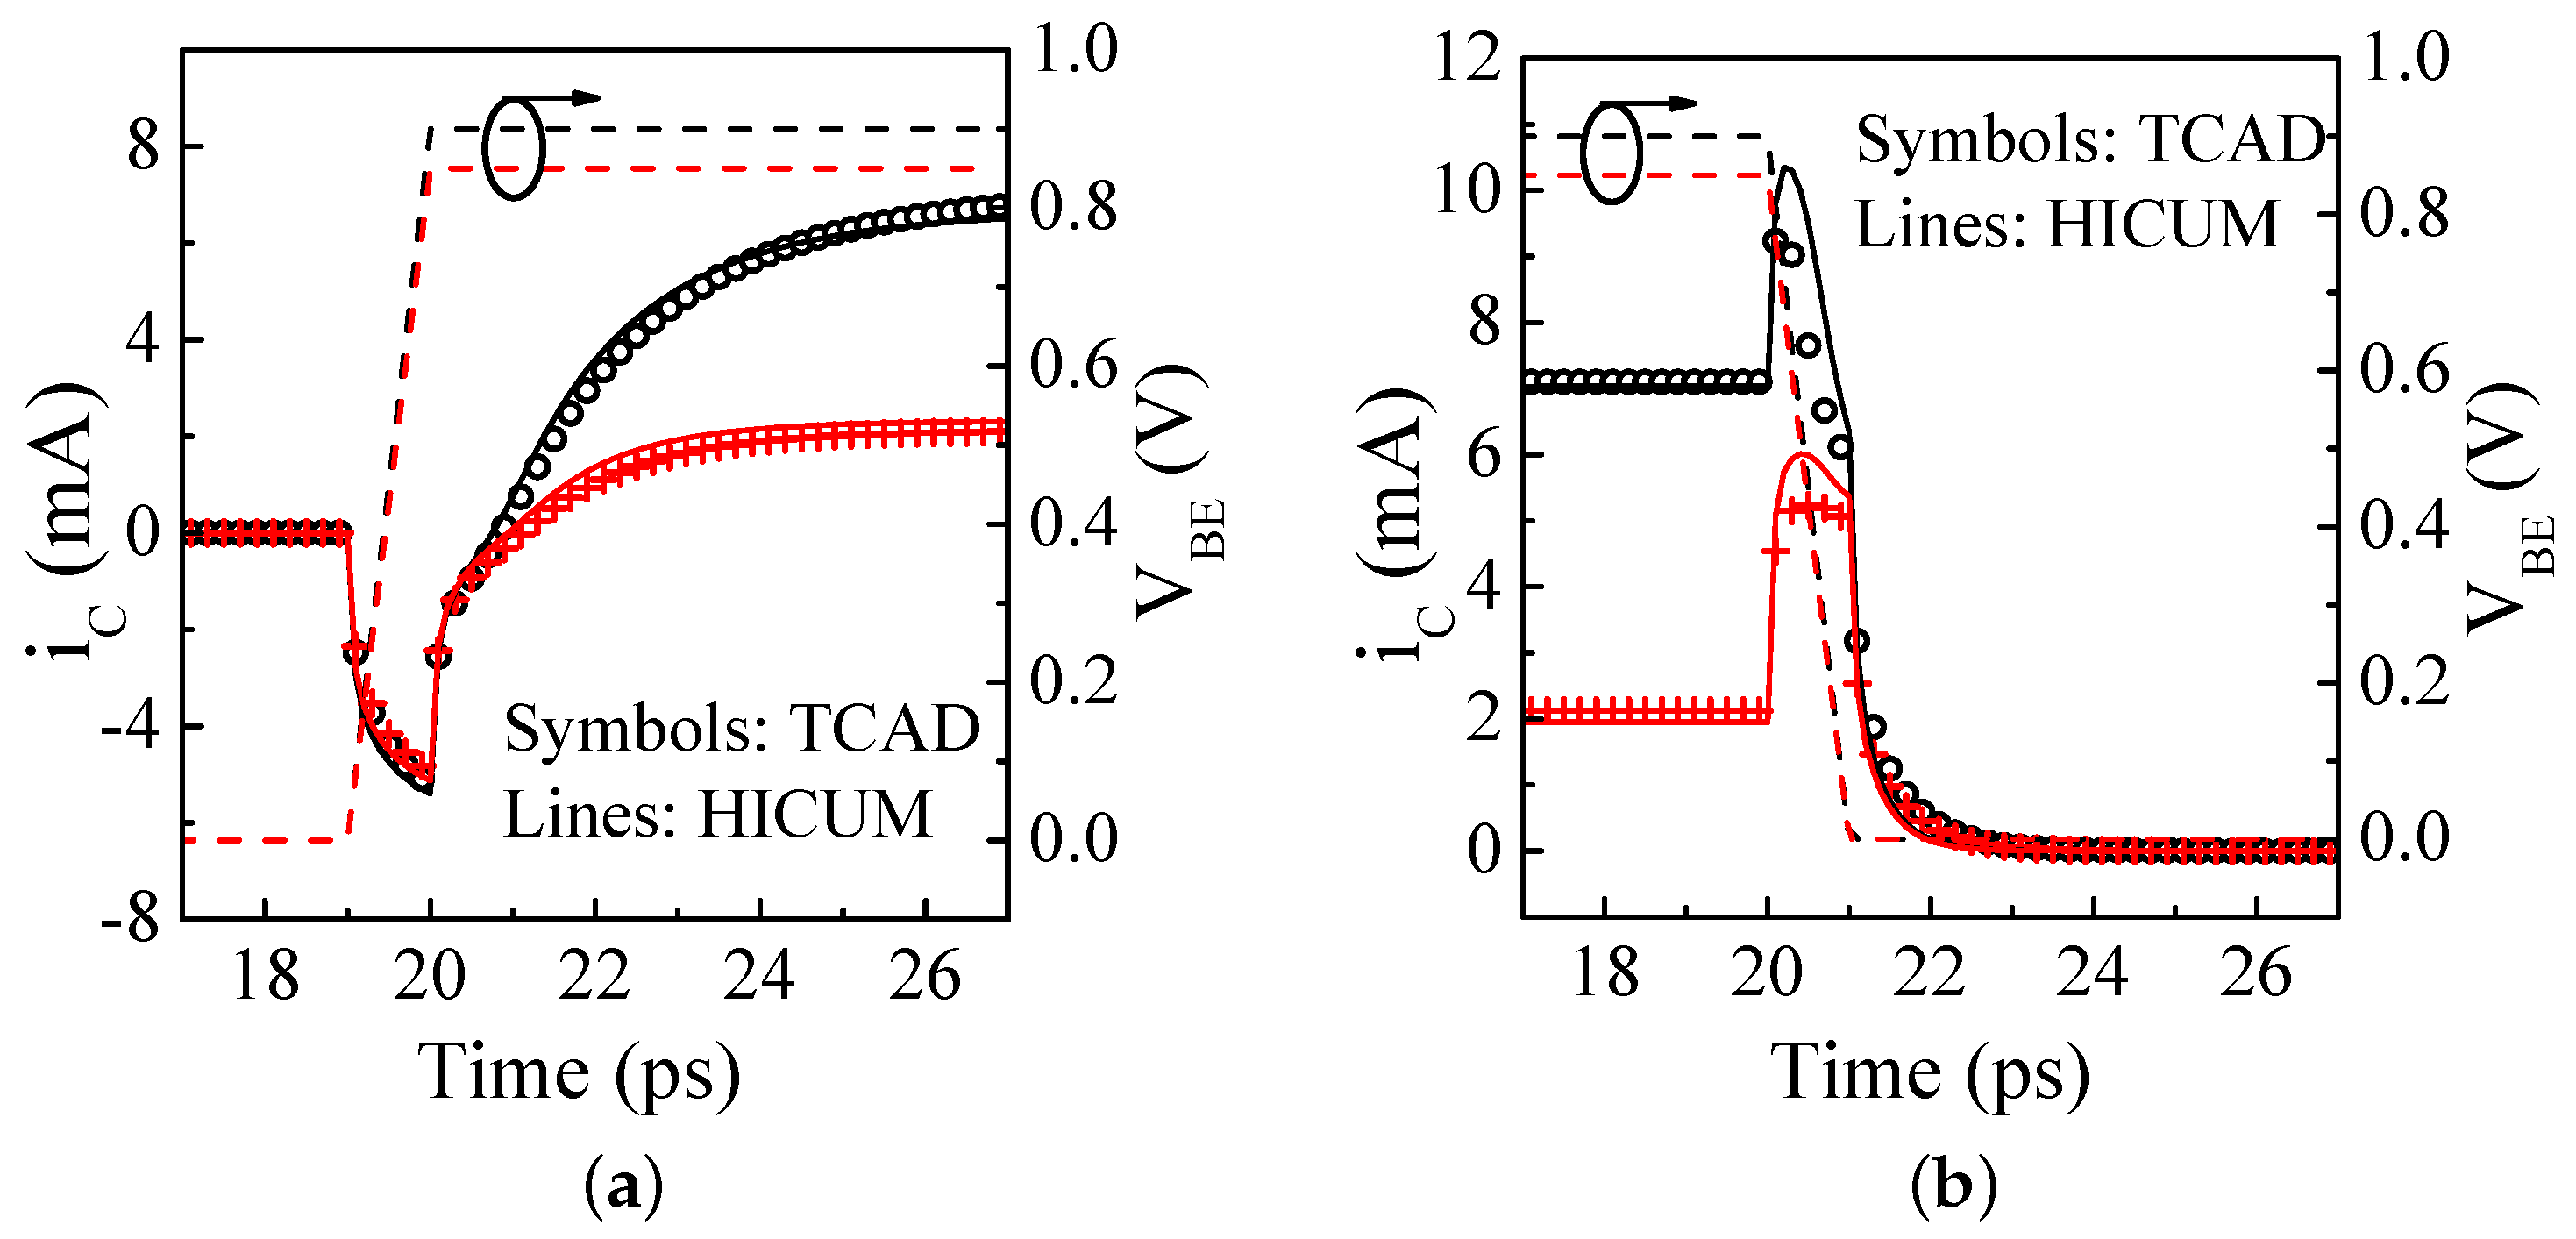
We have performed a large-signal transient simulation of the calibrated TCAD device for the extraction of vertical NQS parameters. Figure 10a,b show the turn-on and turn-off responses of the collector current, i C ( t ) at two different bias conditions of V B E = V C E = 0.9 V and 0.85 V. The transient input pulses used to investigate the turn-on and turn-off behavior have a 1 ps rise and fall time, respectively. In the turn-on behavior, i C ( t ) becomes negative for some time interval due to the charging of base-collector depletion capacitance. Afterwards, i C ( t ) increases with time. The comparison of TCAD and SPICE simulations using HICUM for the turn-on i C ( t ) characteristics at both the bias points shows a high level of agreement when the NQS parameter alit = 1 is used. Such a high value of alit is not surprising since the base-width is very low and the Ge mole fraction is increasing from base to collector creating a high field in the base region for the electrons entering from the emitter side. Hence, the base charge partitioning factor is significantly high (alit = 1) resulting into the stored charge reclaimable mostly from the collector side.
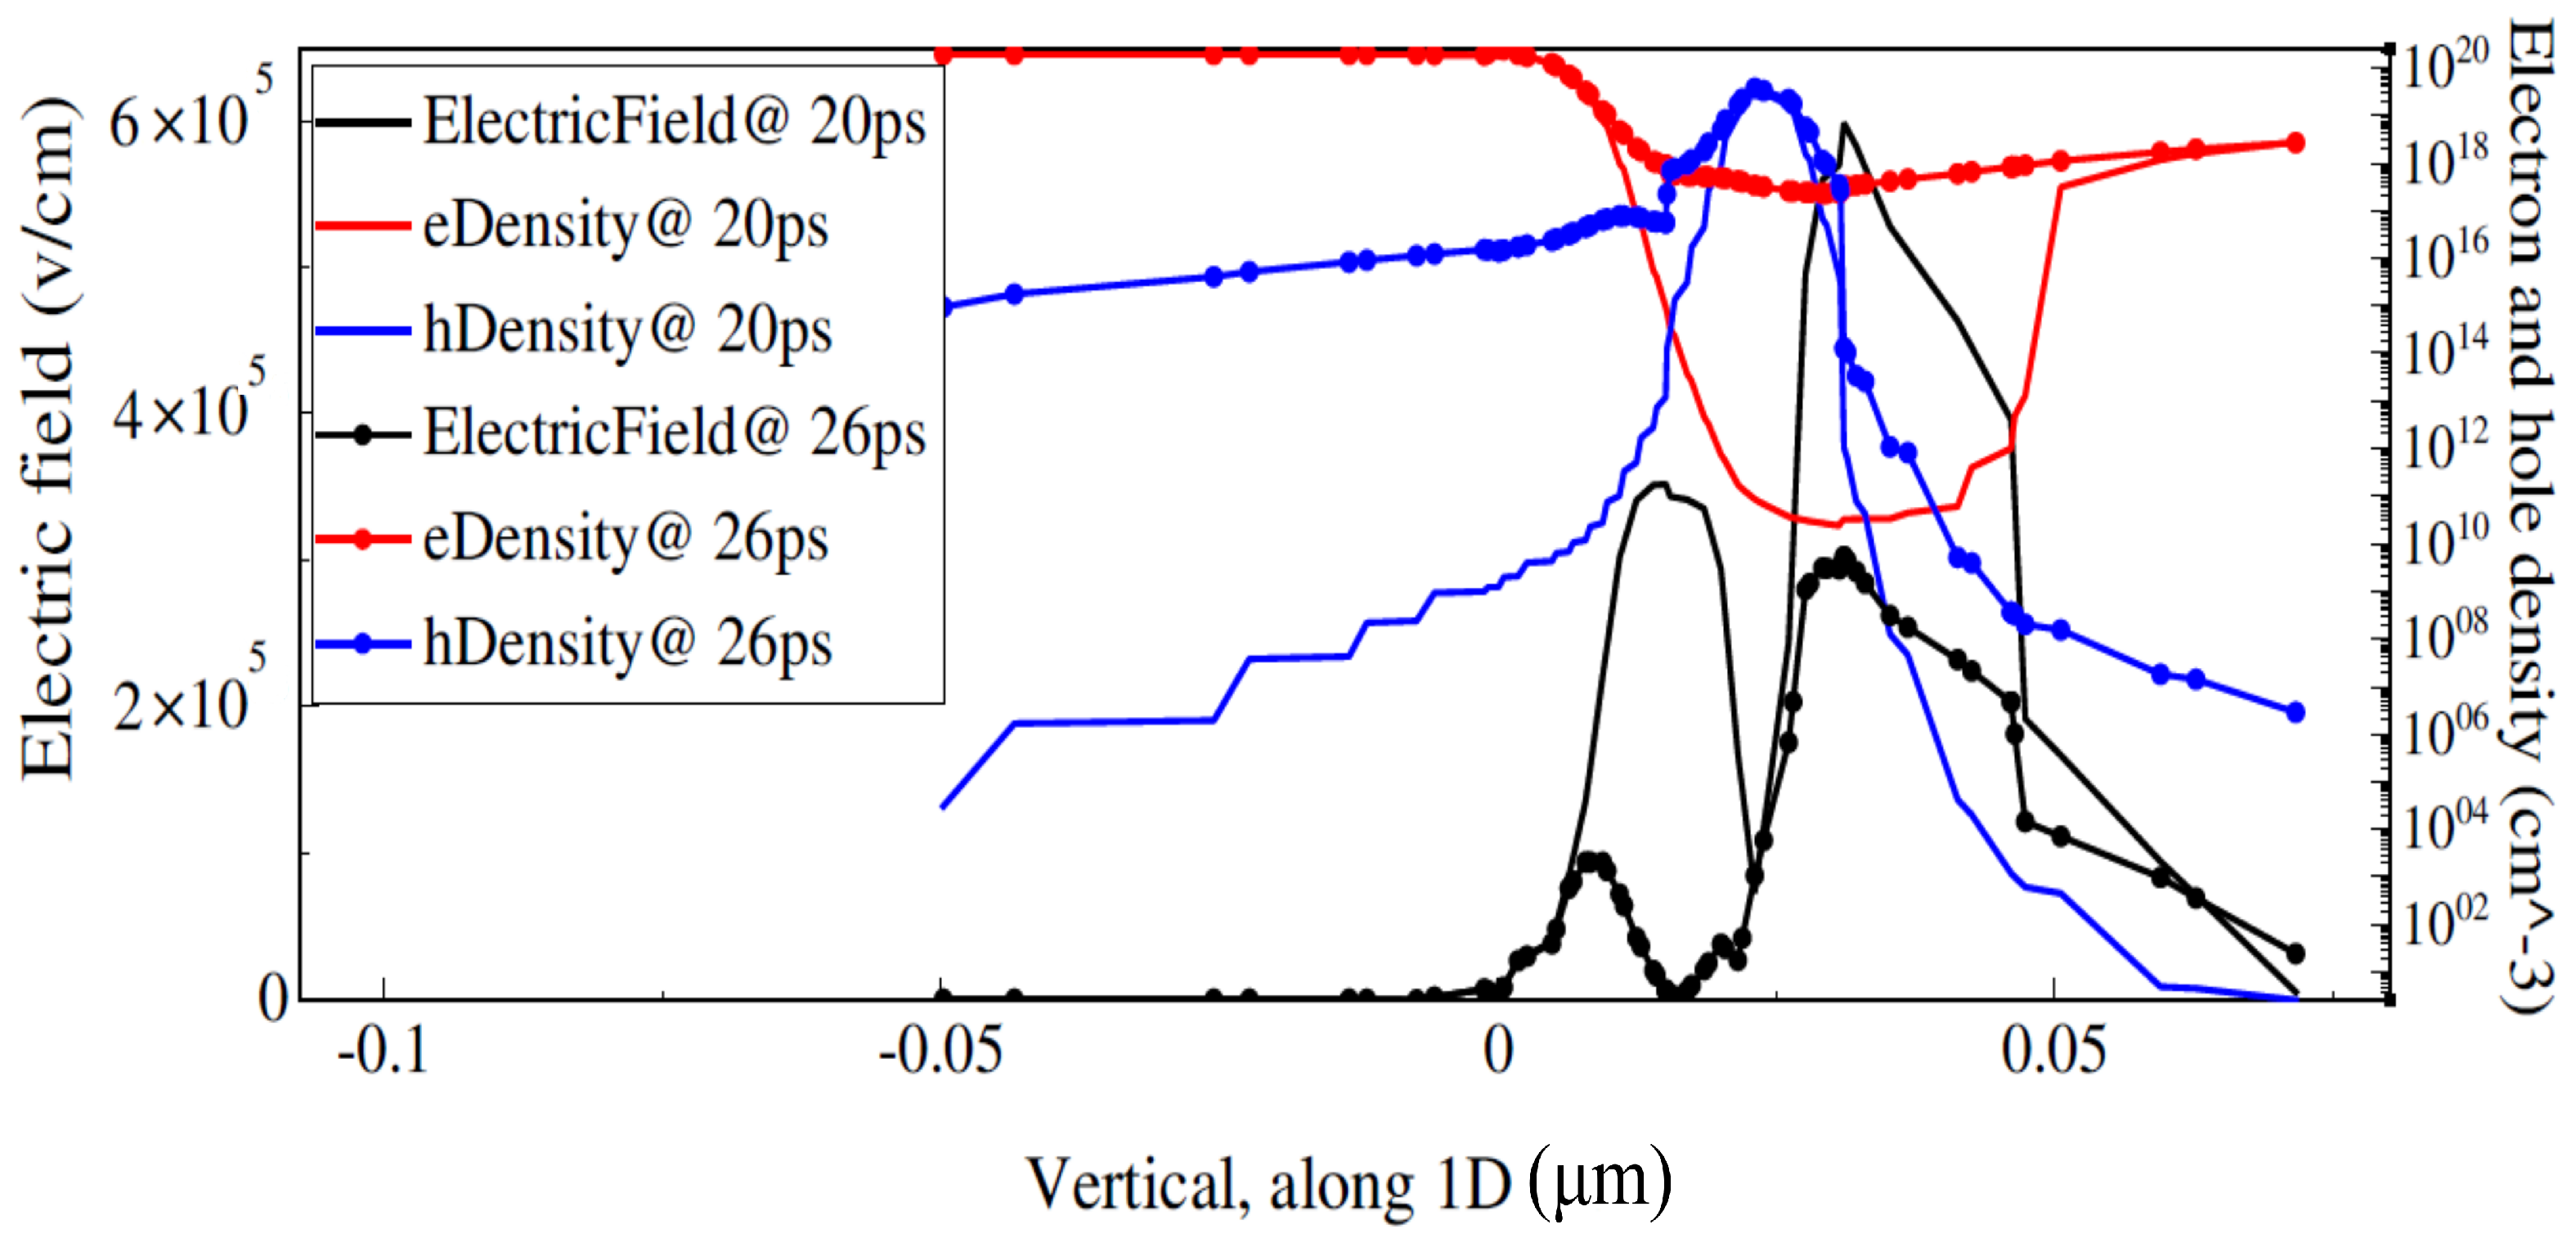
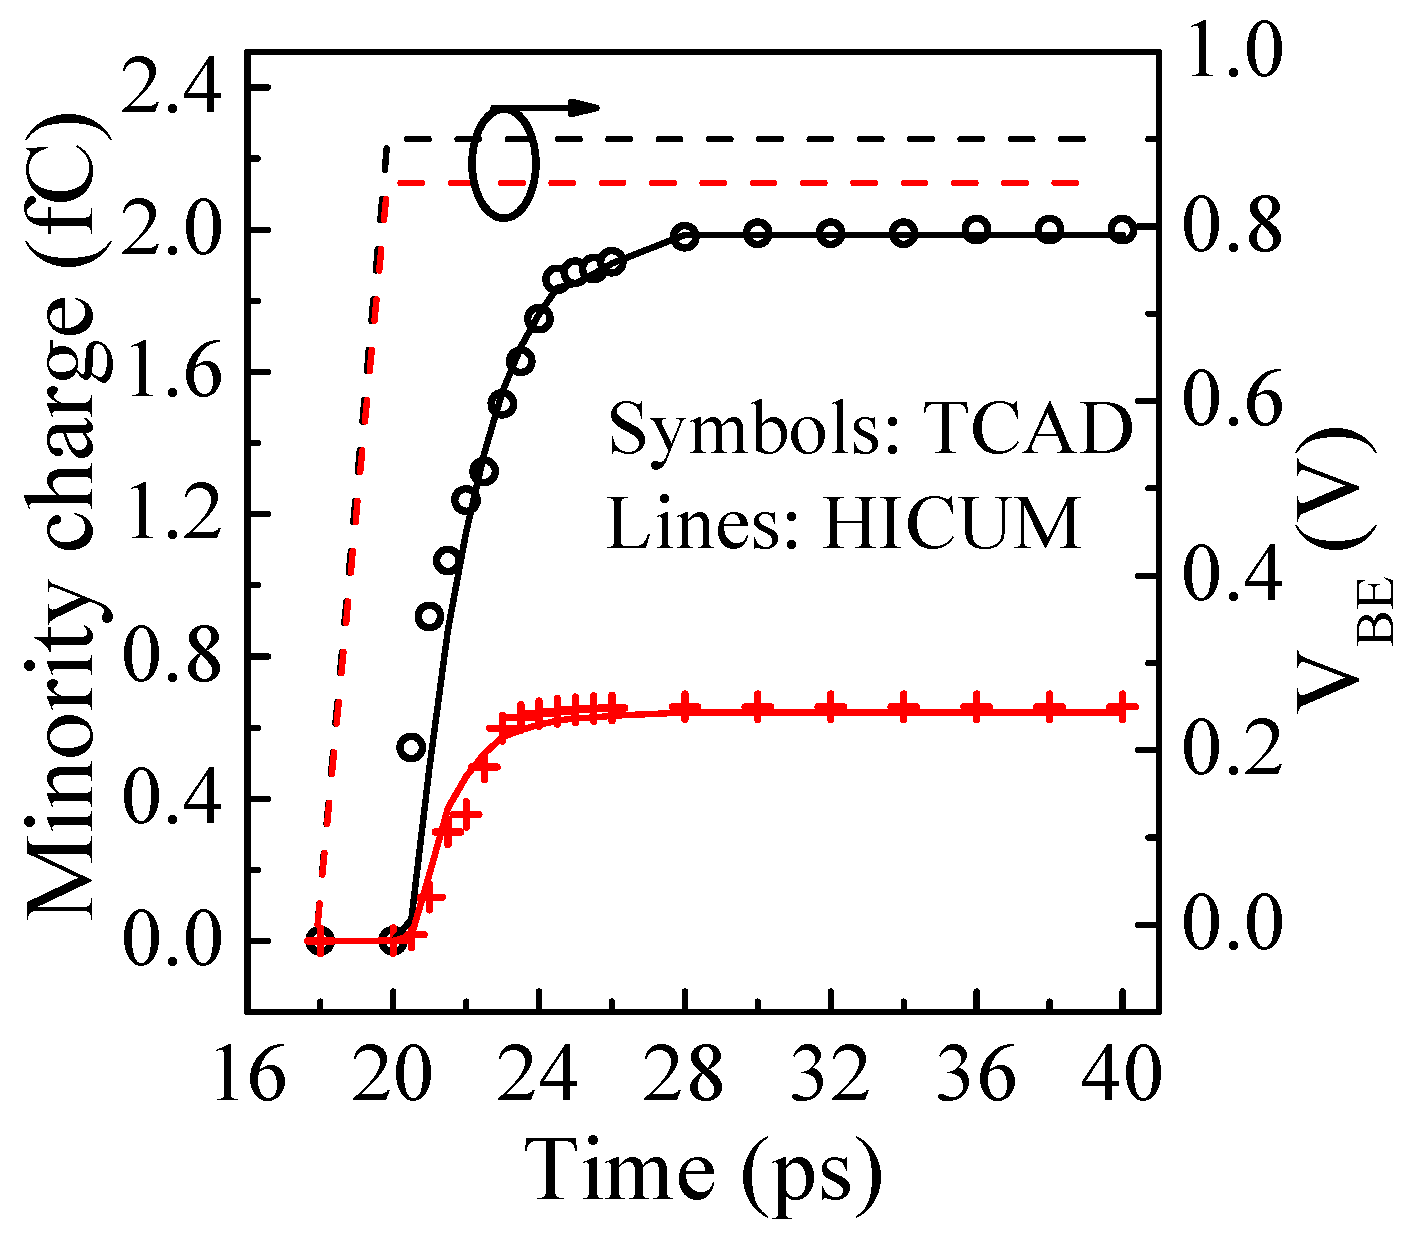
Instead of using the transient base current, the NQS parameter alqf is determined from the bias dependent minority charge stored within the p-type base region. Figure 11 shows the excess carriers and electric field profiles at different time instants as the base-emitter voltage is ramped up from 0 V to 0.9 V from 18 ps to 20 ps (with a 2 ps rise time). Note that the effects of higher V B E on the electric field and concentrations of electrons and holes are not visible immediately after 20 ps; instead, delayed effects are observed at around 26 ps when field peaks are reduced allowing a wider quasi-neutral base region flooded with excess electrons and holes. Figure 12 shows transient TCAD simulation results for the total minority carriers as V B E is increased with a 2 ps rise time for two different bias conditions. The total minority carriers have been calculated by using the surface integration of a carrier profile obtained from TCAD simulation. The time-dependent minority charge as obtained from HICUM with alqf = 1 is also presented in Figure 12. Note that the total minority charge requires different delay times for reaching the steady state which are accurately predicted by HICUM modeling results.
The lateral NQS parameter fcrbi = 0.2 is commonly used under a low-frequency approximation. At a very high frequency, this parameter value increases in order to capture the ac current crowding. Since the transistor under investigation has an emitter width of 0.2 μm (which is much less than emitter length, 5 μm), we have assumed a value of fcrbi = 0.5. A detailed study of different charge components later reveals that the effect of this parameter is minute until a very high frequency behavior is investigated.

3.2. Sensitivity Analysis for HF Parameters

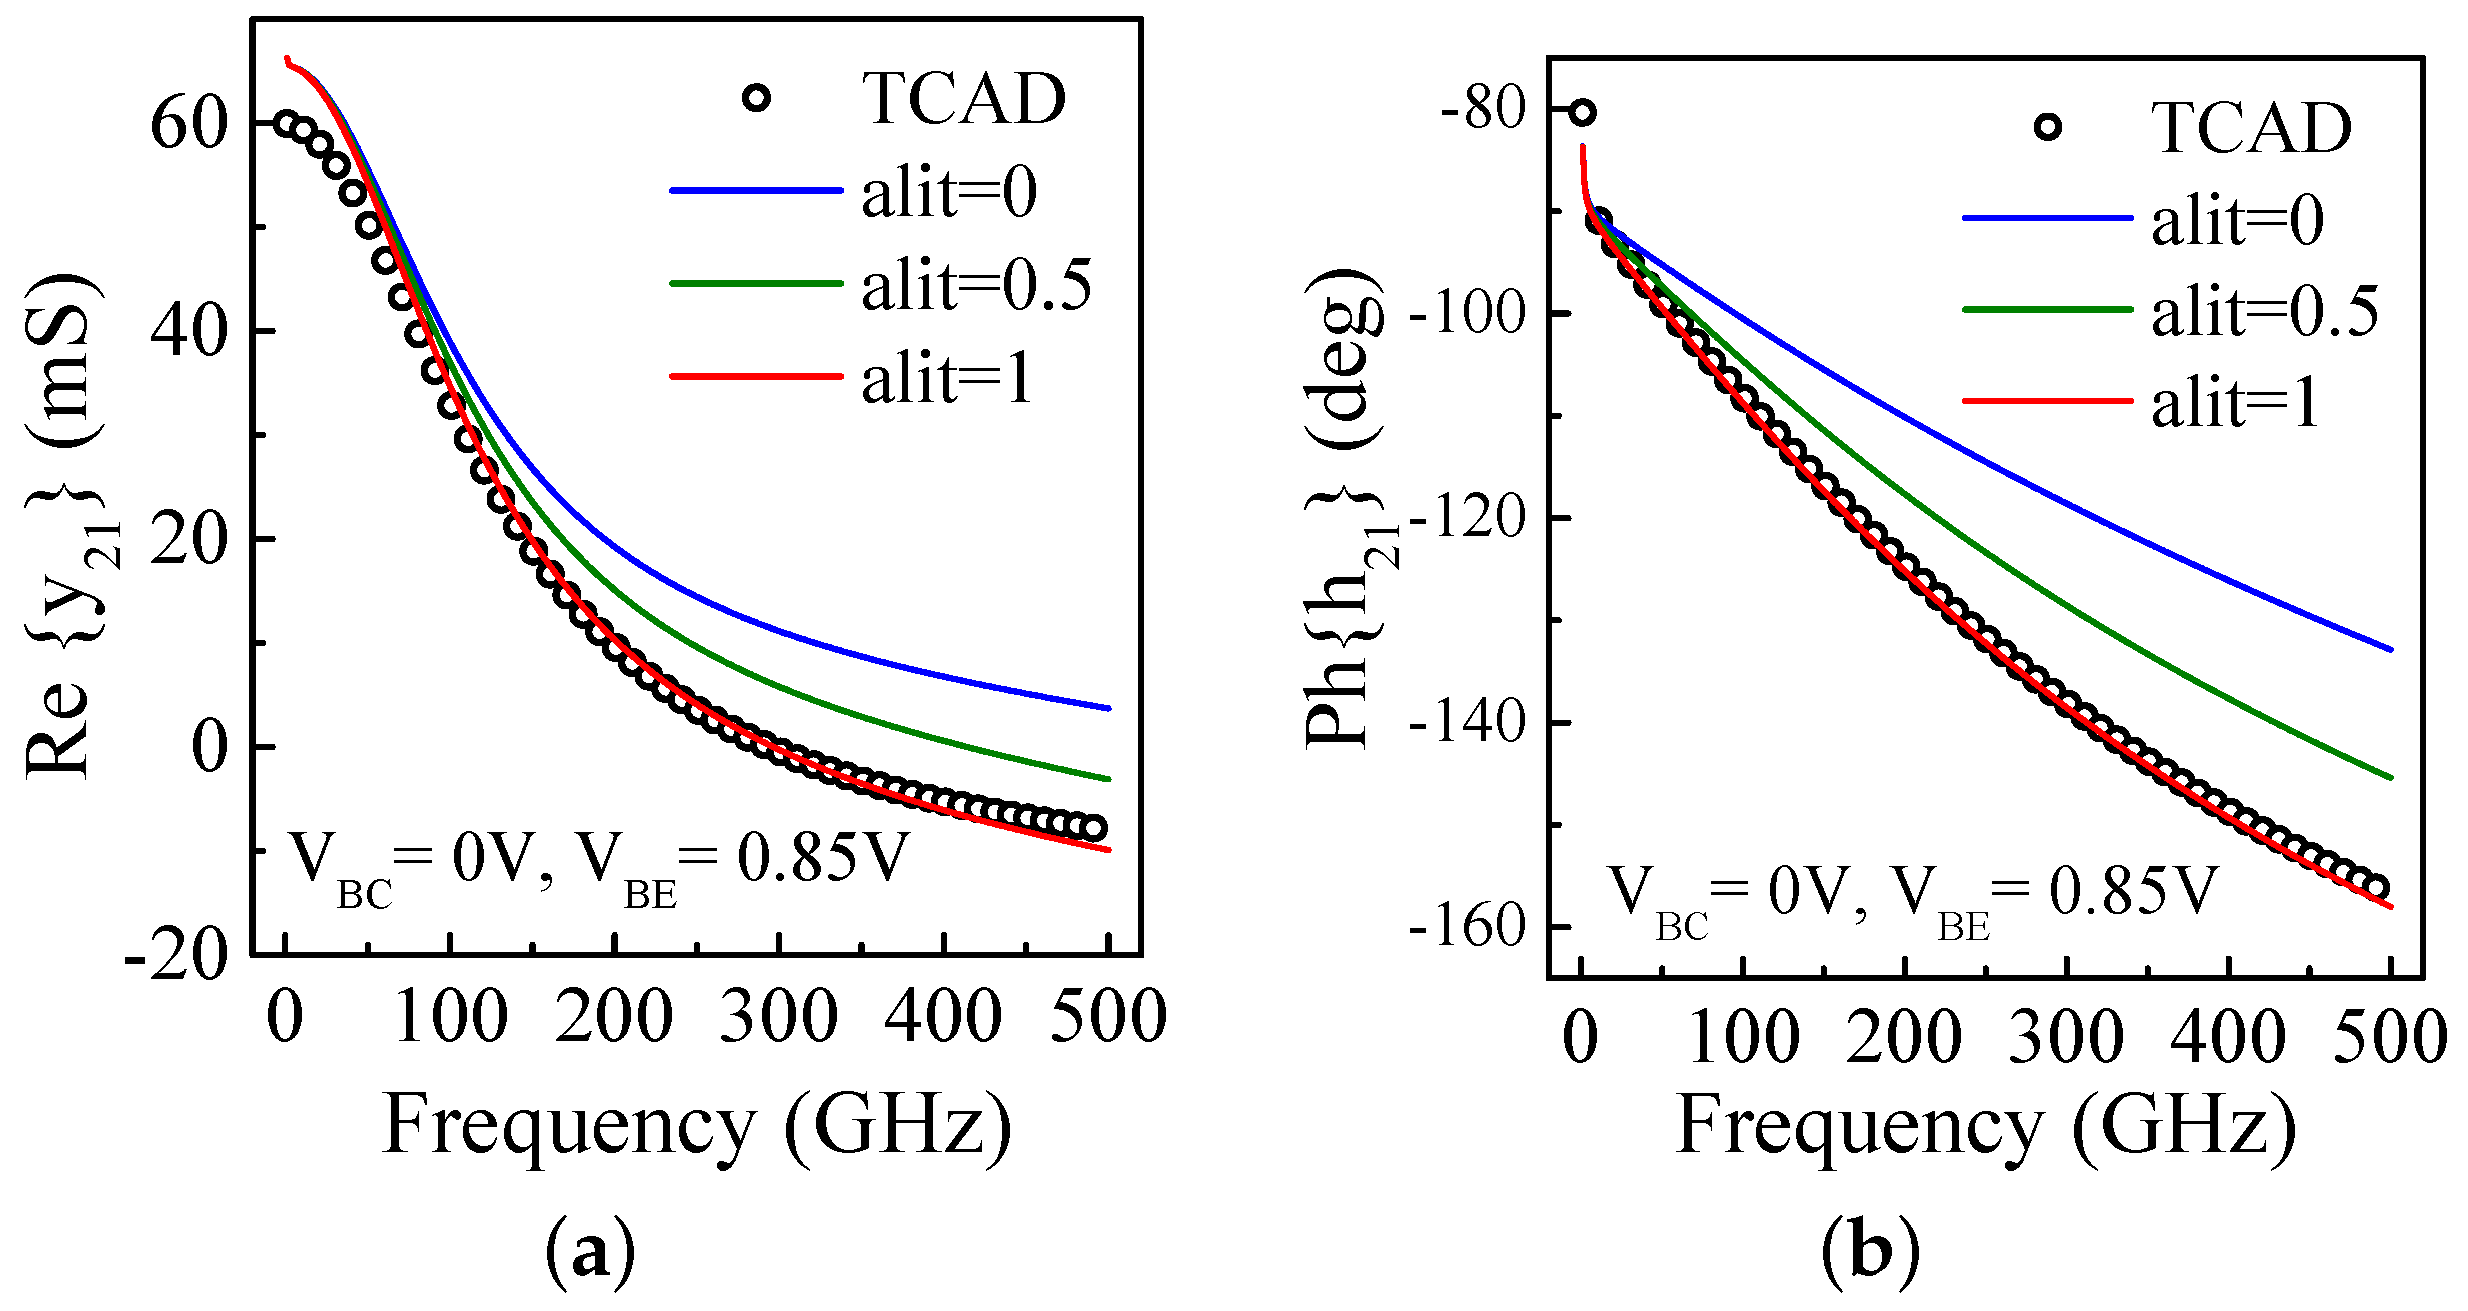
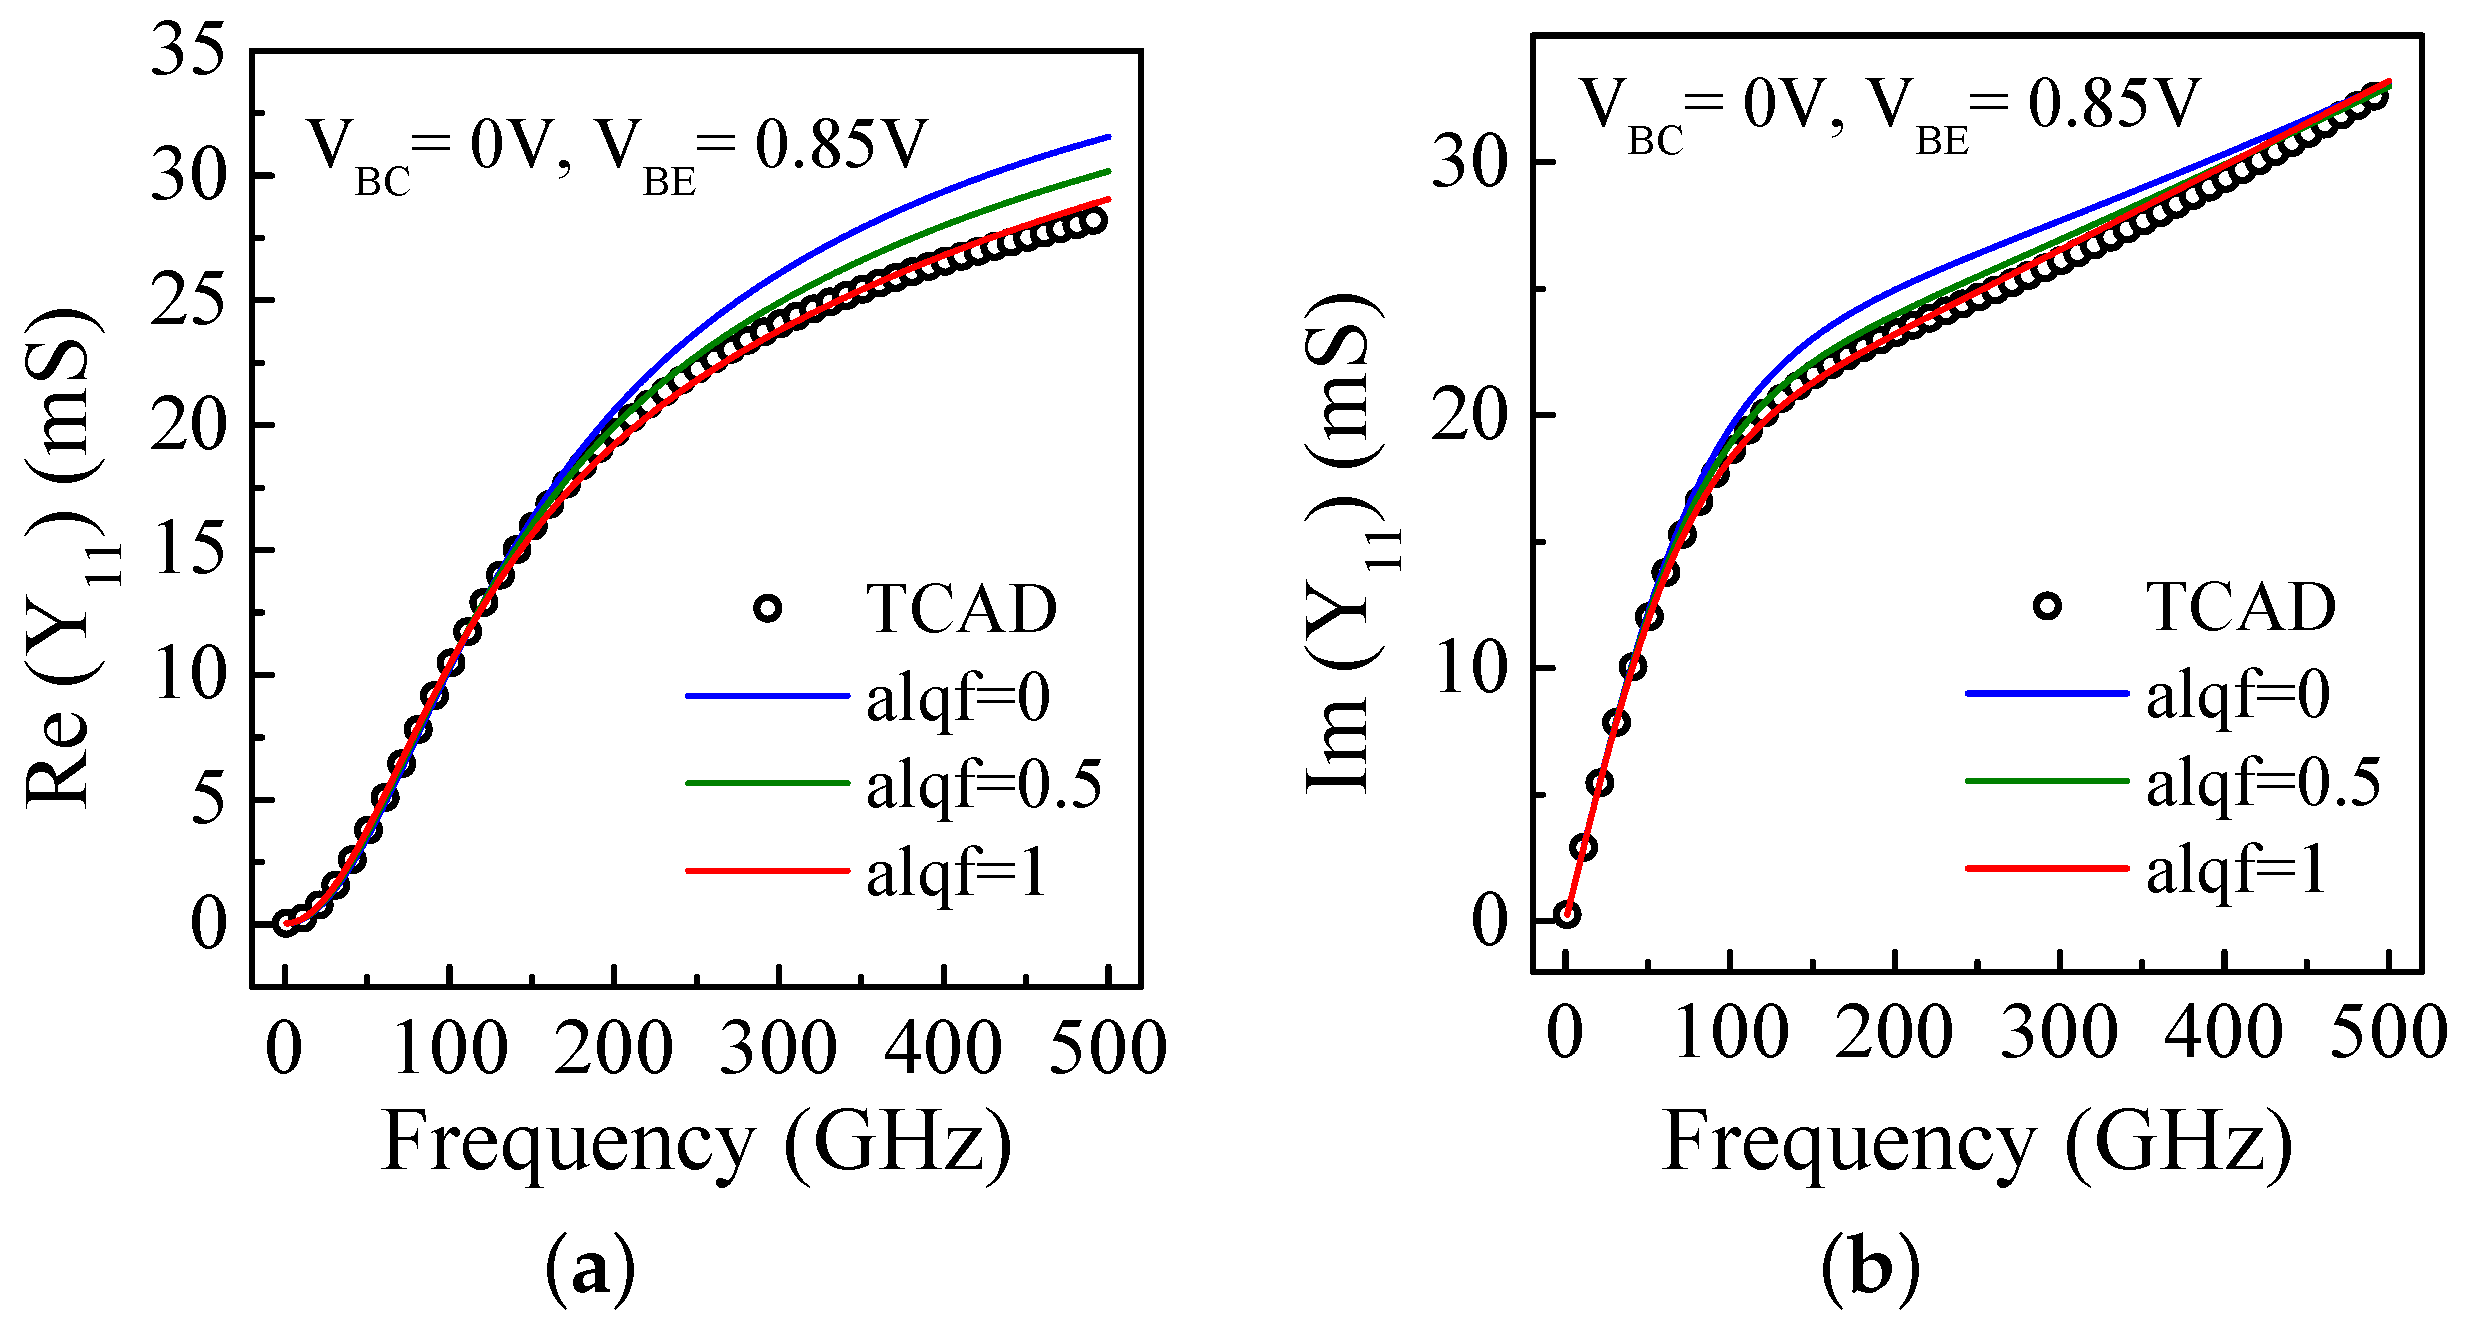
With the estimated parameter values, fbepar = 0.93 and fbcpar = 0.6, alit = 1, alqf = 1 and fcrbi = 0.5, we perform a sensitivity analysis in terms of the high-frequency small-signal parameters under the variations of one of these five parameters at a time. We have chosen the frequency-dependent small-signal parameters (y-, h- or z-parameters) in such a way that the expected effect of the variation of the model parameters should be most clearly visible. The bias point is V B E = 0.85 V and V B C = 0 V. For example, while analyzing the effect of fbepar, we keep fbcpar = 0.6, alit = 1, alqf = 1 and fcrbi = 0.5. Figure 13 presents the variations in the imaginary component of the y 11 parameter until 500 GHz for three different values of the fbepar parameter. It is observed that reducing the fbepar values leads to an overestimation of the y 11 beyond a frequency range of 100 GHz. It is interesting to note that until around 100 GHz, y 11 values are insensitive to fbepar. Similarly from Figure 14a–c, where, respectively, y 12 , y 12 and y 11 are plotted against frequency until 500 GHz, we analyze the sensitivity of fbcpar keeping the other four HF parameters fixed at their predetermined values. It is observed that y 11 and y 12 are almost independent of fbcpar values until 50 GHz beyond which the significant dependence of fbcpar is clearly visible. On the other hand, a lower value of fbcpar affects relatively lower-frequency characteristics of y 12 , see Figure 14a. Figure 15a shows the effects of the parameter alit in terms of the frequency dependent y 21 where it is clearly observed how lower values of alit leads to overestimation of y 21 . On the other hand, the dependency of alit on P h a s e ( h 21 ) is highlighted in Figure 15b: A small value of alit results in a smaller phase-shift at 500 GHz for h 21 . Similarly, the sensitivities of frequency-dependent y 11 and y 11 plots for various values of alqf are observed in Figure 16a,b, respectively. Lower values of alqf tend to overestimate in particular y 11 , but it is only visible after 200 GHz. The impact of alqf on y 11 is not very pronounced. Finally Figure 17a,b show the effect of different values of the parameter fcrbi, respectively, on the frequency-dependent z 11 and z 11 characteristics until 500 GHz. It is observed that lower fcrbi values tend to slightly overestimate the z 11 characteristics—only visible beyond 200 GHz—whereas z 11 is not sensitive to the variation in fcrbi.
Overall, this sensitivity analysis shows that the extracted values of these selected five parameters are reliable. On the other hand, this analysis also demonstrates a measure of sensitivity of the HF characteristics. It is clear that the relevant characteristics are nearly insensitive to a large variation in the parameters alqf and fcrbi; whereas those characteristics representing the sensitivity of fbepar, fbcpar and alit show significant variations.

4. High Frequency Compact Model Evaluation

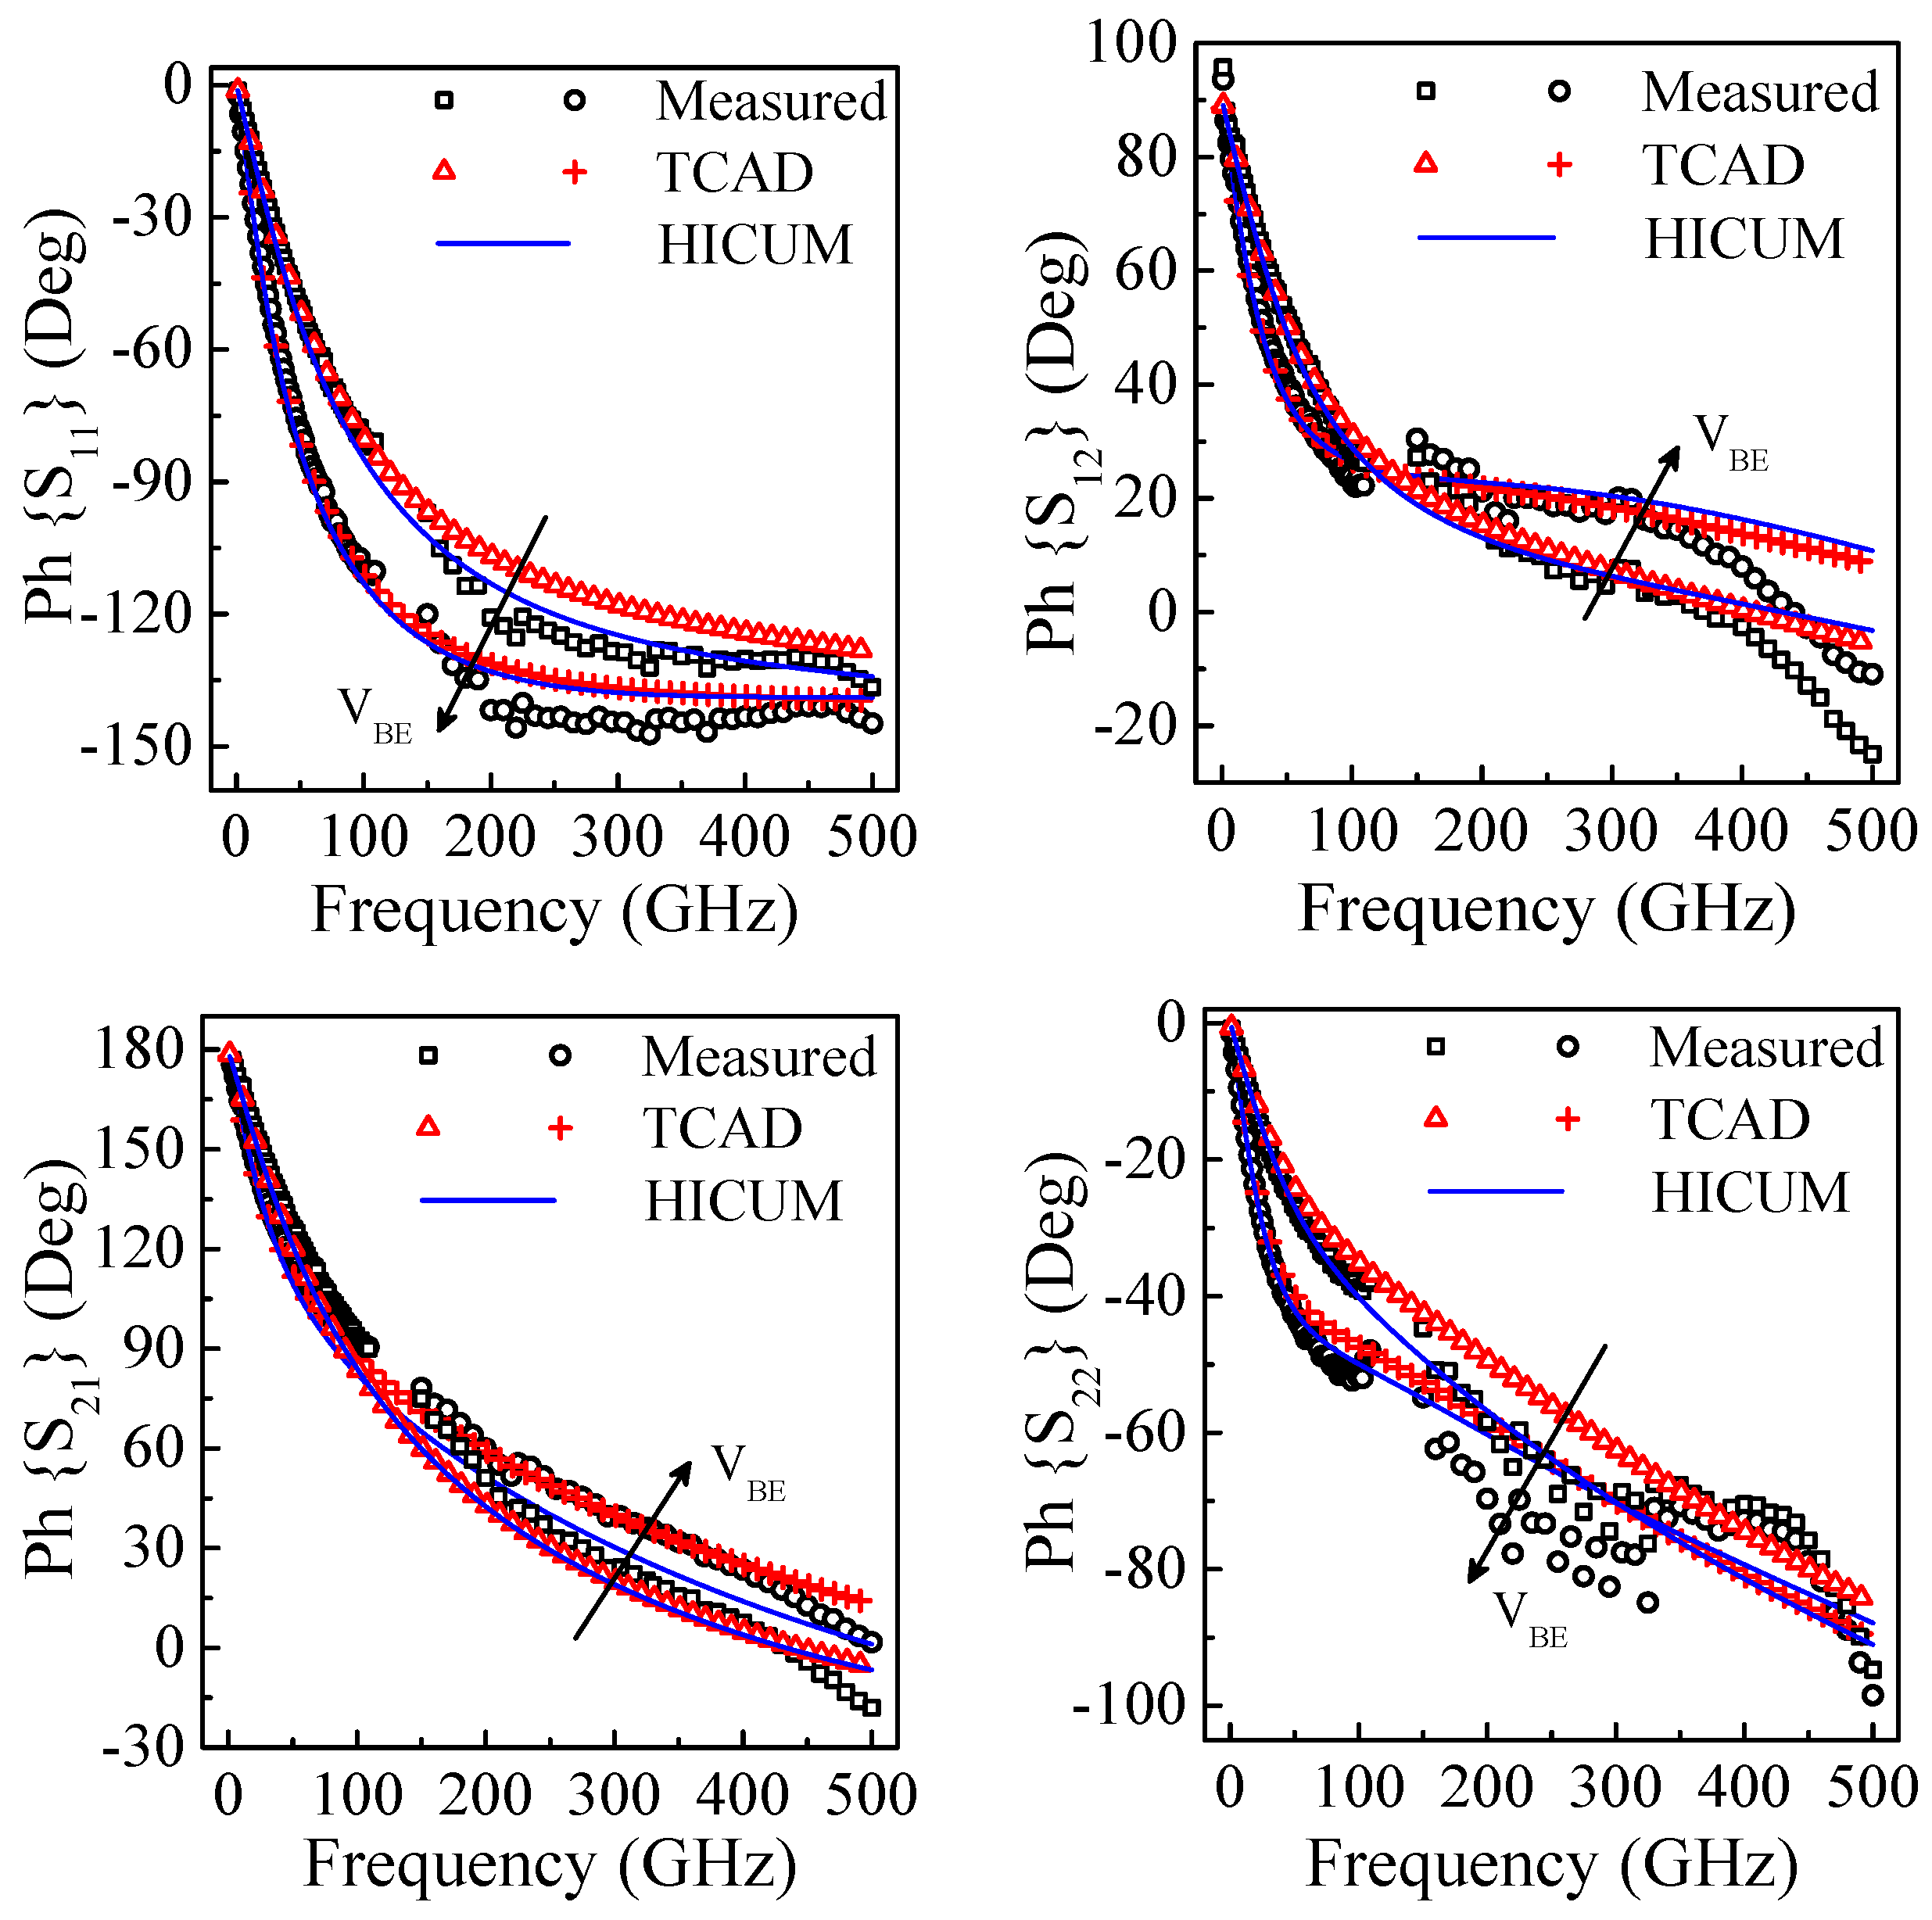
Prior to concluding this work, here we present for the first time a comparison among the results obtained from the measurements, TCAD simulation and SPICE simulation of the HICUM model equivalent circuit with the extracted RF parameters up to 500 GHz (see Figure 18 and Figure 19). Previously reported results were obtained up to 325 GHz but were limited in terms of data ( S 21 , H 21 , M A G ( U ) ) [27] or only in one frequency band [28]. Considering the TCAD simulation as a reference, HICUM shows a high level of model agreement in the amplitude and phase of all s-parameters for two different bias points near the peak f T .
The calibration procedure used in obtaining the measured results presented in Figure 18 and Figure 19 has been evaluated in [29] and its validity has been proved up to very high frequency [30]. Nevertheless, some inaccuracies still appear in this measurement because TRL-calibration is an 8-error-terms algorithm that does not allow for cross-talk correction. If de-embedding partially corrects the cross-talk, some inaccuracies can still be observed.
For example, regarding s 12 from 70 GHz to 220 GHz, unexpected results appear and can be explained by the scaling of the probes. Indeed, the Picoprobe DC-110 GHz and 140–220 GHz probes do not properly confine the EM fields to the device under test (DUT). The stray fields directly couple ports-1 and ports-2 as well as the port to ground. Therefore, the validity range of the measurement is from 1 to 70 GHz and from 220 GHz to 350 GHz. In this range, a very good agreement is observed between the measurement, TCAD and HICUM. The trend in the s 12 phase measurement above 350 GHz that deviates from TCAD and HICUM is not representative of the intrinsic device and is attributed to a measurement artifact [29]. In this case, HICUM still appears to be reliable since it shows good agreement with the TCAD simulation.
Other inaccuracies appear on the magnitudes of s 11 and s 22 . These can be attributed to the quality of the contact on the aluminum pad and the ability of the user to achieve a reproducible probe placement on each structure, which can alter the probe–substrate coupling. This leads to a deviation of about ±1 dB above 140 GHz; however, the accuracy of the measurement is sufficient to validate the model. We can observe that the magnitudes of s 11 and s 22 decrease until 200 GHz and increases afterwards. We attribute this behavior to the distributed lateral effect. Variation in s 11 is very well captured by HICUM when fbepar and fcrbi are correctly set. Concerning the phase parameter of the reflection, the phase of s 11 is well measured without any strong discontinuity up to 500 GHz, which is less than the case for s 22 . Additionally note that the magnitude of s 22 is also affected by the distributed effect within the substrate [18]. In previous work [18], we have showed that the s 22 parameter is also strongly dependent on accurate values of R C x and the related collector–substrate network whose parameters have to be extracted very carefully.
Another source of inaccuracy are the bias tees, which are different from one frequency band to another (resistance varying from 1.7 Ω to 2.5 Ω ) which can slightly modify the bias point of the transistor. At a very high bias, this can lead to some discontinuities on the magnitude of s 21 . Except for this fact, the magnitude and phase of the s 21 parameter are very well measured and the HICUM modeling result is perfectly reliable. This would not be the case without the NQS and external parasitic model in place.
In summary, the unexpected trends of those characteristics that deviate strongly from the TCAD simulation are correlated to the calibration procedure and more generally to the measurement environment as shown in [29,30]. Finally, this work clearly demonstrates that the HICUM model produces reasonable simulation results beyond f T (=340 GHz), f M A X (=370 GHz) and presents a good compromise between complexity and accuracy.

5. Conclusions

In this paper, we reported an in-depth investigation of the high-frequency model of SiGe HBT, fabricated with 55 nm BICMOS process technology, operating from a low to high frequency regime. We have focused on accessing the parameters that play an important role beyond 100 GHz and are devoted to modeling non-quasi-static effects (alit, alqf and fcrbi) and the parasitic capacitance partitioning factors (fbepar, fbcpar) in the HBT. As a basis, very high frequency de-embedded measured data are used to calibrate a device structure in TCAD. Following this calibrated TCAD device structure and its dedicated customized forms, specific high-frequency compact model parameters are extracted and these extracted values are analyzed by a sensitivity analysis. The parasitic capacitance partitioning factors describing the complex distributed capacitive behavior between base and emitter and base and collector have been extracted from the TCAD analysis. Specific TCAD structures have been designed for clear distinctions of the different contributions and a straightforward extraction procedure has been developed. For the extraction of vertical NQS parameters, we performed a large-signal transient simulation of the calibrated TCAD device. A high value of the alit parameter was found which was attributed to the narrow base-width combined with the graded Ge profile in the base creating a high E-field in the base region for the electrons entering from the emitter.
Considering HICUM as a vehicle, this study shows the impact of the selected high-frequency model parameters on specific frequency dependent characteristics up to 500 GHz and it draws the limit of the frequency regime up to which the behavior of the frequency dependent characteristic remains quasi-static. We note that to obtain the actual behavior, observations should be carried out beyond 100 GHz.

Author Contributions

Conceptualization, B.S. and S.F.; methodology, S.F., A.C. and T.Z.; software, B.S. and S.R.P.; validation, B.S.; formal analysis, B.S.; investigation, B.S.; resources, S.F., T.Z. and A.C.; writing—original draft preparation, A.C. and B.S.; writing—review and editing, A.C., S.F. and T.Z.; visualization, B.S., S.F., T.Z. and A.C.; supervision, S.F., T.Z. and A.C.; project administration, T.Z. and A.C.; funding acquisition, S.F. and T.Z. All authors have read and agreed to the published version of the manuscript.

Funding

This work was supported in part by the French Nouvelle Aquitaine Authorities through the FAST project, in part by the European Commission’s ECSEL Joint Undertaking under Grant n 737454—project TARANTO, and in part by the respective Public Authorities of France, Austria, Germany, Greece, Italy and Belgium.

Data Availability Statement

This study did not report any data.

Acknowledgments

The authors would like to thank ST Microelectronics for Si-hardware and D. Céli for fruitful discussions.

Conflicts of Interest

The authors declare no conflict of interest.

References

  1. Harame, D.; Larson, L.; Case, M.; Kovacic, S.; Voinigescu, S.; Tewksbury, T.; Nguyen-Ngoc, D.; Stein, K.; Cressler, J.; Jeng, S.; et al. SiGe HBT technology: Device and application issues. In Proceedings of the International Electron Devices Meeting, Washington, DC, USA, 10–13 December 1995; pp. 731–734. [Google Scholar] [CrossRef]
  2. Cressler, J.D. SiGe HBT technology: A new contender for Si-based RF and microwave circuit applications. IEEE Trans. Microw. Theory Tech. 1998, 46, 572–589. [Google Scholar] [CrossRef]
  3. Rappaport, T.S.; Xing, Y.; Kanhere, O.; Ju, S.; Madanayake, A.; Mandal, S.; Alkhateeb, A.; Trichopoulos, G.C. Wireless Communications and Applications above 100 GHz: Opportunities and Challenges for 6G and beyond. IEEE Access 2019, 7, 78729–78757. [Google Scholar] [CrossRef]
  4. Heinemann, B.; Rücker, H.; Barth, R.; Bärwolf, F.; Drews, J.; Fischer, G.G.; Fox, A.; Fursenko, O.; Grabolla, T.; Herzel, F.; et al. SiGe HBT with fx/fmax of 505 GHz/720 GHz. In Proceedings of the 2016 IEEE International Electron Devices Meeting (IEDM), San Francisco, CA, USA, 3–7 December 2016; pp. 3.1.1–3.1.4. [Google Scholar] [CrossRef]
  5. Chevalier, P.; Avenier, G.; Ribes, G.; Montagné, A.; Canderle, E.; Céli, D.; Derrier, N.; Deglise, C.; Durand, C.; Quémerais, T.; et al. A 55 nm triple gate oxide 9 metal layers SiGe BiCMOS technology featuring 320 GHz fT/370 GHz fMAX HBT and high-Q millimeter-wave passives. In Proceedings of the 2014 IEEE International Electron Devices Meeting, San Francisco, CA, USA, 15–17 December 2014; pp. 3.9.1–3.9.3. [Google Scholar] [CrossRef]
  6. Schröter, M.; Rosenbaum, T.; Chevalier, P.; Heinemann, B.; Voinigescu, S.P.; Preisler, E.; Böck, J.; Mukherjee, A. SiGe HBT Technology: Future Trends and TCAD-Based Roadmap. Proc. IEEE 2017, 105, 1068–1086. [Google Scholar] [CrossRef]
  7. Schroter, M.; Wedel, G.; Heinemann, B.; Jungemann, C.; Krause, J.; Chevalier, P.; Chantre, A. Physical and Electrical Performance Limits of High-Speed SiGeC HBTs—Part I: Vertical Scaling. IEEE Trans. Electron Devices 2011, 58, 3687–3696. [Google Scholar] [CrossRef]
  8. Schroter, M.; Pawlak, A.; Mukherjee, A. HICUM/L2: A Geometry Scalable Physics-Based Compact Bipolar Transistor Model. August 2013. Available online: https://www.iee.et.tu-dresden.de/iee/eb/forsch/Hicum_PD/Hicum23/hicum_L2V2p32_manual.pdf (accessed on 12 May 2021).
  9. Koldehoff, A.; Schröter, M.; Rein, H.M. A compact bipolar transistor model for very-high-frequency applications with special regard to narrow emitter stripes and high current densities. Solid-State Electron. 1993, 36, 1035–1048. [Google Scholar] [CrossRef]
  10. Schroter, M.; Mukherjee, A.; Chakravorty, A. HICUM-Productization and Support Update. October CMC Meeting, Boston. October 2007. Available online: https://www.iee.et.tu-dresden.de/iee/eb/forsch/AK-Bipo/2007/AKB2007_04_Schroeter_Oct07_HICUM_update.pdf (accessed on 12 May 2021).
  11. Pritchard, R.L. Two-Dimensional Current Flow in Junction Transistors at High Frequencies. Proc. IRE 1958, 46, 1152–1160. [Google Scholar] [CrossRef]
  12. Schröter, M.; Krattenmacher, M. Modeling distributed dynamic lateral large-signal switching effects in bipolar transistors. In Proceedings of the 2019 IEEE 19th Topical Meeting on Silicon Monolithic Integrated Circuits in RF Systems (SiRF), Orlando, FL, USA, 20–23 January 2019; pp. 1–4. [Google Scholar] [CrossRef]
  13. Yadav, S.; Chakravorty, A.; Schroter, M. Modeling of the Lateral Emitter-Current Crowding Effect in SiGe HBTs. IEEE Trans. Electron Devices 2016, 63, 4160–4166. [Google Scholar] [CrossRef]
  14. Williams, D.F.; Marks, R.B. Transmission line capacitance measurement. IEEE Microw. Guid. Wave Lett. 1991, 1, 243–245. [Google Scholar] [CrossRef]
  15. Fregonese, S.; Deng, M.; De Matos, M.; Yadav, C.; Joly, S.; Plano, B.; Raya, C.; Ardouin, B.; Zimmer, T. Comparison of On-Wafer TRL Calibration to ISS SOLT Calibration With Open-Short De-Embedding up to 500 GHz. IEEE Trans. Terahertz Sci. Technol. 2019, 9, 89–97. [Google Scholar] [CrossRef]
  16. Cabbia, M.; Deng, M.; Fregonese, S.; Matos, M.D.; Céli, D.; Zimmer, T. In-Situ Calibration and De-Embedding Test Structure Design for SiGe HBT On-Wafer Characterization up to 500 GHz. In Proceedings of the 2020 94th ARFTG Microwave Measurement Symposium (ARFTG), San Antonio, TX, USA, 26–29 January 2020; pp. 1–4. [Google Scholar] [CrossRef]
  17. Cabbia, M. Sub-Millimeter Wave On-Wafer Calibration and Device Characterization. Ph.D. Thesis, University of Bordeaux, Bordeaux, France, January 2021. [Google Scholar]
  18. Saha, B.; Frégonese, S.; Panda, S.R.; Chakravorty, A.; Céli, D.; Zimmer, T. Collector-substrate modeling of SiGe HBTs up to THz range. In Proceedings of the 2019 IEEE BiCMOS and Compound semiconductor Integrated Circuits and Technology Symposium (BCICTS), Nashville, TN, USA, 3–6 November 2019; pp. 1–4. [Google Scholar] [CrossRef]
  19. VU, V.T.; Celi, D.; Zimmer, T.; Fregonese, S.; Chevalier, P. TCAD Calibration of High-Speed Si/SiGe HBTs in 55-nm BiCMOS. ECS Trans. 2016, 75, 113–119. [Google Scholar] [CrossRef]
  20. Panda, S.R.; Fregonese, S.; Chakravorty, A.; Zimmer, T. TCAD simulation and assessment of anomalous deflection in measured S-parameters of SiGe HBTs in THz range. In Proceedings of the 2019 IEEE BiCMOS and Compound semiconductor Integrated Circuits and Technology Symposium (BCICTS), Nashville, TN, USA, 3–6 November 2019; pp. 1–4. [Google Scholar] [CrossRef]
  21. Raya, C. Modélisation et Optimisation de Transistors Bipolaires à Hétérojonction Si/SiGeC Ultra Rapides Pour Applications Millimétriques. Ph.D. Thesis, University of Bordeaux, Bordeaux, France, July 2008. [Google Scholar]
  22. Raya, C.; Schwartzmann, T.; Chevalier, P.; Pourchon, F.; Celi, D.; Zimmer, T. New Method for Oxide Capacitance Extraction. In Proceedings of the 2007 IEEE Bipolar/BiCMOS Circuits and Technology Meeting, Boston, MA, USA, 30 September–2 October 2007; pp. 188–191. [Google Scholar] [CrossRef]
  23. Ardouin, B.; Zimmer, T.; Mnif, H.; Fouillat, P. Direct method for bipolar base-emitter and base-collector capacitance splitting using high frequency measurements. In Proceedings of the 2001 BIPOLAR/BiCMOS Circuits and Technology Meeting (Cat. No.01CH37212), Minneapolis, MN, USA, 2 October 2001; pp. 114–117. [Google Scholar] [CrossRef]
  24. Schröter, M.; Pawlak, A. A Geometry Scalable Physics-Based Compact Bipolar Transistor Model. Chair for Electron Devices and Integrated Circuits and Dept. of Electrical and Computer Engineering. March 2017. Available online: https://www.iee.et.tu-dresden.de/iee/eb/forsch/Hicum_PD/Hicum23/hicum_L2V2p4p0_manual.pdf (accessed on 12 May 2021).
  25. Fregonese, S.; Lehmann, S.; Zimmer, T.; Schroter, M.; Celi, D.; Ardouin, B.; Beckrich, H.; Brenner, P.; Kraus, W. A computationally efficient physics-based compact bipolar transistor model for circuit Design-part II: Parameter extraction and experimental results. IEEE Trans. Electron Devices 2006, 53, 287–295. [Google Scholar] [CrossRef]
  26. Wakimoto, T.; Akazawa, Y. A low-power wide-band amplifier using a new parasitic capacitance compensation technique. IEEE J. Solid-State Circuits 1990, 25, 200–206. [Google Scholar] [CrossRef]
  27. Voinigescu, S.P.; Dacquay, E.; Adinolfi, V.; Sarkas, I.; Balteanu, A.; Tomkins, A.; Celi, D.; Chevalier, P. Characterization and Modeling of an SiGe HBT Technology for Transceiver Applications in the 100–300-GHz Range. IEEE Trans. Microw. Theory Tech. 2012, 60, 4024–4034. [Google Scholar] [CrossRef]
  28. Galatro, L.; Pawlak, A.; Schroter, M.; Spirito, M. Capacitively Loaded Inverted CPWs for Distributed TRL-Based De-Embedding at (Sub) mm-Waves. IEEE Trans. Microw. Theory Tech. 2017, 65, 4914–4924. [Google Scholar] [CrossRef]
  29. Fregonese, S.; Cabbia, M.; Yadav, C.; Deng, M.; Panda, S.R.; De Matos, M.; Céli, D.; Chakravorty, A.; Zimmer, T. Analysis of High-Frequency Measurement of Transistors Along With Electromagnetic and SPICE Cosimulation. IEEE Trans. Electron Devices 2020, 67, 4770–4776. [Google Scholar] [CrossRef]
  30. Panda, S.R.; Fregonese, S.; Deng, M.; Chakravorty, A.; Zimmer, T. TCAD and EM co-simulation method to verify SiGe HBT measurements up to 500 GHz. Solid-State Electron. 2020, 174, 107915. [Google Scholar] [CrossRef]
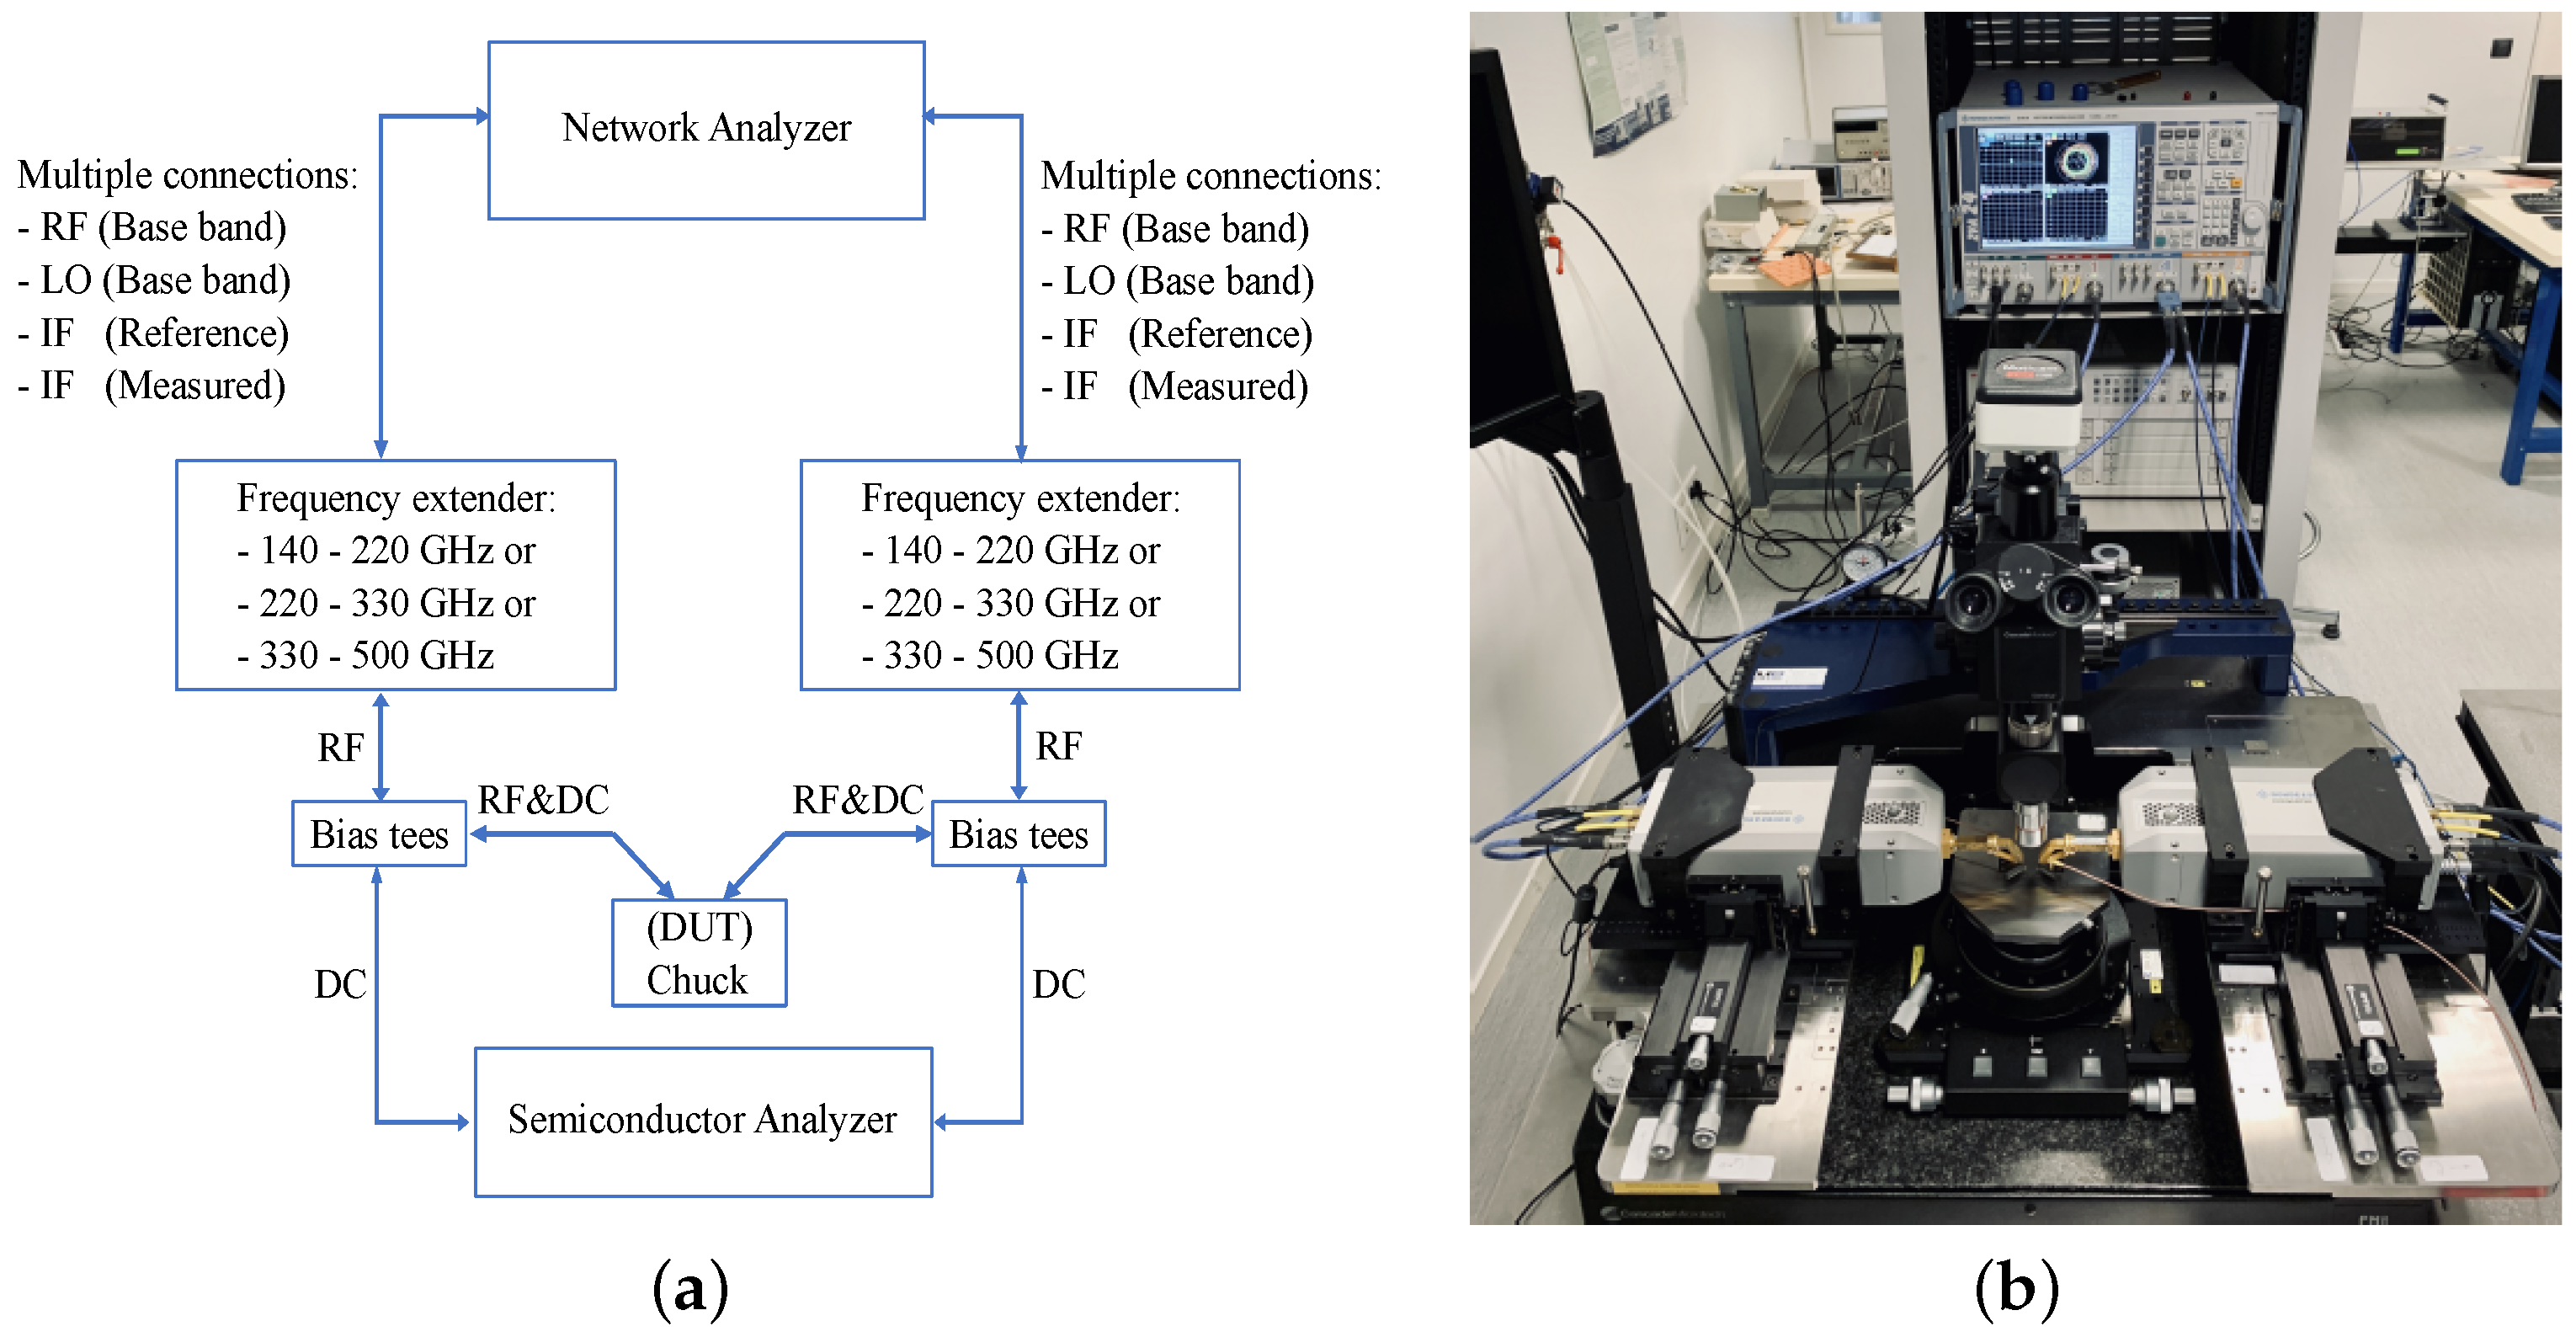
Figure 1. (a) Block diagram of the 140 GHz to 500 GHz measurement set-up, (b) photograph of the probe station for the 140 GHz to 500 GHz measurements, photo taken from [17].
Electronics 10 01397 g001
Figure 2. SiGe HBT device structure: (a) TEM image [21] and (b) structure made in sentaurus TCAD.
Electronics 10 01397 g002
Figure 3. (a) Gummel plots and (b) collector current dependent transit frequency characteristics for a 0.09 μm × 4.8 μm SiGe HBT biased at V B C = 0 V and V B E varying from 0.4 V to 1 V: comparison between measured data (“o” symbol), calibrated T C A D simulation (“+” symbol) and quasi-static HICUM model (solid lines).
Electronics 10 01397 g003
Figure 4. Large-signal equivalent circuit of HICUM with an improved substrate network [18].
Electronics 10 01397 g004
Figure 5. (a) Customized T C A D structure (gray: silicite, blue: p-type poly-Si) and (b) RC equivalent circuit representing the circled region in (a) for the determination of base-emitter parasitic capacitance partitioning factor ( f b e p a r ). Here, B is the external base node.
Electronics 10 01397 g005
Figure 6. Frequency dependent capacitance characteristic for f b e p a r extraction following the customized T C A D structure shown in Figure 5.
Electronics 10 01397 g006
Figure 7. Customized T C A D structure (a) and RC equivalent circuit (b) representing the left circled region for the determination of c j c x . B is the external base node.
Electronics 10 01397 g007
Figure 8. Customized T C A D structure (a) and RC equivalent circuit (b) representing the left circled region for the determination of c j c x + c b c p a r . B is the external base node.
Electronics 10 01397 g008
Figure 9. Frequency dependent capacitance characteristic following the customized T C A D structure shown in Figure 7a (a) and Figure 8a (b) for f b c p a r extraction.
Electronics 10 01397 g009
Figure 10. (a) Turn-on and (b) turn-off characteristics for the collector current i C ( t ) : comparison between T C A D (symbols) and HICUM (solid line with a l i t = 1) for a 0.09 μm × 4.8 μm SiGe HBT biased at constant V C E = 0.9 V (circles) and 0.85 V (plus). V B E s ( t ) have been shown as a dashed line to the right Y-axis.
Electronics 10 01397 g010
Figure 11. Variation of electric field (left axis) and carrier density (right axis) captured at 20 ps (solid line) and 26 ps (solid line with symbols). The bias voltages V B E = V C E are ramped up from 0 V to 0.9 V at 18 ps with a rise time of 2 ps. The value ‘0’ on the x-axis refers to the position where the poly-emitter and mono-emitter meet.
Electronics 10 01397 g011
Figure 12. Time dependent turn-on stored minority charge (in the emitter and base): comparison between T C A D (symbols) and HICUM (solid line with a l q f = 1) for the 0.09 μm × 4.8 μm SiGe HBT biased at V B E = 0.9 V (circle) and V B E = 0.85 V (plus), V B C = 0 V. V B E s ( t ) have been shown as a dashed line to the right Y-axis.
Electronics 10 01397 g012
Figure 13. Sensitivity of f b e p a r on frequency dependent y 11 for the 0.09 μm × 4.8 μm SiGe HBT biased at V B C = 0 V with V B E = 0.85 V: comparison between T C A D (circles) and Hicum L2v2.4 (solid line).
Electronics 10 01397 g013
Figure 14. Sensitivity of f b c p a r on frequency dependent y 12 (a), y 12 (b) and y 11 (c) for the 0.09 μm × 4.8 μm SiGe HBT biased at V B C = 0 V with V B E = 0.85 V: comparison between T C A D (circles) and Hicum L2v2.4 (solid line).
Electronics 10 01397 g014
Figure 15. Sensitivity of a l i t on frequency dependent y 21 (a) and P h a s e h 21 (b) for the 0.09 μm × 4.8 μm SiGe HBT biased at V B C = 0 V with V B E = 0.85 V: comparison between T C A D (circles) and Hicum L2v2.4 (solid line).
Electronics 10 01397 g015
Figure 16. Sensitivity of a l q f on frequency dependent y 11 (a) and y 11 (b) for the 0.09 μm × 4.8 μm SiGe HBT biased at V B C = 0 V with V B E = 0.85 V: comparison between T C A D (circles) and Hicum L2v2.4 (solid line).
Electronics 10 01397 g016
Figure 17. Sensitivity of f c r b i on frequency dependent z 11 (a) and z 11 (b) for the 0.09 μm × 4.8 μm SiGe HBT biased at V B C = 0 V with V B E = 0.85 V: comparison between T C A D (circles) and Hicum L2v2.4 (solid line).
Electronics 10 01397 g017
Figure 18. Frequency dependent magnitude of scattering parameters for the 0.09 μm × 4.8 μm SiGe HBT biased at V B C = 0 V with V B E = 0.8 V and 0.85 V: comparison between measured data (rectangles and circles), T C A D (triangle and cross) and HICUM (solid lines).
Electronics 10 01397 g018
Figure 19. Frequency dependent phase of scattering parameters for the 0.09 μm × 4.8 μm SiGe HBT biased at V B C = 0 V with V B E = 0.8 V and 0.85 V: comparison between measured data (rectangles and circles), T C A D (triangle and cross) and HICUM (solid lines).
Electronics 10 01397 g019
Table 1. 55 nm BICMOS technological data.
Structural ParametersValues
Layout width (W)2.78 µm
Layout length (L)5.12 µm
Width of deep trench0.42 µm
Depth of deep trench3.5 µm
Depth access1 µm
Substrate contact from DT0.8 µm
Width of substrate contact0.1 µm
N s u b 1.5 × 10 15 cm 3
N p w e l l 4.5 × 10 16 cm 3
N b u r i e d l a y e r 5 × 10 19 cm 3
Publisher’s Note: MDPI stays neutral with regard to jurisdictional claims in published maps and institutional affiliations.