Article

Identification of Prognostic Factors and Predicting the Therapeutic Effect of Laser Photocoagulation for DME Treatment

1
Department of Technical Cybernetics, Samara National Research University, 443086 Samara, Russia
2
Image Processing Systems Institute of the RAS-Branch of the FSRC “Crystallography and Photonics RAS”, 443001 Samara, Russia
3
Department of Ophthalmology, Samara State Medical University, 443099 Samara, Russia
4
Institute of Eye Diseases, 119021 Moscow, Russia
*
Author to whom correspondence should be addressed.
Electronics 2021, 10(12), 1420; https://doi.org/10.3390/electronics10121420
Submission received: 15 May 2021 / Revised: 7 June 2021 / Accepted: 9 June 2021 / Published: 12 June 2021

Abstract

:
Diabetic retinopathy is among the most severe complications of diabetes, most often leading to rapid and irreversible vision loss. The laser coagulation procedure, which consists of applying microburns to the fundus, has proven to be an effective method for treating diabetic retinopathy. Unfortunately, modern research does not pay enough attention to the study of the arrangement of microburns in the edema area—One of the key factors affecting the quality of therapy. The aim of this study was to propose a computational decision-making support system for retina laser photocoagulation based on the analysis of photocoagulation plans. Firstly, we investigated a set of prognostic factors based on 29 features describing the geometric arrangement of coagulates. Secondly, we designed a technology for the intelligent analysis of the photocoagulation plan that allows the effectiveness of the treatment to be predicted. The studies were carried out using a large database of fundus images from 108 patients collected in clinical trials. The results demonstrated a high classification accuracy at a level of over 85% using the proposed prognostic factors. Moreover, the designed technology proved the superiority of the proposed algorithms for the automatic arrangement of coagulates, predicting a 99% chance of a positive therapeutic effect.

1. Introduction

Diabetes mellitus (DM) is among the most significant medical problems of the contemporary world [1]. DM is the most common pathology among endocrine diseases. The number of diabetic patients is steadily increasing every year, which is associated with both earlier detection of the disease and an overall increase in life expectancy [2,3,4]. Today, the number of diabetic patients in the world has almost reached 400 million, and by 2035, this number is expected to reach 592 million people [5].
Diabetes mellitus is associated with serious complications, which, unfortunately, can lead to even more serious consequences in cases of untimely or inadequate treatment. In particular, DM leads to changes in retinal blood vessels, which cause oxygen supply disturbance. This condition of the visual system results in diabetic retinopathy (DRP) [6]. One of the most severe complications of DRP is diabetic macular edema (DME), which can lead to blindness [7,8,9,10,11] (Figure 1). According to the Wisconsin Epidemiological Study of Diabetic Retinopathy (WESDR), if the duration of DM exceeds 20 years, retinopathy is detected in 80–100% of cases, while DME develops in 29% of cases [12,13].
Currently, considerable attention is being paid to the development of methods and algorithms for analyzing fundus images in order to detect anomalies [14], perform their segmentation and classification [15,16], and automate medical diagnostics [17,18,19]. However, along with diagnostics, a crucial problem is to determine the optimal treatment procedure because insufficient effectiveness of treatment leads to persistent DME and an irreversible reduction in visual acuity.
DME therapy is a complex process that includes both non-surgical and surgical laser techniques. There are various laser-based strategies to treat DME: laser photocoagulation, subthreshold micropulse diode laser therapy, laser therapy combined with pharmacological treatment [20]. The main treatment technique for diabetic macular edema today is laser photocoagulation of the macular zone of the retina [21,22,23]. This technique involves the application of numerous dosed microburns (laser coagulates) in the area of the edema. The major disadvantage of the technique is that the laser damages some of the light-sensitive nerve cells in the retina and macula, which often results in vision loss.
Subthreshold micropulse diode laser therapy uses lasers that deliver short pulses that cause less thermal damage than laser photocoagulation. Numerous studies show that micropulse laser treatment has the same effectiveness as a conventional laser [20,24]. Unfortunately, the outcomes of subthreshold micropulse diode laser cannot be observed using ophthalmic imaging methods such as biomicroscopy or spectral-domain optical coherence tomography.
The final strategy combines the application of pharmacological treatment with laser therapy [24]. Since visual acuity improvement after laser therapy is relatively slow, the additional pharmacotherapy provides significant benefits. This is the most modern and promising, but least researched strategy.
This paper aims to improve the laser photocoagulation treatment, which effectiveness depends both on the laser itself (wavelength, power, pulse duration) and on the method of arranging the coagulates (pattern, number and location of burns) [25,26]. The therapeutic effect can be significantly reduced by an increased intensity of laser exposure, increased damage to the retina in cases of accidental contact outside the edema zone, an increased distance between coagulates, as well as their application to blood vessels, retinal hemorrhages and “hard” exudates [27].
Clinical studies demonstrate that the effectiveness of diabetic retinopathy treatment depends, to a greater extent, on the interposition of coagulates [25]. The template used determines the uniformity of the distribution of laser energy on the pigment epithelium, as well as the optimality of temperature distribution in the area of laser exposure. The best result is achieved by applying coagulates at an equal distance from each other and preventing them from entering the anatomical structures of the retina and beyond the edema area.
The existing laser installations provide the application of coagulates in two modes: manual and semi-automatic [28]. In manual mode, the coagulates are applied one at a time. Semi-automatic mode allows coagulates to be applied in series, grouped into figures of a regular pre-set shape (Figure 2).
The most advanced solution for the semi-automatic application of coagulants, allowing high treatment efficiency to be achieved, is the Navilas device [29,30]. The disadvantage of this approach is the inability to determine the optimal location for coagulates when edema shapes and the vascular patterns inside them have high variability. This is primarily due to a limited choice of patterns, which often do not correspond to either the edema shape or the course of vessels. If the coagulates are applied manually one by one, then the uniformity of their location will be subjective, and planning will require much more time.
To solve the problem of automating the location of coagulates, we proposed a technology that includes methods and algorithms for processing fundus images and comparing them with optical coherence tomography data to identify the zones of laser exposure and fill them with laser coagulates under conditions where the geometric shapes of retinal damage and the locations of anatomical (vessels, foveola) and pathological structures (hard exudate, hemorrhage) in this area are highly variable [27,31,32,33,34].
However, a much more important issue is the preliminary assessment of the therapeutic effect according to the proposed arrangement of coagulates, which would allow a quality criterion to be identified that would determine the most effective configuration of coagulates. In this article, we propose a method for assessing the characteristics of the photocoagulation plan and predicting the therapeutic effect.

2. Materials and Methods

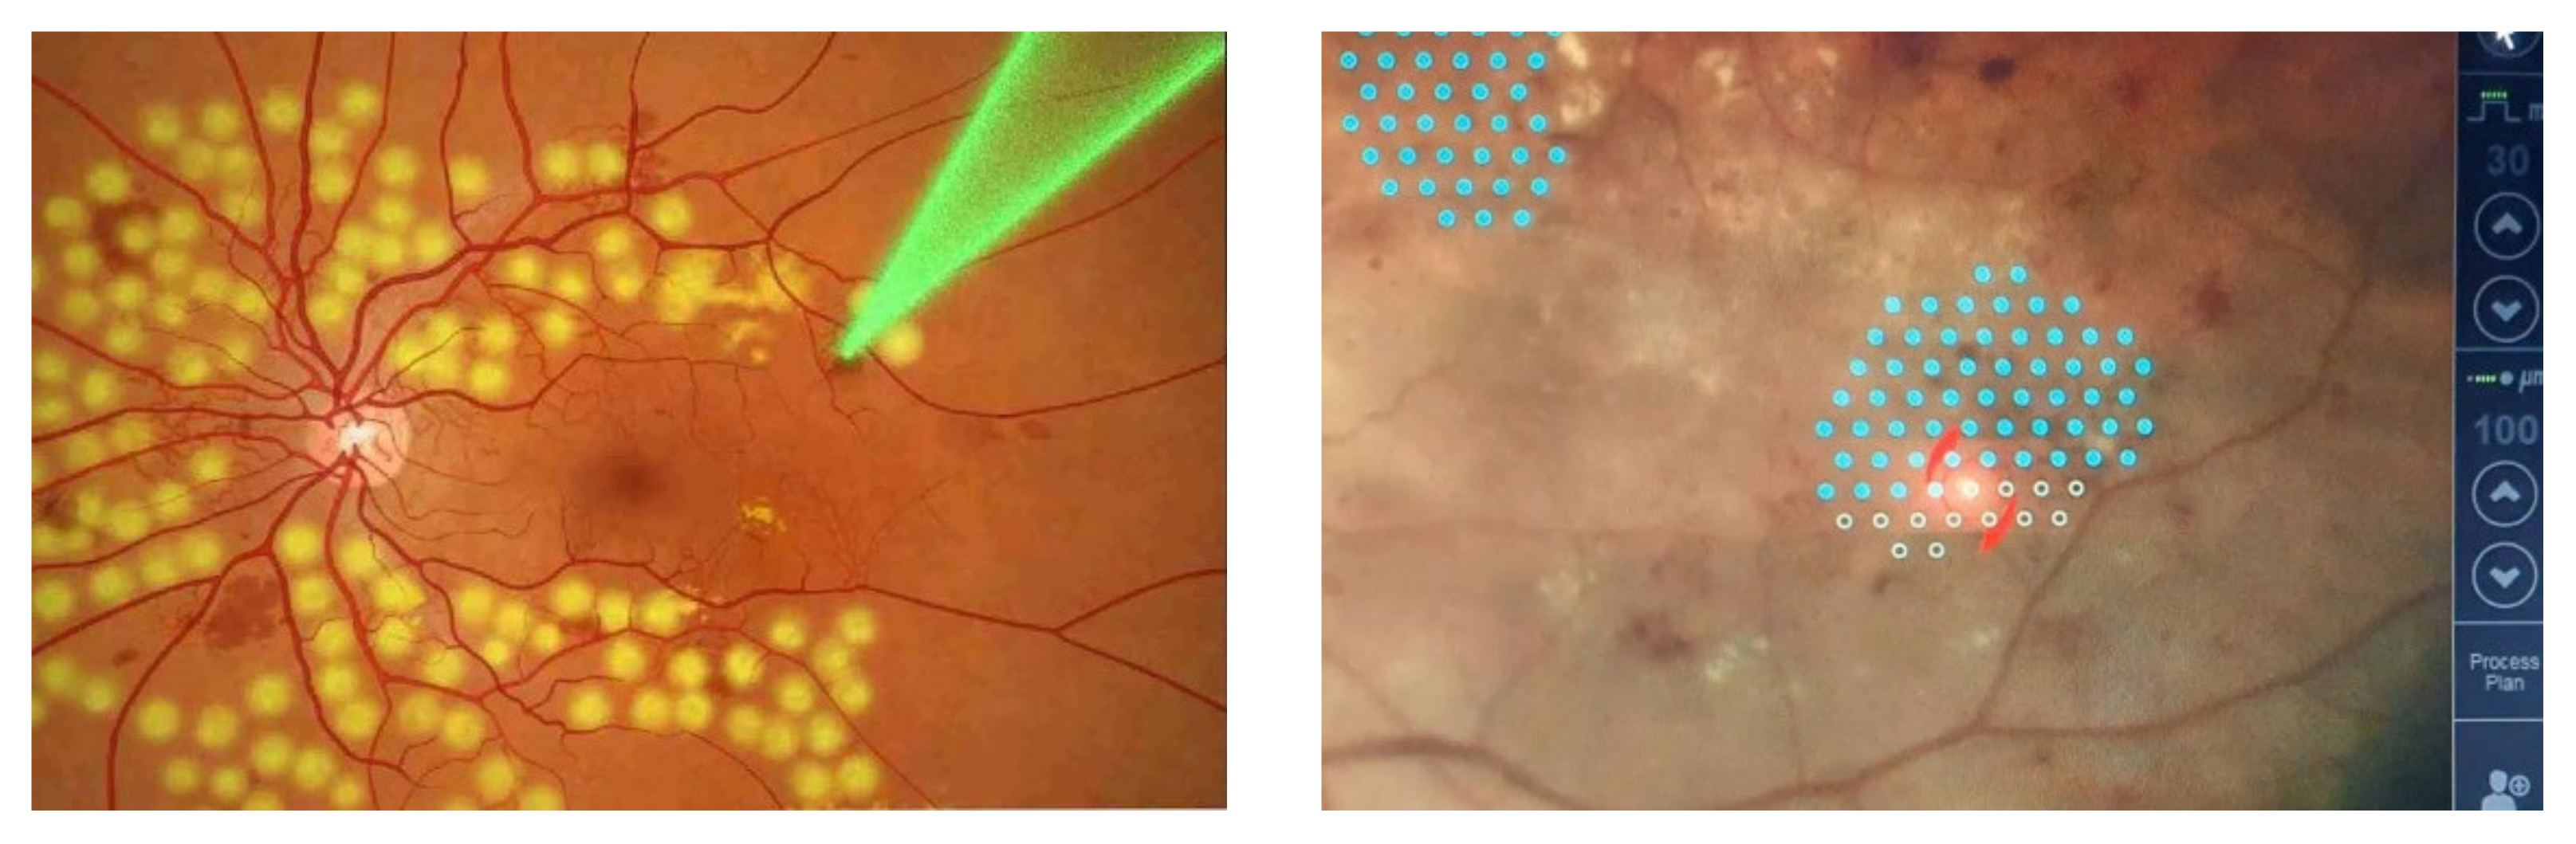
2.1. Research Material

In the course of joint work with the Samara Regional Clinical Ophthalmological Hospital, named after T.I. Eroshevsky, a large database of fundus images of patients was created for analysis of the effectiveness of diabetic retinopathy treatment. The sample of patients was evaluated from the medical point of view and was investigated using digital processing methods and intelligent image analysis.
The research material included images of the fundus of 108 patients (167 eyes), obtained immediately after laser photocoagulation of the retina to eliminate diabetic macular edema. The effect of laser treatment is achieved when laser radiation hits one of the layers of the retina—The pigment epithelium. Retinal vessels, retinal hemorrhages and “hard” exudate are located in front of the pigment epithelium, and accidental coagulates on these structures do not allow the desired effect to be achieved. Furthermore, laser photocoagulation of the retina, along with the therapeutic effect, leads to its destruction and the development of side effects including loss of central visual fields. The application of coagulates outside the area of edema on healthy retina increases this side effect. The medical assessment of fundus photographs consisted of marking the number of blocked coagulates that were located on vessels, solid exudate, retinal hemorrhages, and the number of excess coagulates that were outside of the edema area. Blocked coagulates were marked in blue, and redundant coagulates were marked in red (Figure 3).
Based on 100 marked images, a training sample was formed containing image fragments of the right eyes grouped by classes: optic disc—574,752 fragments; macula—708,755 fragments; vessels—126,692 fragments; newly formed vessels—2 fragments; solid exudate—65,475 fragments; soft exudate—84,239 fragments; fresh coagulates—364 fragments; pigmented coagulates—1976 fragments; retinal hemorrhages—100,771 fragments; healthy areas—1,155,448 fragments.
The database of fundus images and optical coherence tomography images collected in the course of clinical practice is currently the most complete, and is the only suitable database for research purposes. Available open datasets of this kind do not allow all objectives to be fulfilled. Considering the most popular open data sources, we should mention a database of 1087 fundus images collected at the Joint Shantou International Eye Center (JSIEC) [35]. However, the images in this database are intended for classification into 37 classes, not for segmentation; the database does not contain examples of patients with diabetic retinopathy; and it does not contain images of optical coherence tomography of the retina associated with the fundus images. The high-resolution fundus (HRF) image database contains only 45 images, and only 15 of them are the examples of diabetic retinopathy lesions [36]. The dataset does not contain corresponding optical coherence tomography images. There is a database of images of optical coherence tomography, mentioned in [37] and containing 80,000 sections of optical coherence tomography of the retina, but there are no corresponding fundus images in it.
The study was approved by Bioethics Commission for Research at Samara State Medical University. The digital images used in this study were acquired with all the required authorizations. Furthermore, each patient signed a form to provide consent for this study and each acquired image has been treated anonymously. All of the experiments presented were carried out in accordance with the approved guidelines.

2.2. Expert Evaluation of the Effectiveness of Diabetic Macular Edema (DME) Treatment

In addition to assessing the quality of arranging the coagulates, a medical assessment of overall treatment effectiveness was performed. The treatment was considered successful if both the visual acuity improved and the mean retinal thickness decreased. If either the visual acuity decreased or the retinal thickness increased as a result of the treatment, then the treatment was considered unsuccessful. Ophthalmologists use a customary point system, shown in Table 1, to assess treatment success. The result of the point system is a number from −2 to 2, where −2 indicates that the treatment led to negative consequences, and 2 indicates that the treatment was successful. However, there are some cases where the treatment cannot be given 2 points. There can be occasions when it is no longer possible to improve visual acuity due to the peculiarities of the course of the disease; however, it is possible to eliminate further development of the disease, preventing increased visual impairment.
Table 2 contains the possible classes corresponding to the fundus condition after treatment. We will use 2 general classes to predict the success of the operation. Due to the fact that there are cases when the treatment may not lead to any positive results, but at the same time, it eliminates further development of the disease, the class “Treatment did not give any result” was also considered as a safe treatment—That is, the treatment does not lead to negative effects.

2.3. Identification of Prognostic Factors

When assessing the quality of treatment, doctors are mostly guided by the analysis of the photocoagulation plan. Within the framework of this article, the photocoagulation plan means a set of points corresponding to the centers of coagulates. On the basis of a particular location of coagulates, various prognostic signs can be formed, such as the coverage area and statistical characteristics of a random variable corresponding to the distances between the centers of coagulates. The area of coverage with coagulates is proportional to the dimension of the sample, since the radii of the coagulates are the same. We will use the histogram of the distances between the coagulates to assess the statistical characteristics of the photocoagulation plan.
We will form a sample of distances in three ways:
1.
NearestPoint—The closest point geometrically is selected for each point and the distance between them is calculated.
2.
GenDelaunay—Delaunay triangulation is built for all points and the distances are calculated for the connected points.
3.
LocDelaunay—The algorithm is similar to the previous one, but the Delaunay triangulation is not built over all the points, but over closed local areas. For this purpose, a preliminary clustering is performed.
Based on the resulting samples, the selected statistical characteristics are calculated that are best suited for the current objective:
  • Arithmetic mean;
  • Variance;
  • Root-mean-square deviation (RMS);
  • Median;
  • Kurtosis;
  • Asymmetry;
  • Minimum value;
  • Maximum value;
  • Mode.
Thus, each of the three methods performs a computation of the 9 features. Two common features are added to the general set:
  • The number of coagulates;
  • The number of local areas.
Figure 4 shows a scheme for the computation of characteristics for a particular photocoagulation plan.
Each of the features presented allows the degree of a particular prognostic factor to be described. Table 3 shows the main prognostic factors and their corresponding characteristics.
The uniformity refers to the degree of frequently occurring minimum distances. The closer the median is to the minimum distance, the more regular the arrangement of the coagulates is. The coverage area is the total area covered by coagulates. The balance determines the degree of correctness of the sample shape—That is, the higher the balance is, the more correct the shape of the histogram. The uniformity of the histogram determines how close the random variable is to the uniform distribution law. The more uniform the random variable is, the greater the number of different distances found in the pattern of the coagulates is. The uniformity of the histogram should be minimized. The determinism shows how similar a sample is to non-random outliers. In other words, low determinism indicates that the arrangement of coagulates is highly random.

2.4. Technology for Intelligent Analysis of the Photocoagulation Plan

To study the selected features, an intelligent analysis technology was developed, allowing the quality of classification to be analyzed using the method of discriminant analysis (Figure 5) [38].
The first stage is to categorize the database of operations performed, described by the image of the fundus and the set of arranged coagulates, into the classes “successful operation” and “unsuccessful operation” according to the scoring system described in Section 2.2.
Then, a set of features is calculated that describe the photocoagulation plan. Due to the small number of features, the feature space analysis is of greater interest from the point of view of not reducing the dimension, but rather increasing the accuracy.
The feature space analysis includes the study of linear separability and classification accuracy. Due to the small dimension of the sample, in addition to the standard division of the sample into the training part and the test part, a U-method, also known as leave-one-out cross-validation, was used. The technology identifies sets of effective features based on discriminant analysis and the enumeration of feature combinations.

2.5. Algorithms for Automatic Arrangement of Coagulates

As noted earlier, the automatic arrangement of coagulates in the laser exposure zone is of utmost interest, as this would not only allow the speed of the operation to be increased, but, theoretically, would also ensure the optimal photocoagulation plan.
Existing hardware/software methods are primarily based on the use of predetermined patterns for the coagulate arrangement. Unfortunately, due to the high variability in edema and vasculature forms, the pattern filling leads to an irregular arrangement of coagulates. As a result, the quality of coagulate filling in the edema zone is sacrificed to the speed of the operation. To solve the problem of optimal arrangement of coagulates, we proposed a new approach based on the application of sphere packing algorithms in the specified area of interest [31].
The approach for determining the optimal arrangement of coagulates consists of three stages. Firstly, the fundus image (Figure 6a) is segmented into the macular region, large vessels, healthy sections and the area of potential laser exposure (Figure 6b). Secondly, the area of interest is filled with spheres (coagulates) to achieve the densest possible coverage (Figure 6c). Finally, a set of potential centers of coagulates is transferred to the fundus image for the laser coagulation procedure (Figure 6d). It should be noted that the fundus image in Figure 6a already contains microburns, which makes it possible to visually compare the manual and automatic arrangement of coagulates.
Earlier, we proposed 7 automatic algorithms (maps) for arranging coagulates [31,32]:
1.
Random (Figure 7a);
2.
Square (Figure 7b);
3.
Hexagonal (Figure 7c);
4.
Wave (Figure 7d);
5.
Boundary (Figure 7e);
6.
Adaptive boundary (Figure 7f).
Figure 7. Algorithms for automatic arrangement of coagulates: (a) random map; (b) square map; (c) hexagonal map; (d) wave map; (e) boundary map; (f) adaptive boundary map.
Electronics 10 01420 g007
The first algorithm simply adds coagulates in a random position inside the area of interest until all the area is covered. It is mostly intended for comparison as an example of uneven filling.
The second and third algorithms simulate the template filling used in the Navilas system: square and hexagonal patterns. These algorithms demonstrate the best coagulate arrangement that Navilas is capable of under ideal conditions, since in practice the coagulation plan is still manually formed by the doctor. Thus, it will be especially interesting to compare their effectiveness with the other algorithms.
The rest of the algorithms are particular solutions of the close packing problem of circles in an arbitrary closed area, which are described in detail in our previous paper [31].
The main obstacle to analyzing the effectiveness of treatment involving algorithms for the automatic arrangement of coagulates is the lack of possibility of testing them on real patients. As a result, a separate objective is to predict the effectiveness of treatment of macular edema using a preformed arrangement of coagulates.

3. Results

3.1. Comparison of Manual and Semi-Automatic Arrangement of Coagulates

The first stage of the research included the comparison of manual and semi-automatic arrangement of coagulates based on the existing database of the marked images. The root-mean-square deviation calculated by the NearestPoint method was chosen as the quality criterion.
The results showed that the least uniform arrangement of coagulates is observed in the manual monopulse mode—The root-mean-square deviation was 8.44 (7.82–9.21). The root-mean-square deviation in cases of semi-automatic application was significantly better and was, on average, 8.16 (6.95–8.9).
The experiment confirmed that semi-automatic arrangement allows an increase in the uniformity of the application of coagulates to be achieved. In addition, this research demonstrated once again the relevance of the development and implementation of fully automatic methods for the arrangement of coagulates, which provides even better uniformity of application of coagulates, as shown by previous studies.

3.2. Investigation of the Technology of the Intelligent Analysis of the Preliminary Photocoagulation Plan

There are a number of approaches used to increase the informativeness of features: correlation analysis, regression analysis, factor analysis, cluster analysis, and discriminant analysis. From the point of view of classification efficiency, the most promising method is discriminant analysis [39]. The method is used to find a linear combination of features that separates two or more classes.
First of all, it was necessary to discard the correlated features to perform the discriminant analysis, the main stage of the proposed technology. A strong correlation between features negatively affects the classification result, increases input dimension and can also lead to singular scattering matrices [40]. A normalized correlation value was calculated for each pair of features presented in Section 2.3. If the normalized value in the modulus appeared to be higher than a certain threshold r, then the features were considered correlated. The value 0.9 was chosen as the threshold r. After excluding, only 16 uncorrelated features remained in the set (Table 4).
The general features (the number of areas and coagulates) do not unambiguously correlate with any of the pairs as they characterize the extensionality of coagulates rather than the mutual arrangement characteristics. The discriminant analysis allows a transformation matrix of the original features to be formed in order to pass to the feature space of the smallest possible dimension.
As a result, the following sets of features were formed:
  • Initial set—All the 26 selected features (Initial);
  • Threshold features—The features with the weight of not less than 0.1 (Threshold);
  • Combination of N features—A set formed as a result of complete enumeration of all combinations and selection of a set with the maximum separability criterion (Comb_5, Comb_6, Comb_7, Comb_8, Comb_9);
  • Informative features—a set of features obtained as a result of applying the transformation matrix to the uncorrelated features (Informative).
It should be noted that the discriminant analysis allows the effective sets of features to be identified using algorithms that are less computationally complex than a full enumeration of combinations of features.
Table 5 shows the results of classification accuracy for different sets of features using the Bayes classifier, decision trees and random forest. This choice was based on the fact that the Bayes classifier corresponds to linear classification, while decision trees and random forest provide non-linear separability of classes [41].
Decision trees and random forest show the best results in a new feature space after applying the transformation matrix (Informative). It can be assumed that the accuracy of 85% is optimal when choosing a classifier for solving the forecasting problem. The Bayes classifier satisfies this assumption; in addition, with the Bayes classifier, posterior probabilities can be estimated, which will show whether it is recommended to use the automatically generated photocoagulation plan.
The sensitivity and specificity for the current sample of patients were 80%. Taking into account that the sample categorization was based on real information from positive or negative changes in the patient’s fundus, such accuracy is justified. The categorization is performed without the doctor’s expert assessment of the photocoagulation plan quality, but on the basis of the patient follow-up information.

3.3. Investigation of the Algorithms of Automatic Arrangement of Coagulates

The automatic arrangement of coagulates in the area of laser exposure, which can be marked by a doctor, is of utmost interest. It is assumed that the coagulates are arranged only within this zone. In addition, the coagulates are applied in such a way that the distance between the coagulates is not less than the predetermined one. This approach prevents the laser from hitting the forbidden areas and minimizes overall retinal damage.
Based on the proposed technology of intelligent analysis of the photocoagulation plan, a prognostic study of the therapy quality was performed using the Bayes classifier and the algorithms for the automatic arrangement of coagulates. The following sets of features were calculated within the study:
  • Informative—The features identified in Section 3.2;
  • Strict—The features that have demonstrated good classification accuracy separately;
  • Empirical—The features chosen by doctors.
The results of the research are presented in Table 6.
The random map involves the application of coagulates to the laser exposure area randomly and corresponds to an ineffective arrangement of coagulates, since the algorithm is not aimed at achieving maximum uniformity of the photocoagulation plan. The square and hexagonal maps correspond to pattern-based methods of arrangement of coagulates—That is, they use templates: squares or hexes. The algorithms involving the wave, boundary, adaptive boundary and ordered maps correspond to an irregular arrangement—That is, an arrangement without any consistent pattern, but they provide maximum filling density.
The results of Table 6 demonstrate that the informative features allowed the random map, which was ineffective, to be distinguished better from the rest of the maps. All the sets indicate that the adaptive boundary map has the highest probability of operation success. This map is not regular, but it provides the highest filling density. It should be especially noted that the advanced irregular maps (boundary and adaptive boundary) performed significantly better than even the ideal Navilas maps (square and hexagonal).

4. Discussion

This work proposes a technology of intelligent analysis of the photocoagulation plan. The technology allows an effective set of features to be identified, facilitating assessment of therapy quality. In addition, this technology makes it possible to predict the therapeutic effect, based on the patient database, by assessing the probability of operation success for the new photocoagulation plan.
The technology of the intelligent analysis of the photocoagulation plan allowed informative features to be selected that were used for forecasting. Taking into account the peculiarities of the sample, the classification accuracy was provided at the level of over 85% and did not exceed this threshold. The application of the informative features made it possible to clearly identify ineffective photocoagulation plans. The plan is recommended for use if the probability of operation success is at least 90%. This condition is satisfied by the boundary and adaptive boundary maps, which provide the maximum filling density. However, plans with a probability of operation success of at least 80% can also be considered for treatment.
Despite the fact that the computational experiments have shown quite promising results, further development of the proposed technique is impossible without rigorous clinical trials assessing the efficiency and safety of treatment. In this regard, the main advantage of the developed methods and algorithms is that they improve the already existing technique for DME treatment and do not require hardware changes. On the contrary, the proposed technique can be implemented as a software module and integrated into existing devices, such as Navilas.
The development of the approach for determining the optimal arrangement of coagulates and the technology of the intelligent analysis of the photocoagulation plan is only the first step towards a new personalized DME treatment strategy. As the next step to improve the quality of DME treatment, we plan to restore the three-dimensional structure of the fundus using flat optical coherence tomography images and simulate heat propagation through the structure. The use of optimal laser coagulation parameters can increase the efficiency of laser exposure, reduce the traumatic effect and maximize the overall therapeutic effect.

Author Contributions

Methodology, A.S. and E.Z.; validation, R.P. and N.D.; resources, E.Z. and A.A.; writing—Original draft, D.K. and A.S.; writing—Review and editing, D.K.; supervision, N.I.; funding acquisition, N.I. and A.A. All authors have read and agreed to the published version of the manuscript.

Funding

Russian Foundation for Basic Research (19-29-01135); Ministry of Science and Higher Education of the Russian Federation within (Government project).

Institutional Review Board Statement

The study was conducted according to the guidelines of the Declaration of Helsinki, and approved by the Bioethics Committee of Samara State Medical University (protocol #137, 11 December 2013).

Informed Consent Statement

Informed consent was obtained from all subjects involved in the study.

Acknowledgments

This work was partly funded by the Russian Foundation for Basic Research and the RF Ministry of Science and Higher Education under a government project of FSRC “Crystallography and Photonics” RAS and Samara University.

Conflicts of Interest

The authors declare no conflict of interest.

References

  1. Vorobieva, I.V.; Merkushenkova, D.A. Diabetic retinopathy in patients with type 2 diabetes mellitus. Epidemiology, a modern view of pathogenesis. Ophthalmology 2012, 9, 18–21. [Google Scholar]
  2. Dedov, I.I.; Shestakova, M.V.; Vikulova, O.K. State Register of Diabetes Mellitus in the Russian Federation: Status of 2014 and Development Prospects. Diabetes Mellit. 2015, 18, 5–23. [Google Scholar]
  3. Dedov, I.I.; Shestakova, M.V.; Galstyan, G.R. Prevalence of type 2 diabetes mellitus in the adult population of Russia (NATION study). Diabetes Mellit. 2016, 19, 104–112. [Google Scholar] [CrossRef] [Green Version]
  4. Zhang, X.; Saaddine, J.B.; Chou, C.F. Prevalence of diabetic retinopathy in the United States, 2005–2008. JAMA 2010, 304, 649–656. [Google Scholar] [CrossRef] [PubMed]
  5. Guariguata, L.; Whiting, D.R.; Hambleton, I.; Beagley, J.; Linnenkamp, U.; Shaw, J.E. Global estimates of diabetes prevalence for 2013 and projections for 2035. Diabetes Res. Clin. Pract. 2014, 103, 137–149. [Google Scholar] [CrossRef]
  6. Zheng, Y.; He, M.; Congdon, N. The worldwide epidemic of diabetic retinopathy. Indian J. Ophthalmol. 2012, 60, 428. [Google Scholar] [PubMed]
  7. Ixcamey, M.; Palma, C. Diabetic macular edema. Dis. Mon. 2021, 67, 101138. [Google Scholar] [CrossRef]
  8. Tan, G.S.; Cheung, N.; Simo, R. Diabetic macular edema. Lancet Diab. Endoc. 2017, 5, 143–155. [Google Scholar] [CrossRef]
  9. Doga, A.V.; Kachalina, G.F.; Pedanova, E.K.; Buryakov, D.A. Modern diagnostic and treatment aspects of diabetic macular edema. Ophthalmol. Diabetes 2014, 4, 51–59. [Google Scholar] [CrossRef] [Green Version]
  10. Bratko, G.V.; Chernykh, V.V.; Sazonova, O.V. On early diagnostics and the occurence rate of diabetic macular edema and identification of diabetes risk groups. Sib. Sci. Med. J. 2015, 35, 33–36. [Google Scholar]
  11. Wong, T.Y.; Liew, G.; Tapp, R.J. Relation between fasting glucose and retinopathy for diagnosis of diabetes: Three population-based cross-sectional studies. Lancet 2008, 371, 736–743. [Google Scholar] [CrossRef] [Green Version]
  12. Klein, R.; Klein, B.E.K.; Moss, S.E.; Davis, M.D.; DeMets, D.L. The Wisconsin Epidemiologic Study of Diabetic Retinopathy IV. Ophthalmology 1984, 91, 1464–1474. [Google Scholar] [CrossRef]
  13. Amirov, A.N.; Abdulaeva, E.A.; Minkhuzina, E.L. Diabetic macular edema: Epidemiology, pathogenesis, diagnosis, clinical presentation, and treatment. Kazan Med. J. 2015, 96, 70–74. [Google Scholar] [CrossRef] [Green Version]
  14. Lee, J.; Lee, J.; Cho, S.; Song, J.; Lee, M.; Kim, S.H.; Lee, J.Y.; Shin, D.H.; Kim, J.M.; Bae, J.H.; et al. Development of Decision Support Software for Deep Learning-Based Automated Retinal Disease Screening Using Relatively Limited Fundus Photograph Data. Electronics 2021, 10, 163. [Google Scholar] [CrossRef]
  15. Ghani, A.; See, C.H.; Sudhakaran, V.; Ahmad, J.; Abd-Alhameed, R. Accelerating Retinal Fundus Image Classification Using Artificial Neural Networks (ANNs) and Reconfigurable Hardware (FPGA). Electronics 2019, 8, 1522. [Google Scholar] [CrossRef] [Green Version]
  16. Sri Durga Kameswari, S.; Krishna Kishore, K. Classification of Retinal Fundus Images Based on Alexnet and Transfer Learning. Int. J. Sci. Technol. Res. 2020, 9, 2004–2006. [Google Scholar]
  17. Luo, L.; Xue, D.; Feng, X. Automatic Diabetic Retinopathy Grading via Self-Knowledge Distillation. Electronics 2020, 9, 1337. [Google Scholar] [CrossRef]
  18. Bodapati, J.D.; Naralasetti, V.; Shareef, S.N.; Hakak, S.; Bilal, M.; Maddikunta, P.K.R.; Jo, O. Blended Multi-Modal Deep ConvNet Features for Diabetic Retinopathy Severity Prediction. Electronics 2020, 9, 914. [Google Scholar] [CrossRef]
  19. Acharya, U.R.; Ng, E.Y.; Tan, J.H.; Sree, S.V.; Ng, K.H. An integrated index for the identification of diabetic retinopathy stages using texture parameters. J. Med. Syst. 2012, 36, 2011–2020. [Google Scholar] [CrossRef] [PubMed]
  20. Yun, S.H.; Adelman, R.A. Recent developments in laser treatment of diabetic retinopathy. Middle East Afr. J. Ophthalmol. 2015, 22, 157–163. [Google Scholar] [CrossRef]
  21. Kozak, I.; Luttrull, J.K. Modern retinal laser therapy. Saudi J. Ophthalmol. 2015, 29, 137–146. [Google Scholar] [CrossRef]
  22. Astakhov, Y.S.; Shadrichev, F.E.; Krasavina, M.I.; Grigorieva, N.N. Modern approaches to the treatment of diabetic macular edema. Ophthalmol. Statements 2009, 4, 59–69. [Google Scholar]
  23. Zamytsky, E.A.; Zolotarev, A.V.; Karlova, E.V.; Zamytsky, P.A. Analysis of the coagulates intensity in laser treatment of diabetic macular edema in a Navilas robotic laser system. Saratov J. Med. Sci. Res. 2017, 13, 375–378. [Google Scholar]
  24. Park, Y.G.; Kim, E.Y.; Roh, Y.J. Laser-based strategies to treat diabetic macular edema: History and new promising therapies. J. Ophthalmol. 2014, 2014, 769213. [Google Scholar] [CrossRef] [Green Version]
  25. Moutray, T.; Evans, J.R.; Lois, N.; Armstrong, D.J.; Peto, T.; Azuara-Blanco, A. Different lasers and techniques for proliferative diabetic retinopathy. Cochrane Database Syst. Rev. 2018, 3, CD012314. [Google Scholar] [CrossRef] [Green Version]
  26. Soleimani, A.; Rasta, S.H.; Banaei, T.; Asgharsharghi Bonab, A. Effects of Laser Physical Parameters on Lesion Size in Retinal Photocoagulation Surgery: Clinical OCT and Experimental Study. J. Biomed. Phys. Eng. 2017, 7, 355–364. [Google Scholar] [PubMed]
  27. Shirokanev, A.; Ilyasova, N.; Andriyanov, N.; Zamytskiy, E.; Zolotarev, A.; Kirsh, D. Modeling of Fundus Laser Exposure for Estimating Safe Laser Coagulation Parameters in the Treatment of Diabetic Retinopathy. Mathematics 2021, 9, 967. [Google Scholar] [CrossRef]
  28. Chhablani, J.; Kozak, I.; Barteselli, G.; El-Emam, S. A novel navigated laser system brings new efficacy to the treatment of reti-novascular disorders. Oman J. Ophthalmol. 2013, 6, 18–22. [Google Scholar] [CrossRef] [PubMed]
  29. Chhablani, J.; Mathai, A.; Rani, P.; Gupta, V.; Arevalo, J.F.; Kozak, I. Comparison of Conventional Pattern and Novel Navigated Panretinal Photocoagulation in Proliferative Diabetic Retinopathy. Investig. Ophthalmol. Vis. Sci. 2014, 55, 3432–3438. [Google Scholar] [CrossRef] [Green Version]
  30. Neubauer, A.S.; Langer, J.; Liegl, R.; Haritoglou, C.; Wolf, A.; Kozak, I.; Seidensticker, F.; Ulbig, M.; Freeman, W.R.; Kampik, A.; et al. Navigated macular laser decreases retreatment rate for diabetic macular edema: A comparison with conventional macular laser. Clin. Ophthalmol. 2013, 7, 121–128. [Google Scholar]
  31. Ilyasova, N.; Kirsh, D.; Paringer, R.; Kupriyanov, A.; Shirokanev, A.; Zamycky, E. Coagulate map formation algorithms for laser eye treatment. In Proceedings of the 3rd International Conference on Frontiers of Signal Processing ICFSP, Paris, France, 6–8 September 2017; pp. 120–124. [Google Scholar]
  32. Shirokanev, A.S.; Kirsh, D.V.; Ilyasova, N.Y.; Kupriyanov, A.V. Investigation of algorithms for coagulate arrangement in fundus images. Comput. Opt. 2018, 42, 712–721. [Google Scholar] [CrossRef]
  33. Ilyasova, N.Y.; Demin, N.S.; Shirokanev, A.S.; Kupriyanov, A.V.; Zamytskiy, E.A. Method for selection macular edema region using optical coherence tomography data. Comput. Opt. 2020, 44, 250–258. [Google Scholar] [CrossRef]
  34. Shirokanev, A.S.; Kibitkina, A.S.; Ilyasova, N.Y. Information technology of laser coagulation strategy selection in diabetic retinopathy treatment. In Proceedings of the Computer Science & Information Technology (CS & IT), Barcelona, Spain, 10–12 June 2020; pp. 59–64. [Google Scholar]
  35. Claro, M.; Veras, R.; Santana, A.; Araújo, F.; Silva, R.; Almeida, J.; Leite, D. An hybrid feature space from texture information and transfer learning for glaucoma classification. J. Vis. Commun. Image Represent. 2019, 64, 102597. [Google Scholar] [CrossRef]
  36. Budai, A.; Bock, R.; Maier, A.; Hornegger, J.; Michelson, G. Robust Vessel Segmentation in Fundus Images. Int. J. Biomed. Imaging 2013, 2013, 154860. [Google Scholar] [CrossRef] [PubMed] [Green Version]
  37. Kermany, D.S.; Goldbaum, M.; Cai, W.; Valentim, C.C.; Liang, H.; Baxter, S.L.; McKeown, A.; Yang, G.; Wu, X.; Yan, F.; et al. Identifying Medical Diagnoses and Treatable Diseases by Image-Based Deep Learning. Cell 2018, 172, 1122–1131. [Google Scholar] [CrossRef]
  38. Ilyasova, N.Y.; Shirokanev, A.S.; Kupriyanov, A.V.; Paringer, R.A. Technology of intellectual feature selection for a system of automatic formation of a coagulate plan on retina. Comput. Opt. 2019, 43, 304–315. [Google Scholar] [CrossRef]
  39. Huy, N.H.; Frenzel, S.; Bandt, C. Two-Step Linear Discriminant Analysis for Classification of EEG Data. In Data Analysis, Machine Learning and Knowledge Discovery; Springer: Cham, Switzerland, 2014; pp. 51–59. [Google Scholar]
  40. Smolle, J. Computer recognition of skin structures using discriminant and cluster analysis. Ski. Res. Technol. 2008, 6, 58–63. [Google Scholar] [CrossRef]
  41. Ghosh, J.; Shuvo, S.B. Improving Classification Model’s Performance Using Linear Discriminant Analysis on Linear Data. In Proceedings of the 10th International Conference on Computing, Communication and Networking Technologies (ICCCNT), Kanpur, India, 6–8 July 2019; pp. 1–5. [Google Scholar] [CrossRef]
Figure 1. Diagnostic images of fundus without pathologies (left) and with pathology (right).
Electronics 10 01420 g001
Figure 2. An example of applying coagulates manually (left) and with the Navilas software (right).
Electronics 10 01420 g002
Figure 3. Examples of medical marking of coagulates in fundus images.
Electronics 10 01420 g003
Figure 4. Scheme for the computation of features for a photocoagulation plan.
Electronics 10 01420 g004
Figure 5. The technology for intelligent analysis of the preliminary photocoagulation plan.
Electronics 10 01420 g005
Figure 6. The approach for determining the optimal arrangement of coagulates: (a) fundus image; (b) segmentation into areas of interest; (c) automatic arrangement of coagulates; (d) formation of photocoagulation plan.
Electronics 10 01420 g006
Table 1. Point system for the evaluation of treatment success.
CommentScore
Visual acuity improved+1
Visual acuity unchanged 0
Visual acuity decreased−1
Mean retinal thickness decreased+1
Mean retinal thickness unchanged0
Mean retinal thickness increased−1
Table 2. Description of classes.
Initial ClassesQualitative ClassesGeneral Classes
The treatment was successfulThe treatment led to positive effectSafe treatment
Only visual acuity improved
Only retinal thickness improved
The treatment did not lead to positive effectThe treatment did not give any result
Visual acuity improved, but retinal thickness worsenedAmphibolic effect of the treatmentDangerous treatment
Retinal thickness improved, but visual acuity worsened
Visual acuity worsenedNegative effect of the treatment
Retina condition worsened
The treatment led to negative effect
Table 3. Correspondence of characteristics and prognostic factors.
Prognostic FactorCharacteristics
UniformityMedian
Coverage areaSample dimension
BalanceAsymmetry, Kurtosis, Minimum distance, Maximum distance
Histogram uniformityArithmetic mean, Variance
Determinism Variance, Arithmetic mean, Median, Minimum distance, Maximum distance
Table 4. Uncorrelated features.
NearestPointGenDelaunayLocDelaunayGeneral
Arithmetic mean
RMS
Kurtosis
Asymmetry
Minimum
Arithmetic mean
RMS
Kurtosis
Median
Minimum
Arithmetic mean
RMS
Kurtosis
Maximum
The number of local areas
The number of coagulates
Table 5. Classification results for different sets of features.
Sets of FeaturesClassification Accuracy %
BayesDecision TreesRandom Forest
Initial66.470.782.8
Threshold69.774.986.0
Comb_583.977.475.7
Comb_686.973.976.5
Comb_768.974.874.8
Comb_883.480.882.5
Comb_981.880.078.3
Informative86.287.987.9
Table 6. The results of predicting the therapeutic effect of photocoagulation plans generated automatically.
MapForecast %
Informative
Features
Strict
Features
Empirical
Features
Random 62.291.987.7
Square 86.295.885.5
Hexagonal 84.798.995.0
Wave 88.099.197.0
Boundary 94.499.397.6
Adaptive boundary95.499.598.1
Ordered89.399.297.0
Square island88.096.486.3
Hexagonal island88.299.196.0
Publisher’s Note: MDPI stays neutral with regard to jurisdictional claims in published maps and institutional affiliations.

