1. Introduction
Pneumonia is a lung parenchyma inflammation often caused by pathogenic microorganisms, factors of physical and chemical, immunologic injury and other pharmaceuticals. There are several popular pneumonia classification methods: (1) pneumonia is classified as infectious and non-infectious based on different pathogeneses in which infectious pneumonia is then classified to bacteria, virus, mycoplasmas, chlamydial pneumonia, and others, while non-infectious pneumonia is classified as immune-associated pneumonia, aspiration pneumonia caused by physical and chemical factors, and radiation pneumonia. (2) Pneumonia is classified as CAP (community-acquired pneumonia), HAP (hospital-acquired pneumonia) and VAP (ventilator-associated pneumonia) based on different infections, among which CAP accounts for a larger part. Because of the different range of pathogens, HAP is easier to develop resistance to various antibiotics, making treatment more difficult.
Pneumonia kills more than 800,000 children under five per year, with around 2200 deaths every day. There are more than 1400 children infected with pneumonia per 100,000 children [
1]. The Global Burden of Disease Study reported that lower respiratory tract infections, including pneumonia, were the second largest cause of death in 2013. In Europe, nearly 35% of patients in hospital are infected with pneumococcal disease and worldwide, the percentage is 27.3% [
2]. In India, the latest report of John Hopkins Bloomberg School of Public Health has said that India suffers the most pneumonia deaths and in 2015, there were about 2.97 lakh pneumonia and diarrhea deaths in children aged less than five years old. In addition, in 2015 worldwide, pneumonia was the top killer of children under five years old [
3]. Moreover, the death rate of pneumonia is highly related to age, and the prevalence of pneumonia increases dramatically with age, especially in people older than 65 [
4]. The large number of child deaths by pneumonia alarms scientists worldwide to propose more effective and acute methods to detect pneumonia. With technology developing, more and more measures are developed, in which radiology-based methods are most popular and useful. Diagnostic radiological techniques for pulmonary disease include chest X-ray imaging, computed tomography (CT), and magnetic resonance imaging (MRI), among which chest X-ray imaging is most effective and economical as it is more available and portable in hospital and has lower exposures of dose radioactivity for patients.
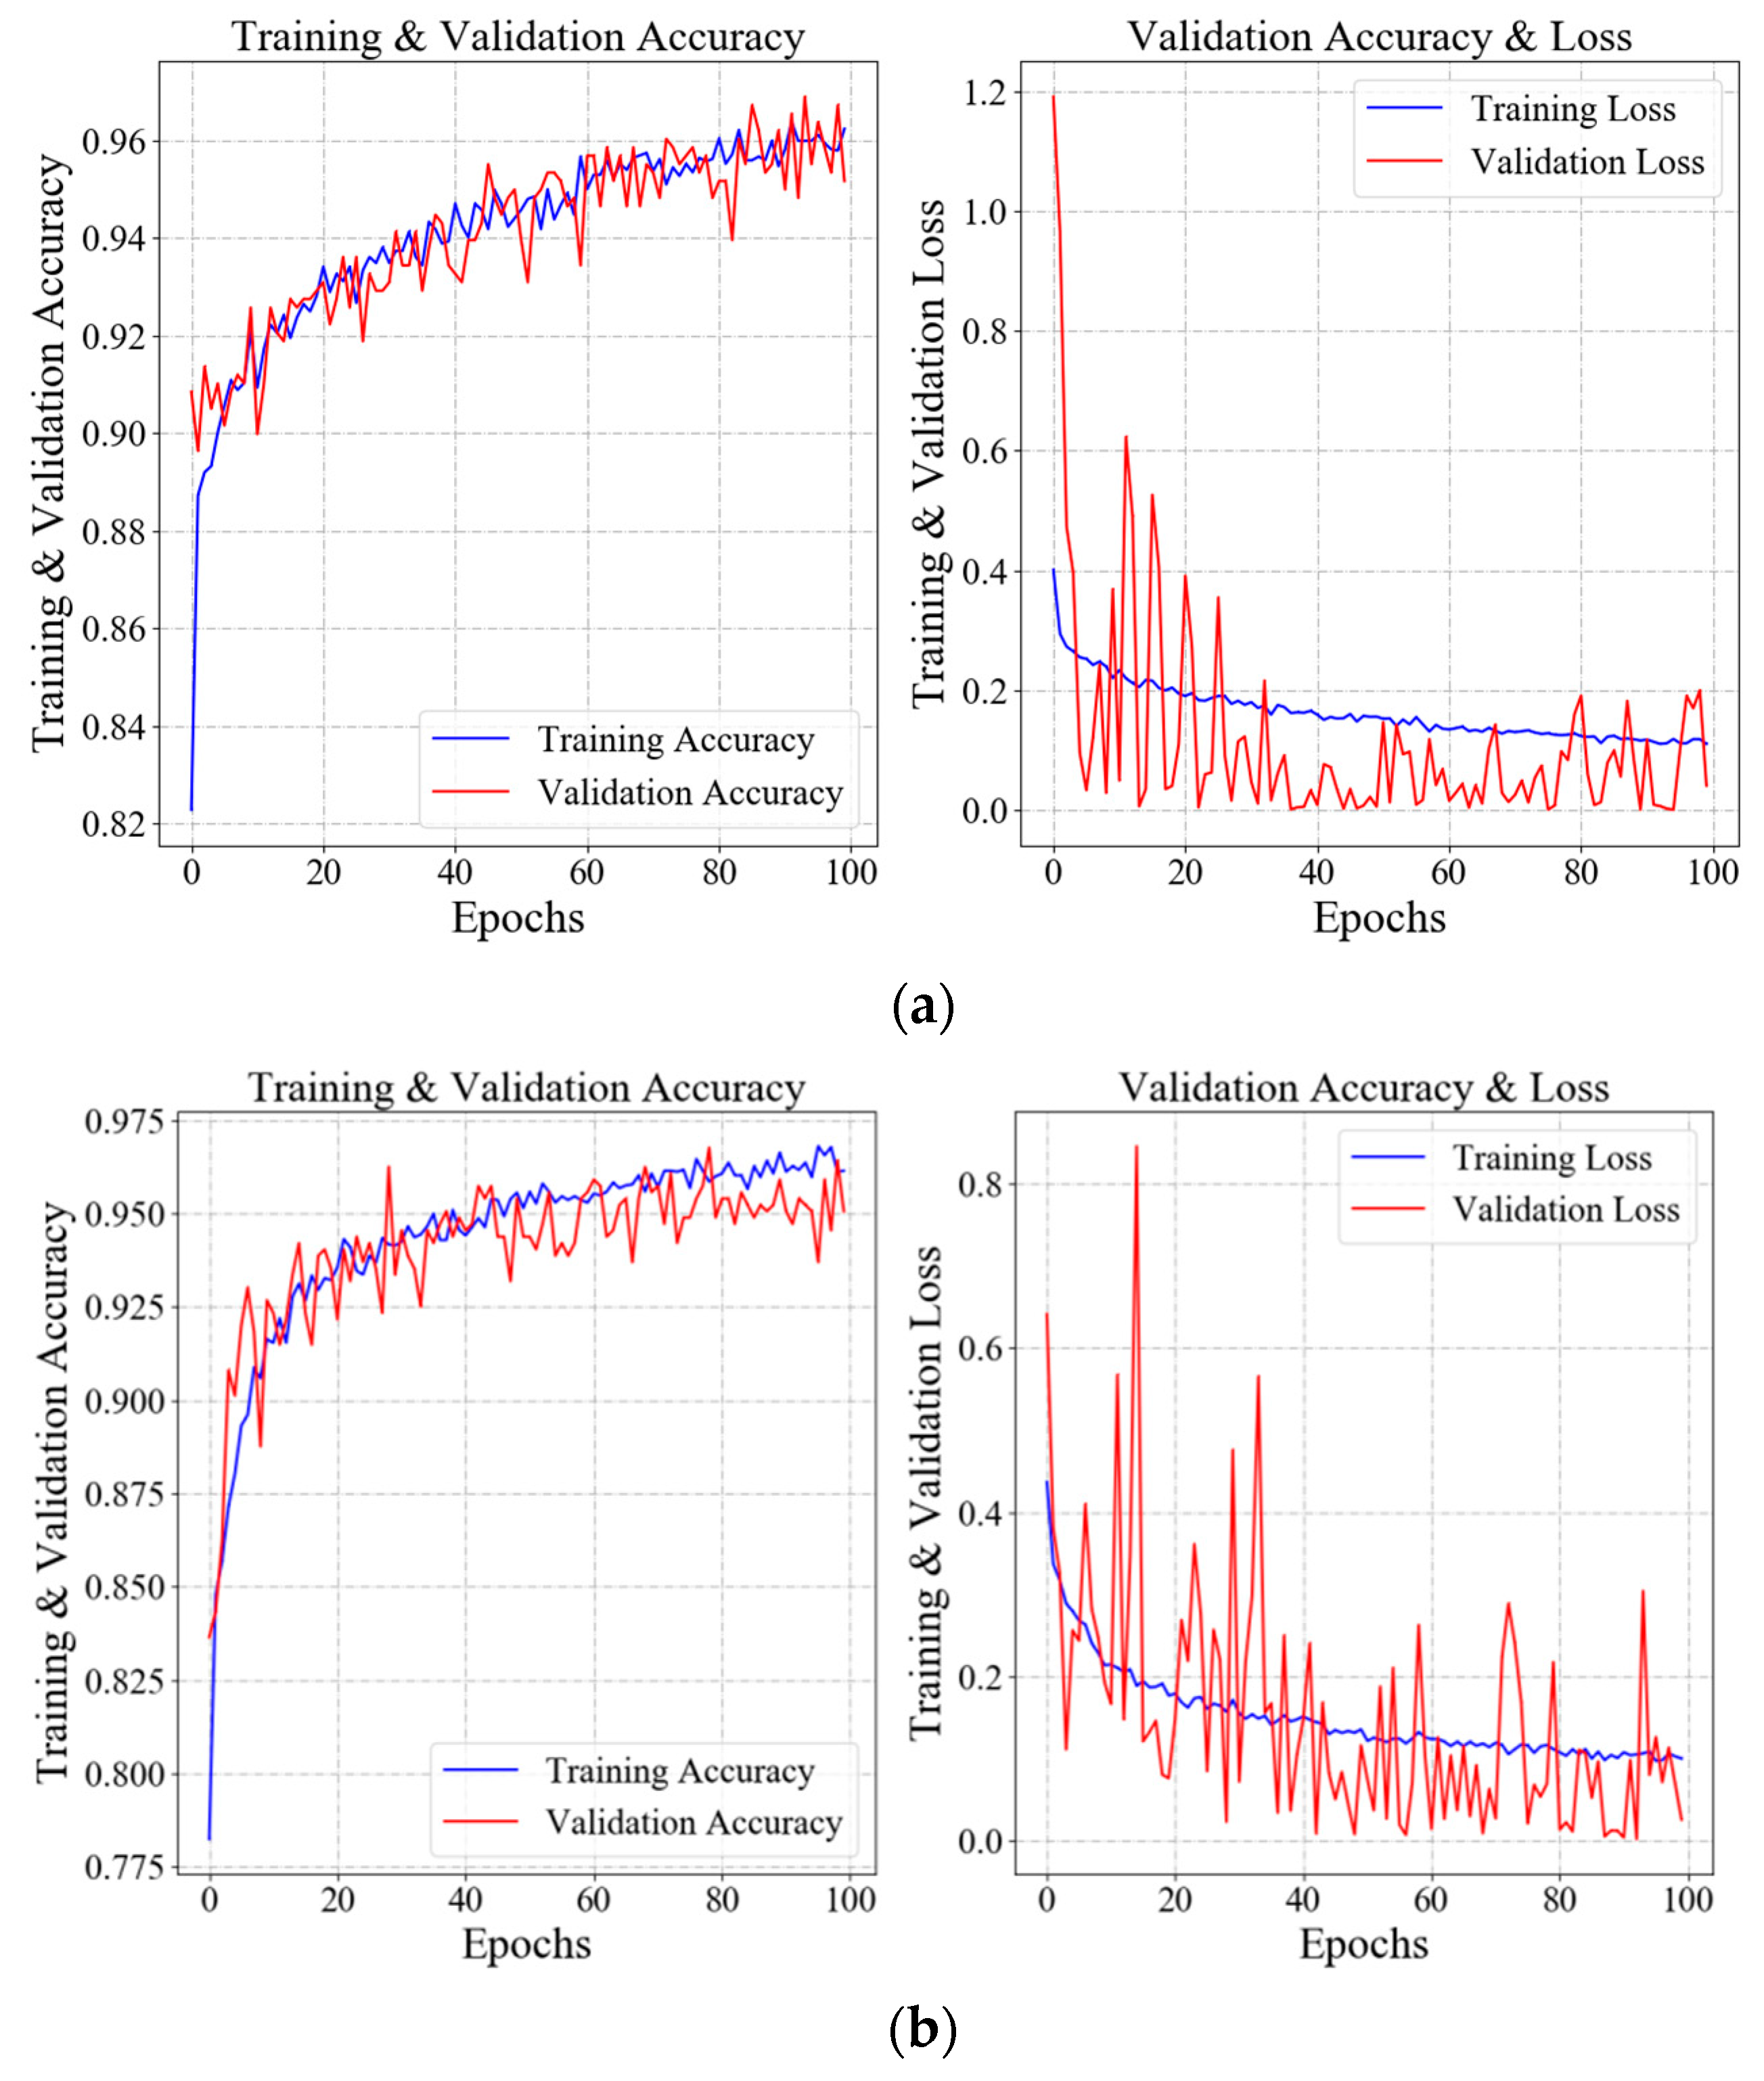
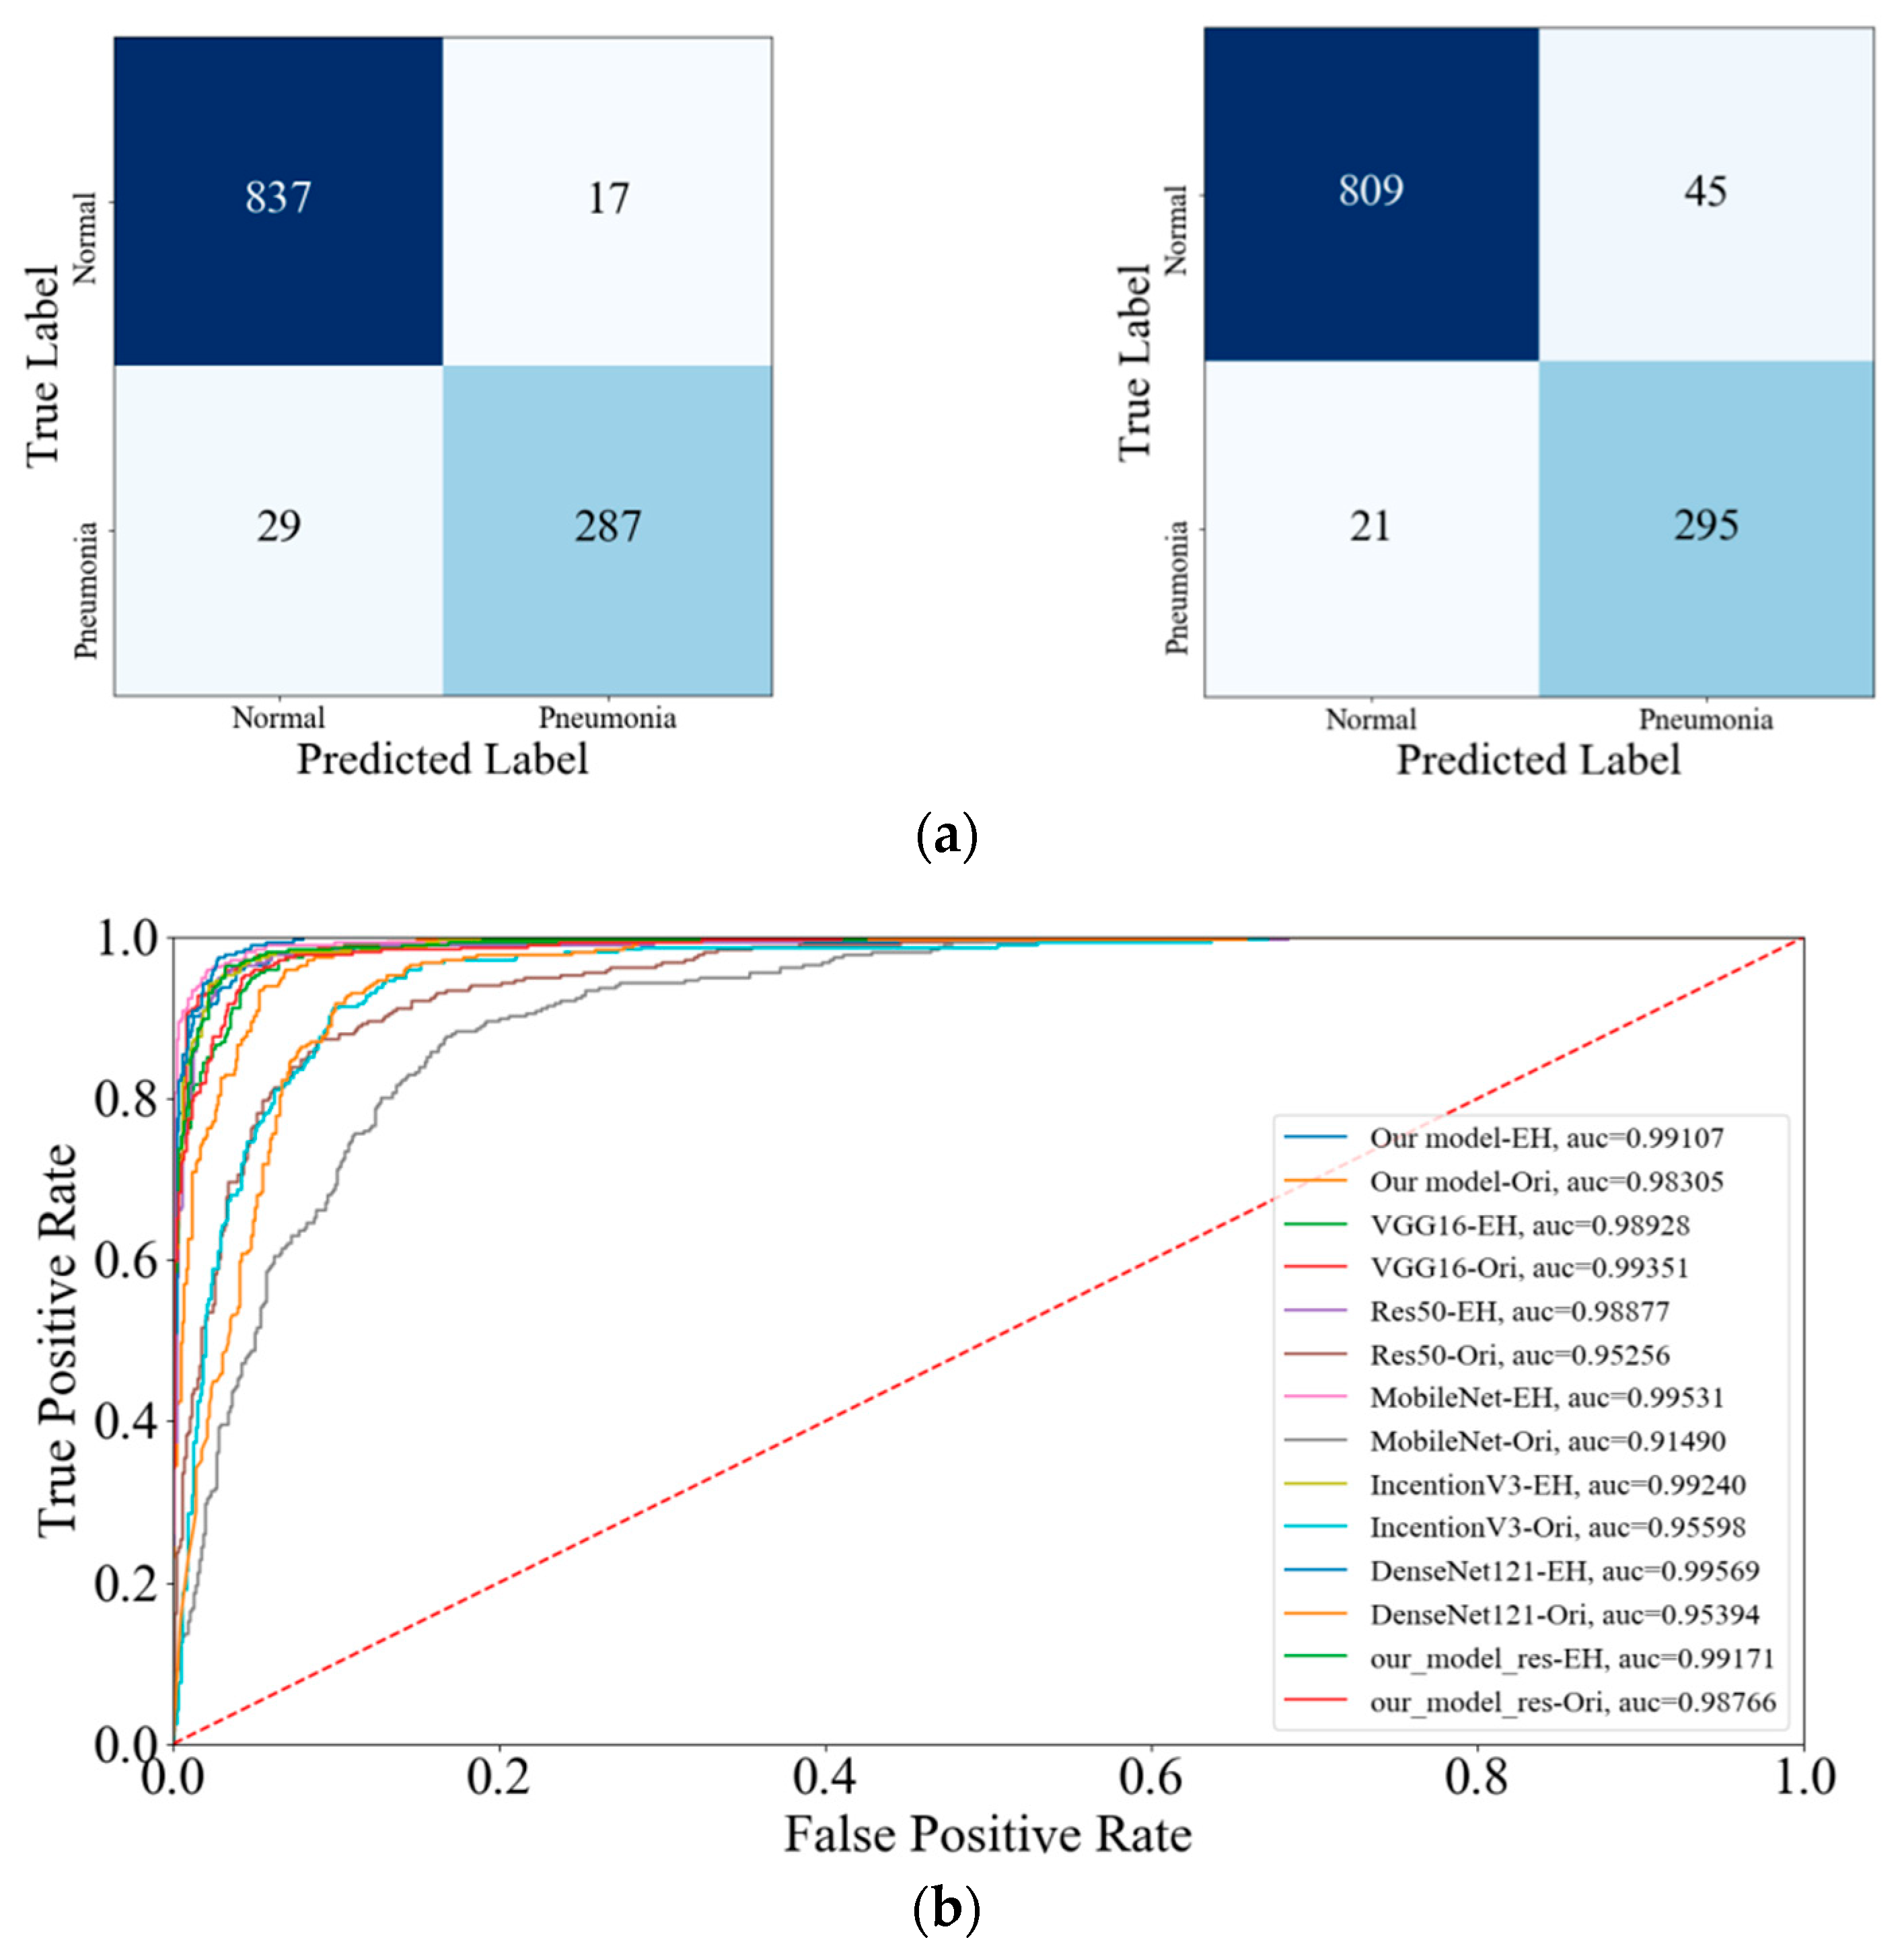
However, even for very professional and experienced doctors, the diagnosis of pneumonia through X-ray images is still a tremendous task because X-ray images have similar region information for different diseases, such as lung cancer. Therefore, it is very time-consuming and energy-consuming to diagnose pneumonia through traditional methods and impossible to diagnose whether a patient suffers pneumonia through a standardized process. Hence, in this study, we propose a Convolutional Neural Network to diagnose pneumonia through X-ray images automatically and obtain results of accuracy 96.07% and Area Under Curve (AUC) 0.9911.
The rest of this paper is organized as follows.
Section 2 describes related literature reviews of medical image processing methods.
Section 3 describes a brief process of Convolutional Neural Networks (CNN) architecture in recent several years.
Section 3 illustrated a summary of background of this machine learning and deep learning.
Section 4 primarily illustrates the data utilized in this study, our proposed methods, and training procedure.
Section 5 provides the experiments and results.
Section 6 describes the conclusion of this study.
2. Related Work
Several methods have been introduced to describe a brief process in pneumonia detection using chest X-ray images in recent years, especially some deep learning methods. Deep Learning has been successfully applied to improve the performance of computer-aided diagnosis technology (CAD), especially in the field of medical imaging [
5], image segmentation [
6,
7] and image reconstruction [
8,
9]. In 2017, Rajpurkar et al. [
10] proposed a classical deep learning network named DenseNet-121 [
11], which was a 121-layer CNN model to accelerate the diagnosis for pneumonia. In contrast to experienced doctors, the framework obtained a higher F1 score. Besides, in order to alleviate the effect of imbalanced classes, the team introduced Weighted Binary Cross-Entropy loss, whose difference between the Binary Cross Entropy loss was the different weights of imbalanced classes according to the number of each class.
However, the proposed loss did account for the different training difficulty levels of classes. In order to solve the problem of poor generalization ability caused by over-fitting and the problem of spatial sparseness caused by ordinary convolution operation, residual connection network [
12] and dilated convolution [
13] were used by Liang et al. [
14] in the backbone network model. The final recall rate and F1 score of their model reached 96.7% and 92.7%, respectively. The CNN model proposed by Jain et al. [
15] combined with transfer learning that effectively used the image features learned in large dataset, sped up the training procedure of the model and made it more difficult to fall into local minimum points. In addition, two models were proposed to train. Moreover, the dataset used by Jain et al. was from the world-famous organization and competition site named Kaggle, which contains numerous competitions and attracts passionate competitors to achieve a higher rank. The dataset is split into three subsets: the training subset to train the model, the validation subset to adjust parameters of model, and the test subset to verify the generalization ability of model.
Verma et al. [
16] adopted several data pre-processing procedures and data augmentation methods, like a random rotation of images and a random translation of the image in horizontal and vertical, which enlarged the dataset and enhanced the representation ability of their CNN model. Finally, their model obtained an extremely outstanding accuracy. Ayan et al. [
17] adopted transfer learning and fine-tuning to train two classical CNN models, Xception-Net and VGG16-Net, to classify images containing pneumonia. The authors [
18] proposed four efficient CNN models, which were two pre-trained models, ResNet152V2 and MobileNetV2, a CNN architecture, and a Long Short-Term Memory (LSTM) network. In addition, they compared different parameters trained by each model. Their four models achieved results of more than 91% in accuracy, recall, F1-score, precision, and AUC.
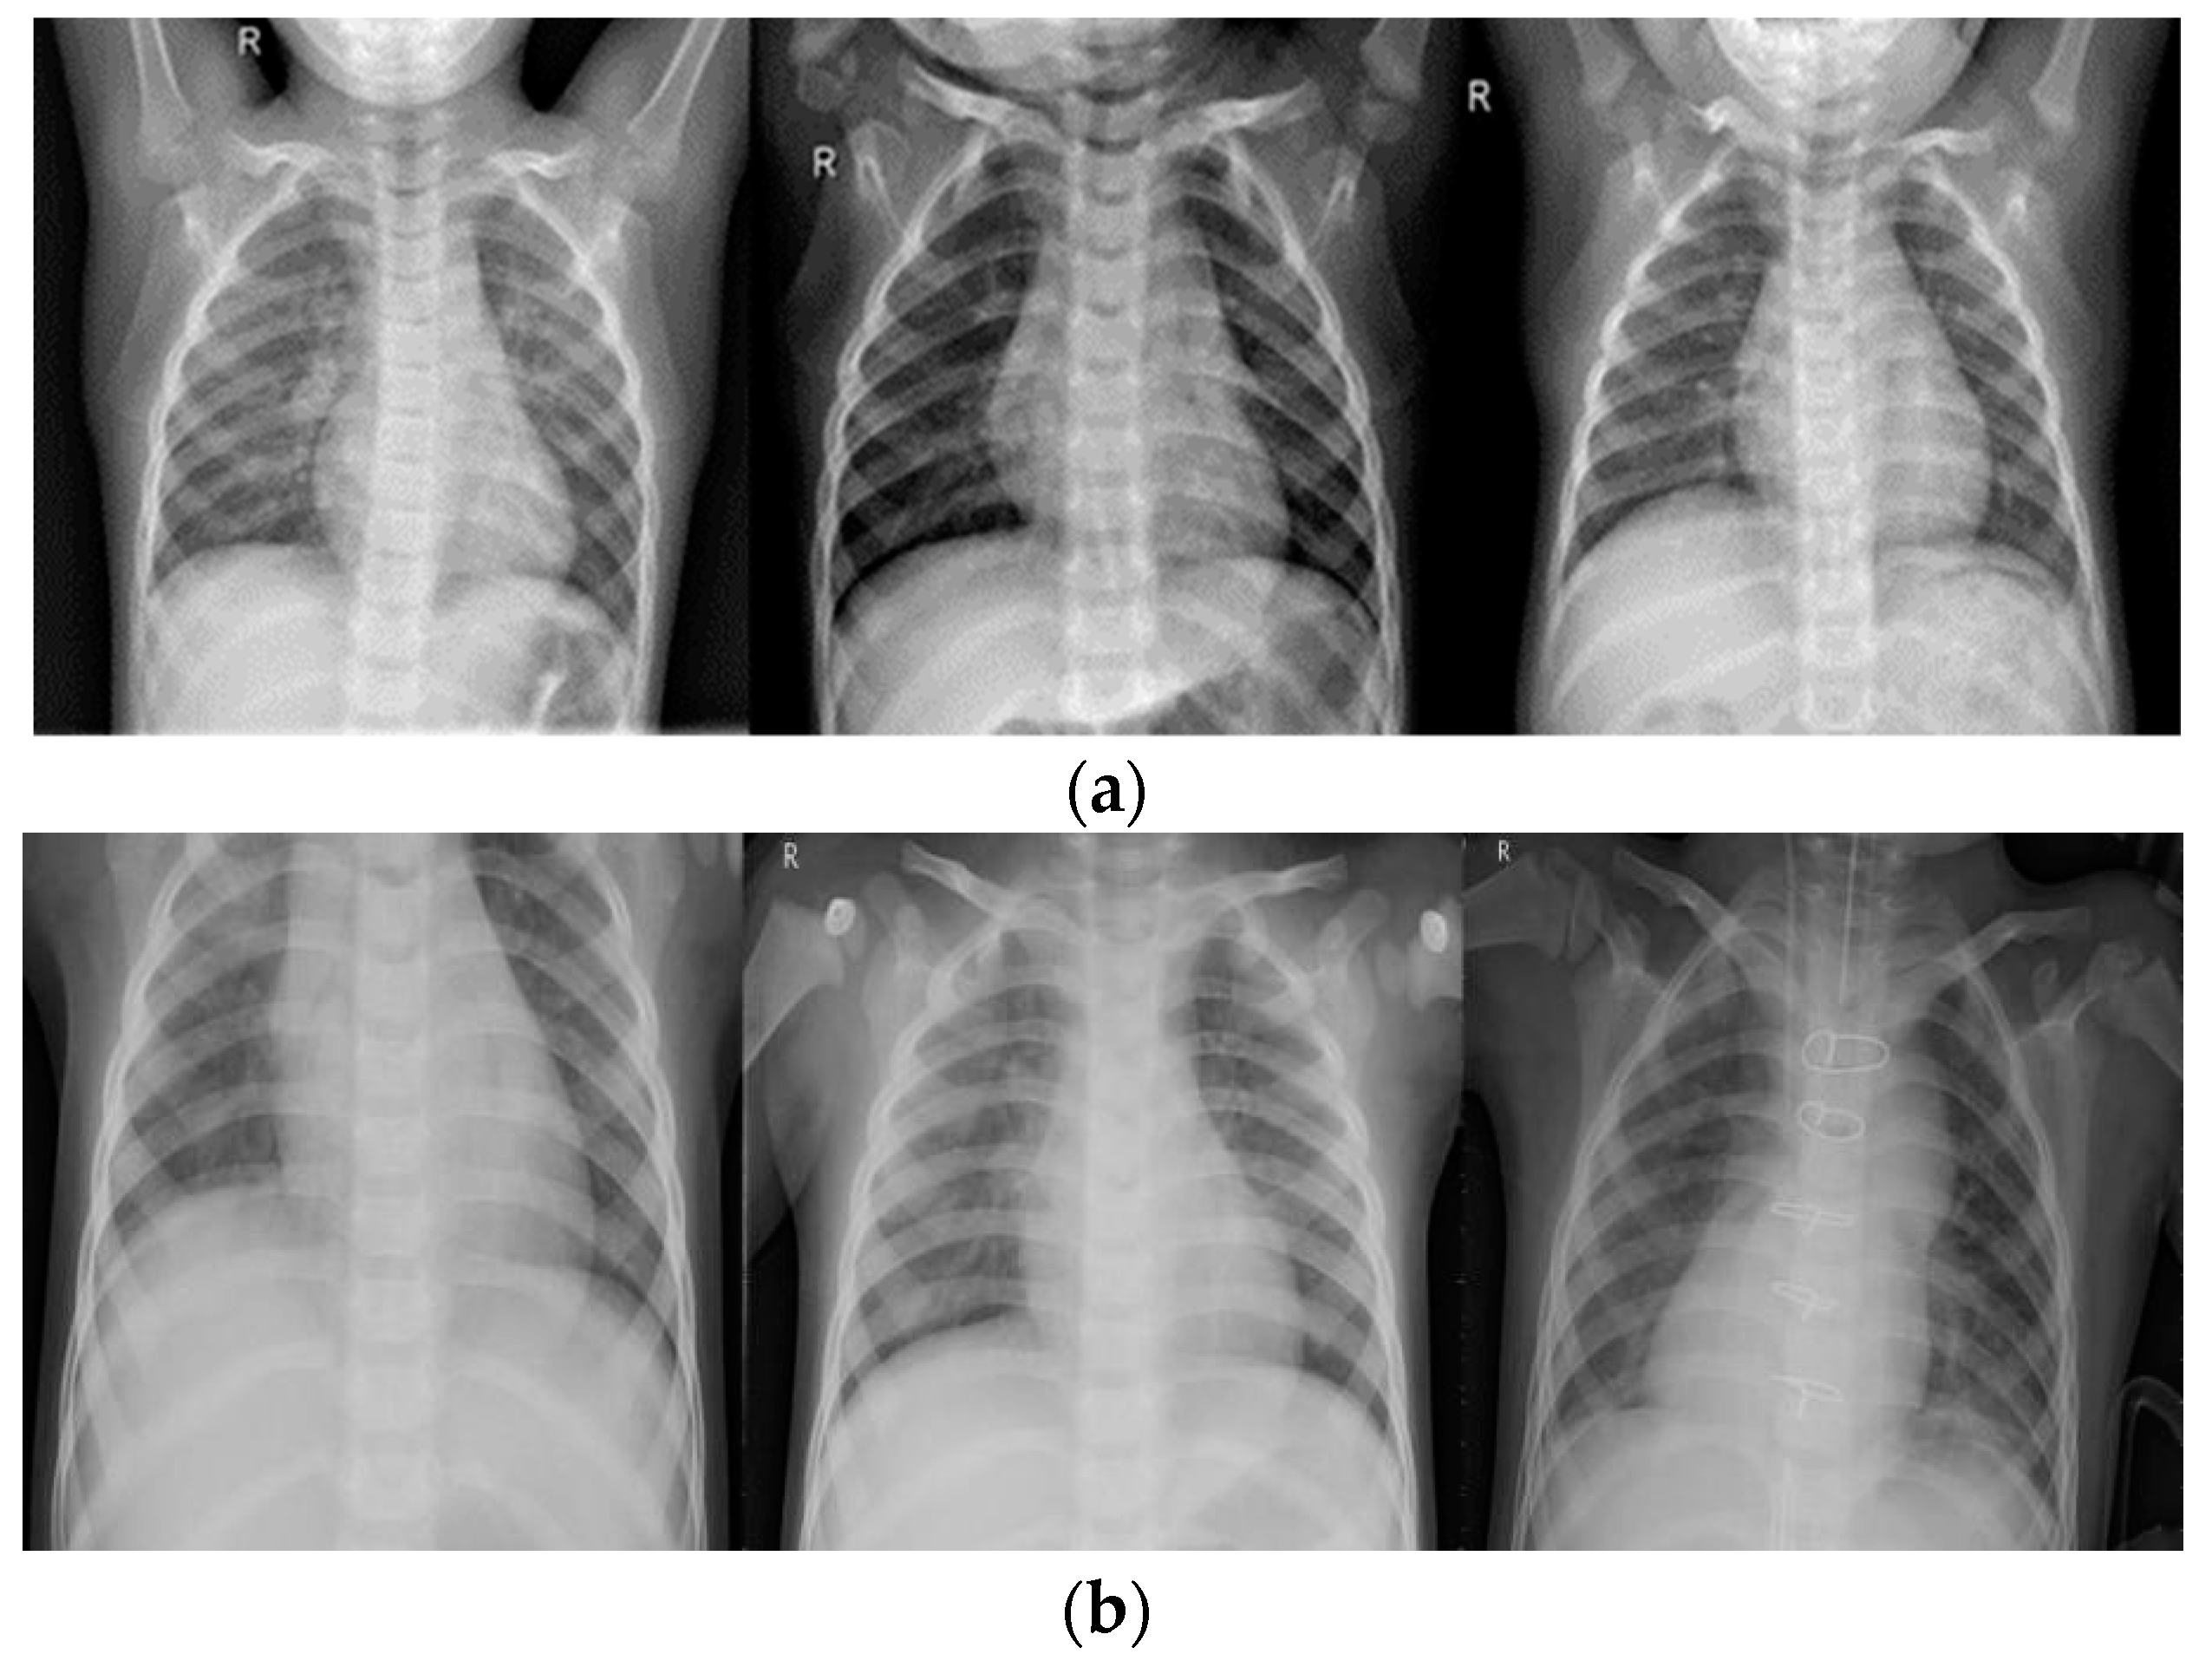
As shown in
Figure 1, invalid areas in chest X-ray images make little difference to experienced radiologists or to any proposed model and would decrease classification accuracy. In order to relieve the effect of invalid areas, attention-based models were widely adopted. Li et al. [
19] proposed an improved Squeeze-and-Excitation Network (SENet) architecture to locate the pneumonia area in images. Guo et al. [
20] developed a model that adaptively assigned one attention score for each dense connected layer and proposed an abnormal-aware attention module to make the network weight the learned low-level features into high-level features according to the importance of features. Furthermore, they introduced a novel angular contrastive loss to reduce the loss of intra-class and enlarge the loss of inter-class. Their method achieved 89.41% accuracy in WCE images.
In order to make a summary about the task of pneumonia classification, Baltruschat et al. [
21] compared the classification accuracy of currently widespread CNN models in pneumonia X-ray images by using the same hyper-parameter settings and same image pre-processing procedures. The method by Nahid et al. [
22] proposed a novel CNN architecture which composed of two channels. The first channel processed the images, whose contrast was enhanced by the CLAHE method, while the second channel processed the images whose edges were enhanced by the Canny method. Then, these images were entered into a multichannel CNN model to detect if patients suffered from pneumonia. Researchers [
23] developed a weak supervision approach to release a diagnosis burden of radiologists. They evaluated the model performance in a dataset of 30,000 chest X-ray images which were collected by the Radiological Society of North America (RSNA). In addition, they compared the region of interest (ROI) predicted by their proposed architecture and the ROI ground truth bounding boxes provided by RSNA. Finally, they proposed several model architectures, Xception, ResNet-50, Inception and Ensemble (which meant that they used a weighted mean of three models above). Their single best model was Inception net, which obtained an accuracy of 0.782 and F1 score of 0.6411 on the binary classification in detecting pneumonia.
Other references in fields processed by CNN, like medical image segmentation, medical image reconstruction and so on, are also briefly described in this paper. The most widely used models in medical image segmentation are U-Net [
6] and V-Net [
7], which propose the idea of a fully connected neural network and stacked down-sampling layers followed by up-sampling layers. In addition, the networks directly connect the layers at the front to the layers behind to improve the ability of the model to extract features. The architecture [
6], named U-net, consists of some stacked down-sampling convolution layers that adopt
kernels followed by Rectified Linear unit (ReLU) and
max pooling operation to obtain hidden feature maps. After down-sampling layers, there are several symmetric convolution layers the same as down-sampling layers to reconstruct original images. Their model design outperformed prior works on the ISBI (International Symposium on Biomedical Imaging) challenge and won the ISBI cell-tracking challenge 2015 by a large margin. Similarly, the model architecture [
7] named V-net adapts stacked convolution down-sampling and up-sampling layers, whose difference between U-net is the bottom of model, in other words, like their names, U-net and V-net.
3. Background
In the past few decades, machine learning (ML) algorithms have gradually attracted researchers’ attention. This type of algorithm could take full advantage of the giant computing power of calculators in images processing through given algorithms or specified steps. However, traditional ML methods in classification tasks need to manually design algorithms or manually set feature extraction layers to classify images.
In response to the above situation, LeCun et al. [
24] proposed a CNN method, which could automatically extract features through continuously stacked feature layers and output the possibility of which class the input images belonged to. The shallow networks mainly focus on low-level features of the image. As the number of network layers increases, CNN model gradually extracts high-level features. Combining and analyzing these advanced features, CNN learns the differences between different images, and uses a back-propagation algorithm to update and record the learned parameters.
The essence of CNN is to filter the previous image or feature maps through a specific convolution kernel to generate the feature map of the next layer, and combine with operations such as pooling operations to reduce the feature map scale and reduce the computation. Then, a nonlinear activation function is added to the generated feature map to increase the characterization ability of the model. Common pooling operations include maximum pooling and average pooling. Maximum pooling means that the feature delivered into the pooling layer is split into a number of sub-regions and will output the maximum of each sub-region according to the strides in horizontal and vertical. The only difference between maximum pooling and average pooling is the output of the sub-region where the average pooling outputs the average of each sub-region. Common activation functions include ReLU (Rectified Linear Units) and Sigmoid.
For the classification task, through the continuous stacking of convolutional operations, pooling operations, nonlinear activation functions and other fully-connected layers, the features of the image are automatically extracted. Then possibility of whether the images processed by the model shows pneumonia is outputted by analyzing these extracted features. While making full use of inherent pixel-level information of the image, the generalization ability of model is improved. In recent decades, with the extensive development of deep learning, the most popular neural framework has been proposed, such as AlexNet [
25] and VGGNet [
26]. However, when the number of network layers increases, the neural network will suffer from the problem of gradient disappearance or gradient explosion and will become fixated on the specific features of the training image, rather than learning more generative features, which makes the model’s generalization ability poorer and causes over-fitting. In order to solve the problem of network depth, a residual connection structure was proposed. Since then, deeper neural networks have received extensive attention and development, and have become the cornerstone of many tasks. In this study, we also evaluated the performance of residual connection if used in our simplified CNN architecture with fewer layers.
4. Materials and Methods
In this study, we explored: (1) the performance between original and contrast-enhanced images; (2) performance between different image resolutions; (3) performance between different loss functions, MSE (mean-square-error), BCE (binary-cross-entropy), FL (focal-loss) [
27]. The comparison of trainable parameters in different models are listed in
Table 1.
4.1. Data
The proposed dataset used to evaluate model performance consists of total 5786 X-ray images and is from the Kaggle competition. In addition, the dataset is organized into three folders (train, test, val) and contains sub-folders for each image category (Pneumonia/Normal). All chest X-ray images (anterior-posterior) were obtained from patients aged one to five years old. In order to illustrate the generalization of different models, the original dataset was randomly split into three folders, provided with train validation, and tested by 70%, 10%, and 20%—as was done with the work by Baltruschat et al. [
21].
All images were resized to a fixed shape, which in this study is a hyper-parameter from
. The training set includes a total of 4037 images, which were divided into normal and pneumonia sub-sets; the normal set contained 1093 images while the pneumonia set contained 2944 images. The validation set included a total of 579 images, which were divided into normal and pneumonia sub-sets; the normal set contained 157 images while the pneumonia set contained 422 images. The test set included a total of 1170 images; the normal set and the pneumonia set contain 316 and 854 images, respectively. Several examples of normal and pneumonia images are listed in
Figure 1.
Chest X-ray images always have the characteristics of limited contrast on account of low-exposure dose to patients, for the reason that chest X-ray images always contain black, white, and gray components. The lungs are located on both sides of the chest cavity and the area of the lungs could be easily missed by X-rays, which are almost black. The heart, located in the middle of the lungs, is shown as almost white since the X-rays cannot completely pass through the heart. Bones are made of protein and they are too dense, so the X-rays cannot cross through them and bones are shown almost white as well. In addition, bones have clear edges.
Other tissues like the trachea and arteries are always visually unclear. The unclear information in chest X-ray images will cause an ambiguous diagnosis, not only to radiologists, but also to the CNN models. Therefore, in this study, the contrast of the original images would be enhanced and a comparison of the performance of enhanced images between non-enhanced images is illustrated.
4.2. Methods
4.2.1. Data Pre-Processing
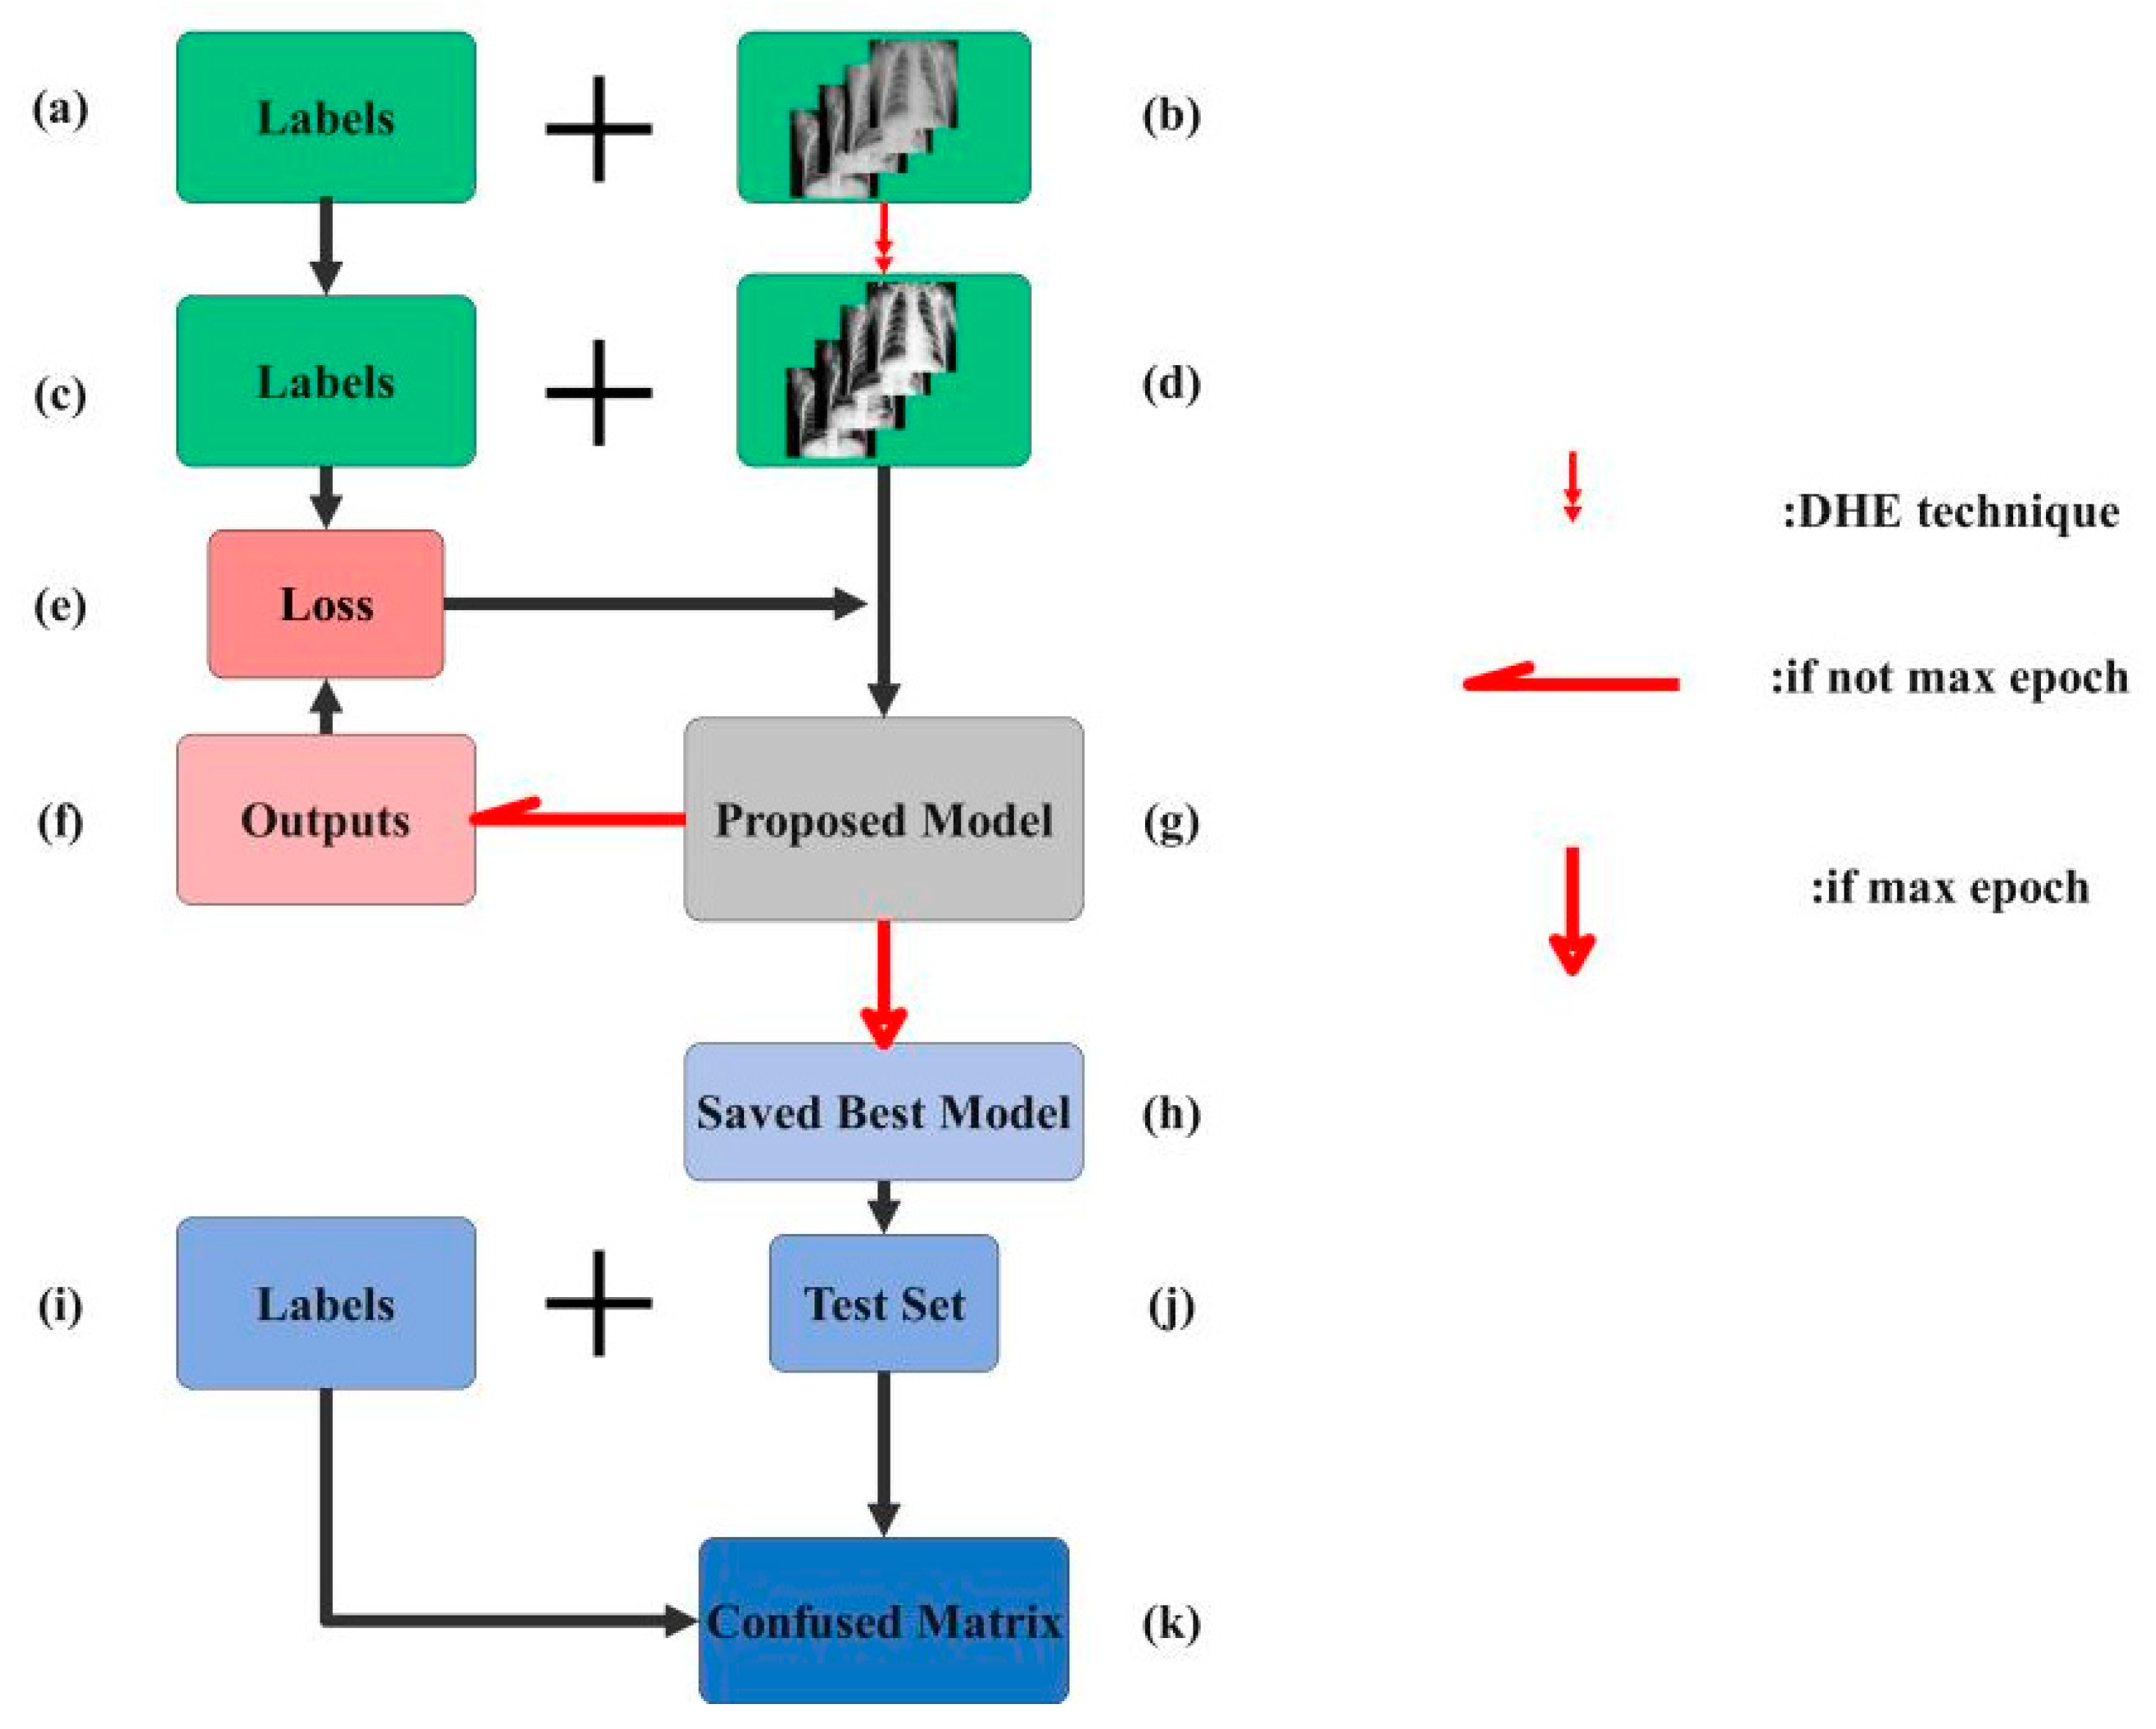
Image pre-processing is a very common and beneficial technique in the deep learning process and it not only could enlarge the quantity of the original dataset but also enrich the information implicit in the dataset. As previously mentioned, we utilized an effective image enhancement method named Dynamic Histogram Equalization (DHE) to improve the quality of images before they were inputted into the CNN model.
Histogram Equalization (HE), which denotes mapping from the initial narrow pixel levels to a wider extent and improves image enhancement, has been widely used in image processing. The HE technique means to convert the gray levels of an image by using cumulative effort function globally, yet always brings about the problem that elaboration information in images is damaged, leading to awful image quality. This popular image contrast enhancement method could enhance image contrast effectively in many aspects, like MRI, X-rays, CT and so on.
Scientists [
28] aiming to classify brain MRI images accurately proposed a novel enhancement method called Average Intensity Replacement-Adaptive Histogram Equalization (AIR-AHE). The proposed model consisted of several existing methods to improve enhancement performance, such as contrast enhancement, window-sliding neighborhood operation and so on. Their experiments demonstrated the proposed combined enhancement methods could obtain better results compared to the traditional HE method. Another MRI brain image enhancement method [
29] proposed a novel framework named particle swarm optimized texture-based histogram equalization (PSOTHE), which combs the multi-objective fitness function to obtain better enhancement performance in brain MRI images. In their study, different objective functions consisting of edge information, entropy, contrast, and the PSRN of the image had the same weight to enhance the images.
In this study, we follow Wadud et al. [
30], using their adaptive DHE in order to pre-process pneumonia chest X-ray images before inputting them into the proposed CNN model. The DHE technique eliminates the possibility of the low histogram components being compressed, which may cause the information of the image to wash out. Moreover, DHE is free from any severe side effects such as checkerboard effect, over-enhancing noises, etc.
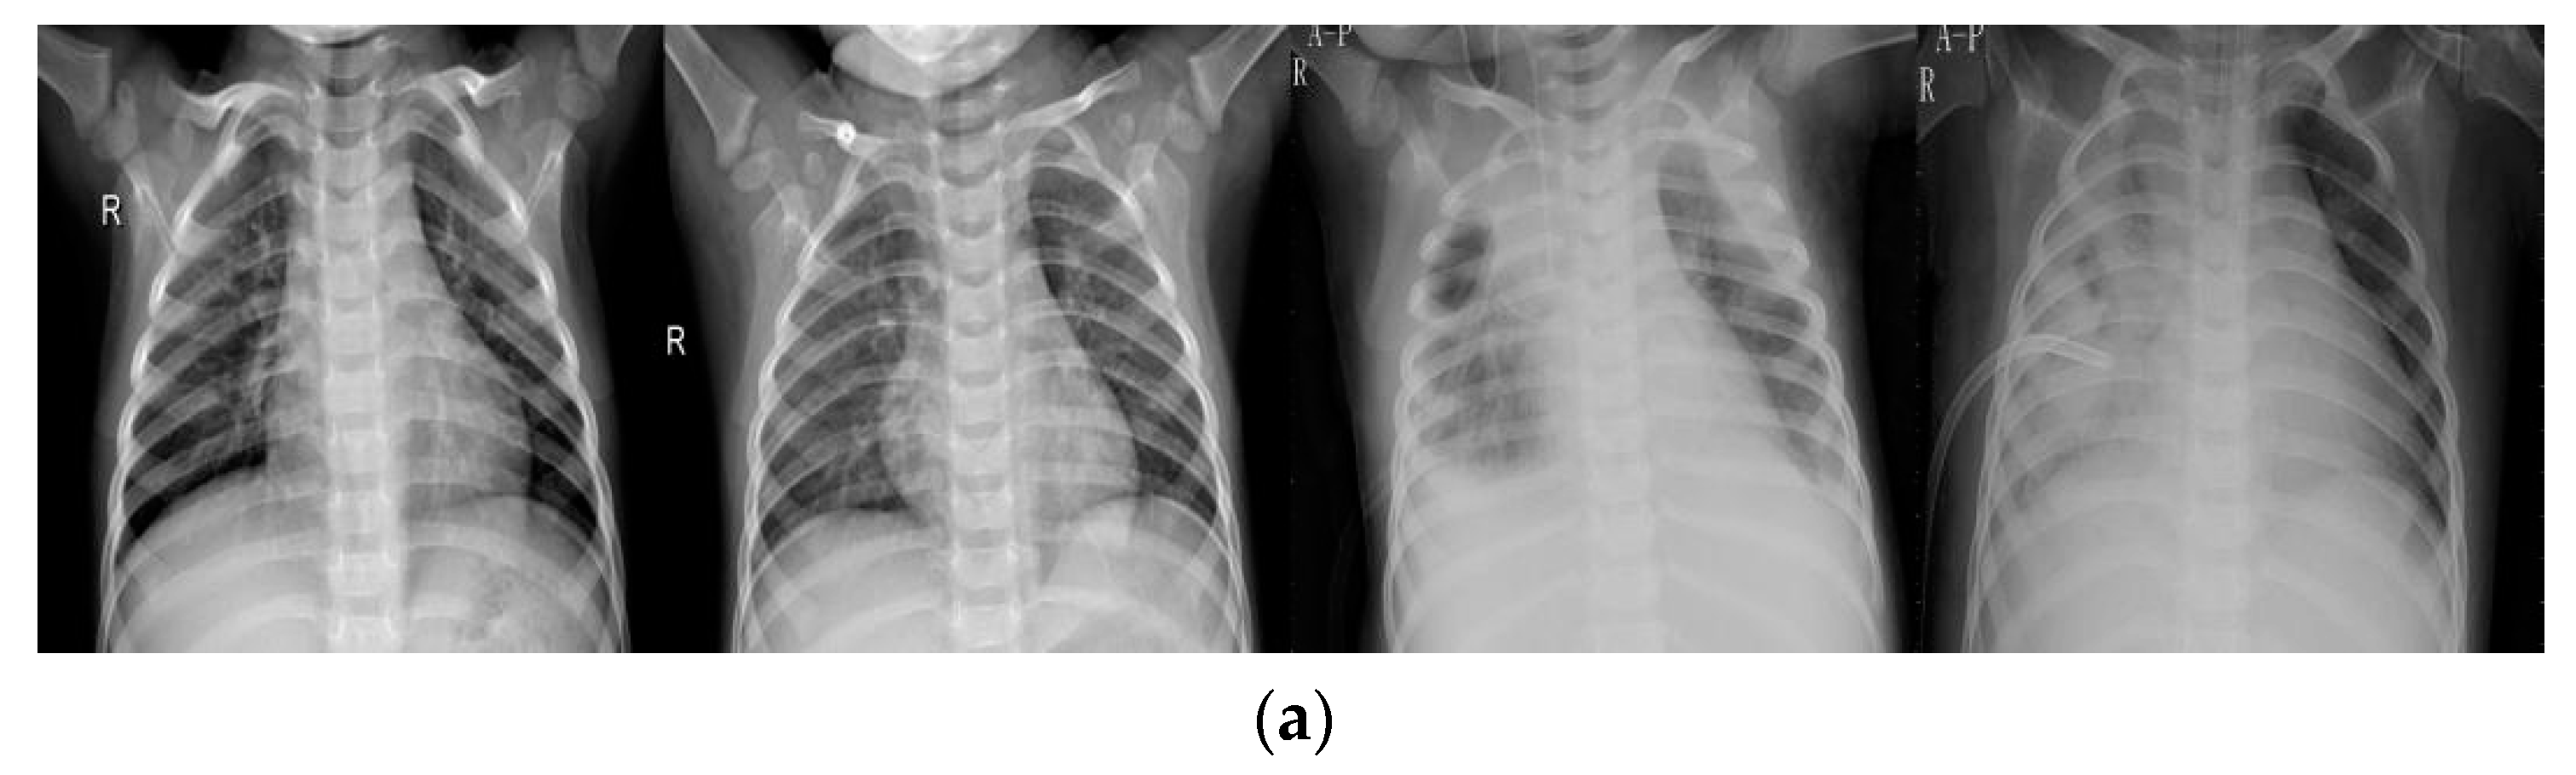
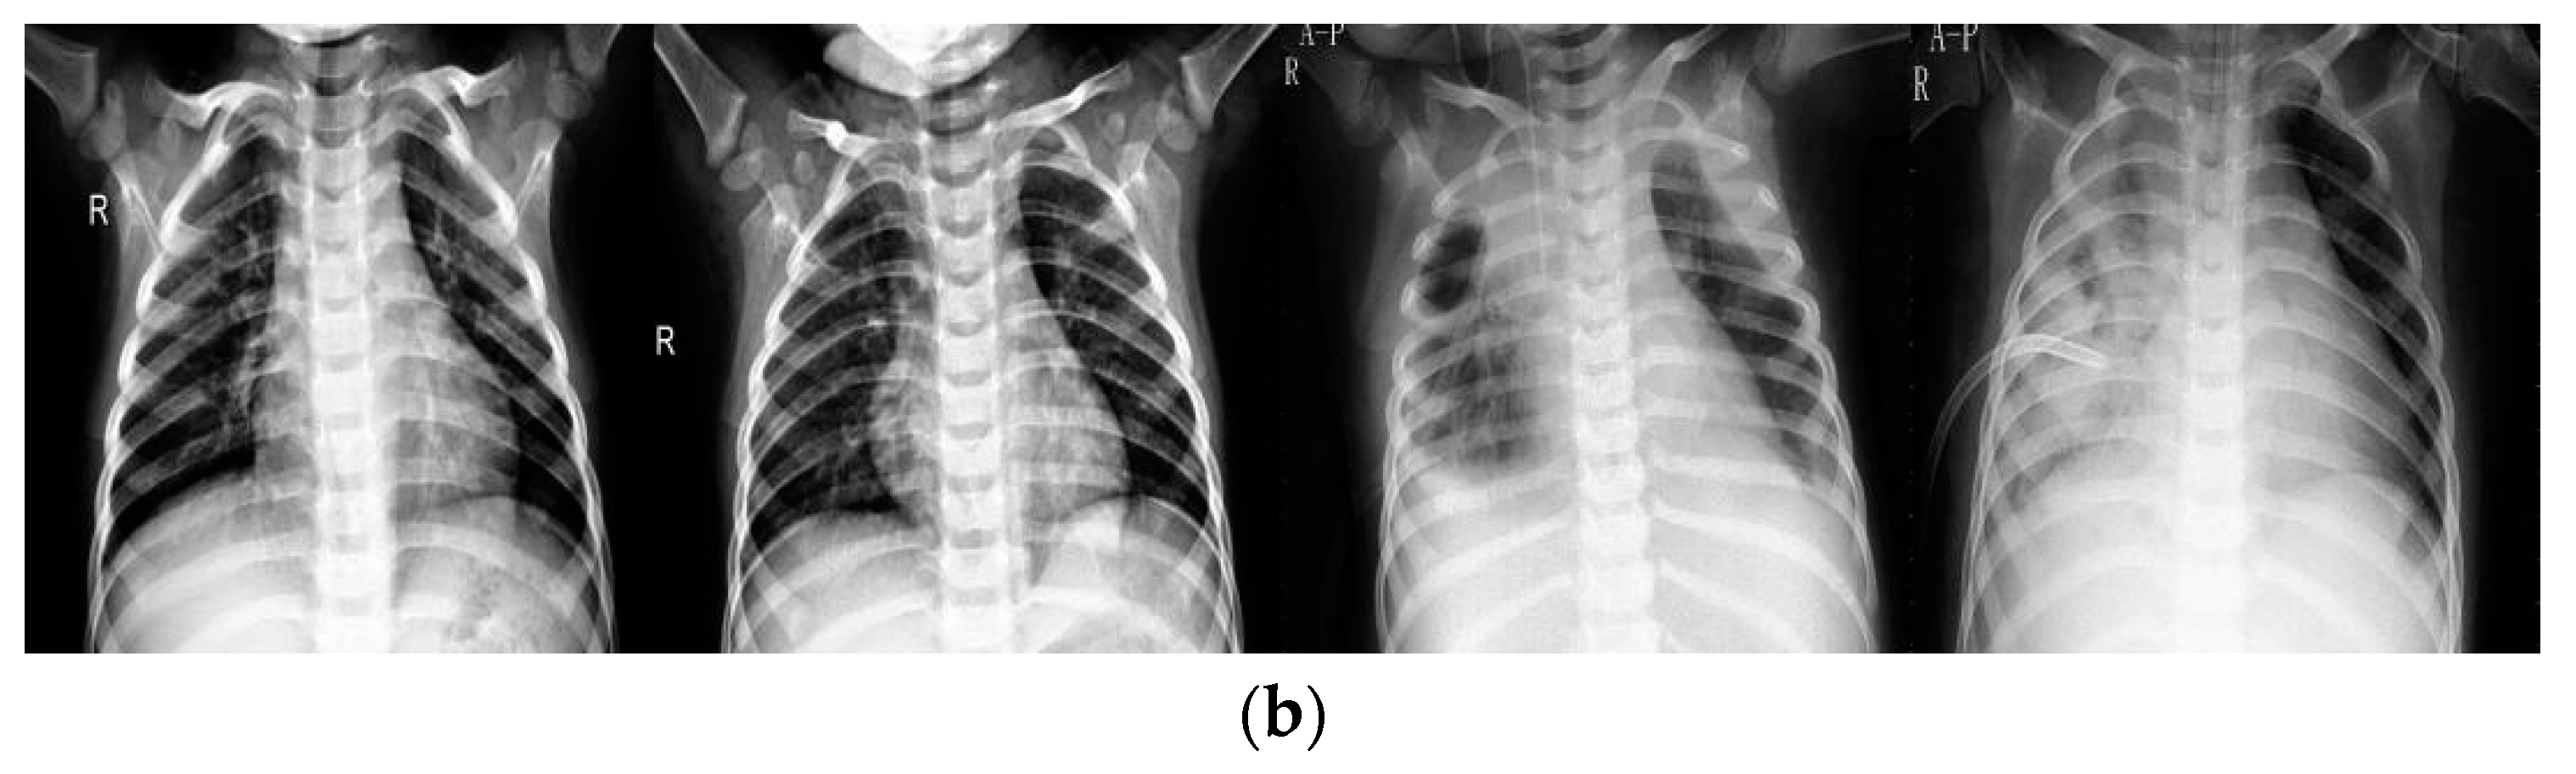
Figure 2 provides several examples between the original and enhanced images.
Figure 2a represents examples from original data set, while
Figure 2b represents examples from the enhanced data set. As shown, the upper images always contain gray and vague areas while lower images display almost white and black areas, showing that the enhancement technique plays a significant role in image contrast. In this study, the information implicit in original images, like bones, lung areas, and other tissues, is revealed by the DHE technique.
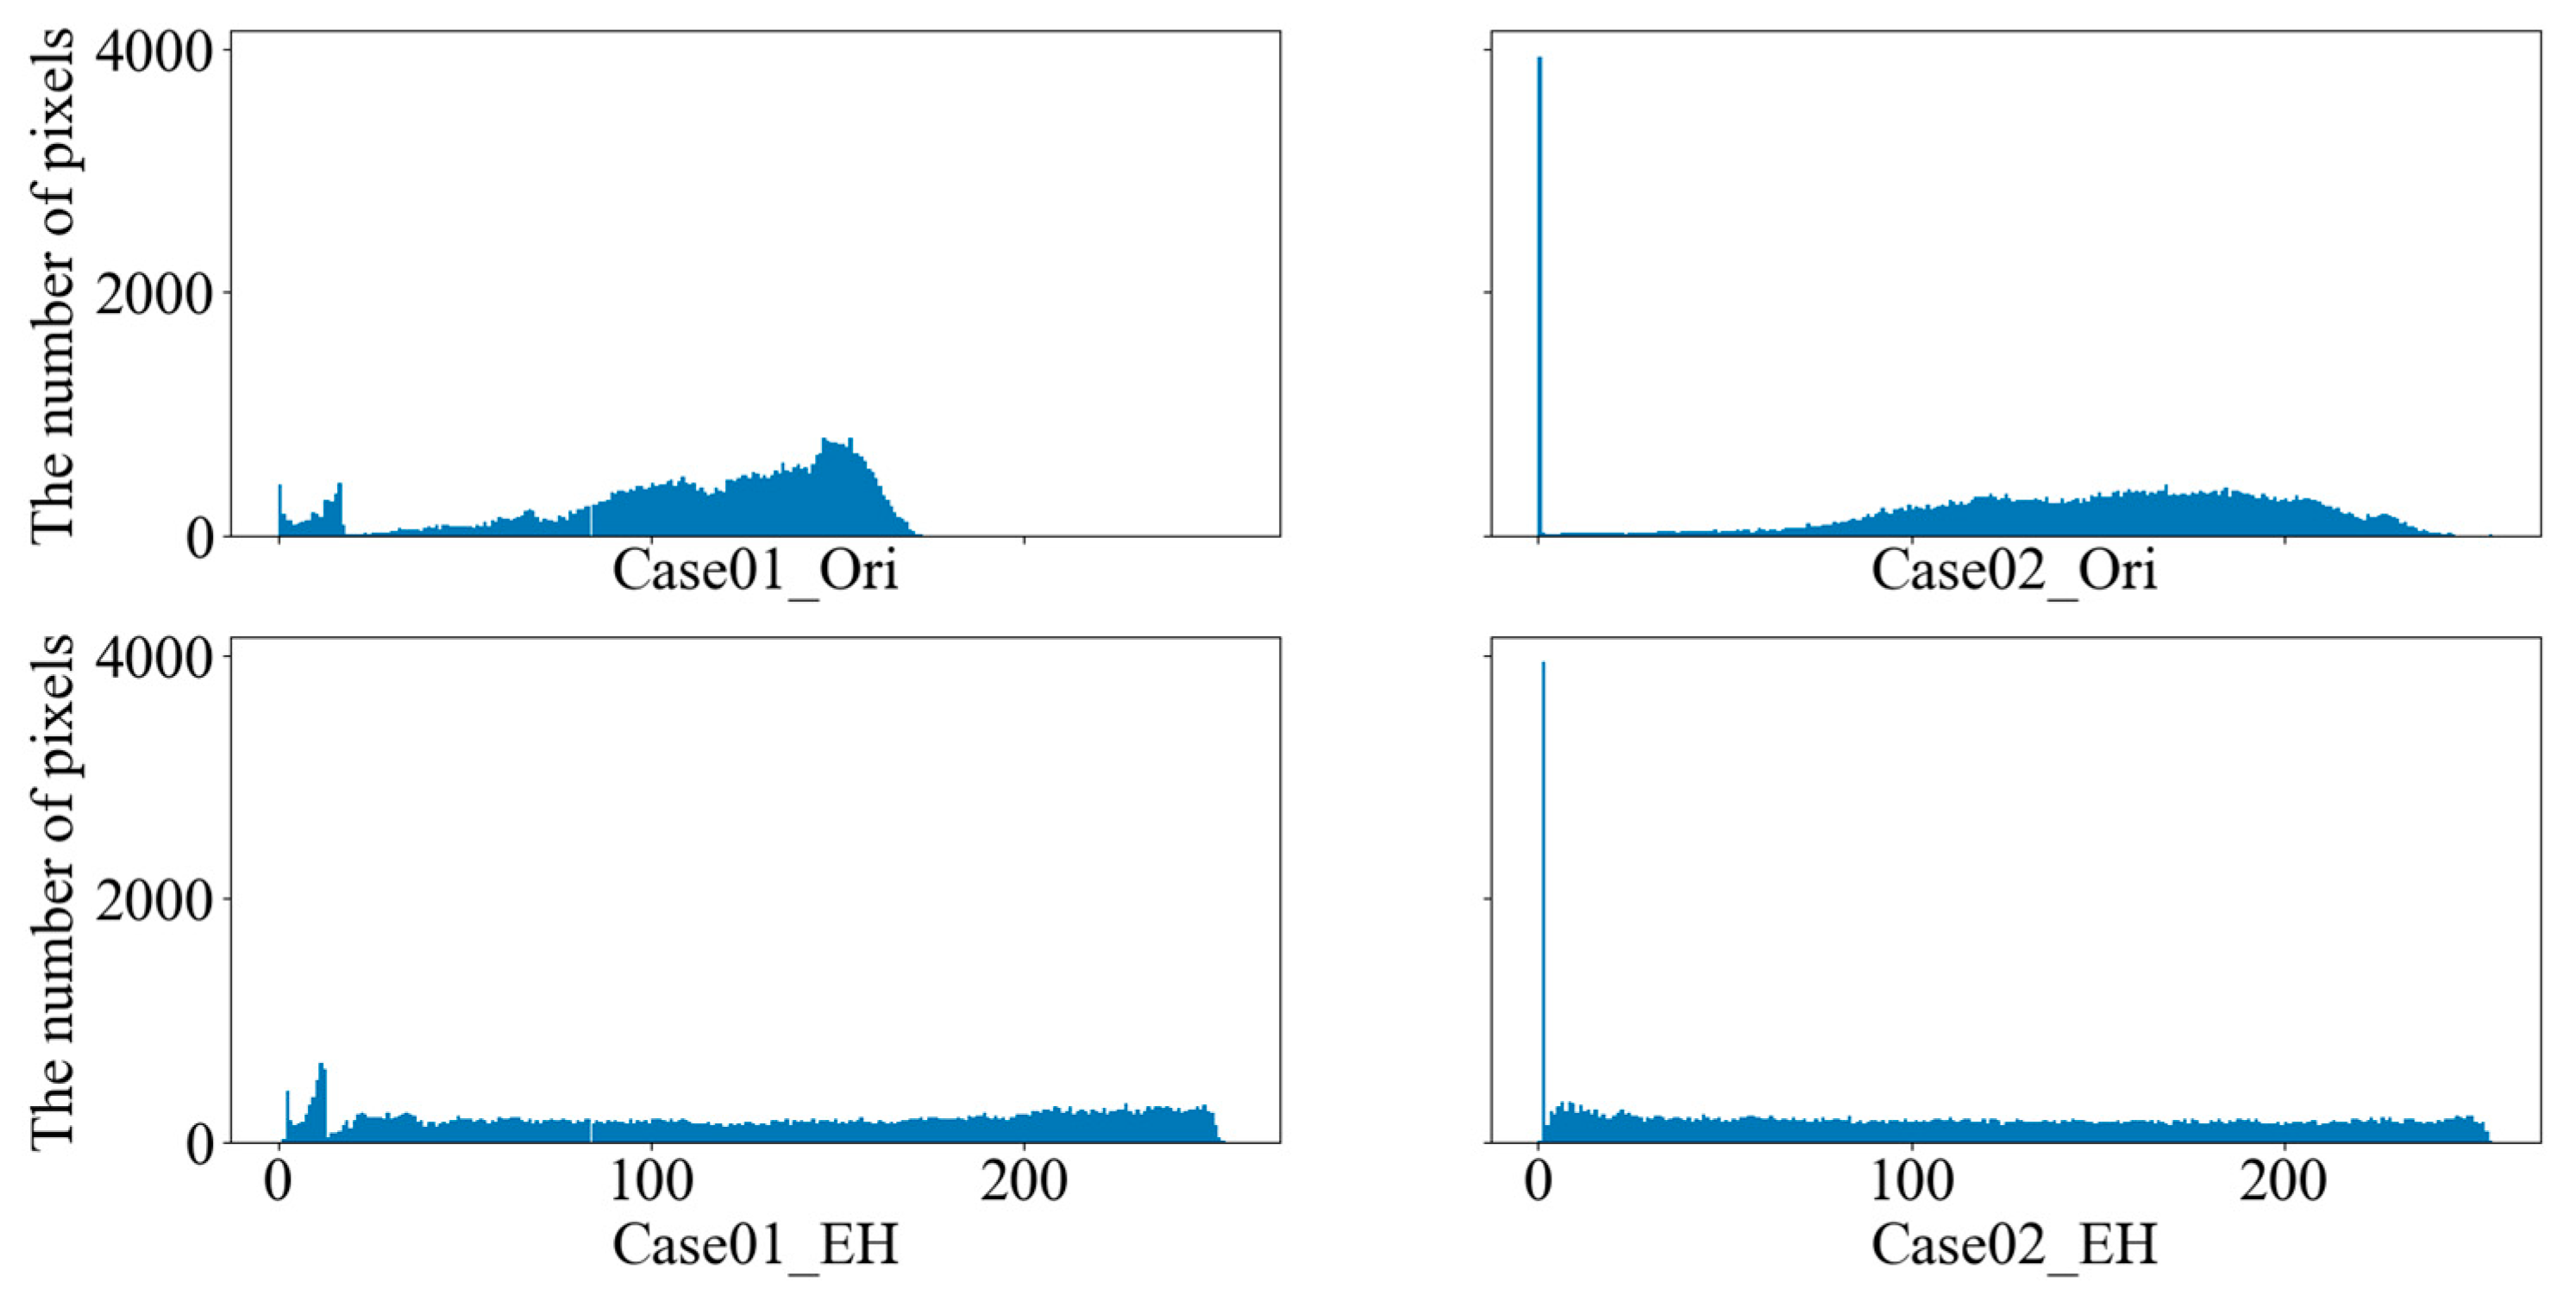
Figure 3 displays the histograms of original and enhanced images. The upper row depicts histograms of several original images, while the lower row depicts histograms of corresponding enhanced images by the DHE technique. As shown, the scopes of image pixel levels are extended, which means the contrast of images is enhanced effectively.
Other techniques used throughout this paper are tabulated in
Table 2. In our experiment, the image size was fixed to SHAPE×SHAPE where SHAPE is a hyper-parameter, and in this study, we explored the performance of different shapes and sizes, and the pixel scale of image was resized to [0, 1] by dividing the maximum of image pixel. Subsequently, the channel of images was set to [SHAPE, SHAPE, 1], as the information was already improved by DHE and the image pixel was scaled to [0, 1]. That is, there was no need to extend the shape of images to [SHAPE, SHAPE, 3] as used in other methods. In addition, several data augmentation methods were applied to boost the robustness of the proposed model. The rotation range denotes random image rotation during the training procedure in the range [0, 30]. The zoom range was utilized to randomly rescale the image size by 0.2 percent. Horizontal and vertical flip was used to randomly flip the image horizontally. Also, the width and height shift ranges are used to shift the image horizontally or vertically. These operations could intensely mitigate the negative effect of different image angles, different image heights, and different image widths.
Also, the performance of different loss functions, MSE and Focal Loss, is discussed in the following section.
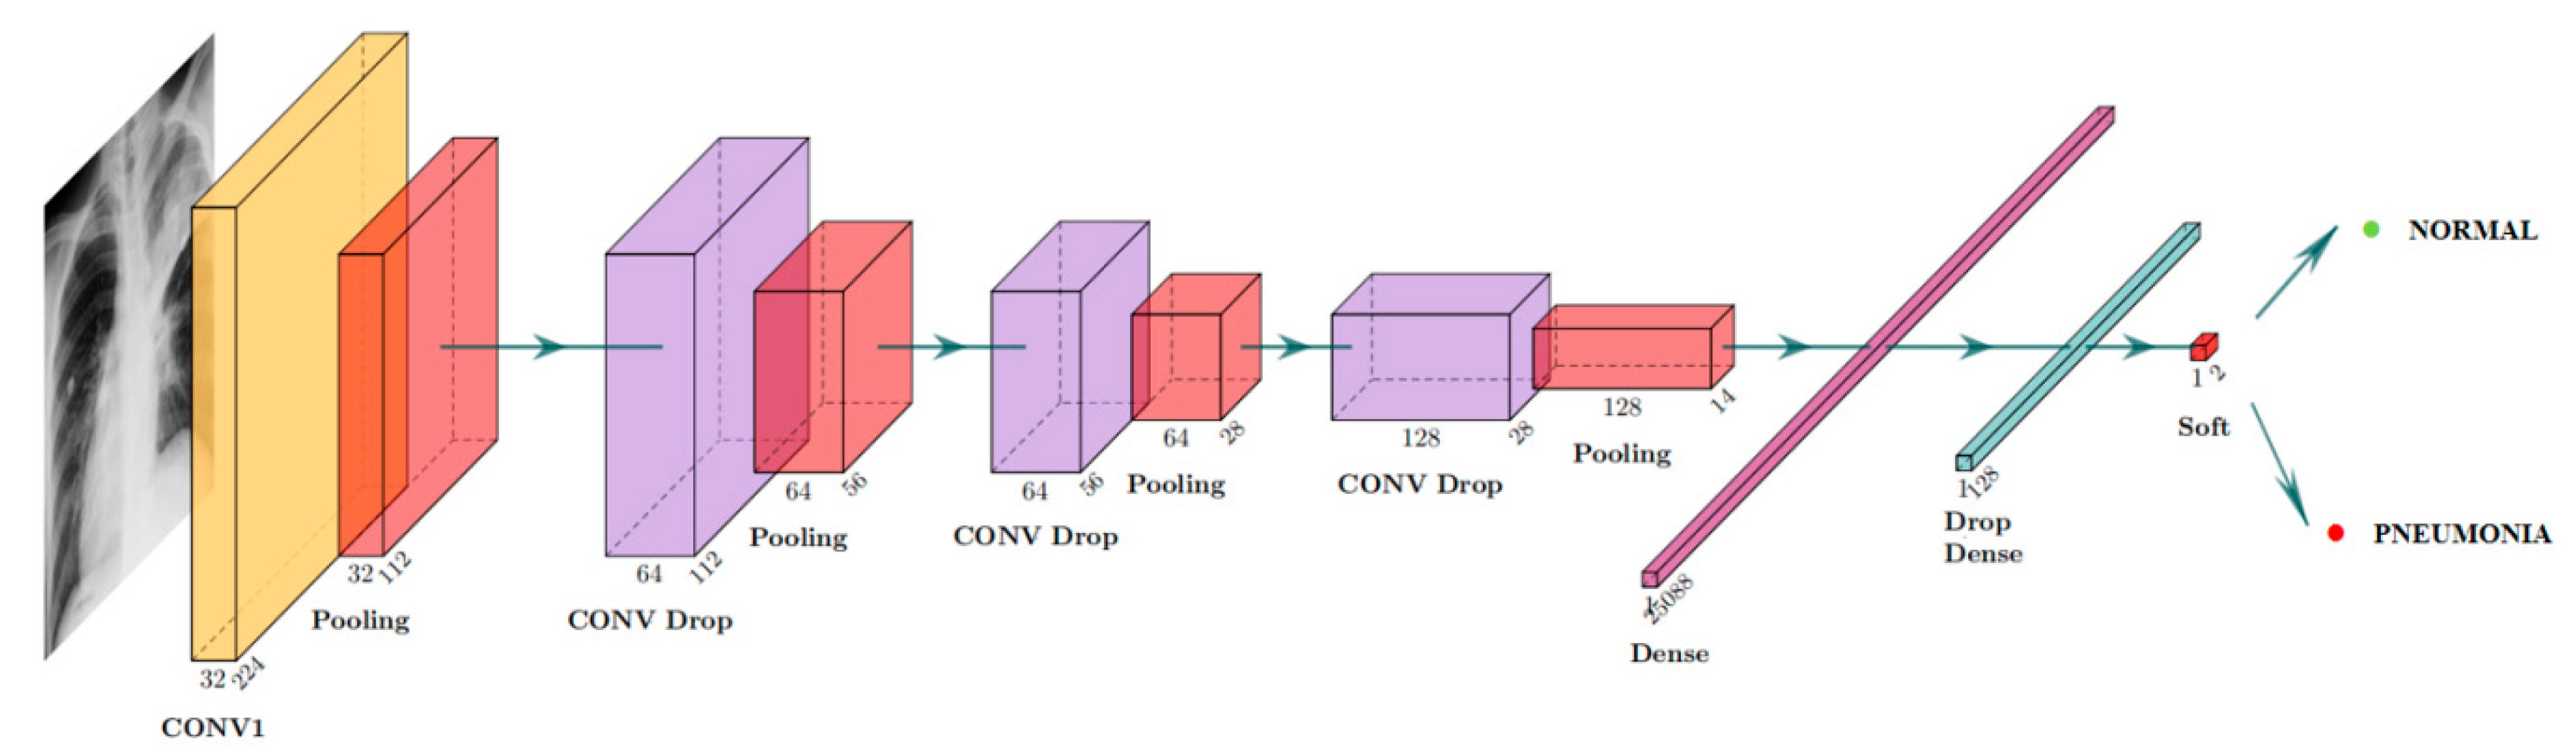
4.2.2. Proposed Network
In this study, we designed a VGG-based CNN model to extract the features of chest X-ray images and use those features to detect if a patient suffers from pneumonia.
Let
be the input or the
hidden layer feature map,
,
N represents all layers of the model and in our architecture, set
N = 6, meaning our model contains six hidden layers.
, represents convolution operation whose kernel size and strides are
and
respectively.
, represents the weight matrix of the
layer;
represents bias value of the
layer;
where
and
are activation functions.
represents the drop operation, which aims to randomly set the value of hidden layers or neuron to zero and improve the performance of model.
represents the max-pooling operation, aiming to reduce the computation of the model and improve its robustness;
represents the fully-connected operation. So the
output of model is:
The last layer outputs final decision , indicating the absence or presence of disease, respectively.
4.3. Training Process
4.3.1. Classification Evaluation Metrics
In this subsection, several evaluation metrics, accuracy, precision, recall, F1 score and so on, are described. According to the outputs of model, four indices, True Positive, True Negative, False Positive, False Negative, are used to analyze and identify the performance of model. The True Positive means that the chest X-ray images, which suffer from pneumonia, are signed as pneumonia as well by the model. The True Negative means if the chest X-ray images do not show pneumonia as well as the model predicts.
The remaining matrices have a similar definition.
The four metrics are given as follows:
TP, TN, FP and FN mentioned by the above formulas are True Positive, True Negative, False Positive, and False Negative, respectively. Among the four metrics, the precision rate was always used to estimate how much the number of images that are truly pneumonia accounted for in the total number examples, which are classified as positive for pneumonia. That is, the pneumonia images must be identified in practical clinical diagnoses and hence, the precision rate is especially important. In most cases, the higher the precision rate gets, the lower the recall rate is. Thus, F1 score rate is widely considered as a proper criterion. In addition, the Receiver Operating Characteristic (ROC) and AUC are calculated to compare the performance of different models. The whole training procedure will be displayed in this section. First, the hyper-parameters are fixed and shown in
Table 3. In our architecture, we optimize the model by Adam optimizer, an algorithm for stochastic optimization; the learning rate and the learning rate decay per epoch were set to 0.001 and 0.0001. Then, the hidden layer activation function and last classification activation function are set to ReLU and Sigmoid, respectively.
4.3.2. Proposed CNN Model
Figure 4
illustrates the architecture of our proposed model that has been applied for the detection of whether the input image shows pneumonia.
Figure 5
displays our model that contains a total of six layers, where we employed
kernel convolution layers whose strides are
and the activation function is ReLU. After each convolution layer, a
strides kernel operation was employed as a max-pooling operation to retain the maximum of each sub-region, which is split according to strides. Besides, we set several drop layers to randomly fit weights to zero, aiming to improve the model performance. Then two densely fully-connected layers followed by Sigmoid function are utilized to take full advantage of the features extracted through previous layers, outputting the possibility of patients suffering from pneumonia or not. As illustrated above, the input channel is
and the output size is
where 0 denotes that the image does not show pneumonia, while 1 denotes that the image shows pneumonia.
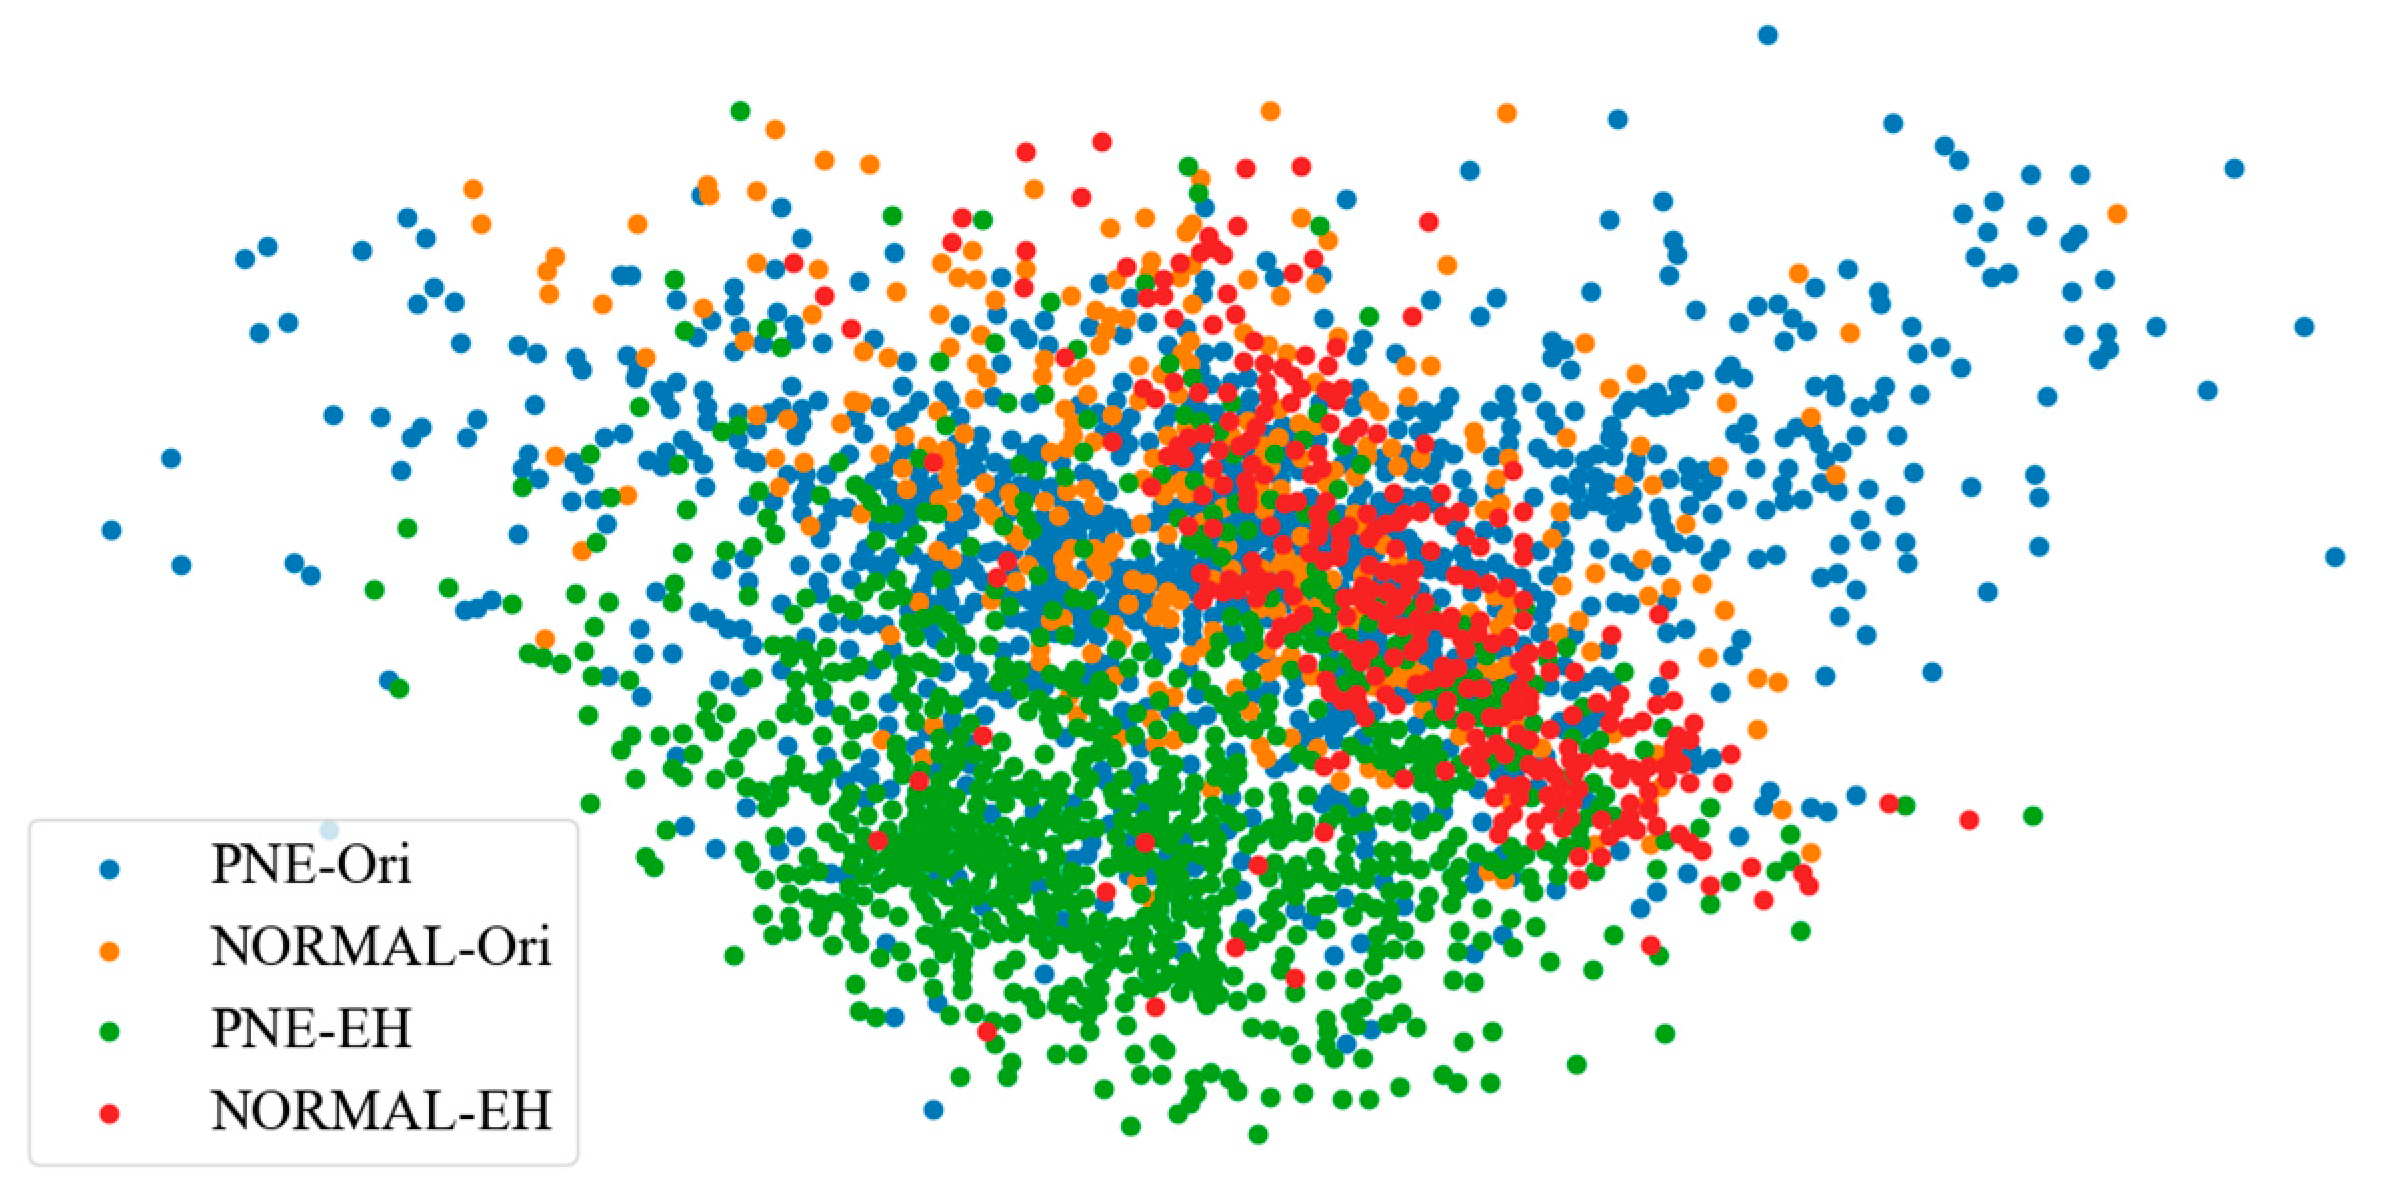
4.3.3. t-SNE Visualization
The t-SNE (t-distributed Stochastic Neighbor Embedding) visualization method is also displayed in this paper. This method aims to visualize the distribution of high dimensions and assists us in analyzing the connection among the samples.
6. Conclusions
This study describes a CNN-based model aiming to diagnose pneumonia on a chest X-ray image set. The contributions in this paper are listed as follows. First, we utilized the Dynamic Histogram Equalization (DHE) technique to enhance the image contrast. This technique has the potential to enhance image contrast without washing out appearance or causing problems like checkerboard effects. Then, we designed a simple VGG-based CNN model to extract the features from original images or previous feature maps, which contained only six layers combining ReLU activation function, drop operation, and max-pooling layers. The results of the obtained accuracy rate of 96.07% and precision rate of 94.41%, shows that our proposed model performs well in comparison to state-of-the-art CNN model architectures. To illustrate the performance of our proposed model, several comparisons of different input shapes and loss functions were provided.
In the future, we will continue the research to explore more accurate classification architectures to diagnose two types of pneumonia, viruses, and bacteria. According to the description discussed above, the CNN-based model is a promising method to diagnose the disease through X-rays.


