Article

Advancing Stress Detection Methodology with Deep Learning Techniques Targeting UX Evaluation in AAL Scenarios: Applying Embeddings for Categorical Variables

by
Alexandros Liapis
1,2,*,
Evanthia Faliagka
1,
Christos P. Antonopoulos
1,
Georgios Keramidas
3 and
Nikolaos Voros
1
1
Electrical & Computer Engineering Department, University of Peloponnese, 26 334 Patras, Greece
2
School of Science & Technology, Hellenic Open University, 26 335 Patras, Greece
3
School of Informatics, Aristotle University of Thessaloniki, 54 124 Thessaloniki, Greece
*
Author to whom correspondence should be addressed.
Electronics 2021, 10(13), 1550; https://doi.org/10.3390/electronics10131550
Submission received: 27 May 2021 / Revised: 19 June 2021 / Accepted: 23 June 2021 / Published: 26 June 2021
(This article belongs to the Special Issue Robots in Assisted Living)

Abstract

:
Physiological measurements have been widely used by researchers and practitioners in order to address the stress detection challenge. So far, various datasets for stress detection have been recorded and are available to the research community for testing and benchmarking. The majority of the stress-related available datasets have been recorded while users were exposed to intense stressors, such as songs, movie clips, major hardware/software failures, image datasets, and gaming scenarios. However, it remains an open research question if such datasets can be used for creating models that will effectively detect stress in different contexts. This paper investigates the performance of the publicly available physiological dataset named WESAD (wearable stress and affect detection) in the context of user experience (UX) evaluation. More specifically, electrodermal activity (EDA) and skin temperature (ST) signals from WESAD were used in order to train three traditional machine learning classifiers and a simple feed forward deep learning artificial neural network combining continues variables and entity embeddings. Regarding the binary classification problem (stress vs. no stress), high accuracy (up to 97.4%), for both training approaches (deep-learning, machine learning), was achieved. Regarding the stress detection effectiveness of the created models in another context, such as user experience (UX) evaluation, the results were quite impressive. More specifically, the deep-learning model achieved a rather high agreement when a user-annotated dataset was used for validation.

1. Introduction

The collaborative research efforts of several domains, such as human−computer interaction, ubiquitous computing, ambient intelligence, and the Internet of Things, have significantly raised interest in emotional aspects of software products [1]. Considering typical living environments and commercial off-the-shelf (COTS) sensors and actuators, User eXperience (UX) enables academics and practitioners to gain a deeper understanding of the users’ interaction experiences by employing tools and approaches that go beyond traditional usability metrics [2]. UX is a broad term that includes factors such as usability, usefulness, aesthetics, and emotions [3]. In many cases UX design begins before the product is even in the hands of the user, effectively anticipating the end user’s needs and requirements. Designing and developing for UX necessitates a thorough grasp of how users feel while interacting with a system or a product [4].
A variety of approaches, such as post-questionnaires, interviews and observation can be used in order to measure the emotional aspects of UX. Alternatively, modalities that can be acquired by embedded and robotic sensors and actuators, such as facial expression [5,6], speech tone [7] and touchscreen patterns analysis [8,9] have been proposed. In the same way, physiological signals monitoring (e.g., heart rate, respiration, skin conductance) through COTS sensing equipment such as electrocardiogram (ECG), oxygen saturation (SpO2), and galvanic skin response (GSR), respectively, is also an approach that has been adopted by researchers in the context of UX evaluation [10].
Targeting an interactive environment such as ambient assisted living (AAL) in a UX evaluation, one is mostly interested in preventing stress events which are related to software issues [11]. Software flaws can cause the undesirable activation of the users’ physiology, widely referred as a “fight or flight” event or stress [12].
From typical modalities applied in a wide range of application scenarios, including AAL environments, skin conductivity (SC), also known as galvanic skin response (GSR), is one of the most well-studied psychological markers of the functioning of people’s autonomic nervous system. SC is associated with both emotional responses as well as cognitive activity. Signal characteristics, such as peak height and instantaneous peak rate, are reliable indicators of the stress level of a user. In [13], an extensive summary of SC research in relation to stress is presented. Furthermore, skin temperature (ST) is also a signal that can be easily measured. ST normally ranges between 32 and 35 °C [14] and has been used in numerous studies for emotion detection. In contrast to using GSR, there is ambiguity concerning the impact of stress on skin temperature fluctuations. More specifically, some studies confirm that ST rises when experiencing stress [15], while other studies [16,17] argue that ST decreases under stress. In the present study we used both GSR and ST signals during the training process of our stress detection models.
The evolution of miniaturized embedded systems and wearables [18,19] has further favored the use of physiological signals, allowing experiments to take place in more ecologically valid settings [20] at a relatively low cost [21].
There is a large number of publicly available physiological datasets [22,23,24] for stress research that have been emotionally annotated in a context where users have been exposed to the intense stressors typically found in real-life conditions (e.g., movie clips, songs, major hardware/software failures, image datasets, and gaming). Although such approaches are able to create stress prediction models with rather high classification accuracy, it remains questionable if they could be effectively used in capturing subtle stress responses, which are mostly expected in different contexts, such as UX evaluation studies [25].
This paper tries to answer the aforementioned question by conducting an in-depth investigation of the performance of such a dataset in the context of UX evaluation and modalities by combining traditional machine learning and deep-leaning approaches. To the best of our knowledge, this is the first study that uses deep-learning for stress detection in the UX context. More specifically, the SC and ST signals of 15 users of the publicly available physiological dataset named WESAD (wearable stress and affect detection [26]) were used in order to train three machine learning classifiers (L-SVM, C-SCM, Q-SVM) and a deep-learning model implemented using the fast ai framework [27]. The fast ai library has a built-in functionality based on neural networks that allows the classification of tabular data with very good results. Tabular data, also known as relational data or structured data is the most commonly used type of data but deep learning on tabular data receives far less attention than deep learning for computer vision and natural language processing. Thee SC and ST signals of WESAD dataset were preprocessed to extract the appropriate features as described in Section 3 in detail and the tabular data that derived were provided as an input for the stress/no stress problem.
A publicly available emotionally annotated biosignals dataset, made available by [28], was considered as the ground truth dataset in order to evaluate the performance of the aforementioned models in stress detection in the context of UX evaluation. The ground truth dataset consists of SC segments that have been emotionally annotated by users’ self-reported ratings (valence-arousal scale). The reported periods indicate usability issues confronted by users while they were interacting with a platform during a UX evaluation study. Using users’ self-reporting as ground truth is a common practice in UX research [29,30,31,32].
The rest of the paper is structured as follows: Section 2 presents the WESAD dataset that was used for the training process. In Section 3 the process of stress detection models is presented, using both deep-learning and traditional machine learning as well as the training results. In the following section the models created are used in another context (UX evaluation) and their performance is shown.

2. Description of Employed Datasets

2.1. Wearable Stress and Affect Detection (WESAD) Dataset

WESAD [26] is a publicly available multimodal physiological dataset proposed for wearable stress and affect detection. The signals were recorded during a lab study in which 15 participants with a mean age of 27.5 years (SD = 2.4) were exposed in three different affective states: neutral, stress, and amusement. Regarding stress, the Trier Social Stress Test (TSST) was employed by the researchers in order to elicit the specific emotion. More specifically, the dataset consists of the following physiological signals: blood volume pulse (BVP), electrocardiogram (ECG), electrodermal activity (EDA), electromyogram (EMG), respiration (RESP), skin temperature (TEMP), and three axis acceleration (ACC).
Regarding the binary classification problem (stress vs. nonstress), a classification accuracy of up to 93% was reported by authors when all physiological signals participated in the training process. Classification was also conducted by using only electrodermal activity and skin temperature data. In these cases, the accuracy was 80 and 59%, respectively. Towards a better tradeoff between recognition performance and computational load, Liu et al. [33] used a single biosignal in order to create a more practical, unobtrusive and comfortable wearable system for stress detection. In particular, the skin conductivity along with linear discriminant analysis (LDA) were used in order to discriminate three stress levels: low, medium and high. A classification accuracy of 81.82% was achieved. Furthermore, Jussilla et al. [34] proposed an effective stress management biosensor named the “smart ring”. The smart ring measures EDA from the palmar side of the wearers. Such approaches might be a promising line of research for the development of practical personal stress monitors. This is also our rationale to use only two signals.
Despite the high classification accuracy in both approaches (all signals vs. EDA), WESAD authors indicate that “results should be interpreted with caution due to the limitations of WESAD, regarding the number of subjects and the lack of age and gender diversity”.

3. Training and Results

In this section, the process of stress detection models is presented. The trained models can be divided into two groups: (a) deep-learning and (b) traditional machine learning.
While deep learning has revolutionized the processing of unstructured data (e.g., audio, image and natural language) it has received less attention in the processing of structured (or tabular) data, i.e., data organized in the form of a table (e.g., a spreadsheet or database). Instead, structured data problems are more commonly solved with tree-based models such as Random Forest [35], XGBoost [36] and SVMs [37]. However, recent breakthroughs in the representation of categorical data with the introduction of entity embeddings [38] have shown that deep learning models can offer significant benefits in regression and classification problems for structured data. Unlike continuous variables, that contain continuous numerical data, categorial variables may contain numerical data (e.g., age) or numbers that map to string values (e.g., color) which have been taken from a fixed set.

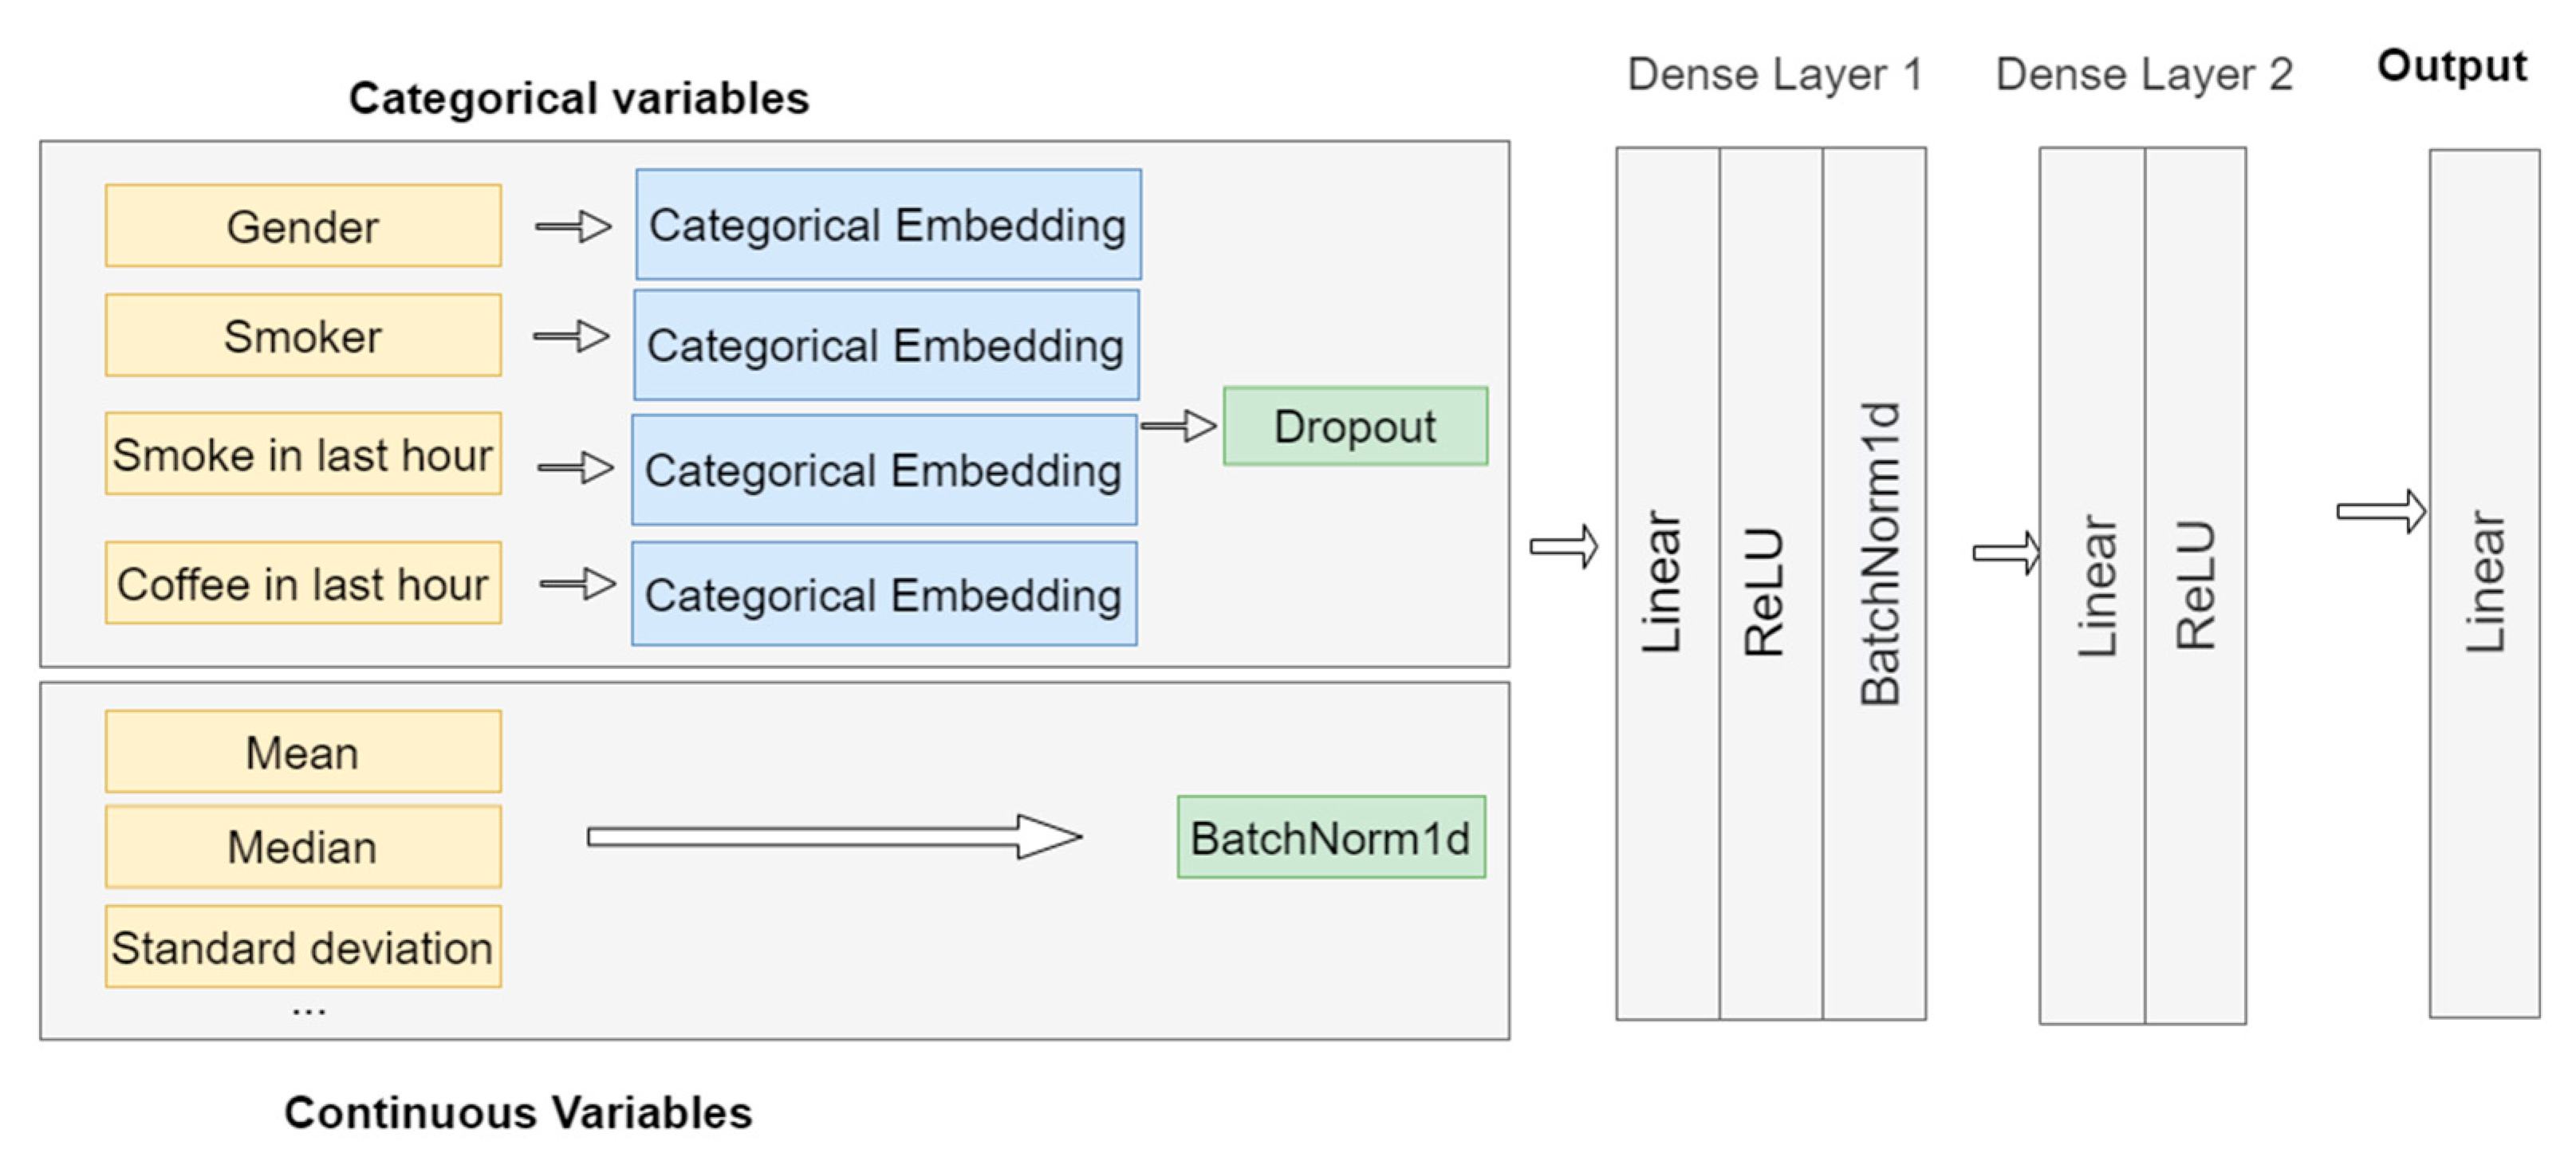
3.1. Training a Deep Learning Model by Combining Continues Variables and Entity Embeddings

In this Section, a deep learning model for stress classification is proposed. The proposed model combines the continuous and categorial input variables from the WESAD dataset in a neural network model. More specifically, we leverage the entity embedding technique for the representation of categorial variables, where each fixed value of the variable is represented as a numerical vector, typically with a low dimensionality. The aforementioned technique maps discrete values to a multidimensional space through a layer of linear neurons. Thus, the relationship between discrete values can be captured in the distance of the aforementioned vectors in a similar way to how word embeddings reflect semantic similarity in the NLP domain (e.g., given the categorical variable day, Sunday could be considered more similar to Saturday than it is to Monday).
Our model includes both continuous and categorical variables. Specifically, it includes 21 continuous variables which represent the features that were extracted from the WESAD dataset. The extraction process is described in detail in Section 4. The continuous variables include the mean value of the SC signals (after being smoothed and then normalized as proposed in [39]), the median, the standard deviation and other features as proposed in [40]. The categorical variables include the user’s gender, the information if the user is a smoker or not, if he/she smoked in the last hour before the experiment and if the user drank coffee in the last hour before the experiment.
The proposed neural network model for stress classification includes embedding layers for the categorical columns and a batch normalization layer for the continuous columns. The resulting representations are concatenated and fed into two fully connected layers with 200 and 100 nodes, respectively, followed by a dropout layer. A 2-hidden layer network is capable of representing an arbitrary decision boundary to a certain accuracy with rational activation functions and could approximate any smooth mapping with the accuracy [41,42]. The activation function used was ReLU as shown in the figure below (Figure 1). Thus, the categorical variables are transformed by the embedding layer before interacting with the continuous input variables. Finally, the output layer predicts the “stress” or “no stress” classes, based on the cross-entropy loss function. This procedure is shown in the Figure 1 below, while the composition of the training and validation sets is detailed in Section 3.2.

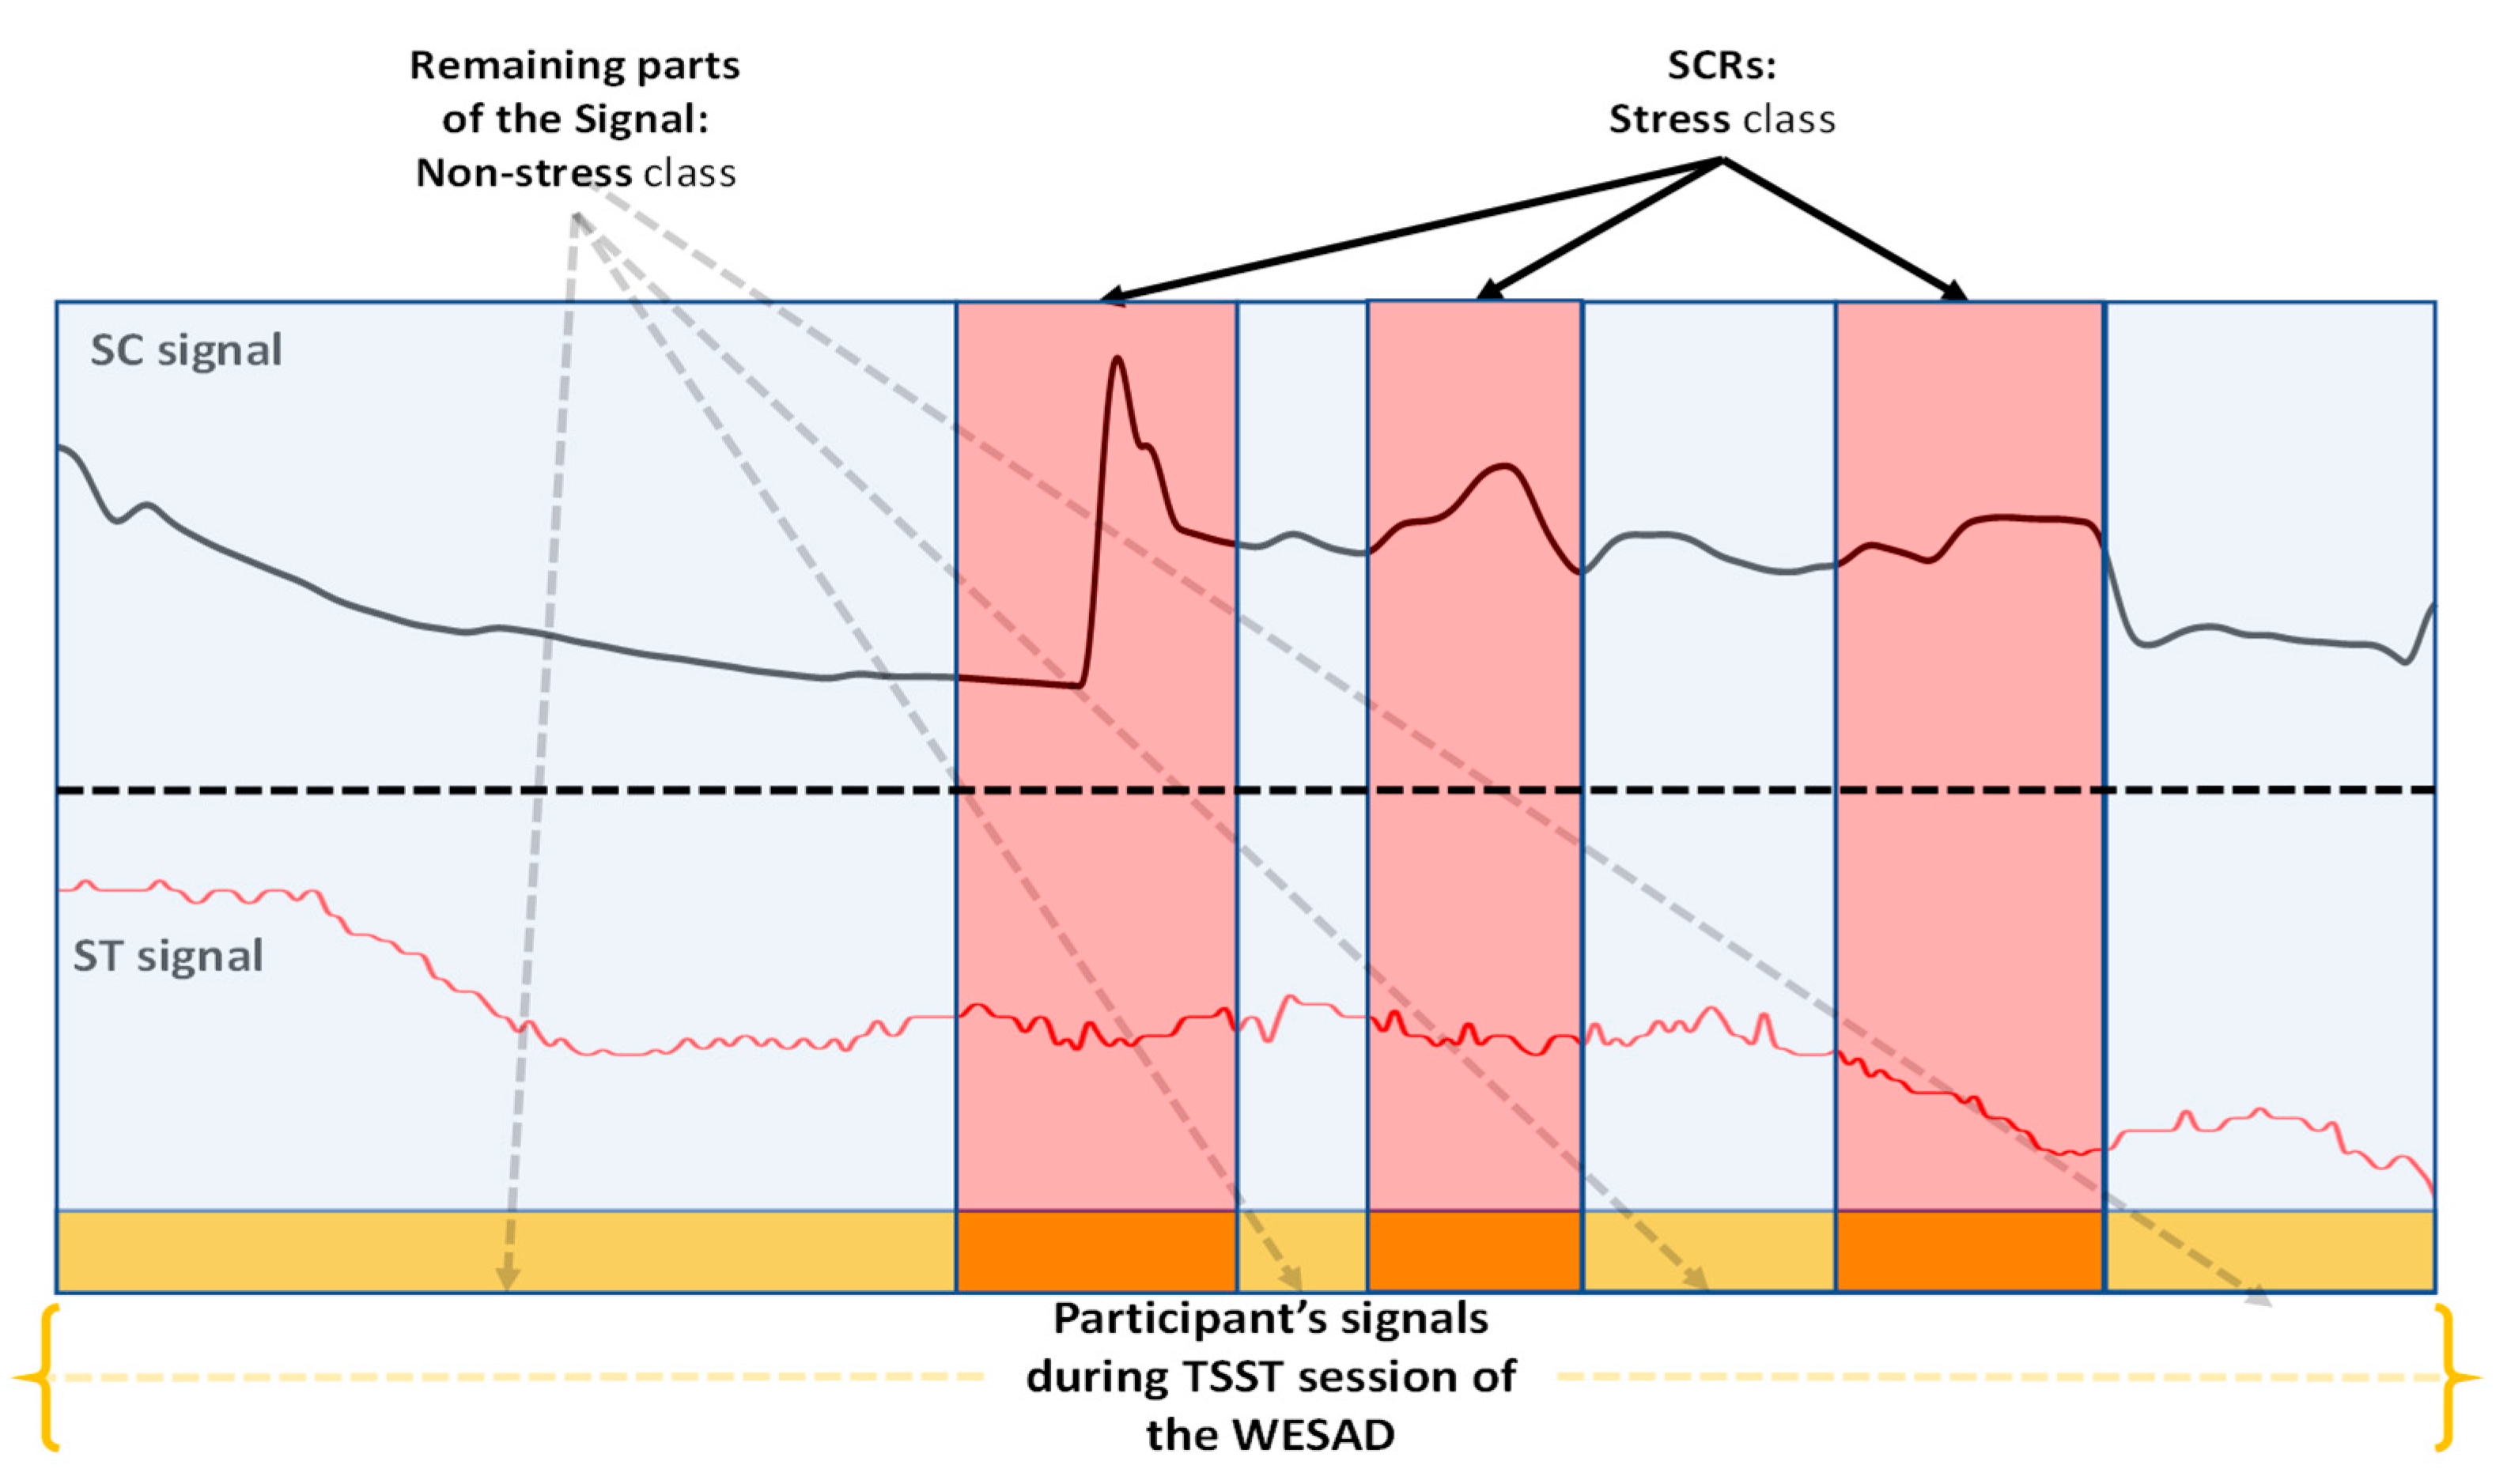
3.2. Training Dataset Creation

Identification of nonspecific skin conductance responses (NS-SCRs) from the SC signals included in the WESAD dataset were used as the pivotal point of analysis in order to create our training dataset.
More specifically, the use of intensive subperiods that might appear within an emotionally annotated period can probably contribute to the final assessment of the experienced emotion (i.e., feeling stressed, happy, angry, etc.). In terms of stress detection, intensive subperiods could be interpreted as NS-SCRs. In the present study, we used only the signals of the stress sessions (TSST) as already mentioned in Section 2.1. To this end, a validated software named PhysiOBS [28,43], freely available, was used to detect and extract periods of NS-SCR (see Figure 2). PhysiOBS integrates an appropriate mechanism which can detect and export significant NS-SCRs. Next, as proposed in [13], the NS-SCR segments with a duration longer or equal to 4 s from the NS-SCR’s initial deflection to peak were considered; a rule also applied in [44]. For the same time periods we also extracted the associated parts of skin temperature signal in the WESAD dataset (see also Figure 2). Both SC and ST signals were smoothed using the Hann function and then normalized as proposed in [39]. Both functionalities are supported from the software.
The detected significant NS-SCRs segments within each TSST session served as the stress class and the rest parts of the stress session served as the nonstress class. The specific dataset creation approach has been also applied in [45].

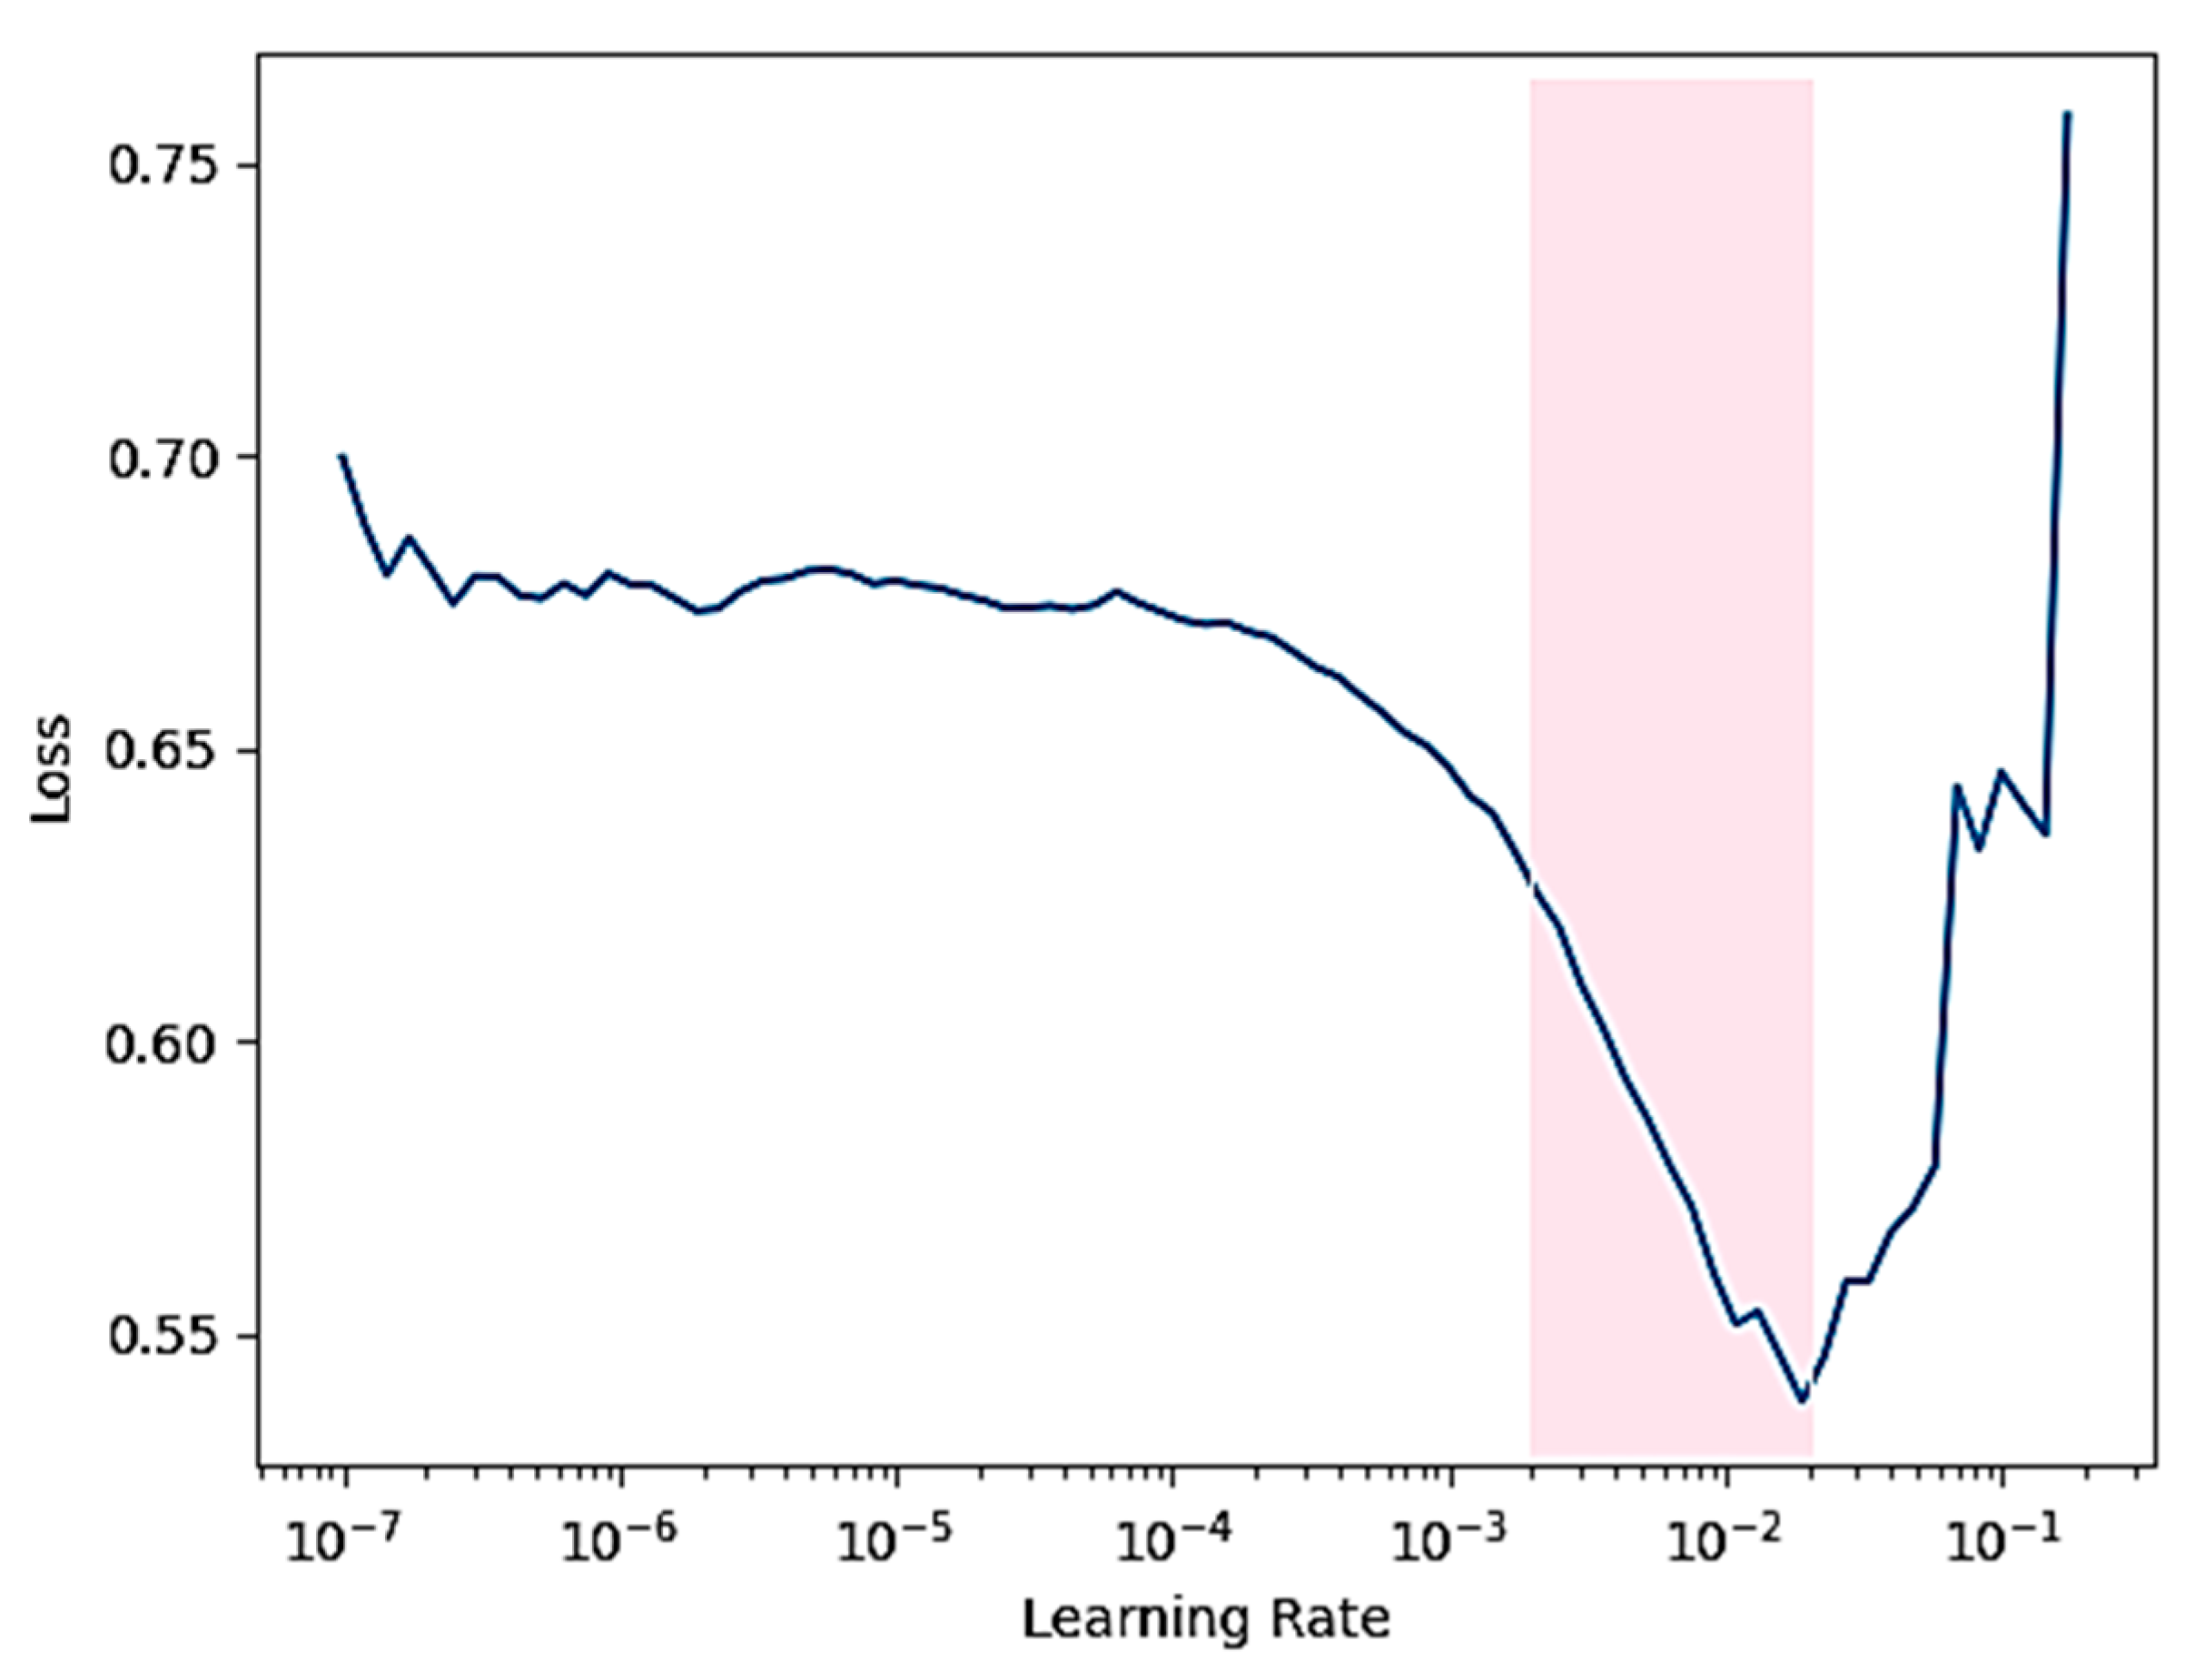
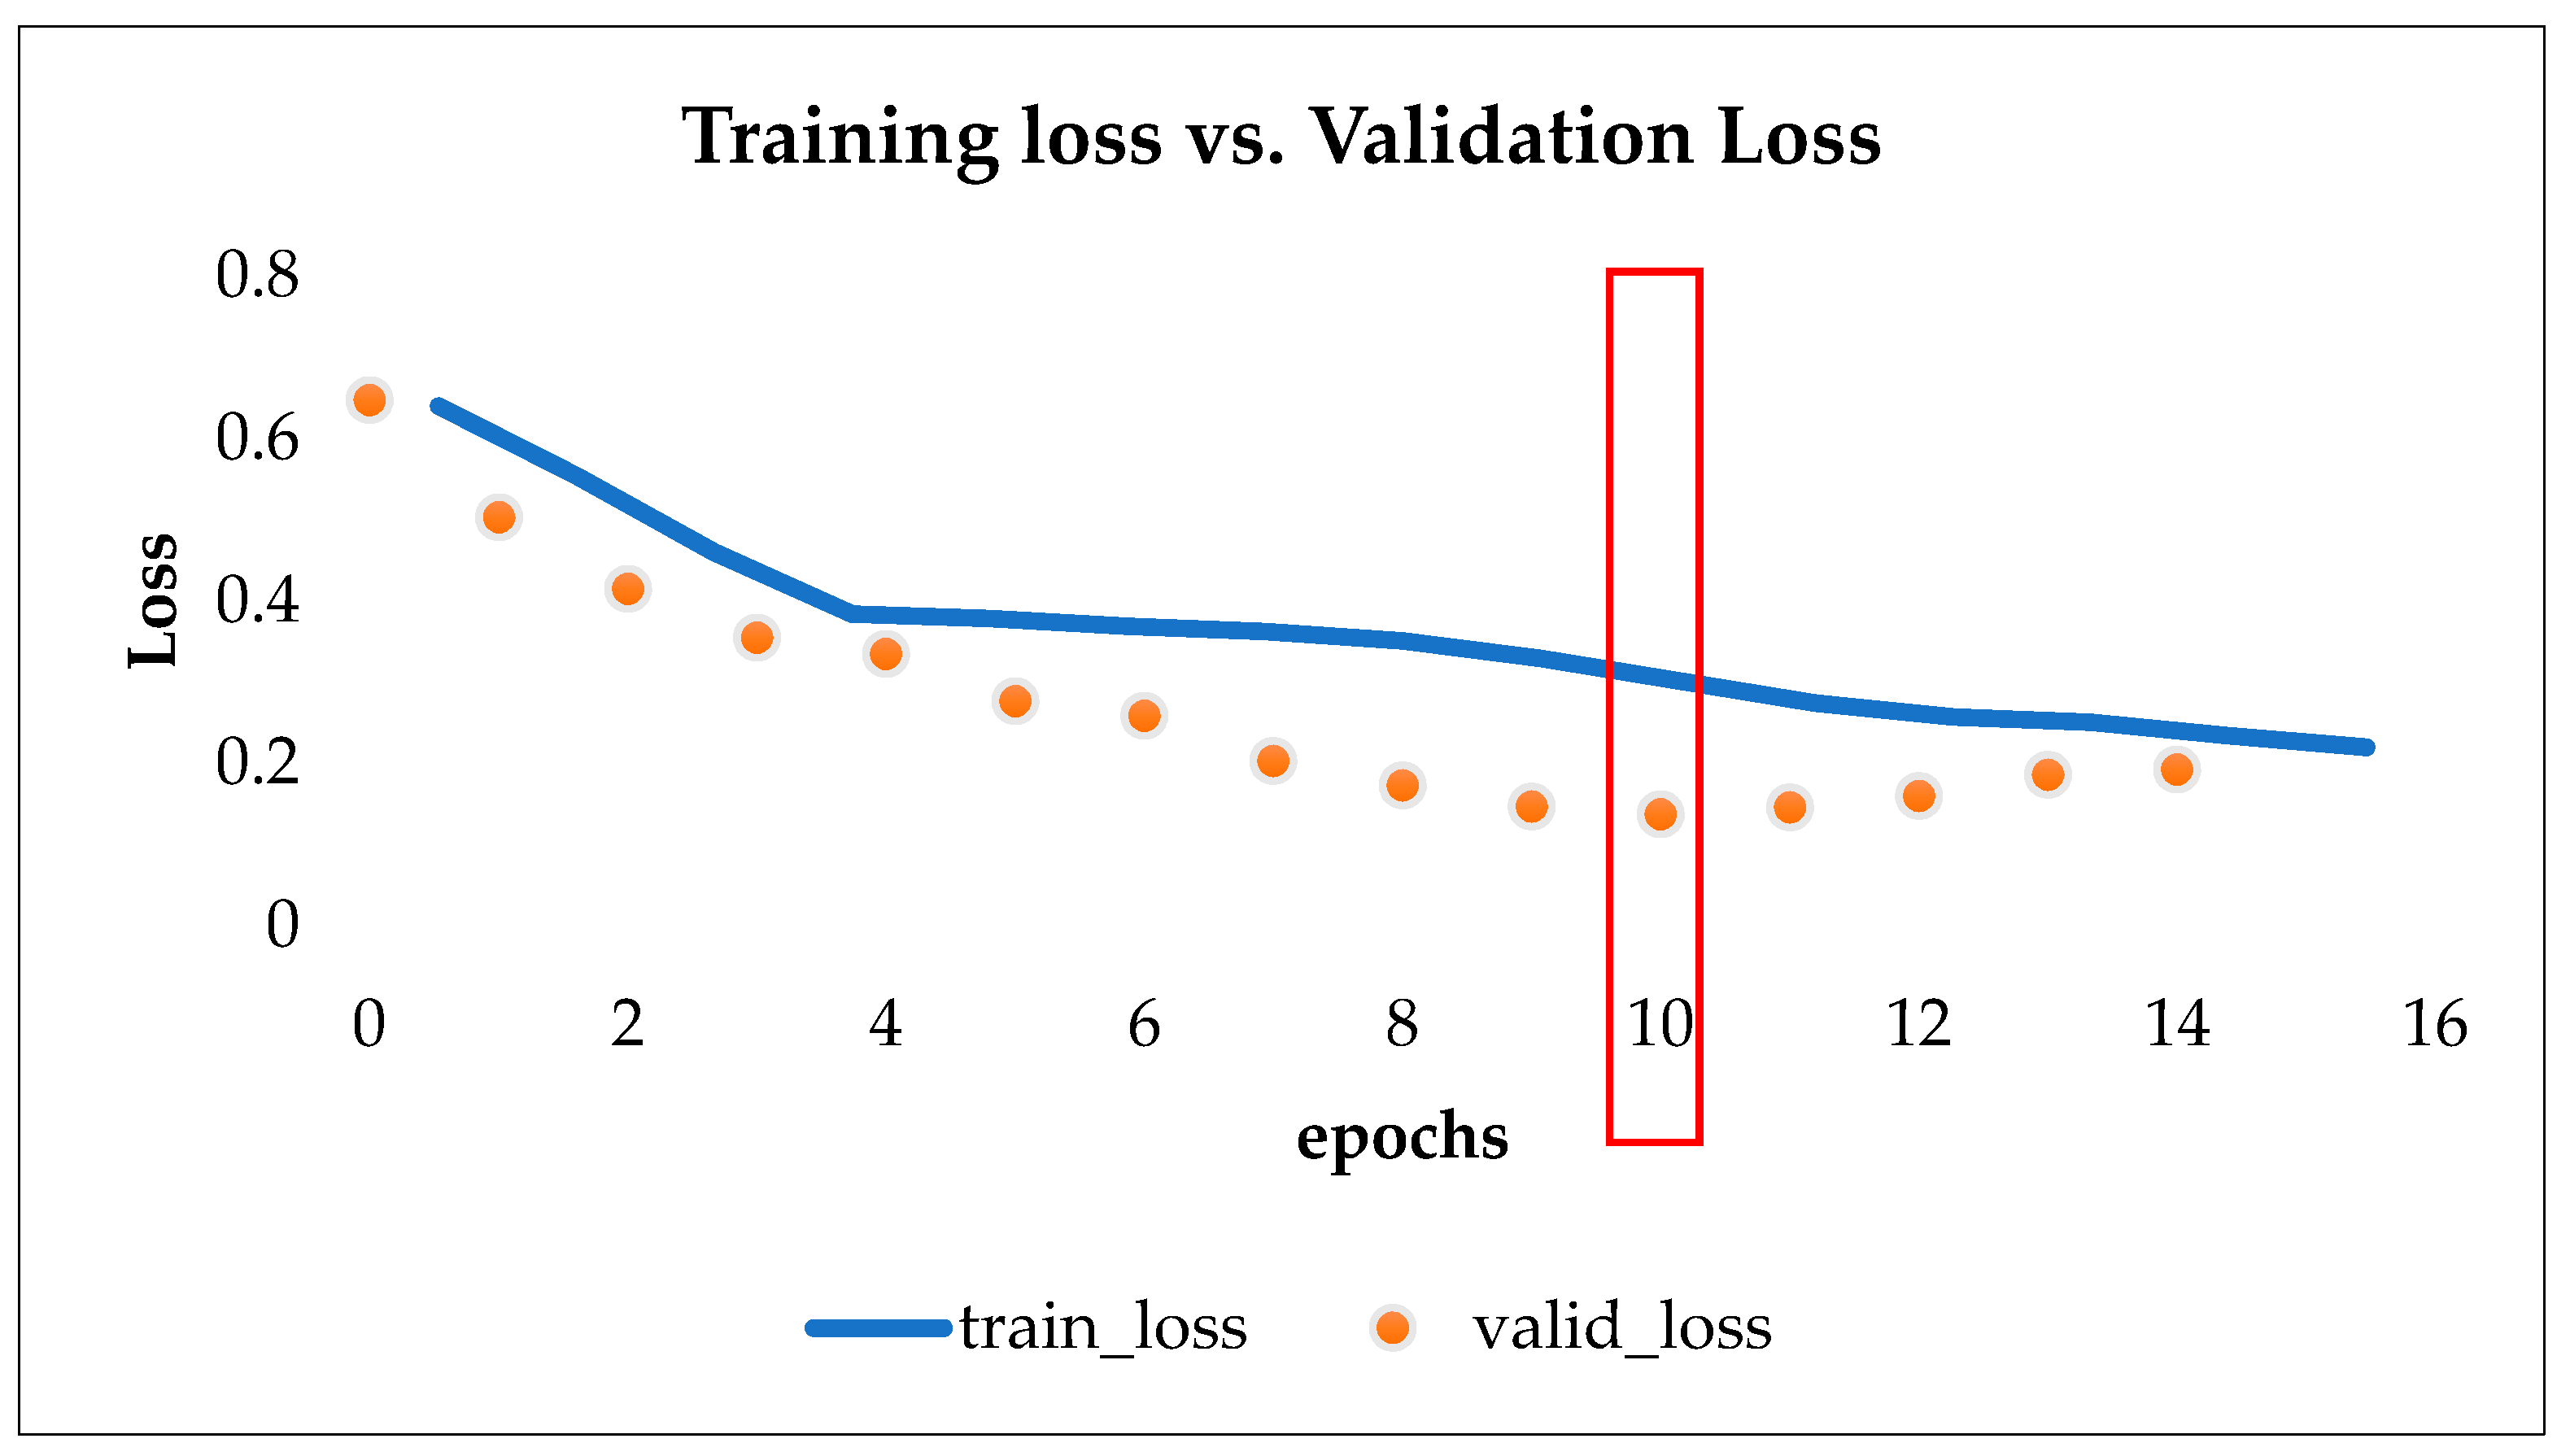
3.3. Training and Classification

Regarding the numeric inputs, 21 features were extracted from the SC signal’s amplitude as proposed in [40]. Furthermore, 15 features were also extracted from the ST signal’s amplitude as proposed in [26]. All these features were calculated over the 380 segments extracted from the NS-SCR segments within each TSST session as described in Section 3.2. In Figure 3a, the 380 segments of the first feature (i.e., mean value of the signal first difference) of SC signal’s amplitude are shown and in Figure 3b the corresponding values of ST signal’s amplitude are shown. It must be noted that 165 of them correspond to the class stress and 215 to the class nonstress. It can be seen in Figure 3a that there is a clear separation between the stress and nonstress classes, that implies a higher predictive value than in Figure 3b, where the values of the features are not clearly separated. This is also reflected in Table 1 where the skin conductance signal metrics outperform the corresponding skin temperature metrics.
As a next step, the extracted features were provided as input to the three machine learning algorithms (C-SVM, L-SVM and Q-SVM) and to the deep learning model aiming to differentiate the two emotional states (stress vs. nonstress).
Regarding the machine learning classification, a 5-fold cross-validation training was applied in all classification methods. Regarding the binary problem (stress vs. nonstress), Table 1 presents the obtained performance metric for each trained classifier. All classifiers achieved high accuracies (at least 91%). The best classification result was achieved by the L-SVM classifier (93.2%). These results indicate that our applied training method improved the classification results compared to the 80% accuracy reported by [26] when using only the SC signal. Furthermore, the confusion matrix (see Figure 4) presents details about the correctly classified cases for each trained model.
The plot of sensitivity versus 1-Specifity is called the receiver operating characteristic (ROC) curve and the area under this ROC curve is called area under the curve (AUC) (see Figure 5). Both ROC and AUC are effective measures of accuracy. This curve plays a central role in evaluating the diagnostic ability of tests to discriminate the true state of subjects. The AUC can be interpreted as the probability that a randomly chosen stress signal is rated or ranked as more likely to be stress than a randomly chosen nonstress signal. All classifiers achieved high AUC (at least 94%). The best AUC result was achieved by the L-SVM classifier (98%).
Regarding deep learning, two versions of the model were tested, with and without categorical variables, to assess their impact on classification accuracy. To increase the model performance, the optimal value of the learning rate hyperparameter was selected, based on its effect on loss, as shown in Figure 6.
Specifically, learning rate is a hyperparameter that decides how much gradient to be back propagated. This in turn determines by how much we move towards the minima. If the learning rate is set to be too small, the optimization takes a lot of time and performs tiny changes in the weights of the model which means that it makes the model converge slowly without real benefit. If the learning rate is too high, the optimizer may overshoot the minimum and may even get worst by diverging. As [46] suggests, we chose the learning rate one order lower than the learning rate where loss is minimum. Based on this approach, in the case of continuous variables (see Figure 6) the loss is minimum when the learning rate is 7 × 10⁻², therefore we used as a starting point the value 7 × 10⁻² where loss was still decreasing and after fine grained experiments, we ended up using the value 5 × 10⁻³.
One of the critical issues while training a neural network is overfitting [47]. Although we need a number of epochs to train a neural network model, the training model learns patterns that are specific to the sample data. In other words, the model loses generalization capacity by overfitting to the training data. To avoid overfitting and increase the generalization capacity of the neural network, the model should be trained for an optimal number of epochs. Loss and accuracy on the training set as well as on the validation set are monitored to look over the epoch number after which the model starts overfitting. As we can see from Figure 7, as the number of epochs increases beyond 10, the training set loss decreases but validation loss increases, depicting the overfitting of the model on training data. So, the ideal number of epochs is the point where the training loss is decreasing but the validation loss starts increasing and as we can see from Figure 7, the ideal number of epochs for our model (without categorical variables) is 10.
Regarding the binary problem (stress vs. nonstress), Table 2 presents the obtained performance metric for each trained classifier (with and without categorical variables. The best accuracy (97.4%) achieved by the deep learning model with categorical variables. These results indicate that our applied training method improved the classification results compared to the machine learning results (92.1%) and outperformed the 80% accuracy reported by [26] when using only the SC signal.

4. Testing the Models in Another Context

4.1. Ground Truth Physiological Dataset—UX Context

This section presents the ground truth physiological dataset that was used in order to assess the stress detection models created from the WESAD dataset. The UX dataset consists of skin conductivity (SC) segments that have been emotionally annotated by users’ self-reported ratings (valence−arousal scale). The recorded SC segments indicate usability issues confronted by users while they were interacting with a platform in the context of a UX evaluation study [28].
More specifically, the aforementioned study involved 30 participants (13 female), aged between 18 and 45 (mean = 32.1, SD = 7.1) who were asked to complete two interaction tasks on a web-based service while their SC was recorded. At the end of each user testing session, each participant was involved in a retrospective think aloud (RTA) protocol in order to report any usability issues (UIs) that they had confronted while performing the interaction tasks. For each one of their retrospectively reported UIs, the participant was asked to provide: (a) the duration of the confronted UI and (b) an emotional rating, using the emotional scale of valence (from 1 to 9)–arousal (from 1 to 9). All in all, a number of 113 emotionally annotated UIs were reported. For each annotated UI there was an associated segment of SC signal that constituted the ground truth biosignals dataset that was used in the present study to test the stress detection created from the WESAD dataset.

4.2. Evaluation of Classifiers

In Section 3 we presented the training process and the results of four classifiers. To this end, the SC signals from the publicly available dataset named WESAD were used. In order to measure the performance of the skin conductance trained models we used the dataset presented in Section 4.1. More specifically, the test dataset consists of 113 emotionally annotated (according to VA ratings) user-reported SC segments. The Kappa coefficient [48] metric was used to quantify the agreement between the users’ emotional ratings and created classifiers. Agreement among the raters ranged from −1 to 1. Values near or below zero suggest that the agreement is probably attributable to chance. In contrast, the higher the positive value of Kappa is, the higher the reliability is.
Regarding the ground truth dataset SC segments with a valence lower than 5 and arousal greater than 5 were assigned as stress and the rest SC segments as nonstress [39]. Next, the 113 SC segments, were used as an input to the trained classifiers. For each segment, each classifier returned the classification result (1 = stress, 2 = nonstress). The returned values of the stress models were compared with participants’ self-reported stress ratings that constituted our ground truth dataset. Table 3 presents the interrater reliability for each classifier. According to the levels of agreement presented in [49], the Q-SVM achieved a nonsignificant slight agreement; Kappa = 0.17, p > 0.05, 95% CI [−0.01, 0.35] indicating a fair agreement. The other two classifiers (C-SVM, L-SVM) returned Kappa values very close to zero, which means that there was no agreement at all.
The same procedure was followed with the deep learning model that was built and trained as described in Section 3.3. The proposed approach yielded very impressive results, compared to the machine learning classifiers, as the model achieved a Kappa Value of 0.27 (p < 0.05) which is 58.8% higher compared to the Q-SVM classifier shown in the table below (Table 3). It must be noted, that the deep learning model without categorical variables was leveraged, to ensure a fair comparison with the SVM classifiers.

5. Conclusions

There is a large number of publicly available physiological datasets that have been recorded during stress research. The majority of them have been recorded in a context where users have been exposed to intense stressors typically found in real-life conditions. Although such approaches are able to create stress prediction models with rather high classification accuracy, it remains questionable if they could be effectively used in capturing subtle stress responses, which are mostly expected in different contexts, such as UX evaluation studies [25].
In this paper we try to address the aforementioned question by conducting an in-depth investigation of the performance of such a dataset in the context of UX evaluation by combining traditional machine learning and deep-leaning approaches. To the best of our knowledge, this is the first study that uses deep-learning for stress detection in the UX context. More specifically, the WESAD dataset was used in order to train three popular machine learning classifiers and a neural network (NN). Regarding the binary classification problem (stress vs. nonstress), accuracy of up to 97.4% was reached by the NN classifier.
We assessed the performance of the stress models by conducting an interrater reliability analysis using the Kappa coefficient. To this end, an existing biosignals dataset, consisting of SC segments, was used as the ground truth dataset. The SC segments of the ground truth dataset represent users’ self-reported periods of usability issues confronted while they were interacting with a web-based platform during a UX evaluation.
With regard to results, the higher interrater reliability was found for the NN model; Kappa = 0.27, p < 0.05. The aforementioned level of agreement is quite comparable with the agreement level presented in [28]. In the latter, the same ground truth dataset was used. The reported interrater reliability was found to be statistically significant and fair-to-moderate; Kappa = 0.35, p < 0.001. This is probably explained by the fact that the stress assessment mechanism that was assessed against the ground truth dataset was trained with biosignals that had been recorded while users performed typical HCI tasks.
In the present study we assessed the classifiers performance by using only skin conductance. Such an approach aims to maximize practicality by reducing the number of sensors while maintaining accuracy in high levels. The present study serves as a first proof of concept by investigating if a dataset emotionally annotated in a context where users have been exposed to intense stressors can indeed be used effectively in a different context (i.e., UX evaluation). In the next steps of our work, more participants and additional datasets will be included to further increase the objectivity and accuracy of the presented results. In addition, other approaches, such as the use of categorical variables features in traditional machine learning (e.g., SVM), subject dependent training could create more efficient stress assessment mechanisms. Furthermore, a combination of the biosignals dataset from various contexts could be also a challenge for future work.
Overall, the results presented in this paper reveal that the use of existing biosignal datasets in various contexts should be carefully taken into consideration. Although the one size fits all approach is not suggested, this study provides interesting insights into the generalizability of the biosignals datasets.

Author Contributions

Conceptualization, A.L. and E.F.; methodology, A.L. and E.F.; writing—original draft preparation, A.L. and E.F.; writing—review and editing, All authors, visualization, All authors; supervision, C.P.A., G.K., N.V. All authors have read and agreed to the published version of the manuscript.

Funding

This research received no external funding.

Acknowledgments

This work has received funding from the European Union’s Horizon 2020 research and innovation programme under Grant Agreement No 872614 -SMART4ALL: Selfsustained Cross-Border Customized Cyberphysical System Experiments for Capacity Building among European Stakeholder.

Conflicts of Interest

The authors declare no conflict of interest.

References

  1. Sarsenbayeva, Z.; Marini, G.; van Berkel, N.; Luo, C.; Jiang, W.; Yang, K.; Wadley, G.; Dingler, T.; Kostakos, V.; Goncalves, J. Does Smartphone Use Drive Our Emotions or Vice Versa? A Causal Analysis. In Proceedings of the 2020 CHI Conference on Human Factors in Computing Systems, Honolulu, HI, USA, 25–30 April 2020; Association for Computing Machinery: New York, NY, USA, 2020; pp. 1–15. [Google Scholar]
  2. Remy, C.; Bates, O.; Dix, A.; Thomas, V.; Hazas, M.; Friday, A.; Huang, E.M. Evaluation Beyond Usability: Validating Sustainable HCI Research. In Proceedings of the 2018 CHI Conference on Human Factors in Computing Systems, Montreal, QC, Canada, 21–26 April 2018; ACM: New York, NY, USA, 2018; pp. 216:1–216:14. [Google Scholar]
  3. Silvennoinen, J.M.; Jokinen, J.P.P. Aesthetic Appeal and Visual Usability in Four Icon Design Eras. In Proceedings of the 2016 CHI Conference on Human Factors in Computing Systems, San Jose, CA, USA, 7–12 May 2016; Association for Computing Machinery: San Jose, CA, USA, 2016; pp. 4390–4400. [Google Scholar]
  4. Díaz-Oreiro, I.; López, G.; Quesada, L.; Guerrero, L.A. Standardized Questionnaires for User Experience Evaluation: A Systematic Literature Review. Proceedings 2019, 31, 14. [Google Scholar] [CrossRef] [Green Version]
  5. Tarnowski, P.; Kołodziej, M.; Majkowski, A.; Rak, R.J. Emotion Recognition Using Facial Expressions. Procedia Comput. Sci. 2017, 108, 1175–1184. [Google Scholar] [CrossRef]
  6. Rathour, N.; Alshamrani, S.S.; Singh, R.; Gehlot, A.; Rashid, M.; Akram, S.V.; AlGhamdi, A.S. IoMT Based Facial Emotion Recognition System Using Deep Convolution Neural Networks. Electronics 2021, 10, 1289. [Google Scholar] [CrossRef]
  7. Mao, Q.; Dong, M.; Huang, Z.; Zhan, Y. Learning Salient Features for Speech Emotion Recognition Using Convolutional Neural Networks. IEEE Trans. Multimed. 2014, 16, 2203–2213. [Google Scholar] [CrossRef]
  8. Tikadar, S.; Bhattacharya, S. A Novel Method to Build and Validate an Affective State Prediction Model from Touch-Typing. In Proceedings of the Human-Computer Interaction—INTERACT 2019, Paphos, Cyprus, 2–6 September 2019; Lamas, D., Loizides, F., Nacke, L., Petrie, H., Winckler, M., Zaphiris, P., Eds.; Springer International Publishing: Cham, Switzerland, 2019; pp. 99–119. [Google Scholar]
  9. Tikadar, S.; Kazipeta, S.; Ganji, C.; Bhattacharya, S. A Minimalist Approach for Identifying Affective States for Mobile Interaction Design. In Proceedings of the Human-Computer Interaction—INTERACT 2017, Mumbai, India, 25–29 September 2017; Springer: Cham, Switzerland, 2017; pp. 3–12. [Google Scholar]
  10. Maier, M.; Marouane, C.; Elsner, D. DeepFlow: Detecting Optimal User Experience From Physiological Data Using Deep Neural Networks. In Proceedings of the 18th International Conference on Autonomous Agents and MultiAgent Systems, Montreal, QC, Canada, 13–17 May 2019; International Foundation for Autonomous Agents and Multiagent Systems: Montreal, QC, Canada, 2019; pp. 2108–2110. [Google Scholar]
  11. Lazar, J.; Feng, J.H.; Hochheiser, H. Research Methods in Human-Computer Interaction; John Wiley & Sons: Hoboken, NJ, USA, 2010; ISBN 978-0-470-72337-1. [Google Scholar]
  12. Hernandez, J.; Paredes, P.; Roseway, A.; Czerwinski, M. Under Pressure: Sensing Stress of Computer Users. In Proceedings of the SIGCHI Conference on Human Factors in Computing Systems; ACM: New York, NY, USA, 2014; pp. 51–60. [Google Scholar]
  13. Boucsein, W. Electrodermal Activity, 2nd ed.; Springer: New York, NY, USA; Dordrecht, The Netherlands; Heidelberg, Germany; London, UK, 2012; ISBN 978-1-4614-1125-3. [Google Scholar]
  14. Quazi, M.T.; Mukhopadhyay, S.C.; Suryadevara, N.K.; Huang, Y.M. Towards the Smart Sensors Based Human Emotion Recognition. In Proceedings of the 2012 IEEE International Instrumentation and Measurement Technology Conference Proceedings, Graz, Austria, 13–16 May 2012; pp. 2365–2370. [Google Scholar]
  15. Kaklauskas, A. Web-based Biometric Computer Mouse Advisory System to Analyze a User’s Emotions and Work Productivity. In Biometric and Intelligent Decision Making Support; Kaklauskas, A., Ed.; Intelligent Systems Reference Library; Springer International Publishing: Cham, Switzerland, 2015; pp. 137–173. ISBN 978-3-319-13659-2. [Google Scholar]
  16. Cho, D.; Ham, J.; Oh, J.; Park, J.; Kim, S.; Lee, N.-K.; Lee, B. Detection of Stress Levels from Biosignals Measured in Virtual Reality Environments Using a Kernel-Based Extreme Learning Machine. Sensors 2017, 17, 2435. [Google Scholar] [CrossRef] [PubMed]
  17. Hui, T.K.L.; Sherratt, R.S. Coverage of Emotion Recognition for Common Wearable Biosensors. Biosensors 2018, 8, 30. [Google Scholar] [CrossRef] [Green Version]
  18. Suoja, K.; Liukkonen, J.; Jussila, J.; Salonius, H.; Venho, N.; Sillanpää, V.; Vuori, V.; Helander, N. Application for pre-processing and visualization of electrodermal activity wearable data. In EMBEC & NBC 2017; Springer: Berlin/Heidelberg, Germany, 2017; pp. 93–96. [Google Scholar]
  19. Lee, H.; Kleinsmith, A. Public Speaking Anxiety in a Real Classroom: Towards Developing a Reflection System. In Proceedings of the Extended Abstracts of the 2019 CHI Conference on Human Factors in Computing Systems, Glasgow, UK, 4–9 May 2019; Association for Computing Machinery: Glasgow, UK, 2019; pp. 1–6. [Google Scholar]
  20. Betella, A.; Zucca, R.; Cetnarski, R.; Greco, A.; Lanatà, A.; Mazzei, D.; Tognetti, A.; Arsiwalla, X.D.; Omedas, P.; De Rossi, D. Inference of Human Affective States from Psychophysiological Measurements Extracted under Ecologically Valid Conditions. Front. Neurosci. 2014, 8, 286. [Google Scholar] [CrossRef] [PubMed]
  21. Cowley, B.; Filetti, M.; Lukander, K.; Torniainen, J.; Henelius, A.; Ahonen, L.; Barral, O.; Kosunen, I.; Valtonen, T.; Huotilainen, M. The Psychophysiology Primer: A Guide to Methods and a Broad Review with a Focus on Human–Computer Interaction. Found. Trends Hum. Comput. Interact. 2016, 9, 151–308. [Google Scholar] [CrossRef] [Green Version]
  22. Koelstra, S.; Muhl, C.; Soleymani, M.; Lee, J.-S.; Yazdani, A.; Ebrahimi, T.; Pun, T.; Nijholt, A.; Patras, I. DEAP: A Database for Emotion Analysis; Using Physiological Signals. IEEE Trans. Affect. Comput. 2012, 3, 18–31. [Google Scholar] [CrossRef] [Green Version]
  23. Koldijk, S.; Sappelli, M.; Verberne, S.; Neerincx, M.A.; Kraaij, W. The SWELL Knowledge Work Dataset for Stress and User Modeling Research. In Proceedings of the 16th International Conference on Multimodal Interaction, Istanbul, Turkey, 12–16 November 2014; ACM: New York, NY, USA, 2014; pp. 291–298. [Google Scholar]
  24. Subramanian, R.; Wache, J.; Abadi, M.K.; Vieriu, R.L.; Winkler, S.; Sebe, N. ASCERTAIN: Emotion and Personality Recognition Using Commercial Sensors. IEEE Trans. Affect. Comput. 2018, 9, 147–160. [Google Scholar] [CrossRef]
  25. Alberdi, A.; Aztiria, A.; Basarab, A. Towards an Automatic Early Stress Recognition System for Office Environments Based on Multimodal Measurements: A Review. J. Biomed. Inform. 2016, 59, 49–75. [Google Scholar] [CrossRef] [PubMed]
  26. Schmidt, P.; Reiss, A.; Duerichen, R.; Marberger, C.; Van Laerhoven, K. Introducing WESAD, a Multimodal Dataset for Wearable Stress and Affect Detection. In Proceedings of the 20th ACM International Conference on Multimodal Interaction, Boulder, CO, USA, 16–20 October 2018; ACM: New York, NY, USA, 2018; pp. 400–408. [Google Scholar]
  27. Howard, J.; Gugger, S. Fastai: A Layered API for Deep Learning. Information 2020, 11, 108. [Google Scholar] [CrossRef] [Green Version]
  28. Liapis, A.; Katsanos, C.; Karousos, N.; Xenos, M.; Orphanoudakis, T. User Experience Evaluation: A Validation Study of a Tool-Based Approach for Automatic Stress Detection Using Physiological Signals. Int. J. Hum.–Comput. Interact. 2021, 37, 470–483. [Google Scholar] [CrossRef]
  29. Chow, C.; Gedeon, T. Evaluating Crowdsourced Relevance Assessments Using Self-Reported Traits and Task Speed. In Proceedings of the 29th Australian Conference on Computer-Human Interaction; Association for Computing Machinery: Brisbane, Qld, Australia, 2017; pp. 407–411. [Google Scholar]
  30. Khorram, S.; Jaiswal, M.; Gideon, J.; McInnis, M.; Mower Provost, E. The PRIORI Emotion Dataset: Linking Mood to Emotion Detected In-the-Wild. In Proceedings of the Interspeech 2018, Hyderabad, India, 2–6 September 2018; ISCA: Hyderabad, India, 2018; pp. 1903–1907. [Google Scholar]
  31. Pakarinen, T.; Pietilä, J.; Nieminen, H. Prediction of Self-Perceived Stress and Arousal Based on Electrodermal Activity*. In Proceedings of the 2019 41st Annual International Conference of the IEEE Engineering in Medicine and Biology Society (EMBC), Berlin, Germany, 23–27 July 2019; pp. 2191–2195. [Google Scholar]
  32. Bruun, A. It’s Not Complicated: A Study of Non-Specialists Analyzing GSR Sensor Data to Detect UX Related Events. In Proceedings of the 10th Nordic Conference on Human-Computer Interaction, Oslo, Norway, 29 September–3 October 2018; ACM: Oslo, Norway, 2018; pp. 170–183. [Google Scholar]
  33. Liu, Y.; Du, S. Psychological Stress Level Detection Based on Electrodermal Activity. Behav. Brain Res. 2018, 341, 50–53. [Google Scholar] [CrossRef]
  34. Jussila, J.; Venho, N.; Salonius, H.; Moilanen, J.; Liukkonen, J.; Rinnetmäki, M. Towards Ecosystem for Research and Development of Electrodermal Activity Applications. In Proceedings of the 22nd International Academic Mindtrek Conference, Tampere, Finland, 10–11 October 2018; Association for Computing Machinery: Tampere, Finland, 2018; pp. 79–87. [Google Scholar]
  35. Breiman, L.; Friedman, J.H.; Olshen, R.A.; Stone, C.J. Classification and Regression Trees. Belmont, CA: Wadsworth. Int. Group 1984, 432, 151–166. [Google Scholar]
  36. Chen, T.; He, T.; Benesty, M.; Khotilovich, V.; Tang, Y.; Cho, H. Xgboost: Extreme Gradient Boosting. R Package Version 0.4-2. 2015, Volume 1. Available online: https://mran.microsoft.com/web/packages/xgboost/vignettes/xgboost.pdf (accessed on 26 May 2021).
  37. Joachims, T. Training Linear SVMs in Linear Time. In Proceedings of the 12th ACM SIGKDD on Knowledge Discovery and Data Mining, Philadelphia, PA, USA, 20–23 August 2006; pp. 217–226. [Google Scholar]
  38. Guo, C.; Berkhahn, F. Entity Embeddings of Categorical Variables. arXiv 2016, arXiv:1604.06737. [Google Scholar]
  39. Mandryk, R.L.; Atkins, M.S. A Fuzzy Physiological Approach for Continuously Modeling Emotion during Interaction with Play Technologies. Int. J. Hum.-Comput. Stud. 2007, 65, 329–347. [Google Scholar] [CrossRef]
  40. Healey, J.; Picard, R. Detecting Stress during Real-World Driving Tasks Using Physiological Sensors. IEEE Trans. Intell. Transp. Syst. 2005, 6, 156–166. [Google Scholar] [CrossRef] [Green Version]
  41. Heaton, J. Introduction to Neural Networks for Java, 2nd ed.; Heaton Research, Inc.: Chesterfield, UK, 2008; ISBN 978-1-60439-008-7. [Google Scholar]
  42. Sewak, M.; Sahay, S.K.; Rathore, H. An Overview of Deep Learning Architecture of Deep Neural Networks and Autoencoders. J.Comput. Theor. Nanosci. 2020, 17, 182–188. [Google Scholar] [CrossRef]
  43. Liapis, A.; Karousos, N.; Katsanos, C.; Xenos, M. Evaluating user’s emotional experience in HCI: The physiOBS approach. In Human-Computer Interaction. Advanced Interaction Modalities and Techniques; Kurosu, M., Ed.; Lecture Notes in Computer Science; Springer International Publishing: Berlin/Heidelberg, Germany, 2014; pp. 758–767. ISBN 978-3-319-07229-6. [Google Scholar]
  44. Bruun, A.; Law, E.L.-C.; Heintz, M.; Alkly, L.H.A. Understanding the Relationship between Frustration and the Severity of Usability Problems: What Can Psychophysiological Data (Not) Tell Us? In Proceedings of the 2016 CHI Conference on Human Factors in Computing Systems, San Jose, CA, USA, 7–12 May 2016; ACM: New York, NY, USA, 2016; pp. 3975–3987. [Google Scholar]
  45. Liapis, A.; Katsanos, C.; Karousos, N.; Xenos, M.; Orphanoudakis, T. UDSP+: Stress Detection Based on User-Reported Emotional Ratings and Wearable Skin Conductance Sensor. In Proceedings of the Adjunct Proceedings of the 2019 ACM International Joint Conference on Pervasive and Ubiquitous Computing and Proceedings of the 2019 ACM International Symposium on Wearable Computers, London, UK, 9–13 September 2019; ACM: New York, NY, USA, 2019; pp. 125–128. [Google Scholar]
  46. Smith, L.N. A Disciplined Approach to Neural Network Hyper-Parameters: Part 1—Learning Rate, Batch Size, Momentum, and Weight Decay. arXiv 2018, arXiv:1803.09820. [Google Scholar]
  47. Lawrence, S.; Giles, C.L. Overfitting and Neural Networks: Conjugate Gradient and Backpropagation. In Proceedings of the IEEE-INNS-ENNS International Joint Conference on Neural Networks. IJCNN 2000. Neural Computing: New Challenges and Perspectives for the New Millennium, Como, Italy, 27 July 2000; IEEE: Piscataway, NJ, USA, 2000; Volume 1, pp. 114–119. [Google Scholar]
  48. Cohen, J. A Coefficient of Agreement for Nominal Scales. Educ. Psychol. Meas. 1960, 20, 37–46. [Google Scholar] [CrossRef]
  49. Landis, J.R.; Koch, G.G. The Measurement of Observer Agreement for Categorical Data. Biometrics 1977, 33, 159–174. [Google Scholar] [CrossRef] [PubMed] [Green Version]
Figure 1. A visualization of the neural network (deep-learning model) architecture and training process. Continuous and categorical variables (left part) are combined in order to feed 2 interconnected hidden layers (dense 1 and 2).
Electronics 10 01550 g001
Figure 2. An example of the dataset creation process. From each skin conductance (SC) and skin temperature (ST) signal in the WESAD dataset we extract the appropriate parts as indicated by the duration of the detected NS-SCRs. The detected NS-SCRs segments served as the stress class. The rest parts of the signal served as the nonstress class.
Electronics 10 01550 g002
Figure 3. An instance of skin conductance predictors and skin temperature. The orange color indicates the stress class and blue the nonstress class: (a) skin conductance predictors separate classes well; (b) temperature predictors did not separate the classes well.
Electronics 10 01550 g003
Figure 4. Confusion matrix for each signal per classifier. Figure shows the correctly classified (green rectangles) cases per class. Overall, the training dataset consisted of 380 cases; 165 in the class stress and 215 in the class nonstress. Green parts show the correctly classified cases for each classifier.
Electronics 10 01550 g004
Figure 5. Receiver operating characteristic (ROC) curve behavior and area under the curve (AUC) metric for skin conductance signals per trained model. Red dot in each plot shows classifiers’ optimal performance between true positive rate (TPR) and false positive rate (FPR).
Electronics 10 01550 g005
Figure 6. Learning rate chart. Pink rectangle indicates an area of optimal choices. In our case the ~7 × 10⁻² learning rate was used.
Electronics 10 01550 g006
Figure 7. The red rectangle highlights the number of selected epochs. The selection process takes into consideration the point where training loss decreases and validation loss starts to increase.
Electronics 10 01550 g007
Table 1. Performance for each signal (skin conductance: SC, skin temperature: ST) per classifier. The F1-score is also an important metric when there are imbalanced classes as in our case.
C-SVML-SVMQ-SVM
PrecisionSC89.7%92.6%92.4%
ST37.1%25.0%33.3%
RecallSC89,7%91.5%88.5%
ST31.5%03.6%22.4%
AccuracySC91.1%93.2%91.8%
ST47.1%53.4%46.8%
F1-ScoreSC89.7%92.1%90.4%
ST34.1%06.3%26.8%
Table 2. Performance of the deep learning model.
Without Categorical VariablesWith Categorical Variables
Train lossSC48.227.5
ST5452.1
SC_ST48.626.9
Valid lossSC29.113.8
ST48.744.3
SC_ST28.814.4
AccuracySC94.797.4
ST78,983.2
SC_ST94.797.3
F1-ScoreSC92.897.7
ST6067.1
SC_ST92.997.6
Table 3. Interrater reliability (IRR) values and confidence interval (CI) 95% for each classifier.
Trained ModelKappa Value95% CI
C-SVM−0.02[−0.20, 0.16]
L-SVM0.02[−0.16, 0.20]
Q-SVM0.17[−0.01, 0.35]
NN model0.27[0.09, 0.45]
Publisher’s Note: MDPI stays neutral with regard to jurisdictional claims in published maps and institutional affiliations.

