Article

Managing SARS-CoV-2 Testing in Schools with an Artificial Intelligence Model and Application Developed by Simulation Data

by
Svetozar Zarko Valtchev
1,*,
Ali Asgary
2,
Michael Chen
3,
Felippe A. Cronemberger
4,
Mahdi M. Najafabadi
5,
Monica Gabriela Cojocaru
6 and
Jianhong Wu
1
1
Laboratory for Industrial and Applied Mathematics, York University, Toronto, ON M3J 1P3, Canada
2
Disaster & Emergency Management, School of Administrative Studies, Faculty of Liberal Arts and Professional Studies, Advanced Disaster, Emergency and Rapid Response Simulation, York University, Toronto, ON M3J 1P3, Canada
3
Department of Mathematics & Statistics, York University, Toronto, ON M3J 1P3, Canada
4
Center for Technology in Government (CTG), University at Albany, Albany, NY 12222, USA
5
Advanced Disaster, Emergency and Rapid Response Simulation, York University, Toronto, ON M3J 1P3, Canada
6
Department of Mathematics & Statistics, University of Guelph, Guelph, ON N1G 2W1, Canada
*
Author to whom correspondence should be addressed.
Electronics 2021, 10(14), 1626; https://doi.org/10.3390/electronics10141626
Submission received: 23 April 2021 / Revised: 23 June 2021 / Accepted: 5 July 2021 / Published: 7 July 2021

Abstract

:
Research on SARS-CoV-2 and its social implications have become a major focus to interdisciplinary teams worldwide. As interest in more direct solutions, such as mass testing and vaccination grows, several studies appear to be dedicated to the operationalization of those solutions, leveraging both traditional and new methodologies, and, increasingly, the combination of both. This research examines the challenges anticipated for preventative testing of SARS-CoV-2 in schools and proposes an artificial intelligence (AI)-powered agent-based model crafted specifically for school scenarios. This research shows that in the absence of real data, simulation-based data can be used to develop an artificial intelligence model for the application of rapid assessment of school testing policies.

1. Introduction

The SARS-COVID pandemic has imposed a historical toll to communities across the globe. As vaccination campaigns start to get rolled out to specific segments of the society, the need for systematic efforts to optimize policy throughputs in times of constrained resources is a concern to authorities and the most vulnerable. Several of those efforts are focused on social hubs, such as schools, where close contacts are frequent and expected, which can be potentially risky as contamination escalates and remains difficult to detect.
Opening or closing of schools has been one of the most complicated public health policies during the COVID-19 pandemic [1], a debate that echoes voices from parents, educators, mental health specialists and the community at large, all of them with different perspectives on the brevity and rigor of guidelines put forth by public health agencies. According to [2], there are risks and benefits at play that justify a careful examination of tradeoffs between lifting restrictions and sacrificing some of the positive outcomes obtained through them.
Despite several operational inefficiencies in its delivery, testing has been a central part in fighting the COVID-19 pandemic, particularly when it comes to taking steps towards preventing further contamination. Authorities have been considering testing as an integral part of health planning and policy, and several efforts have been dedicated to rolling out initiatives to trace the disease outbreak. As far as school testing is concerned, there is still little knowledge or consensus on what is the best way to approach it. In this context, variables such as costs and the operational hurdles of getting students and staff vaccinated efficiently come in the way, often further justifying the importance of planning and of optimal solutions to allocate resources and control the spread of the virus. Despite limited resources for testing, recent advancements in computation are expected to improve responses to the pandemic, especially if combined with established simulation techniques.
This research demonstrates an application for assessing the impacts of preventative testing at schools developed based on data derived from an agent-based simulation and empowered by an artificial intelligence model. The components expand upon previous AI-enabled simulation modeling work [3] by enhancing predictive capabilities of some simulation parameters observed to be critical in previous preventative testing research on mass vaccination [4,5]. Since literature on the intersect of simulation modeling, artificial intelligence, and school testing is particularly scarce, contributions of this focus not only on outputs but on the extent to which AI-driven simulation artifacts can be replicated to other contexts and emergency scenarios. Observations are presented and discussed and comments on the path forward are presented in the conclusion.

2. Background

2.1. School Testing and Its Challenges

There are several challenges associated with testing in schools. These challenges can be related to statistical power, such as the amount of tests needed in order to find infected subjects; personal and social, such as the discomfort anticipated for testing children with swabs and the stress coming from it; and operational, such as the cost of planning the testing processes, of conducting them, and the inherent delays associated to time management and follow up. Outside of the school boundaries, managing public acceptance and expectations, as well as privacy issues related to information handling, are also challenges for which authorities should be prepared for.
These obstacles should be acknowledged and in light of school testing goals set forth by the European Centre for Disease Control (ECDC), early identification of cases and high risk profiles figures as a top priority. These goals should also count on extensive collaboration and support from organizations that act beyond schools, several of which could both affect the effectiveness of school testing and be affected by testing routines. Interorganizational benefits may include more information and broader understanding of community outbreaks; more effective policy design towards protecting children and the most vulnerable; reduction in the number of severe cases and the hospitalization that often comes from it; and overall sense of safety providing testing and protective measures are in place. Markedly, lack of testing leaves officials and communities in the dark or not being able to proactively observe trends and adapt measures accordingly. If combined with other public health concerns, not knowing enough about the recent pandemic appears to be the riskier way out of the virus and a crisis that is still novel in various aspects.
Current school testing initiatives for COVID-19 conducted by public health authorities include regular testing at random as part of students’ routine; testing people with symptoms or suspected of having symptoms; and one-time testing once staff and student body return to education facilities. Testing endeavors are usually combined with self-quarantine measures and can be conducted in schools or in other sites. The model in this paper assumes school testing will be conducted at random across different school facilities. For those, parameters such as test frequency, delay between testing and results, expiration data for testing batches and follow up steps are considered as inputs in the model. Considerations about the appropriateness of simulations to emergency response situations such as school testing for COVID-19 outbreak are outlined next.

2.2. Simulation Modeling Option and Artificial Intelligence

The COVID-19 pandemic brings forth challenges that ask for optimal solutions in terms of tactical approaches and policy. These challenges have resorted data intensive modeling [6] and computational intelligence methods [7] that embrace the complexity of the issues that arise from the pandemic, from lack of human resources [8] and data resources [9,10], to the lack of emergency preparedness and capabilities to respond effectively [11]. An increasing amount of studies set out to explore models and artifacts that leverage artificial intelligence (AI) methods and methodologies to explore pandemic facts and circumstances from several differing yet often complementary angles, from the composites and overarching description of the virus itself [12], to diseases detection and diagnosis [13,14] to prediction on infection rates [15], patient management [16], the protection of healthcare workers [17,18], as well as hygiene measures, prevention and containment [19], drug development [20], and treatment [21,22,23]. The use of AI techniques is perceived to be a paradigm shift [24] towards approaches that use data science in empowering ways to craft, test and deploy public health care policies [25,26]. As a newly pervasive aspect of citizens’ routines around the globe, the pandemic is not only fostering the application of frontier technologies [27], but also other ways of looking at and leveraging existing data, such as hospital key performance indicators (KPIs), from other perspectives [28].
On top of the relative recency of the problems and the overall lack of preparedness in face of an unprecedented scenario [29], researchers have limited research artifacts and data to work with [30], and little attitude to risk themselves in the field, which has opened the frontier to robotics [31,32] and mobile crowdsourcing [33] as data and information gathering methods for the COVID era. Furthermore, there are ethical concerns in terms of what those attempts are set out to achieve, and what responsibilities should be monitored and assessed. That highlights the importance of simulation modeling as an accountable approach to intricate public policy problems, where a stakeholder perspective needs to be considered in the light possible scenarios, the environment and social context where policies are being enacted [34] and their path forward [35].
Simulations are established as important methods to understand future scenarios in light of current conditions [3,36]. As a practice and a methodology, modeling lays the ground on necessary assumptions and parameters according to which agents are expected to behave and under which systems operate [37]. It also allows for desired goals to be taken into account in optimization efforts [38], a pursuit that benefits from problem framing and conceptualization efforts [39,40], and systematic discussions around simulation artifacts, a practice referred to in literature as focused on collaborative model building [41]. While centered in practical ways of understanding issues and designing policies, these initiatives are also epistemic, for they introduce ways of building knowledge from existing knowledge in combination with empirical or theoretical data [42]. Simulation modeling is especially relevant to devise strategies and mitigate the impacts of crisis such as the one unraveled by COVID-19. It is known to inform decision-making, support resource prioritization and resource allocation, the identification of logistical and operational bottlenecks [39], and performance losses. In the context of the pandemic, it has also been observed that it comes at a low computational cost [43] and opportunities to gain scale when analyzing highly dynamic scenarios [44].
Artificial intelligence techniques are being increasingly leveraged across several domains and appear to have established a new paradigm for the next decades [45,46,47]. According to [47], lack of data for machine learning scientists limits the applicability of those techniques and justify the need for a “cyber-infrastructure to fuel world-wide collaboration” through which more access to data sources can be leveraged. While the power to make predictions has been portrayed as being mostly positive as far as its expeditious and predictive capabilities, ethical concerns regarding security and transparency in AI applications, often discussed outside the realm of COVID applications, are also being framed as one of the collaterals as a policy issue [8,48]. According to [49], large-scale utilization of artificial intelligence may encounter obstacles not only in terms of legal and ethical aspects, but also in the lack of process frameworks and the standards that could be set forth by it.
The role of AI in pandemic-fighting and mitigation is broad, and several studies have focused on defining boundaries in the research space [28,31,50,51,52,53,54] yet to be fully captured, particularly due to the recency of the scenario and to the possibilities that cross- pollination across modeling realms and domains have not been unfolded or become evident [6,55]. Bullock [51] has divided research in AI into three scales: molecular, dedicated to understanding the nature of the decease and the appropriate responses (e.g., testing and vaccines); clinical, focused on operational and technical routines in hospitals (e.g., medical imaging); and the societal, where overarching impacts and risks to communities are assessed and simulated for better efficacy. This broader categorization echoes more research that is focused on contextualizing contemporary technologies during the pandemic [56]. Examples would include applications of big data [57], the Internet of Things (IoT) [58] and blockchain [59], all of them displaying relationships with artificial intelligence solutions to some extent [60,61].

2.3. AI in Simulation Modeling for School Testing Scenarios

In face of known data and modeling constraints concerning the use of data-intensive applications [25,35], steps are being taken incrementally, ranging from the use of unsupervised methods towards a panoramic view of pandemic’s behavior [62,63], to more simulation-centered ones, focused on parameter optimization and predictions [3,31]. Testing in school settings carries some of operational obstacles, including discomfort for children, the logistics of the delivery, and public acceptance [4,61]. These conditions interact to produce an uncertain scenario, where states and prior conditions such as diagnostic capacity and epidemiological monitoring affect the likelihood of reopening [64]. Such a complex interplay makes simulation modeling particularly fitting to school testing scenarios for which parameters and extreme conditions, as well as mixing patterns [65] can be put to verification in light of theories, other models, and findings.
Several studies have leveraged simulation modeling for reopening of public spaces like school or colleges, with mixing methodological formats and findings emerging. Studies leveraged data from ongoing research and guidelines from intergovernmental agencies such as the World Health Organization (WHO), which provides advice on the ways in which the virus gets spread [66]. The data qualitatively informed the selection and calibration of parameters such as the availability of tests [67], levels of preparedness and response capacity at schools [68], hygiene guidance [69], target groups [70], demographic factors [71], geographies [72], the expected amount of unrecorded symptomatic people [73], individual pre-existing conditions [74] and the cost of measures being implemented [75]. The sensitivity of those parameters to uncertainties [76], to hypothetical scenarios such as the additional impact of isolation and quarantine [77], as well as the overall efficiency of arrangements such as test-trace-isolate [1] or diagnosing-screening-surveilling arrangements [78] have thus far informed modeling architectures.
While most modeling endeavors have not necessarily discussed artificial intelligence applications to school testing, a few have conversed with pertaining concepts such as optimization towards desired performance means [73] and rule-based models [79,80,81,82].
In general, despite known concerns and caveats in incorporating data science methodologies into practical simulation efforts [3,6,33], AI comes into play as a way of enhancing predictive capabilities [14,26,83,84] and of optimizing parameters for desired policy goals. It also opens avenues for prescriptive ones, as in the case of studies in which simulation outputs can be used to verify virus spread and anomaly growth trends based on which tactical approaches and strategies can be devised [85,86].

3. Materials and Methods

3.1. School Testing Simulation

To build the AI application, we first developed an agent-based disease model simulate the outcomes of different random testing in schools of different size. The agent-based model consists of two main agents including Student and Class and the family agent. The current model does not include Teacher and Staff as separate agents, but their population can be added to the class and school population. We use a modified version of the SEIR disease transmission model which includes testing and isolation elements developed by Asgary et al. [4] (Figure 1). In this simulation students attend schools on weekdays and stay in their class and cohort for the duration of the school hours (location state chart). Students are assumed to be at susceptible state first (illness state chart). If they are exposed to an infected classmate, their state changes from susceptible to exposed state. After being exposed, they become either pre-symptomatic or asymptomatic infectious with given probabilities. Infectious students can transmit the virus to others by a transmission rate that is defined as the product of number of contacts and transmission probability per contact. Infectious students (symptomatic and asymptomatic) recover after certain number of days. It is assumed that testing takes place in the morning when students arrive at the school (testing state chart). Depending on the availability of the test result, students who are tested positive will be asked to self-isolate at home.
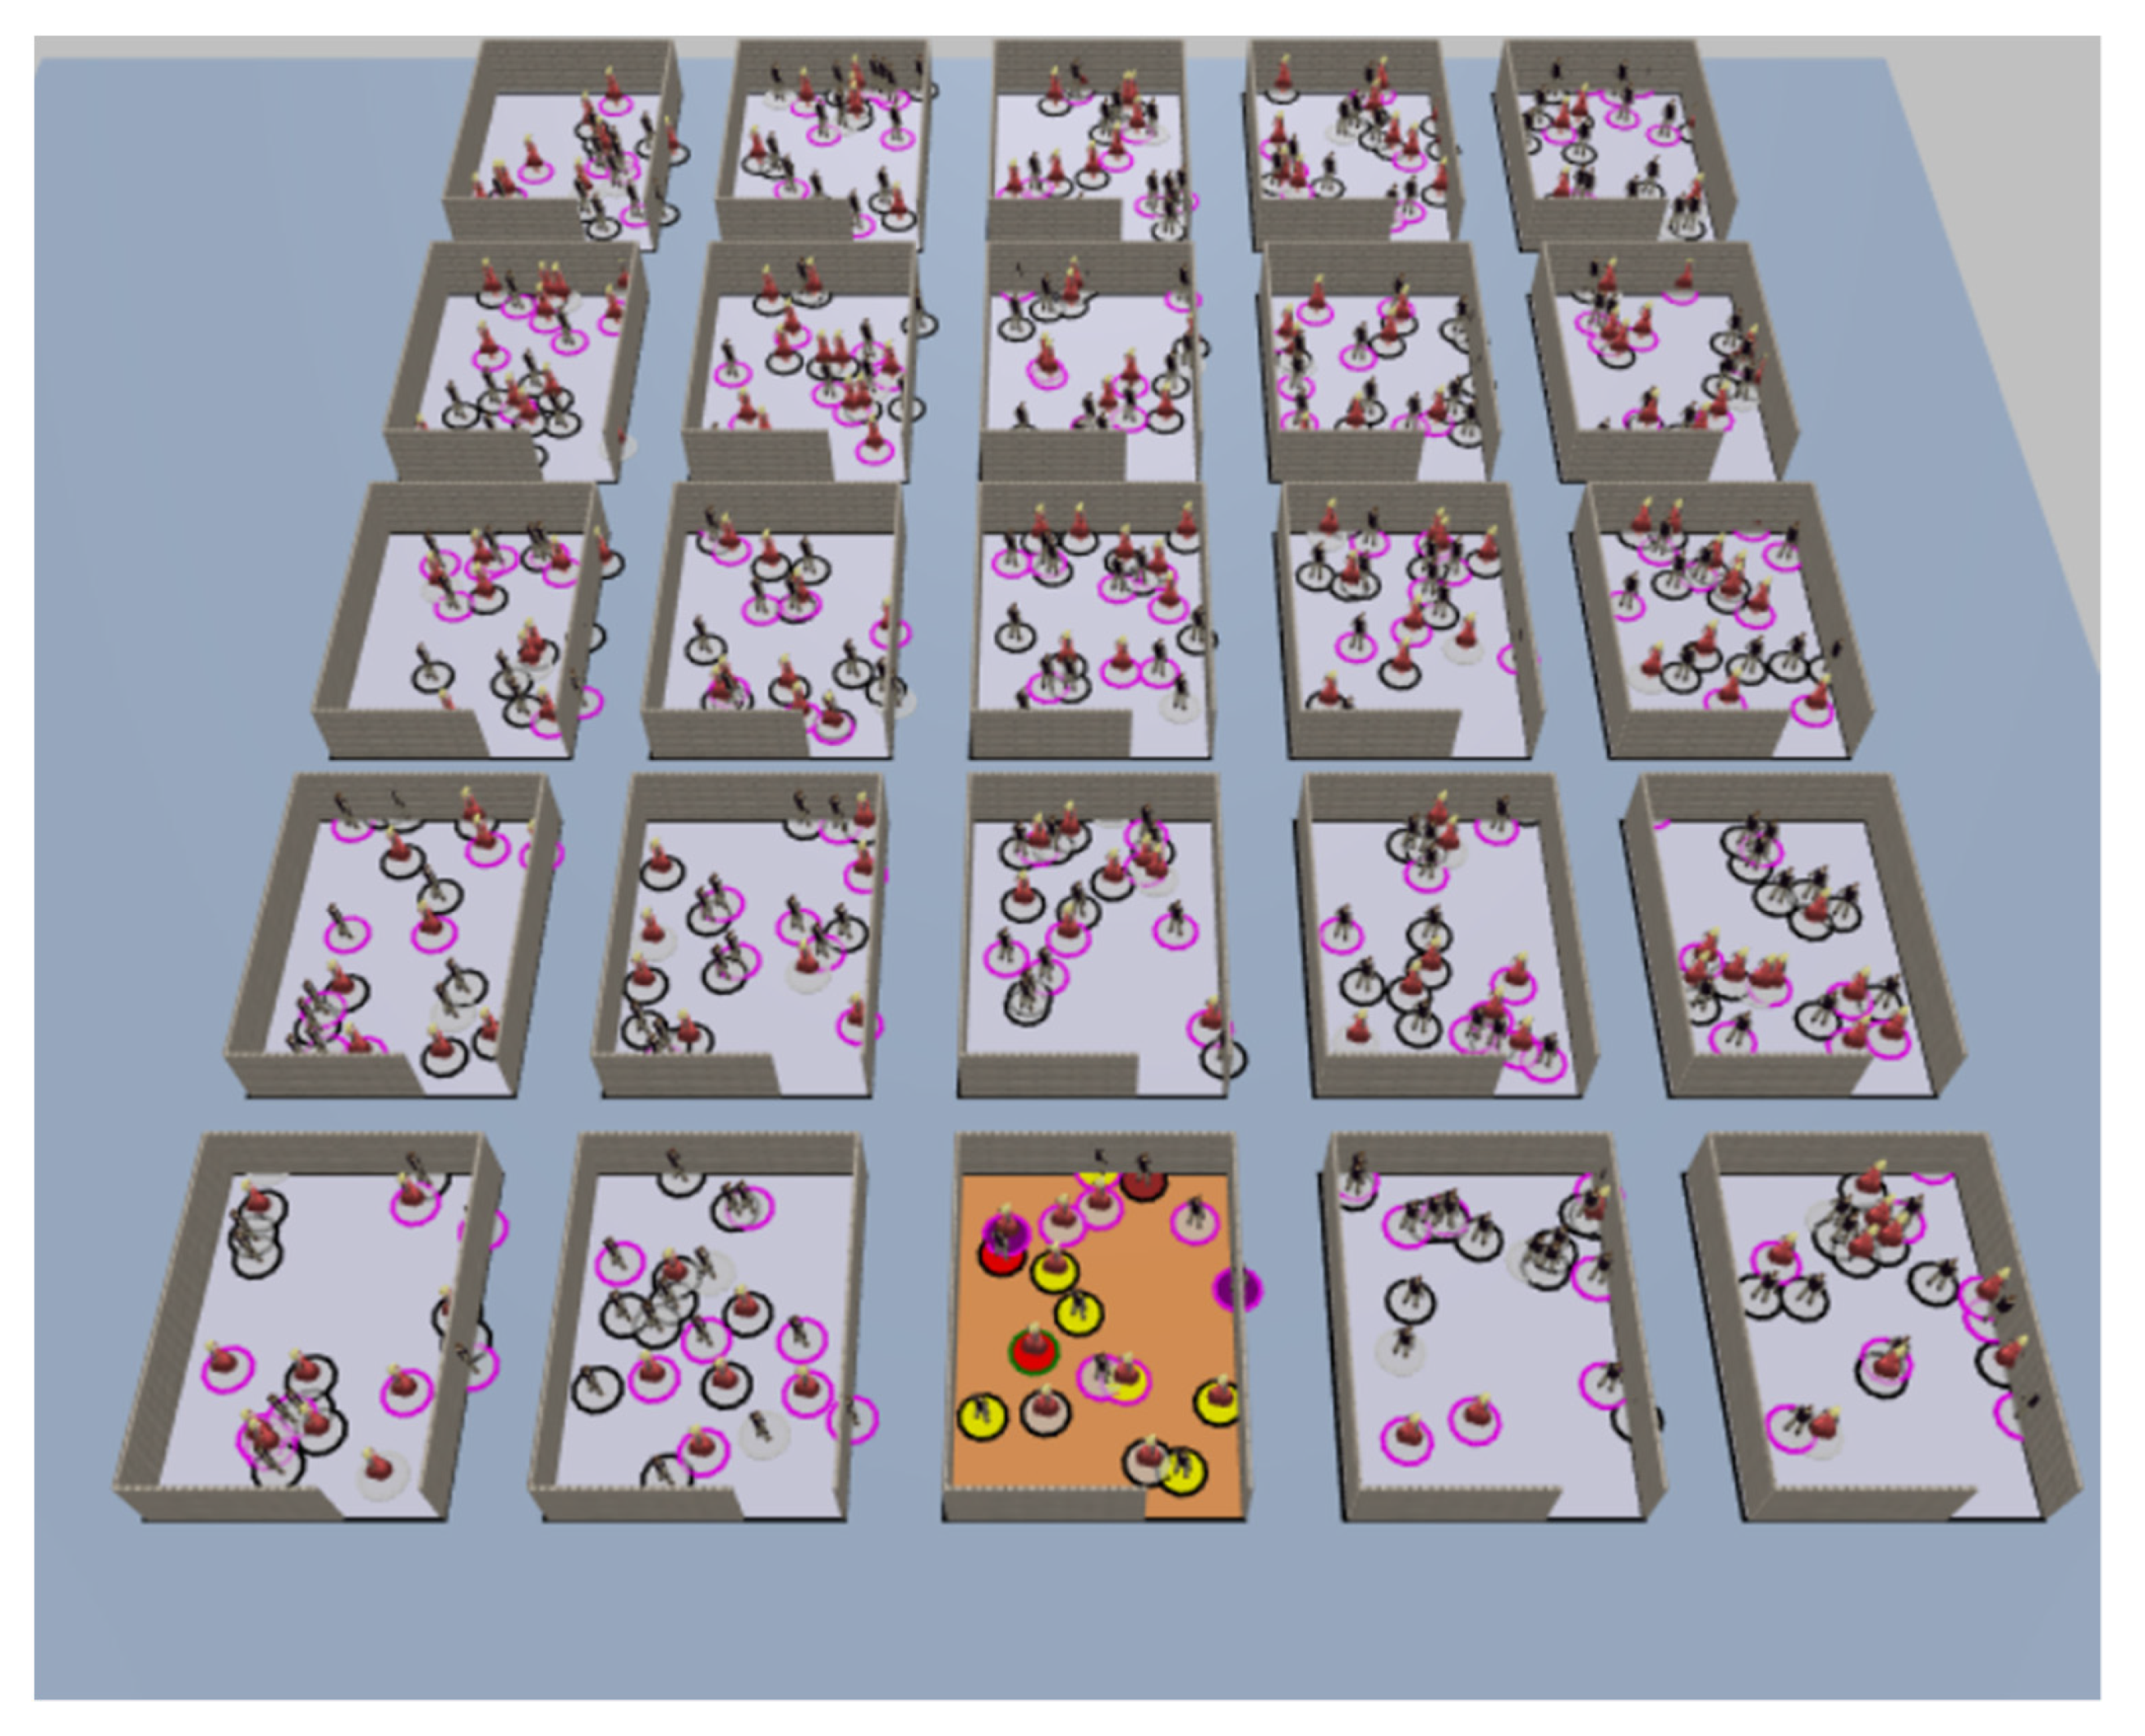
Students are considered to be in NotTested state before testing. Students who are tested are moved to Tested state and will remain there and will not be tested until their test results are available. Students who are tested positive will be moved to the Quarantined state and self-isolated at home. Students who are tested negative will remain in Tested state until their tests are expired. In this simulation it is assumed that students of each class are always together as a cohort and do not change their classes during the school hours. An infectious student can infect others. Simulations can be viewed in 3D (Figure 2) and 2D visualization.
Since we lack a closed form solution for our model, we proceed to approximate one using a neural network, an approach that has been used, for instance, by [87] to maximize testing through the mobilization of assessment centers. This will allow us greater flexibility with respect to analyzing the model and its dependency on each parameter, as well as faster computational speeds. Furthermore, the network can be used as a tool in real time to gauge effective implementation strategies in schools and administration boards.
Since SARS-CoV-2 testing was not practiced at the time of this study, the simulation results were validated by a mathematical model that is using the same parameters [4].

3.2. Data Preparation for the AI Network Model

In order to train a good network model, we first gather a large enough data set with enough variability such that the network can learn all the intrinsic properties of the simulation model. To accomplish this, we make use of the AnyLogic Cloud module, in collaboration with their parallel processing capabilities accessed through their Python API [88].
Since many of the model parameters are unbound in theory, we make the decision to impose specific limits on them in order to generate a realistic range, and therefore focus our attention on building an accurate AI model in this specific domain. For example, we simulate results for recovery rates amongst symptomatic cases at periods between 7 and 19 days despite the fact that we know the average period for this to be about 12 days. This way our model can learn precisely what effects this parameter has on our output variables. A full list of parameter sampling ranges is shown in Table 1. We proceed to generate approximately 125,000 model simulation, saving all input and output data for each run.

3.3. Network Design

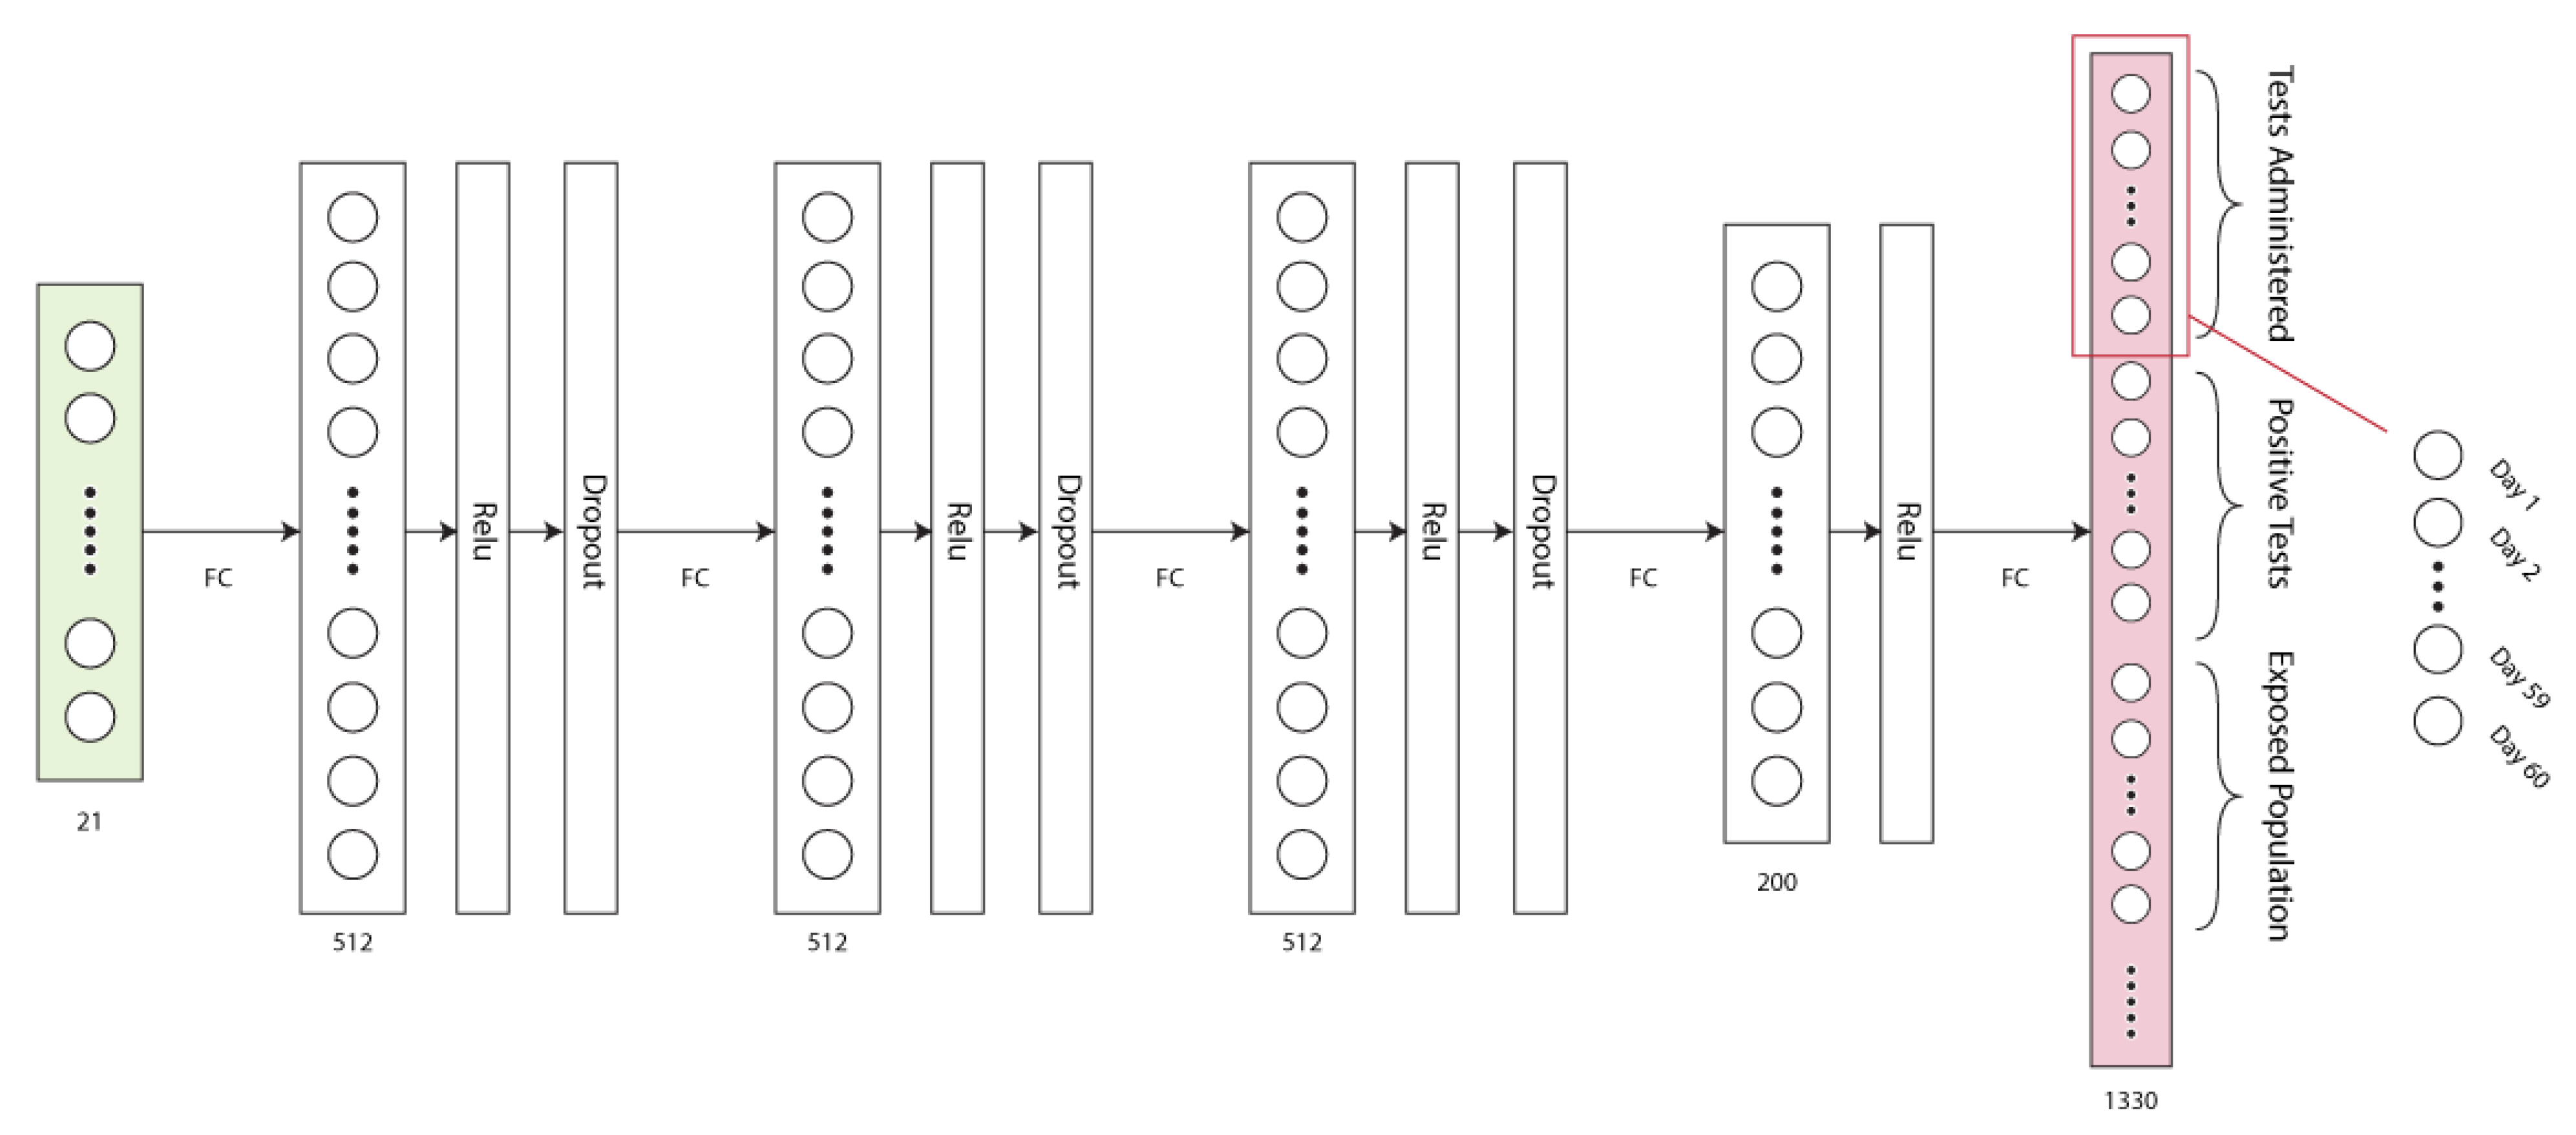
We aim to design a neural network which will take the parameters from Table 1 as inputs, and return the desired results from our agent-based model in the output layer. More precisely, we flatten the 21 parameters into an input vector for our model. Similarly, we stack the 22 60-day time series outputs of the model along with the 10 overall statistics into an output vector as can be seen in Figure 3. We propose a neural network design, with blocks made up of fully connected layers, ReLU activations and dropout randomization, followed by a final fully connected 200 neuron feature layer before the output layer. We choose to use 200 neurons in this layer as to give the network enough information capacity to predict the output reasonably. We partially train a collection of networks of this form, with varying network depth and neurons per layer, using early stopping at 30 epochs, utilizing an 80-20 train-test split from our synthesized dataset (a more thorough outline for the full training process is given in Section 4.1). Based on the mean absolute error (MAE) of the networks’ structures displayed in Table 2, we choose a 4-layer model, each consisting of 512 neurons in hidden block layers. We make this decision as the marginal gain for any more neurons or layers appears to diminish at this point. The best performance is achieved using a 3-layer, 1024 neuron per layer structure, but since this is a coarse hyperparameter grid search, the accuracy measures are not necessarily indicative of full training results, and only used heuristically. It is to be noted that this is not a full training of the model, but simply a proxy for optimal network hyperparameters. The chosen architecture is visualized in Figure 3.

4. Results

4.1. Network Training

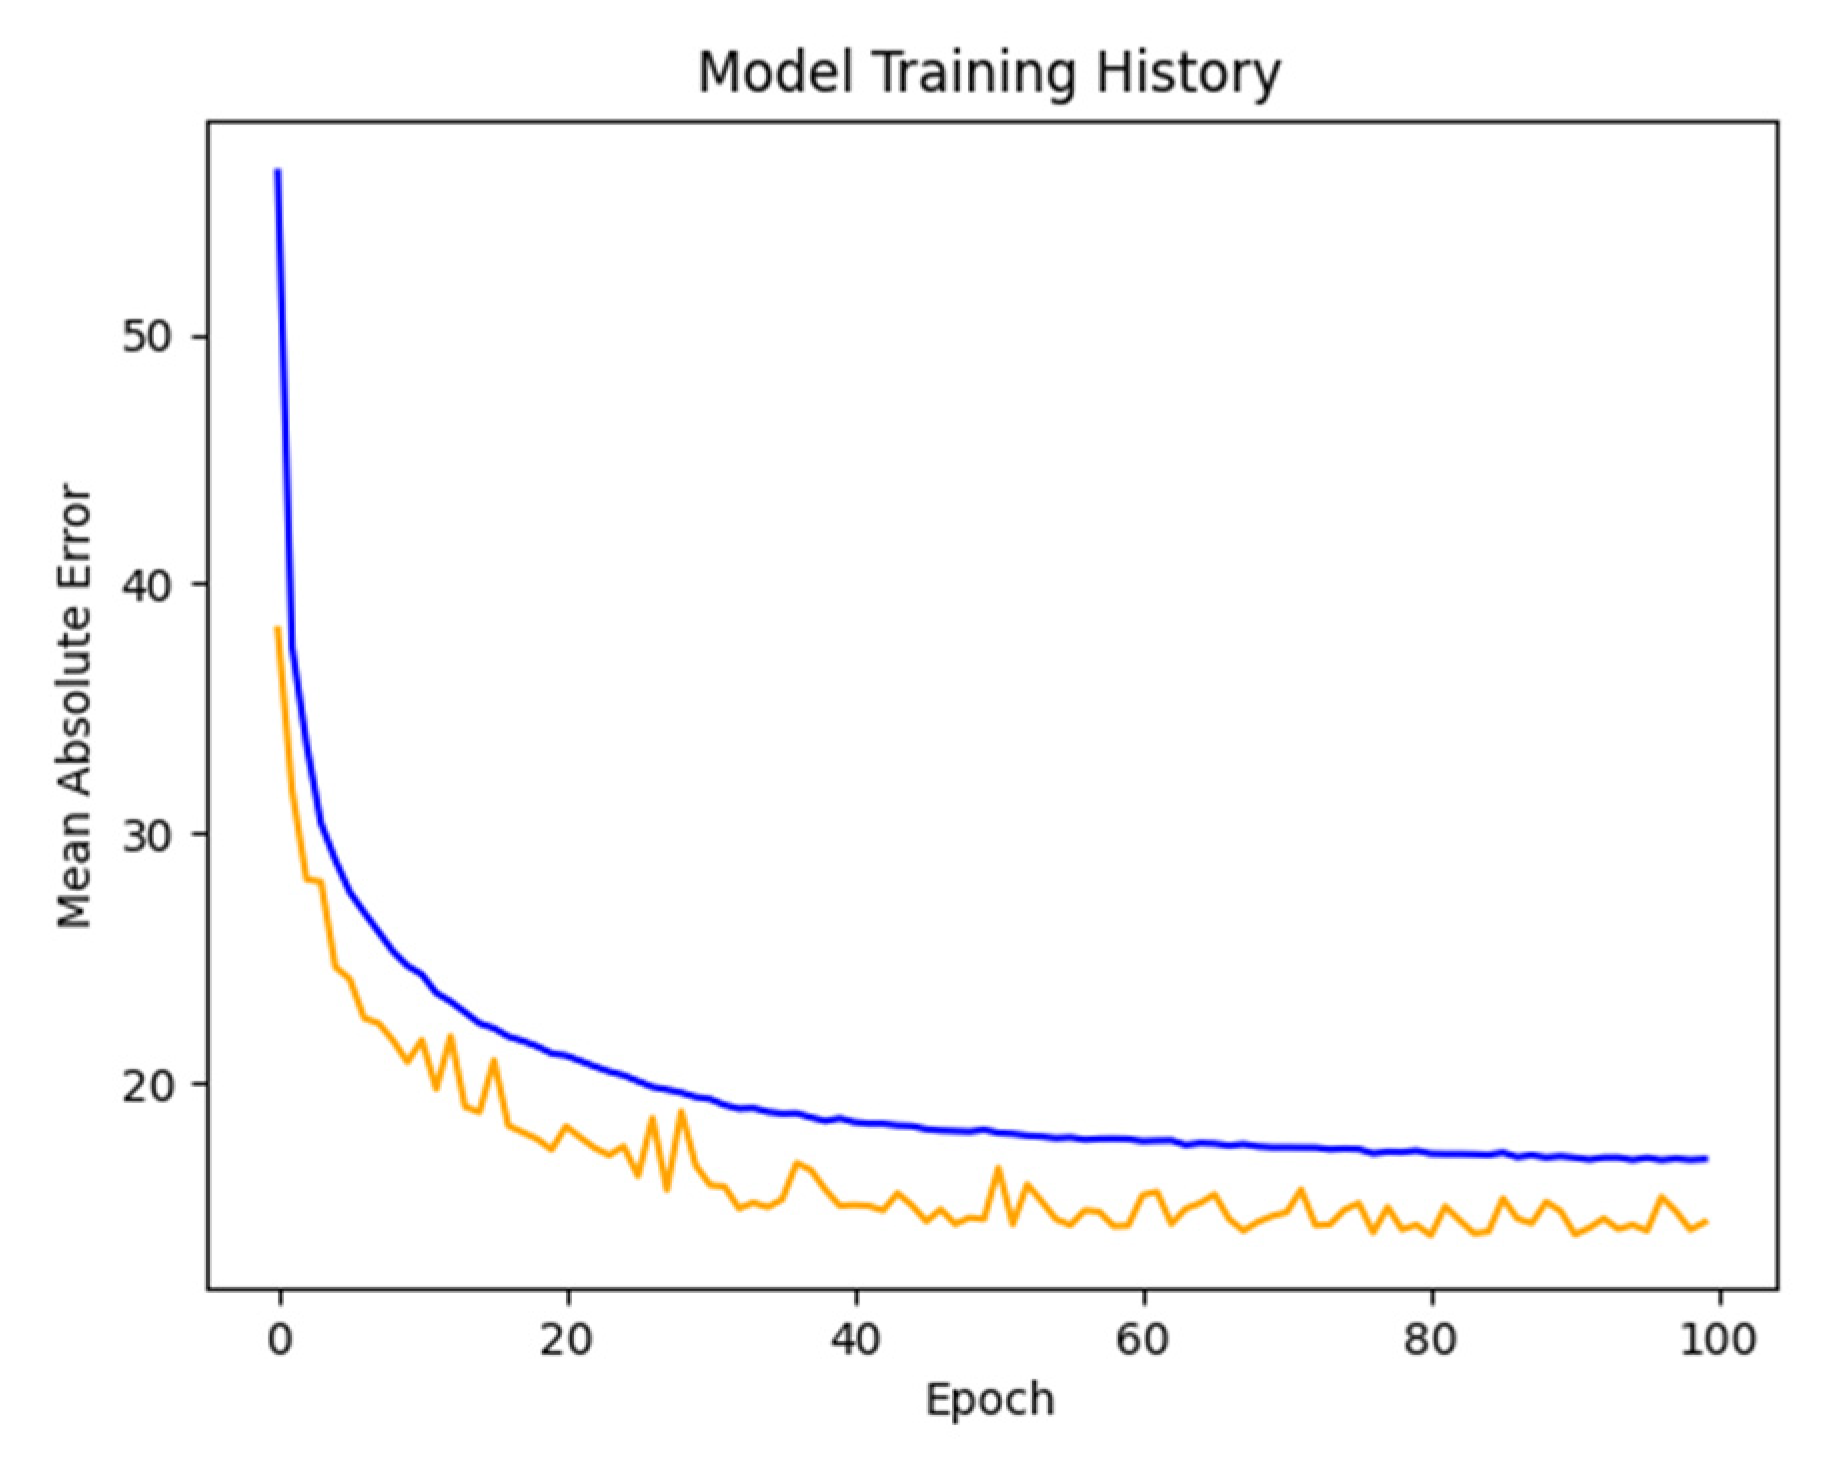
Using the same 80-20 split we used in Section 3.3, we proceed to train the network to completion. Our training dataset consists of about 100,000 samples, while keeping a respectable 25,000 samples on which to validate our model on. We utilize the 4-layer network structure from Section 3.3 and train the network in shuffled batches of size 256. We use the default ADAM optimizer built into Tensorflow 2.0 with a learning rate of 0.001 to minimize a mean absolute error loss function between the real outputs and the predictions. Dropout rates are kept at 20% as to reduce overfitting. Training over 100 epochs, our model accuracy can be seen in Figure 4. When fully trained, our model achieves a mean absolute error of 14.4264 on the test data. This can roughly be thought of as the average distance each prediction is from the true simulator value. Given that we have many output statistics in the orders of hundreds and thousands, this is a very promising error rate. Furthermore, a 5-fold cross-validation procedure on the train set yields results in the same vicinity, as can be seen in Table 3. This suggest that our network is not only accurate but robust to samples it has not seen before. It is to be noted that this accuracy measure is not a measure of the AI model with respect to the historical real-world data, but to the simulator predictions themselves.

4.2. Network Prediction

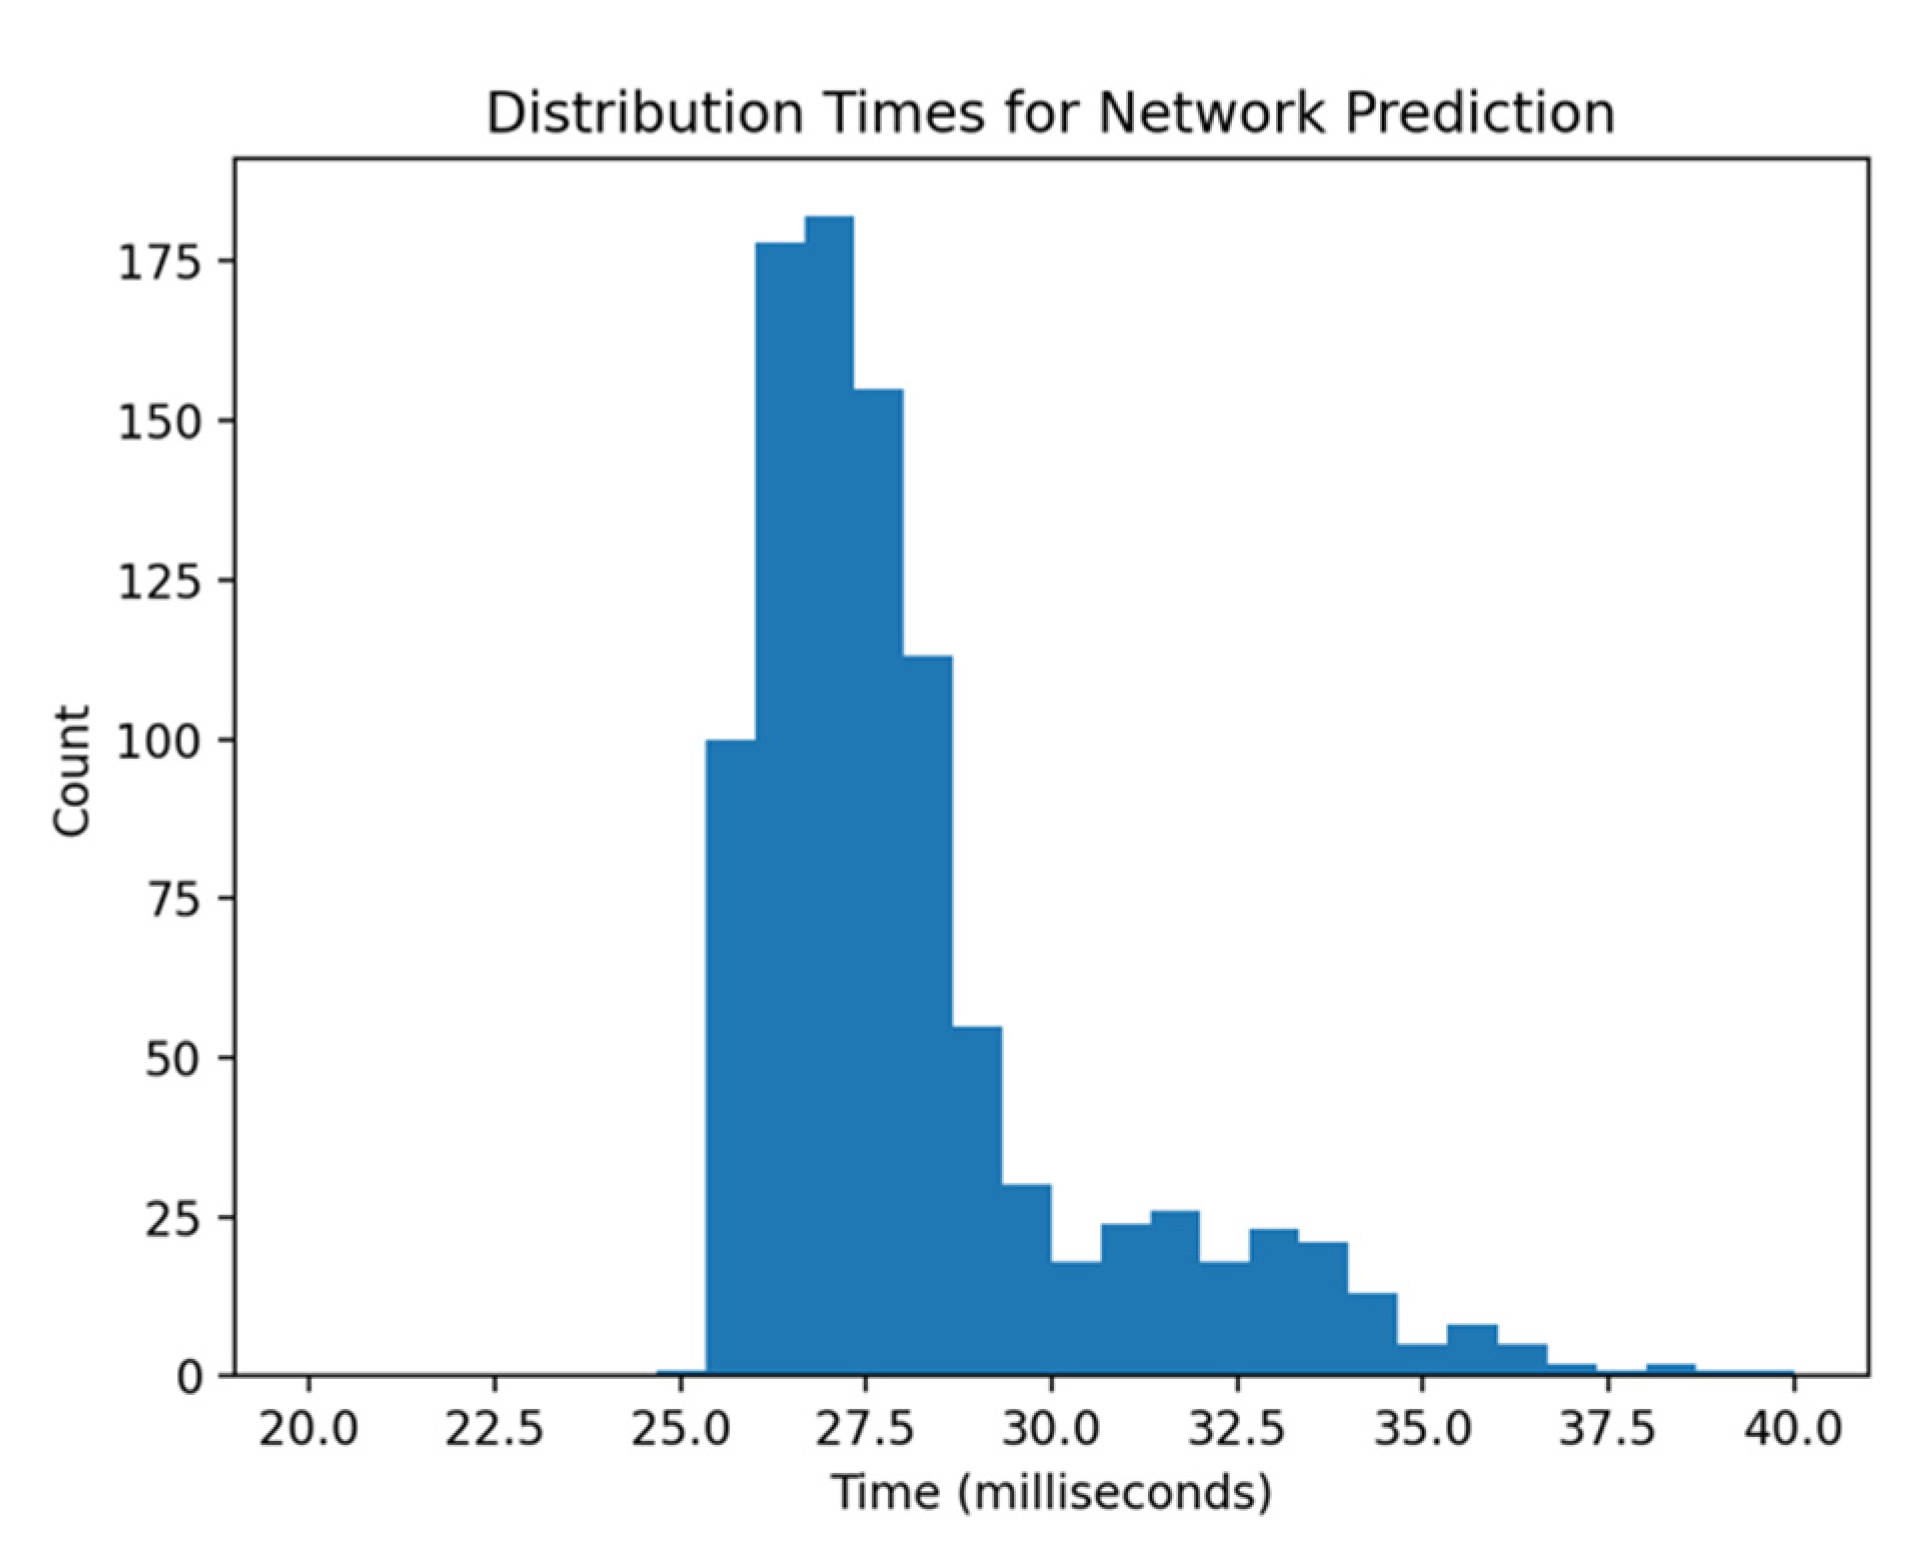
Our model is relatively lightweight, taking up only 10.9 Mb and making inference near instantly. A histogram of the computational speeds of 1000 randomly generated inputs can be seen in Figure 5. The average prediction time was 28.59 milliseconds, while the fastest and slowest runs measured at 25.27 and 39.88 milliseconds respectively.
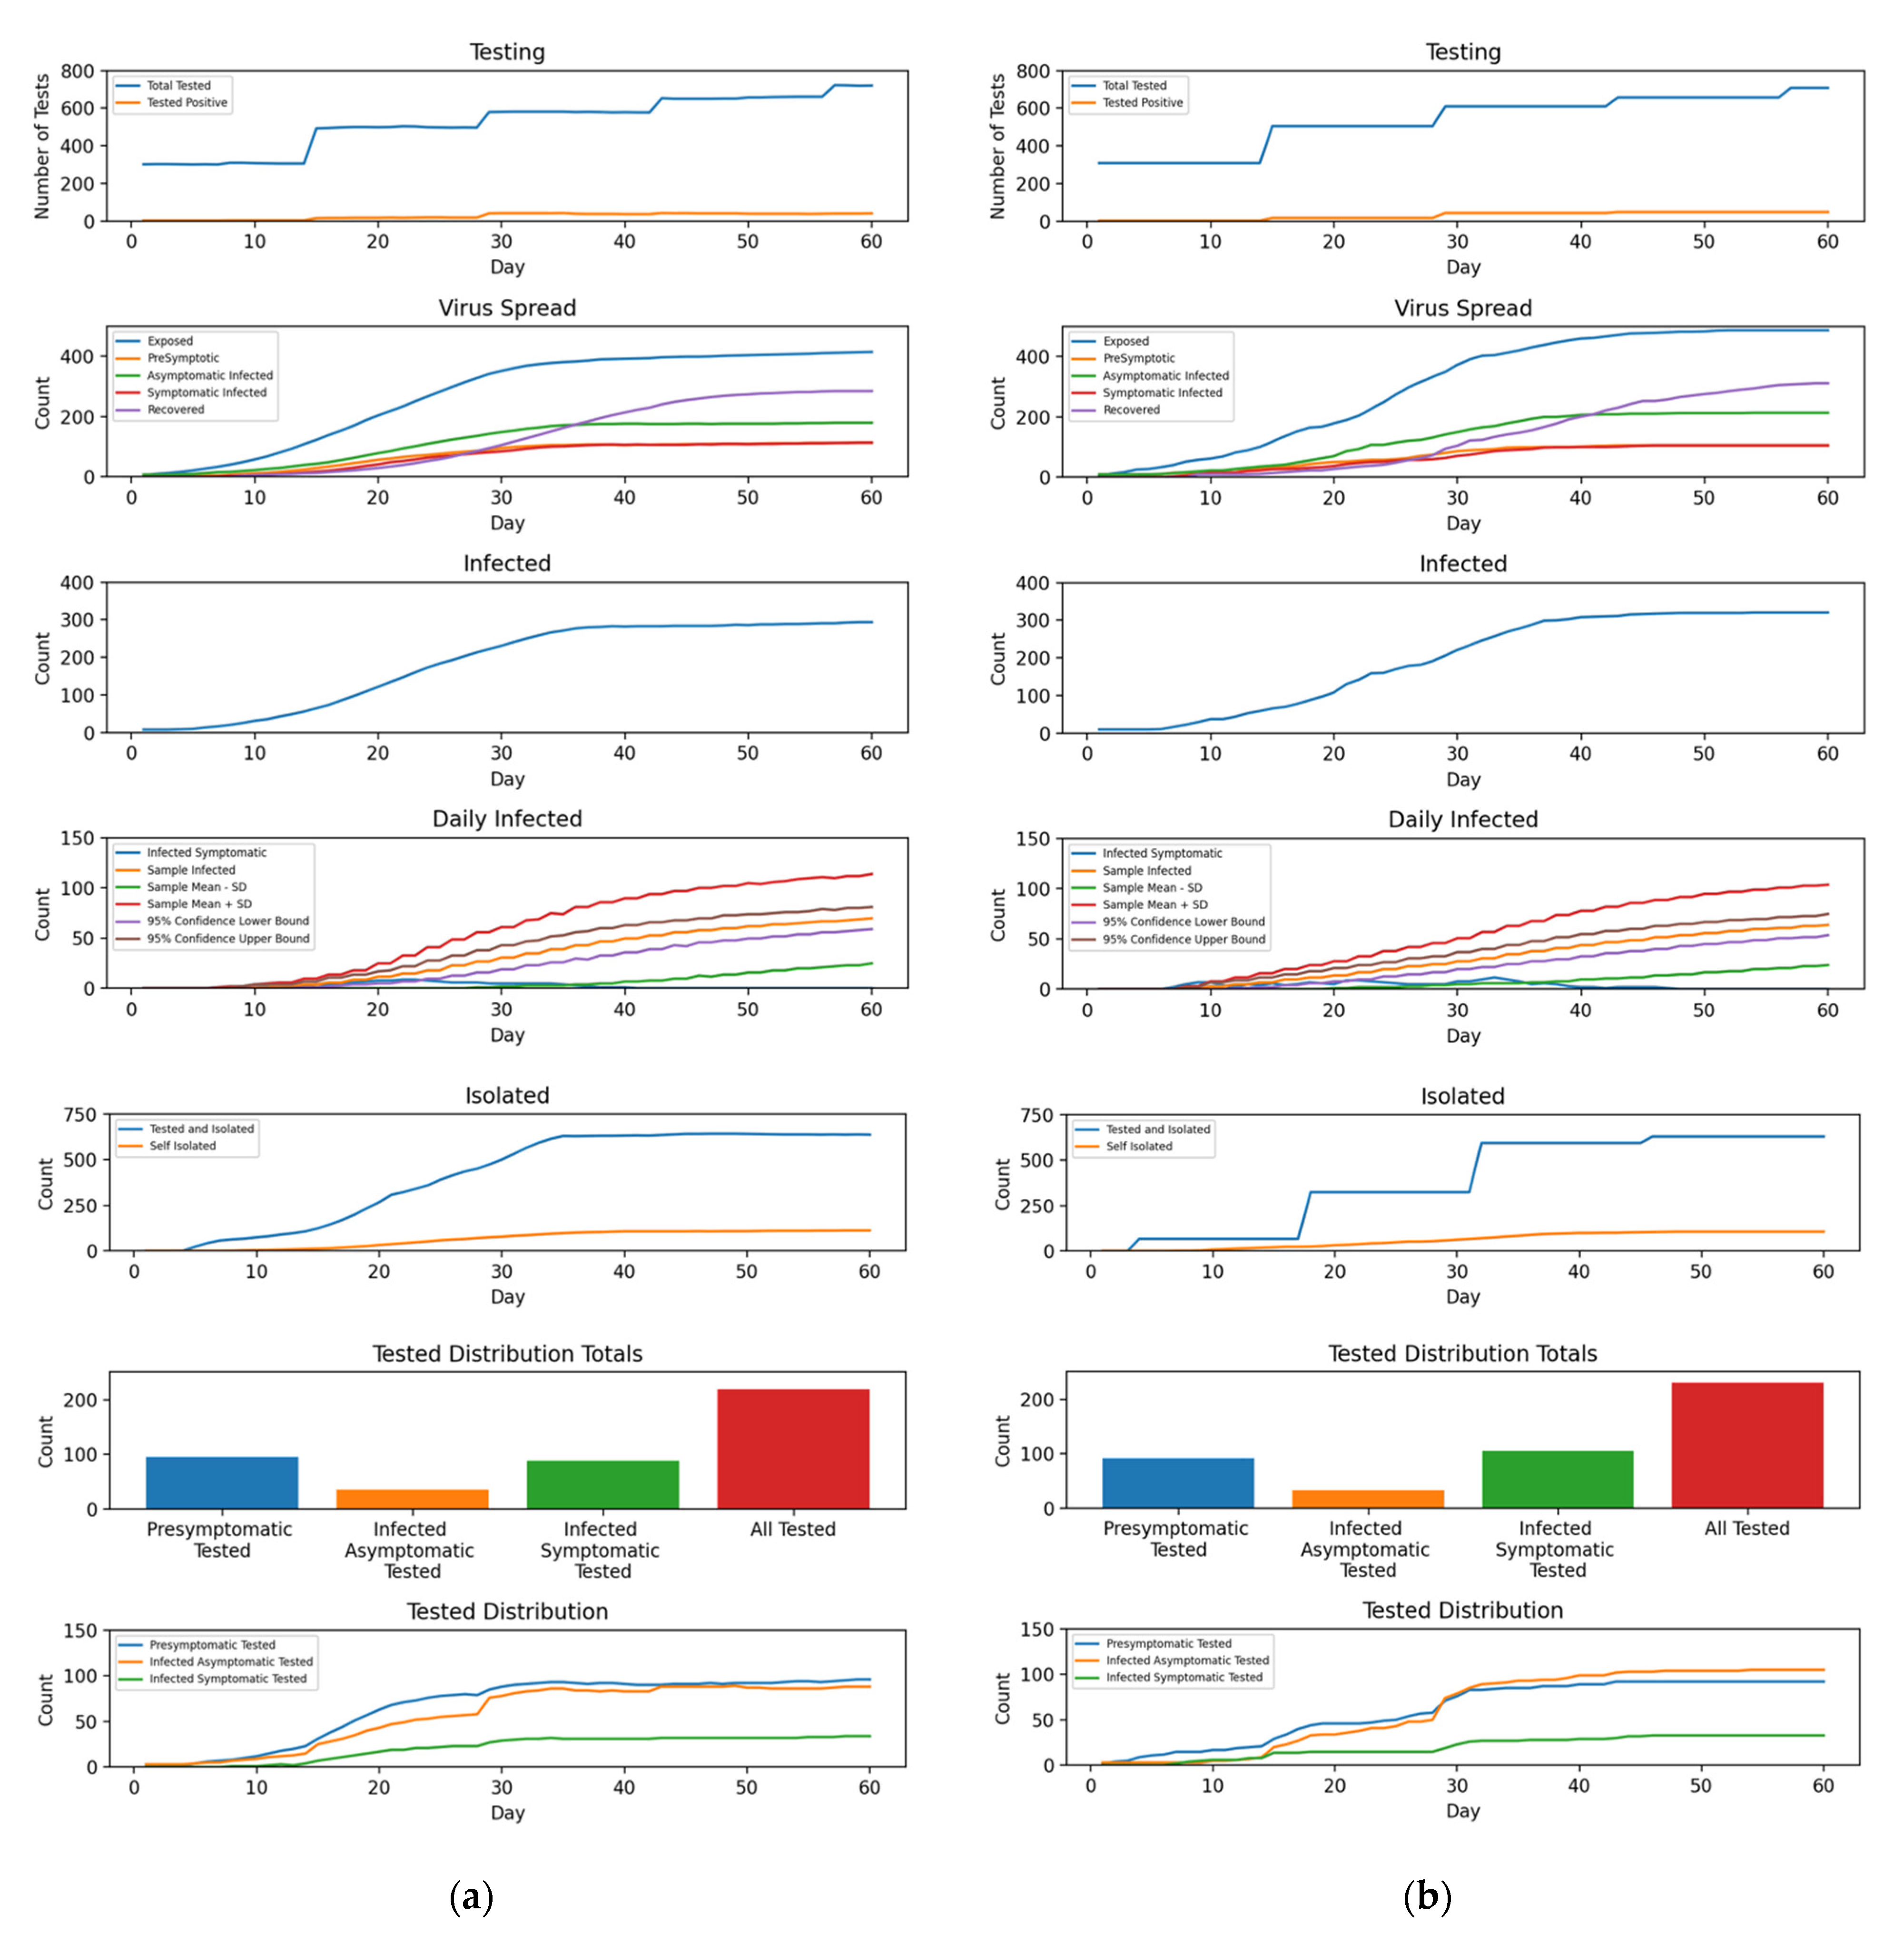
In order to use the model to predict the simulation results, we stack all our input variables in a vector and run it through the network. The network outputs one stacked vector of all the results, which can easily be reshaped to give us each separate output. As our initial agent-based simulation is calibrated to forecast a time period of 60 days ahead, our network model structure matches this setup, returning time series in chunks of 60-day partitions. A similar structure can be implemented for varying time periods, beginning with the agent-based dataset simulation. Given a random input sample from our test set, we show some of the predicted outputs vs. the true outputs in Figure 6 using our AI model. Visual inspection supports accuracy measures obtained, notably the step like structure in the Total Tested, with jumps happening at precisely the testing frequency in days. The Infected population as well as the Virus Spread appears to be very well predicted in terms of shape. The long-term equilibria of the Exposed population seems to be slightly underestimated by the model. Testing Distributions were predicted very well. Most notably however, the model struggled with the Tested and Isolated population, missing out on the very structure it picked up in the Tested population. Similar effects were seen in other test sample predictions.

4.3. Analysis

Lacking an analytic solution to the underlying model, our neural network is able to provide a smooth enough approximation to the problem. A similar statement can be made for the simulation itself, however the speed improvement is unquestionable. A typical simulation run took on the order of minutes, whereas our network runs in a fraction of a second. This allows us to study the space of parameters much more efficiently. We proceed to generate a dense field of parameter values to demonstrate this.
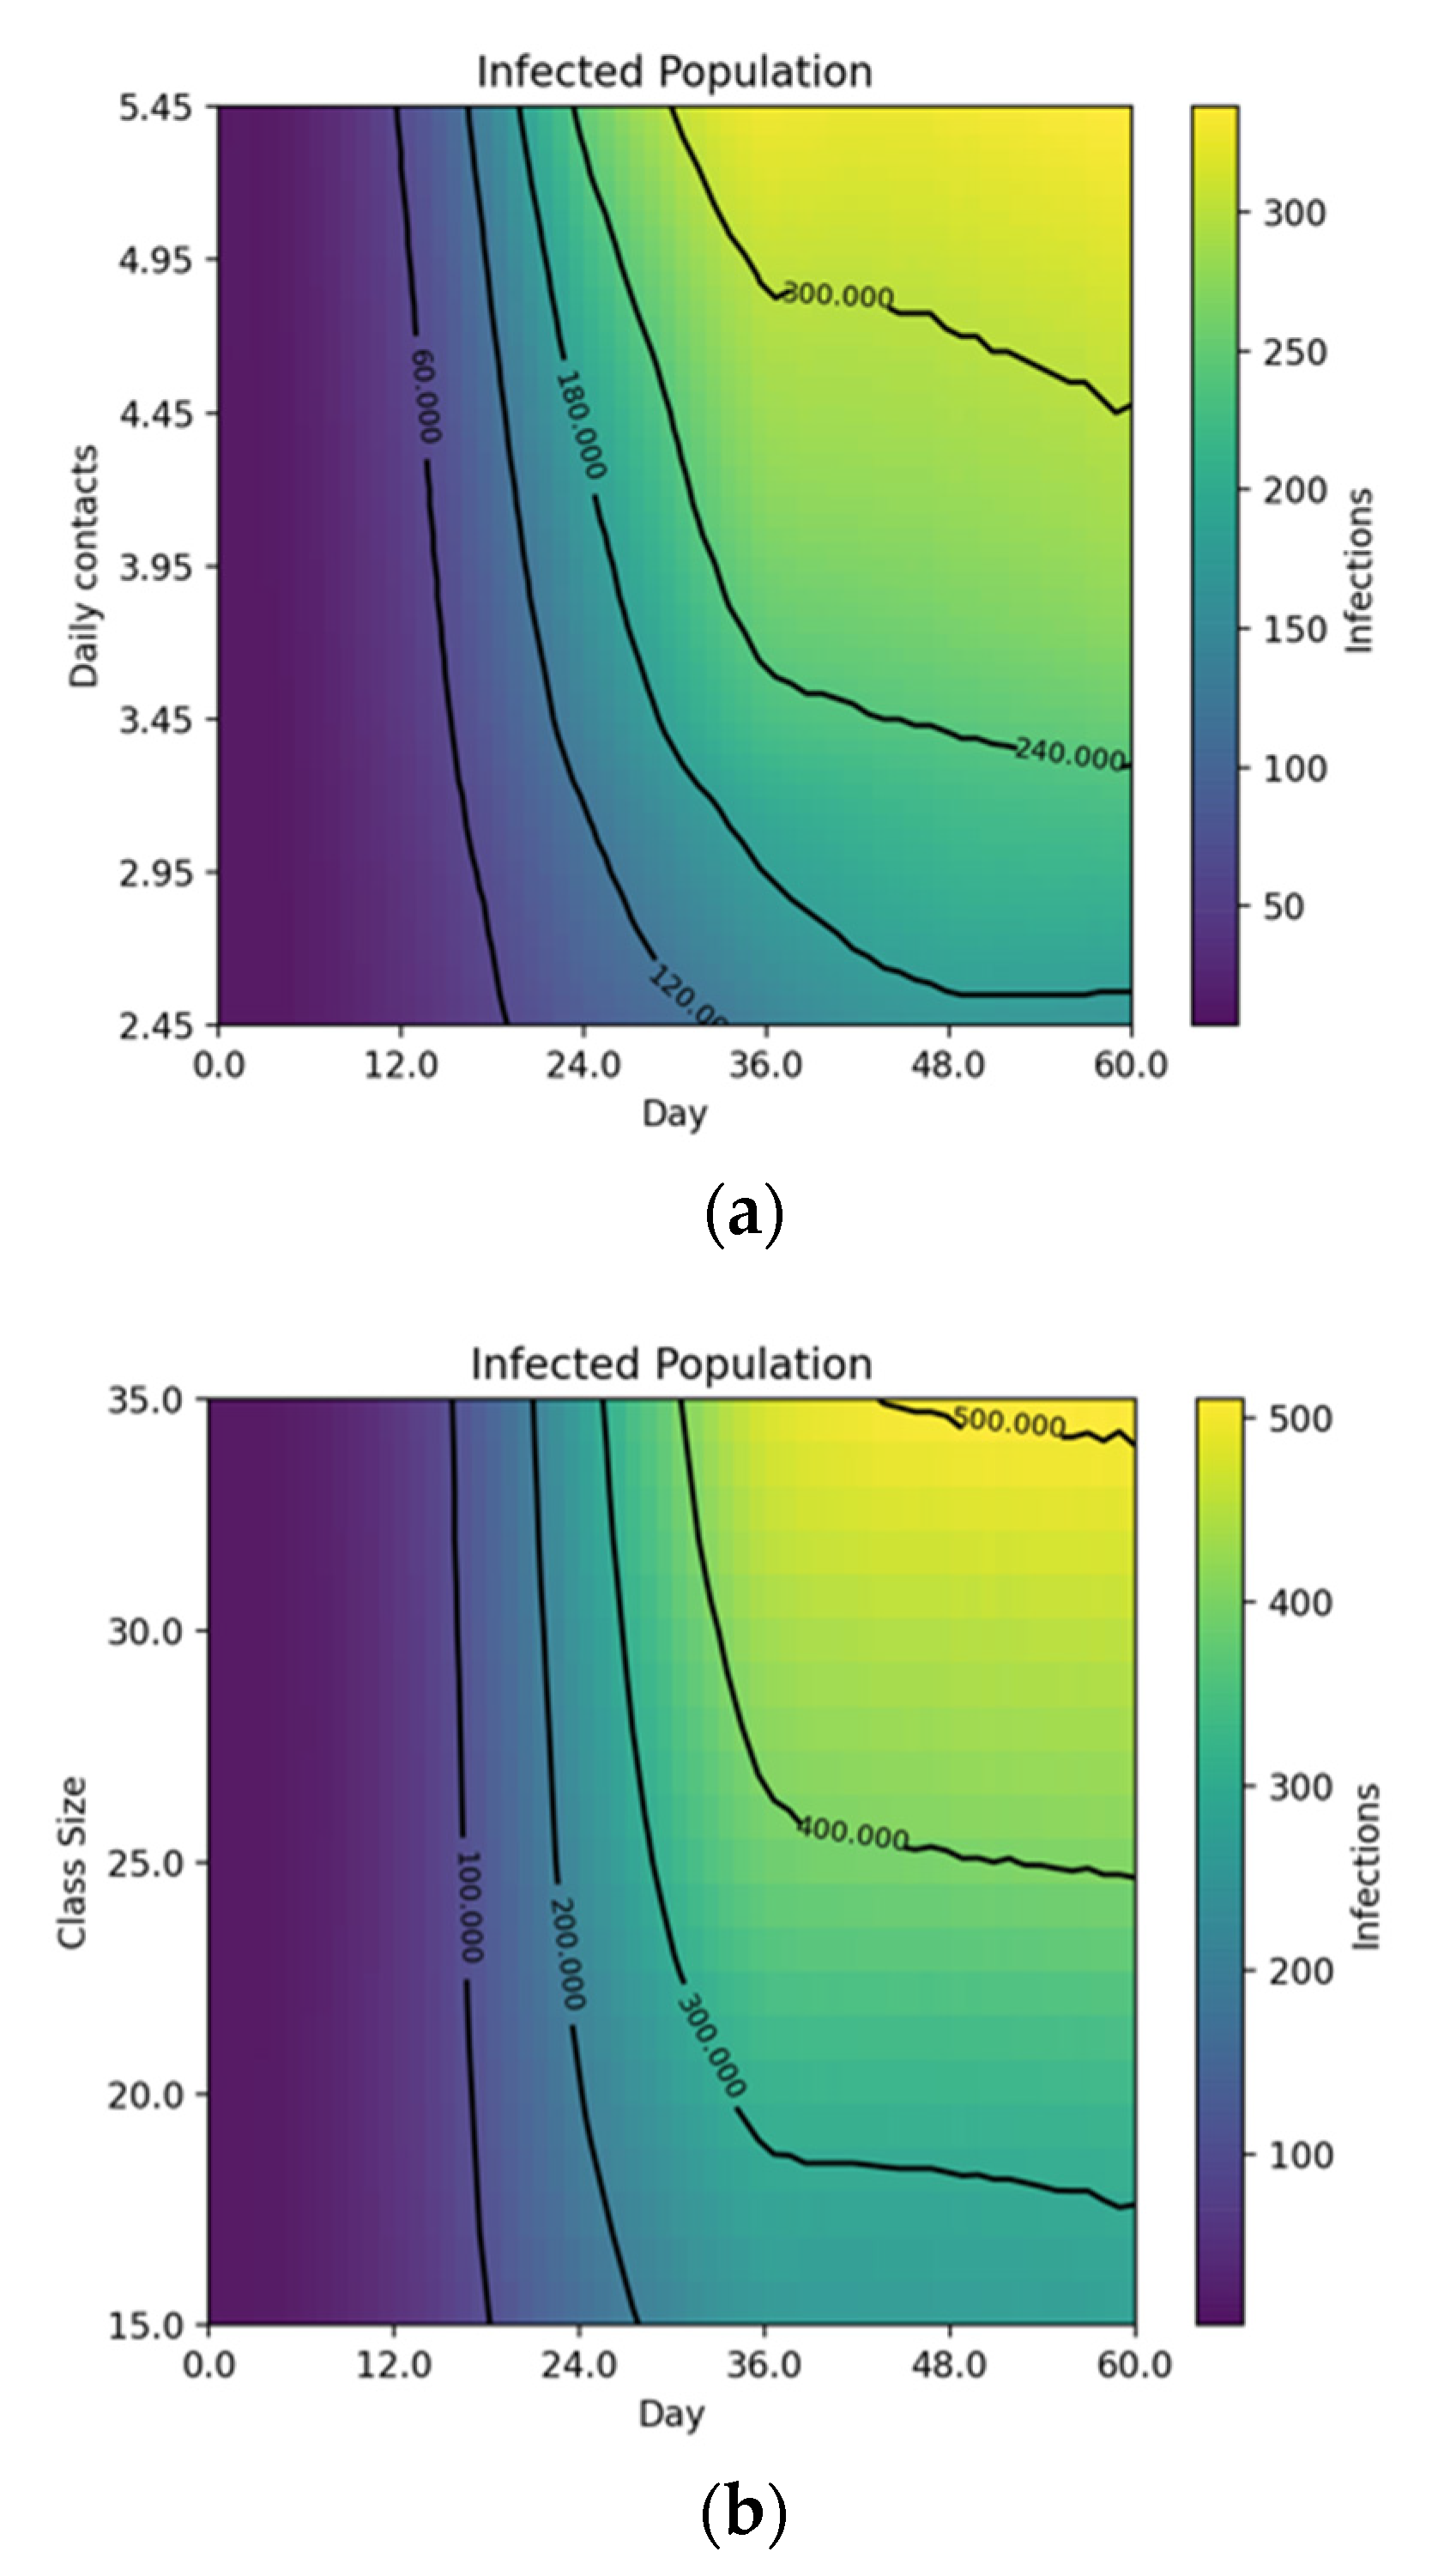
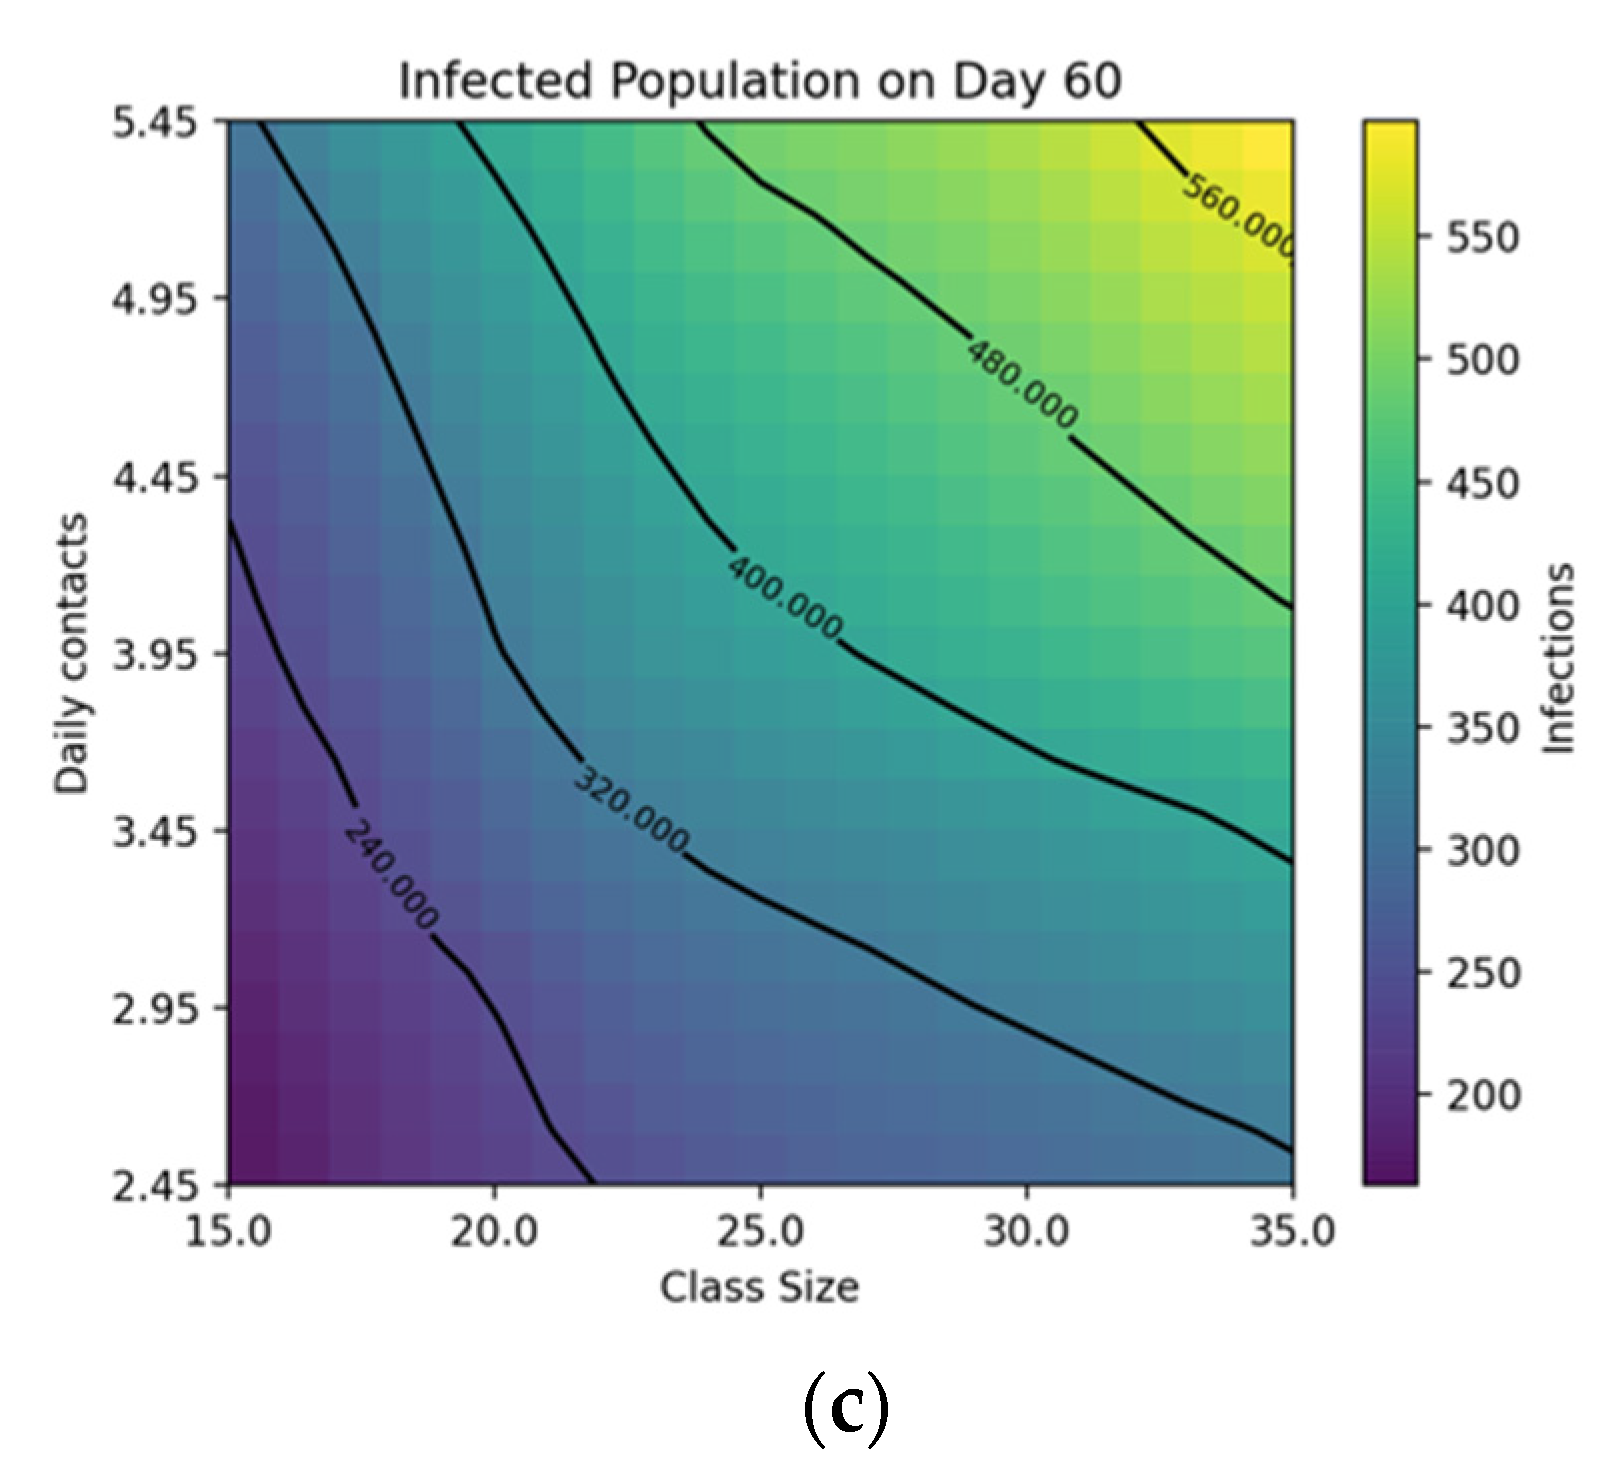
Two critical factors in the spread of the virus in a school environment are the size of classes and the average number of contacts per day. We sample each of these parameters across the entire space of allowed values as given in Table 1, and display the results in a heatmap against time in Figure 7. Plots like these could not be generated in reasonable time frames without our network model. We can see here the non-linear relationship with the contact rate and the time it takes to hit specific milestones in total infection counts. We can also help in the selection of optimal class size, and the likely horizon it would permit for a given acceptable infection level. More interestingly, we plot the relation between the contact rate and the class size. This provides policy makers with a range for the class size schools should target that can dynamically be adjusted to balance out any unforeseen changes in daily contacts measured. Alternatively, given a set class size, precautions can be put into place to target specific levels of daily contacts along a given contour line.
Our model allows for more general sensitivity analysis across all parameter using such techniques, as the network itself acts as the function modeling the outbreak dynamics. We do not proceed to exhaust all combinations here, as the list grows infeasibly large, and the importance will differ on a case by case basis.

5. Discussion

Our research demonstrated how data generated by a school COVID-19 testing simulation was used to develop an artificial intelligence version of the simulation. While the simulation results, itself had been fully presented and discussed in earlier work [4], the main focus of this paper was to show how machine learning and AI technology were used to develop additional decision support tools for school testing. The results show that the AI model can provide faster and highly accurate predictions for different input parameter values. While developing simulation-based AI models is not new [34], its application in different areas of study and simulation types are very limited. The AI-based school testing model has been deployed as a web application that can be used by the users at www.adersim.org. This application provides a school testing tool for public health and public education agencies aiming to implement and examine different testing strategies considering their local conditions as well as their associated costs and challenges. Users can simply input their unique school, disease conditions and testing related parameters, and our model will generate an accurate prediction of the disease spread and outbreak in the school.
Our school testing simulation has been developed and parameterized based on the existing information available about the COVID-19 in Canada and Ontario in particular. As such, minor adjustments may be needed to the baseline parameters in order to use the application in other countries. In addition, this simulation has not been validated against real school testing because at the time of this research no school testing has been done in Ontario. As real evidence of school testing, whether large scale or experimental level, the simulation tool can be enhanced to account for real testing input and output values. The simulation and methodology presented here can be used for other potential disease situations.
The approach proposed should not suffice for policy moving forward. More runs, under other combinations of parameters should illuminate the course of actions. In addition, we encourage assumptions underlying the structure of the model to be constantly revisited as the model was designed to reflect a highly uncertain scenario, with both incomplete and constantly changing data and conditions. Given the evidence of the social network structures as a catalyzer for virus spread, the model proposed in this paper could further benefit from more granular analyses at the community-level attributes such as expected behavior. Despite our simulated data, our methods reinforce the need for more systematic and widespread testing, for it addresses the information availability issue of any modeling endeavor.
We have deployed this AI model into an online application that can be used by potential users (https://www.adersim.org/SchoolTesting/, accessed on 3 March 2021).

6. Conclusions

This research makes a contribution in two ways. First, it introduces an agent-based simulation model where AI is leveraged for parameter optimization. Secondly, it demonstrates its application to the context of testing in school settings. Benefits of this approach include greater accuracy in parameter estimation and more predictive power, which is critical to the usability of the model in school testing scenarios. Limits of this research include assumptions that are inherent to modeling approaches and may be reinforced by the usage of machine learning paradigms. Future research should account for that for new experimentations and consider other testing environments as means of further assessing the robustness of the model. Qualitative and mixed-method approaches, which may include observational steps, as well as interviews with people in the field, can also be used for data enrichment and validation.

Author Contributions

J.W., A.A., M.C. and M.G.C. conceived the idea. A.A. and M.M.N. developed the simulation model. S.Z.V. developed the AI model with feedback from M.C. and A.A. S.Z.V., A.A. and F.A.C. drafted the manuscripts. J.W. and M.M.N. reviewed the manuscript and made intellectual input. All authors have read and agreed to the published version of the manuscript.

Funding

This research was funded by the Public Health Agency of Canada; Canadian Institute of Health Research, Ontario Research Funds, National Science and Engineering Research Council of Canada.

Data Availability Statement

Simulation data for the training of the neural network model can be found at https://www.kaggle.com/zarkonium/covid19-school-spread-simulation-dataset, accessed on 20 April 2021.

Acknowledgments

We thank the AnyLogic team for providing support for their Cloud API.

Conflicts of Interest

The authors declare no conflict of interest. The funders had no role in the design of the study; in the collection, analyses, or interpretation of data; in the writing of the manuscript, or in the decision to publish the results.

Abbreviations

AIArtificial Intelligence
ECDCEuropean Centre for Disease Control
KPIKey Performance Indicator
IOTInternet of Things
WHOWorld Health Organization
MAEMean Absolute Error

References

  1. Panovska-Griffiths, J.; Kerr, C.C.; Stuart, R.M.; Mistry, D.; Klein, D.J.; Viner, R.M.; Bonell, C. Determining the optimal strategy for reopening schools, the impact of test and trace interventions, and the risk of occurrence of a second COVID-19 epidemic wave in the UK: A modelling study. Lancet Child Adolesc. Health 2020, 4, 817–827. [Google Scholar] [CrossRef]
  2. Ziauddeen, N.; Woods-Townsend, K.; Saxena, S.; Gilbert, R.; Alwan, N.A. Schools and COVID-19: Reopening Pandora’s box? Public Health Pr. 2020, 1, 100039. [Google Scholar] [CrossRef] [PubMed]
  3. Asgary, A.; Valtchev, S.Z.; Chen, M.; Najafabadi, M.M.; Wu, J. Artificial intelligence model of drive-through vaccination simulation. Int. J. Environ. Res. Public Health 2020, 18, 268. [Google Scholar] [CrossRef] [PubMed]
  4. Asgary, A.; Cojocaru, M.G.; Najafabadi, M.M.; Wu, J. Simulating preventative testing of SARS-CoV-2 in schools: Policy implications. BMC Public Health 2021, 21, 125. [Google Scholar] [CrossRef]
  5. Asgary, A.; Najafabadi, M.; Karsseboom, R.; Wu, J. A Drive-through simulation tool for mass vaccination during COVID-19 Pandemic. Healthcare 2020, 8, 469. [Google Scholar] [CrossRef]
  6. Latif, S.; Usman, M.; Manzoor, S.; Iqbal, W.; Qadir, J.; Tyson, G.; Crowcroft, J. Leveraging data science to combat COVID-19: A comprehensive review. IEEE Trans. Artif. Intell. 2020, 1, 85–103. [Google Scholar]
  7. Torrealba-Rodriguez, O.; Conde-Gutiérrez, R.; Hernández-Javier, A. Modeling and prediction of COVID-19 in Mexico applying mathematical and computational models. Chaos Solitons Fractals 2020, 138, 109946. [Google Scholar] [CrossRef] [PubMed]
  8. Williams, C.M.; Chaturvedi, R.; Urman, R.D.; Waterman, R.S.; Gabriel, R.A. Artificial intelligence and a pandemic: An analysis of the potential uses and drawbacks. J. Med Syst. 2021, 45, 26. [Google Scholar] [CrossRef]
  9. Naudé, W. Artificial Intelligence against Covid-19: An Early Review. 2020. Available online: https://papers.ssrn.com/abstract=3568314 (accessed on 12 May 2021).
  10. Allam, Z.; Jones, D.S. On the coronavirus (COVID-19) outbreak and the smart city network: Universal data sharing standards coupled with artificial intelligence (AI) to benefit urban health monitoring and management. Health 2020, 8, 46. [Google Scholar] [CrossRef] [Green Version]
  11. Gatto, M.; Bertuzzo, E.; Mari, L.; Miccoli, S.; Carraro, L.; Casagrandi, R.; Rinaldo, A. Spread and dynamics of the COVID-19 epidemic in Italy: Effects of emergency containment measures. Proc. Natl. Acad. Sci. USA 2020, 117, 10484–10491. [Google Scholar] [CrossRef] [Green Version]
  12. Mohanty, S.; Sharma, R.; Saxena, M.; Saxena, A. Heuristic Approach towards COVID-19: Big Data Analytics and Classification with Natural Language Processing; Springer: Singapore, 2021; pp. 775–791. [Google Scholar]
  13. Asif, S.; Wenhui, Y.; Jin, H.; Jinhai, S. Classification of COVID-19 from chest X-ray images using deep convolutional neural network. In Proceedings of the 2020 IEEE 6th International Conference on Computer and Communications (ICCC), Chengdu, China, 11–14 December 2020; pp. 426–433. [Google Scholar]
  14. Mei, X.; Lee, H.-C.; Diao, K.; Huang, M.; Lin, B.; Liu, C.; Xie, Z.; Ma, Y.; Robson, P.M.; Chung, M.; et al. Artificial intelligence-enabled rapid diagnosis of COVID-19 patients. medRxiv 2020. medRxiv:2020.04.12.20062661. [Google Scholar] [CrossRef]
  15. Patel, H.R.; Patel, A.M.; Parikh, S.M. Analytical study on COVID-19 to predict future infected cases ratio in India using machine leaning. IOP Conf. Ser. Mater. Sci. Eng. 2021, 1022, 012022. [Google Scholar] [CrossRef]
  16. Rahmatizadeh, S.; Valizadeh-Haghi, S.; Dabbagh, A. The role of artificial intelligence in management of critical COVID-19 patients. J. Cell. Mol. Anesth. 2020, 5, 16–22. [Google Scholar]
  17. McCall, B. COVID-19 and artificial intelligence: Protecting health-care workers and curbing the spread. Lancet Digit. Health 2020, 2, e166–e167. [Google Scholar] [CrossRef]
  18. Vaishya, R.; Javaid, M.; Khan, I.H.; Haleem, A. Artificial intelligence (AI) applications for COVID-19 pandemic. Diabetes Metab. Syndr. Clin. Res. Rev. 2020, 14, 337–339. [Google Scholar] [CrossRef]
  19. Abd-Alrazaq, A.; Alajlani, M.; Alhuwail, D.; Schneider, J.; Al-Kuwari, S.; Shah, Z.; Hamdi, M.; Househ, M. Artificial intelligence in the fight against COVID-19: Scoping review. J. Med. Internet Res. 2020, 22, e20756. [Google Scholar] [CrossRef]
  20. Shantani, K.; Kannan, S.; Sheeza, A.; Hemalatha, K. The role of artificial intelligence and machine learning techniques: Race for COVID-19 vaccine. Arch. Clin. Infect. Dis. 2020, 15. [Google Scholar] [CrossRef]
  21. Jamshidi, M.B.; Lalbakhsh, A.; Talla, J.; Peroutka, Z.; Hadjilooei, F.; Lalbakhsh, P.; Jamshidi, M.; La Spada, L.; Mirmozafari, M.; Dehghani, M.; et al. Artificial intelligence and COVID-19: Deep learning approaches for diagnosis and treatment. IEEE Access 2020, 8, 109581–109595. [Google Scholar] [CrossRef] [PubMed]
  22. Zhou, Y.; Wang, F.; Tang, J.; Nussinov, R.; Cheng, F. Artificial intelligence in COVID-19 drug repurposing. Lancet Digit. Health 2020, 2, e667–e676. [Google Scholar] [CrossRef]
  23. Shahid, O.; Nasajpour, M.; Pouriyeh, S.; Parizi, R.M.; Han, M.; Valero, M.; Li, F.; Aledhari, M.; Sheng, Q.Z. Machine learning research towards combating COVID-19: Virus detection, spread prevention, and medical assistance. arXiv 2020, arXiv:2010.07036. Available online: http://arxiv.org/abs/2010.07036 (accessed on 11 May 2021).
  24. Islam, M.N.; Inan, T.T.; Rafi, S.; Akter, S.S.; Sarker, I.H.; Najmul, A.K. A Survey on the Use of AI and ML for Fighting the COVID-19 Pandemic. arXiv 2020, arXiv:2008.07449. Available online: http://arxiv.org/abs/2008.07449 (accessed on 11 May 2021).
  25. Saxena, N.; Gupta, P.; Raman, R.; Rathore, A.S. Role of data science in managing COVID-19 pandemic. Indian Chem. Eng. 2020, 62, 385–395. [Google Scholar] [CrossRef]
  26. Khan, F.N.; Khanam, A.A.; Ramlal, A.; Ahmad, S. A Review on predictive systems and data models for COVID-19. In Econometrics for Financial Applications; Springer: Singapore, 2020; pp. 123–164. [Google Scholar]
  27. Nguyen, T.T. Artificial intelligence in the battle against coronavirus (COVID-19): A survey and future research directions. arXiv 2020, arXiv:2008.07343. Available online: http://arxiv.org/abs/2008.07343 (accessed on 12 May 2021).
  28. Syeda, H.B.; Syed, M.; Sexton, K.W.; Syed, S.; Begum, S.; Syed, F.; Prior, F.; Yu, F., Jr. Role of machine learning techniques to tackle the COVID-19 crisis: Systematic review. JMIR Med. Inform. 2021, 9, e23811. [Google Scholar] [CrossRef] [PubMed]
  29. Mahmood, S.; Hasan, K.; Carras, M.C.; Labrique, A. Global preparedness against COVID-19: We must leverage the power of digital health (Preprint). JMIR Public Health Surveill. 2020, 6, e18980. [Google Scholar] [CrossRef] [Green Version]
  30. Shinde, G.R.; Kalamkar, A.B.; Mahalle, P.N.; Dey, N.; Chaki, J.; Hassanien, A.E. Forecasting models for coronavirus disease (COVID-19): A survey of the state-of-the-art. SN Comput. Sci. 2020, 1, 1–15. [Google Scholar] [CrossRef] [PubMed]
  31. Adly, A.S.; Adly, A.S.; Adly, M.S. Approaches Based on artificial intelligence and the internet of intelligent things to prevent the spread of COVID-19: Scoping review. J. Med. Internet Res. 2020, 22, e19104. [Google Scholar] [CrossRef] [PubMed]
  32. Chen, B.; Marvin, S.; While, A. Containing COVID-19 in China: AI and the robotic restructuring of future cities. Dialog Hum. Geogr. 2020, 10, 238–241. [Google Scholar] [CrossRef]
  33. Kielienyu, S.; Kantarci, B.; Turgut, D.; Khan, S. Bridging predictive analytics and mobile crowdsensing for future risk maps of communities against COVID-19. In Proceedings of the 18th ACM Symposium on Mobility Management and Wireless Access, New York, NY, USA, 16–20 November 2020; Association for Computing Machinery (ACM): New York, NY, USA, 2020; pp. 37–45. [Google Scholar]
  34. McBryde, E.S.; Meehan, M.T.; Adegboye, O.A.; Adekunle, A.I.; Caldwell, J.M.; Pak, A.; Rojas, D.P.; Williams, B.M.; Trauer, J.M. Role of modelling in COVID-19 policy development. Paediatr. Respir. Rev. 2020, 35, 57–60. [Google Scholar] [CrossRef]
  35. Leslie, D. Tackling COVID-19 through responsible AI innovation: Five steps in the right direction. Harv. Data Sci. Rev. 2020. [Google Scholar] [CrossRef]
  36. Kühn, M.J.; Abele, D.; Mitra, T.; Koslow, W.; Abedi, M.; Rack, K.; Siggel, M.; Khailaie, S.; Klitz, M.; Binder, S.; et al. Assessment of effective mitigation and prediction of the spread of SARS-CoV-2 in Germany using demographic information and spatial resolution. medRxiv 2020. medRxiv2020.12.18.20248509. [Google Scholar] [CrossRef]
  37. Richardson, G.P. Reflections on the foundations of system dynamics. Syst. Dyn. Rev. 2011, 27, 219–243. [Google Scholar] [CrossRef]
  38. Nah, K.; Chen, S.; Xiao, Y.; Tang, B.; Bragazzi, N.; Heffernan, J.; Asgary, A.; Ogden, N.; Wu, J. Scenario tree and adaptive decision making on optimal type and timing for intervention and social-economic activity changes to manage the COVID-19 pandemic. Eur. J. Pure Appl. Math. 2020, 13, 710–729. [Google Scholar] [CrossRef]
  39. Currie, C.S.; Fowler, J.W.; Kotiadis, K.; Monks, T.; Onggo, B.S.; Robertson, D.A.; Tako, A.A. How simulation modelling can help reduce the impact of COVID-19. J. Simul. 2020, 14, 83–97. [Google Scholar] [CrossRef] [Green Version]
  40. Cronemberger, F.; Gil-Garcia, J. Problem conceptualization as a foundation of data analytics in local governments: Lessons from the city of Syracuse, New York. In Proceedings of the 53rd Hawaii International Conference on System Sciences, Maui, HI, USA, 7–10 January 2020; Hawaii International Conference on System Sciences: Maui, HI, USA, 2020. [Google Scholar]
  41. Luna-Reyes, L.F.; Black, L.J.; Ran, W.; Andersen, D.L.; Jarman, H.; Richardson, G.P.; Andersen, D.F. Modeling and simulation as boundary objects to facilitate interdisciplinary research. Syst. Res. Behav. Sci. 2019, 36, 494–513. [Google Scholar] [CrossRef]
  42. Wolstenholme, E. Using generic system archetypes to support thinking and modelling. Syst. Dyn. Rev. 2004, 20, 341–356. [Google Scholar] [CrossRef]
  43. Sturniolo, S.; Waites, W.; Colbourn, T.; Manheim, D.; Panovska-Griffiths, J. Testing, tracing and isolation in compartmental models. medRxiv 2020. medRxiv:2020.05.14.20101808. [Google Scholar] [CrossRef]
  44. Paul, A.; Bhattacharjee, J.K.; Pal, A.; Chakraborty, S. Emergence of universality in the transmission dynamics of COVID-19. arXiv 2021, arXiv:2101.12556. Available online: http://arxiv.org/abs/2101.12556 (accessed on 12 May 2021).
  45. Cristianini, N. On the current paradigm in artificial intelligence. AI Commun. 2014, 27, 37–43. [Google Scholar] [CrossRef]
  46. Secinaro, S.; Calandra, D.; Secinaro, A.; Muthurangu, V.; Biancone, P. The role of artificial intelligence in healthcare: A structured literature review. BMC Med. Inform. Decis. Mak. 2021, 21, 125. [Google Scholar]
  47. Alimadadi, A.; Aryal, S.; Manandhar, I.; Munroe, P.B.; Joe, B.; Cheng, X. Artificial intelligence and machine learning to fight COVID-19. Physiol. Genom. 2020, 52, 200–202. [Google Scholar] [CrossRef]
  48. Pan, X. The application and legal issues of artificial intelligence in the global prevention and control of the COVID-19 epidemic. In Proceedings of the 6th Annual International Conference on Social Science and Contemporary Humanity Development (SSCHD 2020), Xi’an, China, 18–19 December 2020; Atlantis Press: Paris, France, 2021; pp. 440–445. [Google Scholar] [CrossRef]
  49. Jiang, L.; Wu, Z.; Xu, X.; Zhan, Y.; Jin, X.; Wang, L.; Qiu, Y. Opportunities and challenges of artificial intelligence in the medical field: Current application, emerging problems, and problem-solving strategies. J. Int. Med. Res. 2021, 49, 3000605211000157. [Google Scholar] [CrossRef]
  50. Raza, K. Artificial intelligence against COVID-19: A Meta-analysis of current research. In Big Data Analytics and Artificial Intelligence against COVID-19: Innovation Vision and Approach; Hassanien, A.-E., Dey, N., Elghamrawy, S., Eds.; Springer: Cham, Switzerland, 2020; pp. 165–176. [Google Scholar]
  51. Bullock, J.; Luccioni, A.; Pham, K.H.; Lam, C.S.N.; Luengo-Oroz, M. Mapping the landscape of Artificial Intelligence applications against COVID-19. J. Artif. Intell. Res. 2020, 69, 807–845. [Google Scholar] [CrossRef]
  52. Krishnaratne, S.; Pfadenhauer, L.M.; Coenen, M.; Geffert, K.; Jung-Sievers, C.; Klinger, C.; Kratzer, S.; Littlecott, H.; Movsisyan, A.; Rabe, J.E.; et al. Measures implemented in the school setting to contain the COVID-19 pandemic: A rapid scoping review. Cochrane Database Syst. Rev. 2020, 12, CD013812. [Google Scholar] [CrossRef] [PubMed]
  53. Lalmuanawma, S.; Hussain, J.; Chhakchhuak, L. Applications of machine learning and artificial intelligence for Covid-19 (SARS-CoV-2) pandemic: A review. Chaos Solitons Fractals 2020, 139, 110059. [Google Scholar] [CrossRef] [PubMed]
  54. Chen, J.; Li, K.; Zhang, Z.; Li, K.; Yu, P.S. A Survey on applications of artificial intelligence in fighting against COVID-19. arXiv 2020, arXiv:2007.02202. Available online: http://arxiv.org/abs/2007.02202 (accessed on 11 May 2021).
  55. Santosh, K.C. AI-driven tools for coronavirus outbreak: Need of Active learning and cross-population train/test models on multitudinal/multimodal data. J. Med. Syst. 2020, 44, 1–5. [Google Scholar] [CrossRef] [PubMed] [Green Version]
  56. Wadali, J.S.; Khosla, P.K. Healthcare 4.0 in future capacity building for pandemic control. In Predictive and Preventive Measures for Covid-19 Pandemic; Khosla, P.K., Mittal, M., Sharma, D., Goyal, L.M., Eds.; Springer: Singapore, 2021; pp. 87–107. [Google Scholar]
  57. Wang, C.J.; Ng, C.Y.; Brook, R.H. Response to COVID-19 in Taiwan: Big data analytics, new technology, and proactive testing. JAMA 2020. [Google Scholar] [CrossRef] [PubMed]
  58. Singh, R.P.; Javaid, M.; Haleem, A.; Suman, R. Internet of things (IoT) applications to fight against COVID-19 pandemic. Diabetes Metab. Syndr. 2020, 14, 521–524. [Google Scholar] [CrossRef]
  59. Song, J.; Gu, T.; Feng, X.; Ge, Y.; Mohapatra, P. Blockchain meets COVID-19: A framework for contact information sharing and risk notification system. arXiv 2020, arXiv:2007.10529. Available online: http://arxiv.org/abs/2007.10529 (accessed on 12 May 2021).
  60. Khanday, A.M.U.D.; Rabani, S.T.; Khan, Q.R.; Rouf, N.; Mohi Ud Din, M. Machine learning based approaches for detecting COVID-19 using clinical text data. Int. J. Inform. Technol. 2020, 16, 1–9. [Google Scholar] [CrossRef]
  61. Baclic, O.; Tunis, M.; Young, K.; Doan, C.; Swerdfeger, H.; Schonfeld, J. Challenges and opportunities for public health made possible by advances in natural language processing. Can. Commun. Dis. Rep. 2020, 46, 161–168. [Google Scholar] [CrossRef] [PubMed]
  62. Khmaissia, F.; Haghighi, P.S.; Jayaprakash, A.; Wu, Z.; Papadopoulos, S.; Lai, Y. An unsupervised machine learning approach to assess the ZIP code level impact of COVID-19 in NYC. arXiv 2020, arXiv:2006.08361. Available online: http://arxiv.org/abs/2006.08361 (accessed on 11 May 2021).
  63. Qeadan, F.; Honda, T.; Gren, L.H.; Dailey-Provost, J.; Benson, L.S.; Vanderslice, J.A.; Porucznik, C.A.; Waters, A.B.; Lacey, S.; Shoaf, K. Naive forecast for COVID-19 in Utah based on the South Korea and Italy models-the fluctuation between two extremes. Int. J. Environ. Res. Public Health 2020, 17, 2750. [Google Scholar] [CrossRef] [PubMed]
  64. Askarian, M.; Groot, G.; Taherifard, E.; Taherifard, E.; Akbarialiabad, H.; Borazjani, R.; Askarian, A.; Taghrir, M.H. Basics of developing a COVID-19 reopening roadmap: A systematic scoping review. Iran. J. Public Health 2021, 50, 232–244. [Google Scholar] [PubMed]
  65. Keeling, M.J.; Tildesley, M.J.; Atkins, B.D.; Penman, B.; Southall, E.; Guyver-Fletcher, G.; Holmes, A.; McKimm, H.; Gorsich, E.E.; Hill, E.M.; et al. The impact of school reopening on the spread of COVID-19 in England. medRxiv 2020. medRxiv:10.1101/2020.06.04.20121434. [Google Scholar] [CrossRef]
  66. World Health Organization. Key Messages and Actions for COVID-19 Prevention and Control in Schools. 2020. Available online: https://covid19-evidence.paho.org/handle/20.500.12663/792 (accessed on 12 May 2021).
  67. Vlacha, V.; Feketea, G.M. Return-to-school evaluation criteria for children with suspected coronavirus disease 2019. Front. Public Health 2020, 8, 618642. [Google Scholar] [CrossRef]
  68. Sheikh, A.; Sheikh, A.; Sheikh, Z.; Dhami, S. Reopening schools after the COVID-19 lockdown. J. Glob. Health 2020, 10, 010376. [Google Scholar] [CrossRef]
  69. Contreras, S.; Dehning, J.; Loidolt, M.; Zierenberg, J.; Spitzner, F.P.; Urrea-Quintero, J.H. The challenges of containing SARS-CoV-2 via test-trace-and-isolate. Nat. Commun. 2021, 12, 378. [Google Scholar] [CrossRef]
  70. Grundel, S.; Heyder, S.; Hotz, T.; Ritschel, T.K.S.; Sauerteig, P.; Worthmann, K. How to coordinate vaccination and social distancing to mitigate SARS-CoV-2 outbreaks. medRxiv 2020. medRxiv:2020.12.22.20248707. [Google Scholar] [CrossRef]
  71. Shayak, B.; Sharma, M.M.; Mishra, A.K. Impact of immediate and preferential relaxation of social and travel restrictions for vaccinated people on the spreading dynamics of COVID-19: A model-based analysis. medRxiv 2021. medRxiv:2021.01.19.21250100. [Google Scholar] [CrossRef]
  72. Aspinall, W.P.; Sparks, R.S.J.; Cooke, R.M.; Scarrow, J. Quantifying threat from COVID-19 infection hazard in primary schools in England. medRxiv 2020. medRxiv:2020.08.07.20170035. [Google Scholar]
  73. Kreck, M.; Scholz, E. Studying the course of Covid-19 by a recursive delay approach. medRxiv 2021. medRxiv:2021.01.18.21250012. [Google Scholar] [CrossRef]
  74. Thampi, N.; Sander, B.; Science, M. Preventing the introduction of SARS-CoV-2 into school settings. CMAJ Can. Med. Assoc. J. 2021, 193, E24–E25. [Google Scholar] [CrossRef] [PubMed]
  75. Colbourn, T.; Waites, W.; Panovska-Griffiths, J.; Manheim, D.; Sturniolo, S.; Colbourn, G. Modelling the health and economic impacts of population-wide testing, contact tracing and isolation (PTTI) strategies for COVID-19 in the UK. SSRN Electron. J. 2020. [Google Scholar] [CrossRef]
  76. Benneyan, J.C.; Gehrke, C.; Ilies, I.; Nehls, N. Potential community and campus Covid-19 outcomes under university and college reopening scenarios. medRxiv 2020. medRxiv:10.1101/2020.08.29.20184366. [Google Scholar] [CrossRef]
  77. Pavelka, M.; Van-Zandvoort, K.; Abbott, S.; Sherratt, K.; Majdan, M.; Analýz, I.Z.; Jarčuška, P.; Krajčí, M.; Flasche, S.; Funk, S. The effectiveness of population-wide, rapid antigen test based screening in reducing SARS-CoV-2 infection prevalence in Slovakia. medRxiv 2020. medRxiv:2020.12.02.20240648. [Google Scholar]
  78. Mina, M.J.; Andersen, K.G. COVID-19 testing: One size does not fit all. Science 2021, 371, 126–127. [Google Scholar] [CrossRef]
  79. Waites, W.; Cavaliere, M.; Manheim, D.; Panovska-Griffiths, J.; Danos, V. Scaling up epidemiological models with rule-based modelling. arXiv 2020, arXiv:2006.12077. Available online: http://arxiv.org/abs/2006.12077 (accessed on 11 May 2021).
  80. Tupper, P.; Colijn, C. COVID-19’s unfortunate events in schools: Mitigating classroom clusters in the context of variable transmission. medRxiv 2020. medRxiv:2020.10.20.20216267. [Google Scholar] [CrossRef]
  81. Wise, J. Covid-19: NHS test and trace must improve for schools to reopen safely, say researchers. BMJ 2020, 370, m3083. [Google Scholar] [CrossRef]
  82. Nguyen, L.L.K.; Howick, S.; McLafferty, D.; Anderson, G.H.; Pravinkumar, S.J.; Van Der Meer, R. Evaluating intervention strategies in controlling coronavirus disease 2019 (COVID-19) spread in care homes: An agent-based model. Infect. Control. Hosp. Epidemiol. 2020, 41, 1–11. [Google Scholar] [CrossRef] [PubMed]
  83. Tayarani, N.M.-H. Applications of artificial intelligence in battling against covid-19: A literature review. Chaos Solitons Fractals 2021, 142, 110338. [Google Scholar] [CrossRef] [PubMed]
  84. Musulin, J.; Baressi Šegota, S.; Štifanić, D.; Lorencin, I.; Anđelić, N.; Šušteršič, T. Application of artificial intelligence-based regression methods in the problem of COVID-19 spread prediction: A systematic review. Int. J. Environ. Res. Public Health 2021, 18, 4287. [Google Scholar] [CrossRef] [PubMed]
  85. Marini, M.; Chokani, N.; Abhari, R.S. COVID-19 epidemic in Switzerland: Growth prediction and containment strategy using artificial intelligence and Big Data. medRxiv 2020. medRxiv:2020.03.30.20047472. [Google Scholar] [CrossRef] [Green Version]
  86. Gianquintieri, L.; Brovelli, M.A.; Pagliosa, A.; Dassi, G.; Brambilla, P.M.; Bonora, R.; Sechi, G.M.; Caiani, E.G. Mapping spatiotemporal diffusion of COVID-19 in Lombardy (Italy) on the base of emergency medical services activities. ISPRS Int. J. Geo. Inf. 2020, 9, 639. [Google Scholar] [CrossRef]
  87. Simsek, M.; Kantarci, B. Artificial intelligence-empowered mobilization of assessments in COVID-19-like pandemics: A case study for early flattening of the curve. Int. J. Environ. Res. Public Health 2020, 17, 3437. [Google Scholar] [CrossRef]
  88. The Python Standard Library—Python 3.9.1 Documentation. Available online: https://docs.python.org/3/library/ (accessed on 6 October 2020).
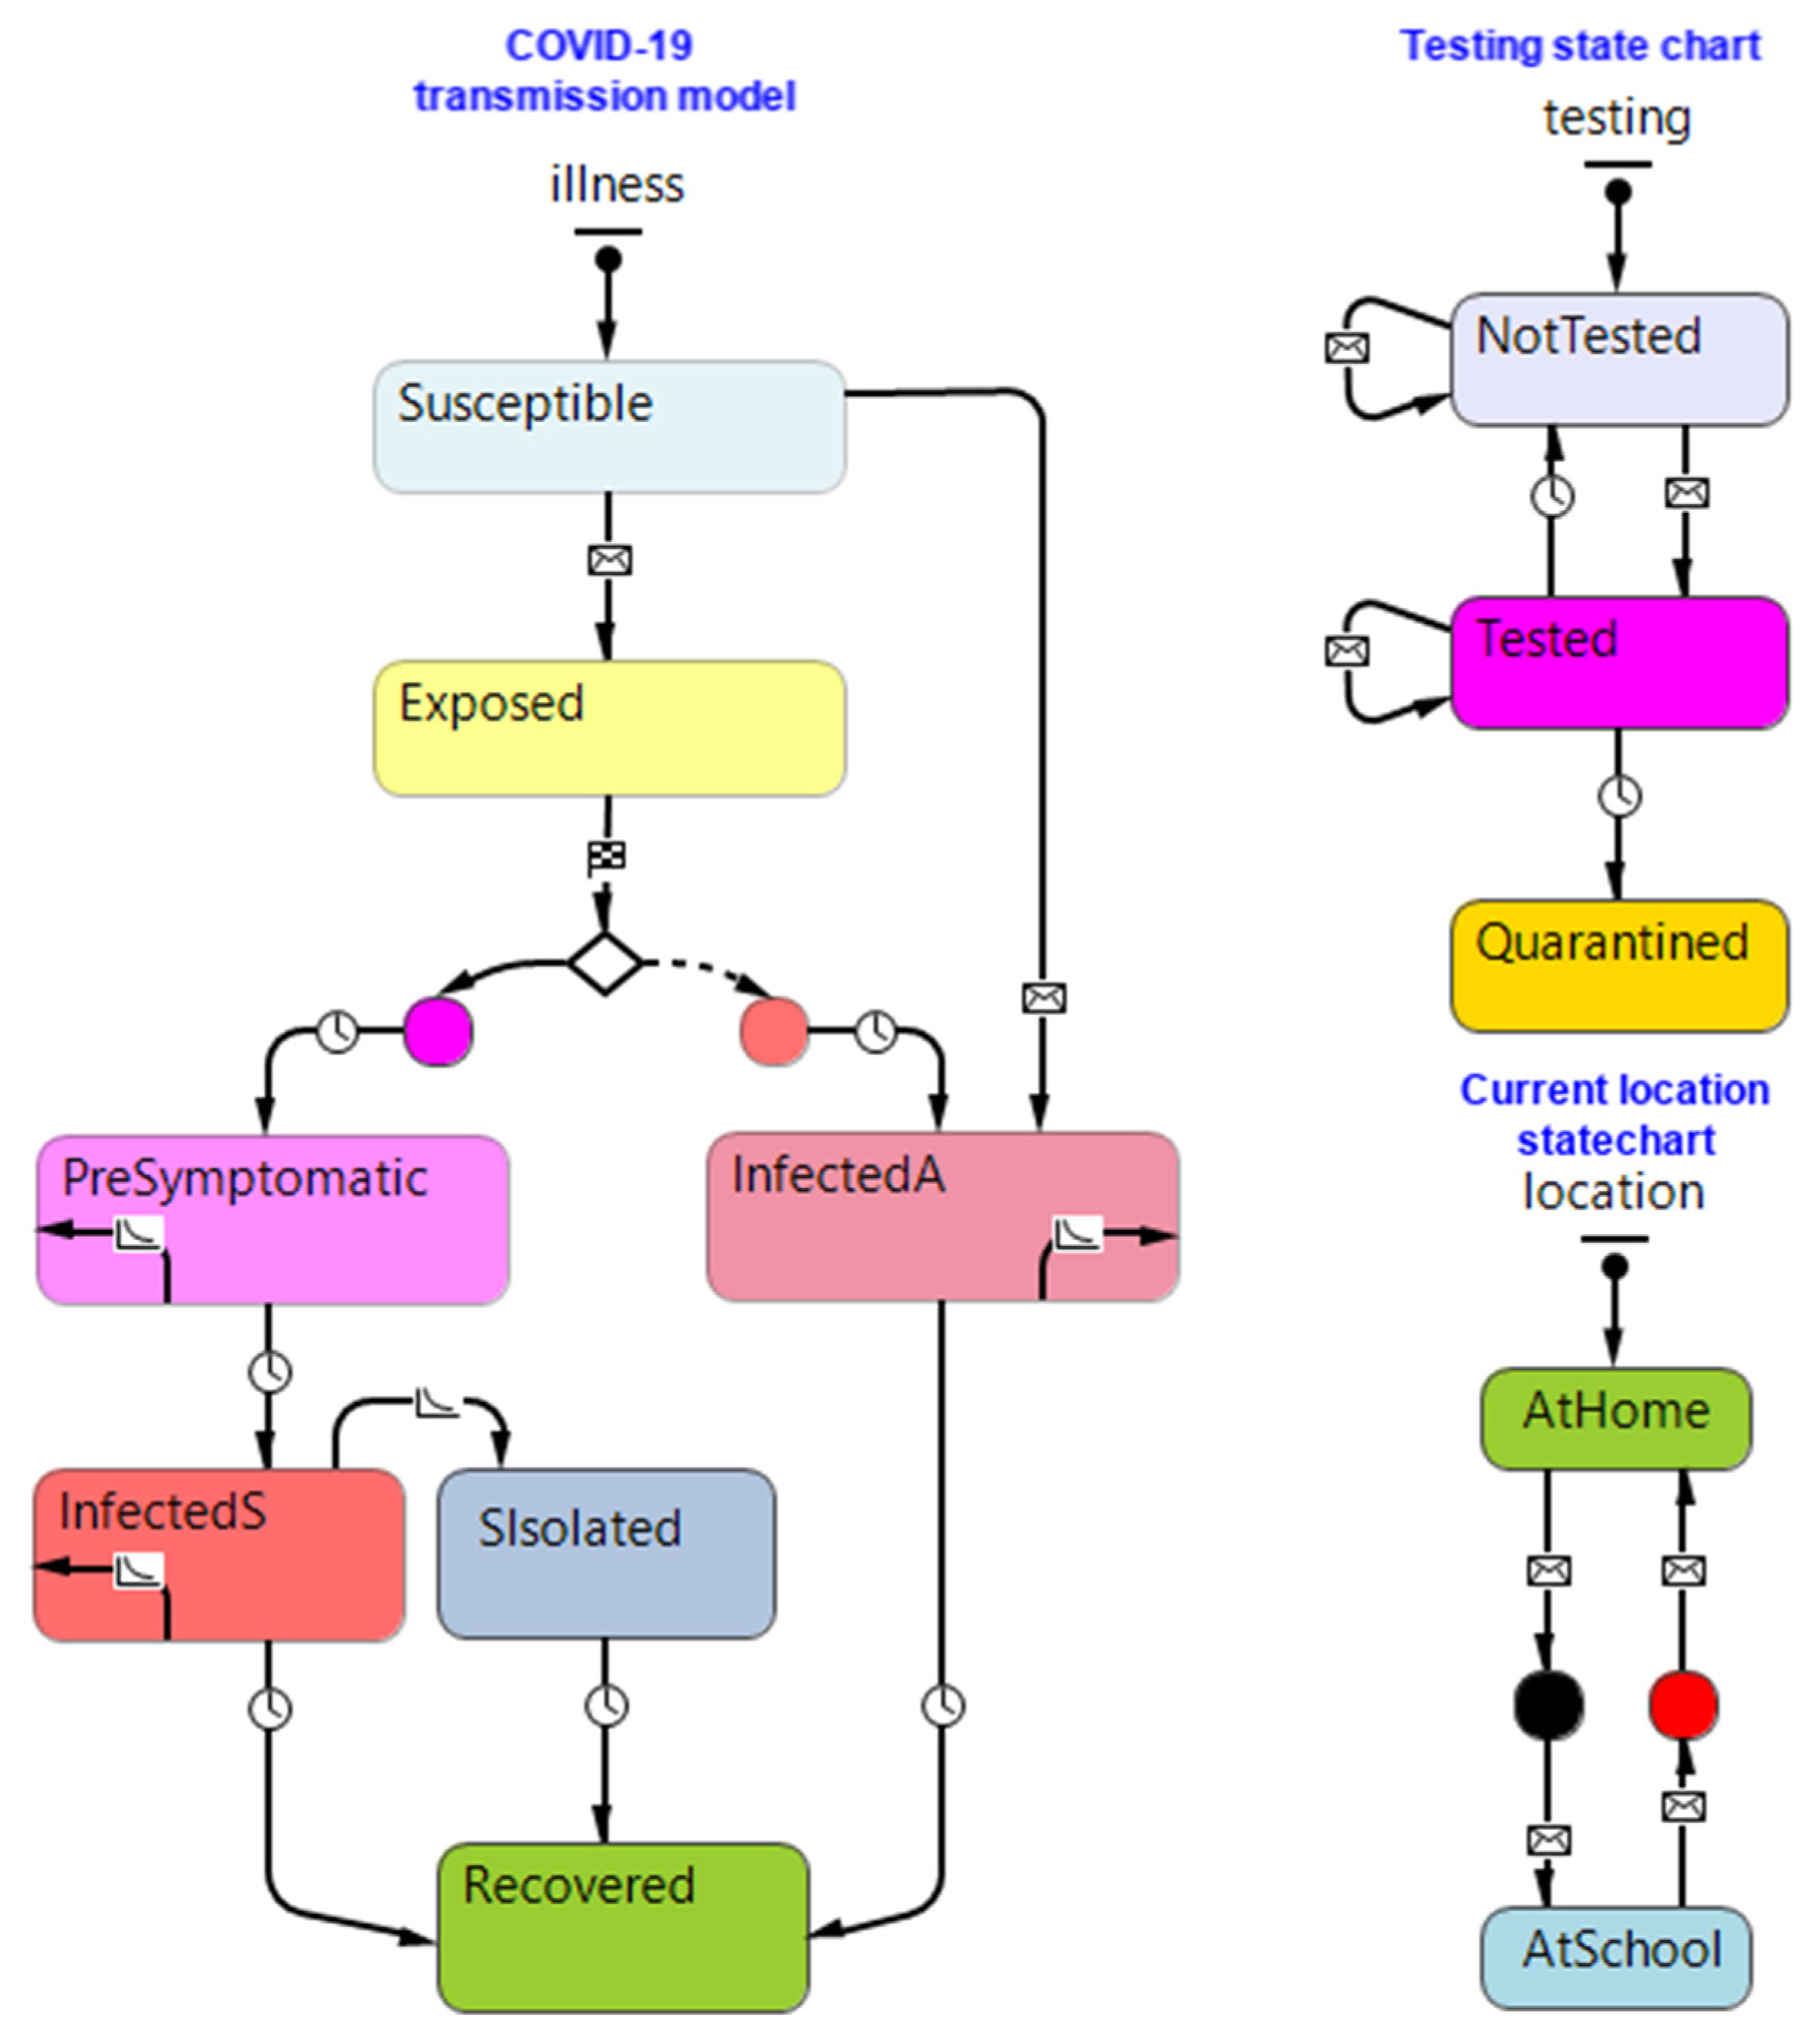
Figure 1. Student agent state charts (disease transmission—(left), testing—(top right) and location—(bottom right)) [4].
Electronics 10 01626 g001
Figure 2. 3D animation of the AnyLogic simulation in action. Pictured is a school made up of 25 classes, each made up initially of 20 students. Virus appears to be present in the middle classroom on the bottom row.
Electronics 10 01626 g002
Figure 3. Final neural network design. The box colored in green contains the input parameters, followed by 3 fully connected–ReLU–dropout blocks. A fully connected 200 neuron feature layer is added with ReLU activations, feeding into the output layer. This final section is analogous to a linear classifier, utilizing the feature representation in order to make the final prediction. The output layer consists of stacked time series of length 60, each signifying a day in the time horizon, as well as some final model statistics like total infected cases.
Electronics 10 01626 g003
Figure 4. Accuracy history of the model during training. The blue line shows the mean absolute error of the entire training set, while the yellow is the test accuracy used for validation purposes. Notice test accuracy starts to stagnate approximately 40 epochs in, indicating that further training from this point has negligible effects.
Electronics 10 01626 g004
Figure 5. Histogram of model inference times. Most predictions happen in the 25-millisecond to 30-millisecond range, allowing for consistent model use at around 30 Hz.
Electronics 10 01626 g005
Figure 6. A prediction using our network model of a random test sample. (a) Predicted results for number of tests administered, virus spread, cumulative and daily infected cases, isolated population and other key distributions measures through 60 days. (b) Actual results for the same test sample. The student testing chart exhibits step-like structure inline with the periodically administered class testing. Infection profiles and the virus spread also display the commonly observed plateauing in the long-term dynamics of such systems, as evident in the real data.
Electronics 10 01626 g006
Figure 7. Infection count heatmaps of a range of parameter values. (a) Number of contacts per day is varied between 2.45 and 5.45, and the overall infection count is shown vs. time in days. (b) Class size is varied between 15 and 35, and the overall infection count is shown vs. time in days. (c) Number of contacts per day class size are varied, and the overall total infected count on day 60 is displayed. Contour lines show regions with equal values.
Electronics 10 01626 g007aElectronics 10 01626 g007b
Table 1. Parameter ranges used for sampling in the data generation process.
ParameterRangeNotes
Number of contacts per school day2.45–5.45Double
Transmission probability of pre-symptomatic0.01–0.1Double
Transmission probability of symptomatic0.1–0.2Double
Transmission probability of asymptomatic0.1–0.2Double
Pre-symptomatic rate (portion)0.35–0.65Double
Pre-symptomatic latent period1.3–3.3Double
Asymptomatic latent period3.47–5.47Double
Symptomatic latent period1.63–3.63Double
Self-isolation rate0.4–0.7Double
Symptomatic recovery period7–19Integer
Asymptomatic recovery period6–12Integer
Number of initially infected students1–10Integer
Class size15–35Integer
Number of classes10–50Integer
Isolate classTrue or FalseBoolean
Cross transmissionTrue or FalseBoolean
Test classTrue or FalseBoolean
Number of tests in each class1–10Integer
Test results time (days)0–6Integer
Test expiry time (days)7–21Integer
Test frequency (days)1, 7, 14, 21 or 28Integer
Table 2. Mean absolute error (MAE) for different network architectures. As expected, increased depth and neuron count generally improves overall accuracy.
Neurons per Layer2 Layers3 Layers4 Layers5 Layers
12821.187723.06327.508231.5405
25619.372617.609920.979123.8443
51218.200715.586815.3118 *15.8596
102418.545914.787415.107414.9054
* Architecture selected for full training.
Table 3. Mean absolute error in a 5-fold cross-validation and in overall test set.
ValidationTest
Fold 1Fold 2Fold 3Fold 4Fold 5-
14.861615.059414.895614.661414.999014.4264
Publisher’s Note: MDPI stays neutral with regard to jurisdictional claims in published maps and institutional affiliations.