1. Introduction
The active millimeter wave imaging system has many advantages, such as being less influenced by environmental factors, more comprehensive information acquisition, real-time imaging, and good reconstructed image effect [
1]. Therefore, it is very suitable for human body security inspection to detect hidden objects [
2,
3,
4,
5]. For human security technology, compared to microwave, the wavelength of millimeter waves is smaller than that with an order of magnitude. The resolution of the image will be substantially improved if the electromagnetic waves of shorter wavelength are used for imaging. Due to the short wavelength, devices based on millimeter waves are small in size and light in weight. Millimeter waves also have strong penetrating ability to common shielding materials and rain, fog, smoke, and dust. As for millimeter waves and terahertz (THz) waves, they both have good penetrating ability for common shielding materials, such as clothes, plastics, and paper. In [
6], the penetrating ability of millimeter waves, THz waves, and mid infrared waves for eight different common clothes materials were compared and discussed, and the results indicated that the attenuation were all below 3 dB for the eight different samples with millimeter-level thickness.
Recently, THz imaging technology has been fast developing. A continuous wave sub-wavelength terahertz imaging system combines two prominent classical optical techniques: solid immersion microscopy and interferometric detection. This combination allows for resolution beyond the diffraction limit at 703 GHz [
7]. A rapid three-dimensional (3D) time-of-flight imaging tool for inspection of packaged semiconductor chips has also been proposed, which can utilize THz time-domain spectroscopy techniques to deliver a scanning speed of more than 100 Hz/pixel with a signal-to-noise ratio larger than 20 dB [
8]. THz imaging and sensing applications with silicon-based components have been developed and applied in high-resolution radar imaging and subwavelength-resolution near-field imaging [
9]. However, the transmittance of wave decreases with the increase in frequency. Therefore, it can be inferred that the penetrating ability of millimeter waves is stronger than that of terahertz waves for common shielding materials. Meanwhile, the radiation of millimeter waves is not harmful to human body.
Modern security systems have high requirements for detection time and imaging quality. Existing imaging technologies have some defects, such as weak penetration and long reaction time. The 12 transmitting and 12 receiving sparse array imaging system has previously been proposed, which works in 75–110 GHz [
10]. In order to solve the defocus problem in single-frequency imaging, an adaptive focus reconstruction algorithm based on the minimum entropy method has been proposed [
11]. A range migration algorithm for near-range high-precision 3D image reconstruction has been developed, where phase decoupling is achieved with 2D Stolt mapping [
12]. However, in the traditional active millimeter wave imaging method, the range resolution is too different from the azimuth resolution, and there is no way to recover three-dimensional object distribution less than the range resolution. The holographic reconstruction algorithm reported in [
10] relies on increasing the system bandwidth, which increases the system cost. The algorithm shown in [
12] lacks the near-range sensing method, and there is no matched filter to effectively compensate its phase. Recently, the active millimeter wave imaging method based on angular spectrum theory has been proposed [
13], but the range resolution cannot be effectively restored. Furthermore, an image fusion method with single-frequency imaging method was presented in [
14], but this too cannot obtain the required resolutions. The azimuth resolution can be improved by various methods of image processing, but the traditional method of range direction resolution is to improve the system bandwidth. The improvement of the system bandwidth undoubtedly increases the costs substantially. The improvement space is also limited, so the system bandwidth cannot be expanded indefinitely [
15,
16,
17]. In [
18], the authors proposed a method that can realize similar imaging performance as the traditional multichannel MIMO radar by a single transmit/receive channel instead of a large number of transmit/receive channels. An efficient interpolation-free algorithm (IFA) applied for cylindrical millimeter wave (MMW) holographic three-dimensional (3D) reconstruction has also been proposed [
19], which can efficiently achieve high-quality 3D reconstruction within the region of interest (ROI). A series of array configurations were designed to explore the impact of different array positions on the cross-range imaging performance in [
20], and a novel fast fully focused imaging algorithm with wavenumber domain properties that is not constrained by the positions of the transmitters and receivers was presented. However, there are some limitations in these works, such as limited system resolution and high costs.
In view of the large difference between the range direction resolution and the azimuthal resolution during the reconstruction of three-dimensional millimeter wave holography, in this study, the phase unwrapping technology of interferometric synthetic aperture radar was used for reference. The range resolution of the reconstructed image was improved by restoring the phase distribution of the target. An algorithm was developed to improve the range direction resolution without increasing the system bandwidth. The prior continuity information of the object was used to recover the distribution of the continuous phase so as to effectively utilize the three-dimensional coordinate information of the target object. Through the reconstruction algorithm based on phase unwrapping proposed in this paper, the phase diagram of the reconstructed image can be calculated and the phase diagram restored according to the phase quality diagram. Compared with the traditional imaging algorithms, the proposed algorithm improves the range resolution from centimeter level to millimeter level without increasing the system bandwidth, which greatly reduces the system cost. It solves the problem of poor range resolution in traditional millimeter wave holographic 3D accurate reconstruction algorithms and provides algorithm support for high-resolution reconstruction of security millimeter wave images.
2. Phase Unwrapping Algorithm
The scattering echo data received by the system not only records the amplitude information of the electromagnetic wave but also contains the phase information of the electromagnetic wave. However, the traditional image processing technology usually only pays attention to the amplitude information. It obtains the desired image through various image transformation and processing steps but neglects the phase that also contains the target information. In order to better realize the 3D reconstruction of the target environment, the traditional single-frequency signal is extended to the broadband signal, which can effectively present the reconstruction information of the range distribution. By using the broadband signal to realize the range distribution, the depth information of the scanned target can be recovered from the relationship between the phase difference of the received echo and the distance. By obtaining the phase information of the target, the range distribution of the original target can be recovered through the conversion relationship. The 3D distribution characteristics of the target can then be restored, and the accurate 3D image can be reconstructed. After some digital image processing, the data obtained by the interferometric synthetic aperture radar (ISAR) is finally reconstructed as a complex image. In order to obtain the phase of the complex image, the arctangent function is used to process the image data as shown below:
In the formula,
s is the complex figure, Im is the operation on the imaginary part of
s, Re is the operation on the real part of
s, and arctan is the tangent. Taking into account the quadrant difference of the complex number, the range of the phase value obtained by the arctangent function is changed from (−π/2, π/2) to (−π, π). The resulting phase is not the real phase, and the real phase of the target is wrapped in (−π, π) or phase entanglement. The phase value obtained from Equation (1) is called the principal value of the real phase of the target, and the difference between it and the real phase of the target is an integer multiple of 2π, which is expressed as follows:
where
n is an integer. An appropriate value of
n is taken to make −π <
Φ < π, where
Φ is the principal value obtained through the arctangent function.
φ is the true phase related to the three-dimensional distribution of the target.
In order to obtain the true range distribution of the target, it is necessary to unwrap the principal values wrapped between (−π, π) and restore their true phase values, which is called phase unwrapping.
The phase unwrapping algorithm is based on the continuity of the depth information of the target object, that is, under the condition of satisfying the Nyquist sampling theorem, the phase change between two adjacent sampling points is less than π, so phase unwrapping can be carried out. Comparing the phases of two adjacent points, one point is the reference point, and when the phase difference between the other point and the reference point is less than −π or greater than π, integer multiples of 2π should be added so that the absolute value of the phase difference between the two points does not exceed π.
The phase is extracted from the single-view complex image generated by the synthetic aperture radar, and the 3D image of the target range is then obtained by interference processing. The collected data can be expressed as follows:
where
a (
x,
y) represents the target area for the image of reflectivity, and
R1(
x,
y) and
R2(
x,
y) are the distances between the two radars and the target. Thus, two coherent graphs are obtained. The two graphs are first registered and then multiplied by conjugate to obtain the following:
After observation of the type, the conjugate multiplication of s1(x, y) s2*(x, y) phase is associated only with the distance difference, and it also contains the height information of the target environment. The phase information obtained by the synthetic aperture radar interferometry technology can be used to recover the target information by phase unwrapping and then realize the 3D reconstruction imaging of radar imaging.
In the phase unwrapping algorithm, we map the phase unwrapping problem to the perimeter integral in the field of complex function and use the residues to describe the inconsistency of phase unwrapping.
In the field of complex functions, if
f(
φ)
=▽φ is analytic at point
r, that is, the function
f(
φ) is differentiable everywhere in the neighborhood of the point
r, a simple closed curve
C around
r is arbitrarily made in some neighborhood of point
r. According to Cauchy theorem,
However, if
r is an isolated singularity, then the integral value of
C along the simple closed path in the decentering neighborhood along
r will no longer be zero. In this case, the residual integral value is the residual of function
f(
φ) at point
r is denoted as follows:
If the function is differentiable everywhere except for a finite number of singularities (residuals) in the region
D bounded by a piecewise smooth closed curve
C, then the closed domain (
D + C) is continuous everywhere except for the finite number of singularities, and the forward integral of the function
f(
φ) along the boundary
C is equal to the sum of the residuals of the function
f(
φ) at the finite number of singularities times 2
πi:
When the residue theorem is applied to two-dimensional phase unwinding, the equation can be expressed as follows:
In the formula (the sum of the residual charges surrounded by a closed path),
represents the polar residual charge at
rk. When its value is 1, it indicates that the polarity charge of residual
rk is positive; when its value is −1, its polarity is negative. Both the formulas above indicate that the integral of the function
f(
φ) is independent of the path choice only if
, that is, the sum of residual charges surrounded by a closed path is 0. Therefore, in order to offset its charge polarity and ensure that the integral result is independent of the path, the residual detection should be carried out. Residual detection method is conducted after the normalization processing of two-dimensional phase image. The phase gradient value is accumulated around the minimum closed path 2 × 2 pixels, and the cumulative result is the charge of the pixel in the upper left corner of the template. When the value is 1, it indicates that this point is a positive residual; when the value is −1, it is a negative residual. Only when the value is 0, the pixel in the upper left corner can be marked as a nonresidual. If the polarity of the residual in a certain region just cancels each other and the branch-cutting method is used to connect the residual with the opposite sign to ensure that the integral path does not cross these obstacles, the correct phase unwrapping can be carried out. Therefore, in the case of the branch-cutting method, residual detection is the first step of the phase unwrapping algorithm.
Figure 1 is the flow chart of the branch-cutting method.
Figure 1a is a 2 × 2 closed loop element in the phase data matrix,
Figure 1b is the sum of the decomposition of a 3 × 3 closed loop into four 2 × 2 closed loops, and
Figure 1c is the branch-cutting distribution and phase unwrapping of the branch-cutting method.
In the branch-cutting method, the residual is first identified and the branch-cutting line is formed by connecting the residual with the nearest neighbor principle to isolate the noise and prevent error transmission. Finally, the absolute phase is recovered by integrating adjacent pixels and expanding the phase gradient. The algorithm steps are as follows: (1) identify the residues, (2) generate the branch cut, (3) perform path integration around the branch tangent.
The branch cutting method connects the residual in the nearest way, that is, connecting the residue of opposite polarity or connecting the area containing multiple pairs of residues of opposite polarity to achieve the purpose of balancing the residual charge. A special type of residual exists in the phase data, which are of opposite polarity and adjacent to the upper and lower or left and right sides. This residue is called the dipole residue. In the branch-cutting generation process, it is identified and marked as “nonresidual”, which can effectively control the interference of random noise to phase data and enhance the execution efficiency of the algorithm.
The difference operation is carried out according to the points in
Figure 1a as follows:
where Δ
i (
i = 1, 2, 3, 4) is the difference of adjacent phase points, which can be obtained by adding the differences:
In the formula,
φx(
m,
n) =
φ(
m,
n + 1) −
φ(
m,
n) represents the partial differential of the phase in the
x direction of (
m,
n). It can be determined from Equation (7) that the recovery phase is independent of the integral path. In the phase diagram of the interference package, the summation calculation of 2 × 2 difference transformation can be obtained as follows:
where
ω represents the phase operator,
φ is the true phase value,
Φ is the wrapped phase calculation after the phase principal value through the phase of data collection to be processed for value, and
a represents the minimum closed path around the adjacent phase points difference accumulation. If there are no interference phase points, then the interpolation of the wrapped phase is equal to the difference value of the true phase, and the result of Equation (8) should be 0. However, in practice, there are often various interference effects, so the value of
a may be +2π or −2π. In this case, the corresponding residual should be marked. If the value is +2π, the phase point on the upper left of the closed loop will be marked as positive, and if the value is −2π, the phase point on the upper left of the closed loop will be marked as negative.
When extended to the 3 × 3 closed loop as shown in
Figure 1b, it can be decomposed into the sum of 2 × 2 closed loops as shown in
Figure 1b. If the value is 0, it means that the integral of the 3 × 3 closed loop is 0, which indicates that the recovery of these phase points is independent of the path. Therefore, when the positive and negative residuals in the phase unwrapping path are equal to each other, the phase can be accurately restored. After the residual has been determined, the placement of the branch tangent needs to be determined based on the residual. After one residual is determined, the other residual in the 2 × 2 region is searched with this residual as the center. If the other residual is identified, this phase point is first connected to the center point. If this newly found residual is opposite to the positive and negative polarity of the center point, it is considered that the positive and negative polarity offset reaches equilibrium. It can start looking for new residues and build new branch tangents. If the polarity of the two points is the same, the balanced residual will need to be searched. This process is repeated until all the residuals have reached equilibrium. In order to balance the residual charge, the polarity of residual charge can be offset by connecting the residues and the boundary of the phase data.
The branch cutting method of distribution and phase diagram is shown in
Figure 1c. After setting up the branch tangent, a point outside the branch tangent is selected and phase unwrapping is commenced. Because the residuals are all connected by branch tangents, the integration of phase unwrapping bypasses the branch tangents. The reliable region is expanded until all the points that are not on the branch tangent is expanded, and the branch tangent is then processed. This method of determining the integral path by setting the branch tangent is the basis of the path following algorithm.
The mass map method generates a mass map by extracting other information from the phase data except the phase derivative and residual. The data in the mass map represents the evaluation of the phase value of each pixel of the original interferometric phase map and represents the quality or reliability of the phase points. The integral path is guided by the mass map. In the branch cutting method, the residual value is reflected as the low-quality pixel value in the mass graph, while in the mass graph method, the high-quality phase point is first unrolled and then the low-quality phase point is unrolled. This method does not recognize the residual and does not produce branch cutting. Instead, it depends on the assumption that a good mass graph will guide the integral path without enclosing any unbalanced residual, which is a risky assumption. However, a large number of experiments have shown that a mass graph guided approach can yield good phase unwrapping. The mass map is generated using the existing phase data to be developed. The commonly used images include coherence coefficient map, pseudo coherence coefficient map, phase derivative variance map, maximum phase gradient map, etc.
The coherence coefficient graph first determines the window size around a phase point and then uses the main image and the corresponding pixel complex value after resampling to estimate the coherence coefficient of the central pixel:
In Equation (13), N is the window size, Mi represents the complex value in the main image window, Si is the pixel value corresponding to the subordinate effect, and Mi and Si are both complex numbers. The higher the coherence coefficient value, the higher the registration precision of the two complex images and the stronger the reliability of the interference phase. This method is the only quality image that utilizes both amplitude and phase information among the four kinds of images.
Pseudo-coherence coefficient graph is an evaluation method based on coherence coefficient. In most cases, it is impossible to obtain the information of two complex numbers affecting the true amplitude. In the pseudo-coherence coefficient method, it is assumed that the variation trend of amplitude information and phase information is consistent. Under a certain window, the pseudo-coherence coefficient is calculated as follows:
where,
ψi is the phase value of the wrapping at point
i within the scope of the window. Because this method assumes that the amplitude change is consistent with the phase change, the pseudo-coherence coefficient graph will mark the area without interference in the target region but with dramatic elevation information change as low quality, thus generating errors.
Based on the continuous changing nature of the target, the phase derivative change diagram will also mark the area with large phase change difference as low-quality area. However, unlike the previous two methods, the larger the value of phase derivative change, the lower the quality of the phase and the worse the reliability of the phase point. The specific calculation is as follows:
where
and
are the partial phase derivatives of the phase points in the calculation window in the x and y directions. In the absence of coherence coefficient graph, the phase derivative variation graph is the best evaluation criterion.
The maximum phase gradient diagram is similar to the phase derivative variation diagram. Noise will affect the phase and lead to an increase of the phase gradient. Therefore, the higher the value, the worse the phase quality in the maximum phase gradient diagram, which is expressed as follows:
The specific operation of the quality chart guiding algorithm is as follows: (1) select the initial pixel with high quality and check the four adjacent phase points, which are not expanded and stored in another list; (2) select the phase points with high quality from the four adjacent phase points for expansion and then put the unexpanded phase points among the adjacent phase points into the list; (3) sort the phase points in the list that have not been expanded by quality and then select the phase points with the highest quality for expansion; (4) repeat the above process until all phase points are expanded. This method is shown in
Figure 2.
By restoring the phase distribution, the distance distribution of the three-dimensional target can be recovered. After obtaining the expanded phase value, the relative range distribution of the target can be calculated according to Equation (17):
3. Experimental and Simulation Results and Discussion
In order to verify the ability of the newly proposed algorithm to restore the range direction distribution of the model and improve the range direction resolution, a three-dimensional inclined flat panel was used as the measurement target. The size of the target model is given in
Figure 3. The imaging system adopted a single transmitting and single receiving synthetic aperture scanning mode. The frequency of the millimeter wave emission source was set as 77–81 GHz (bandwidth is 4 GHz). The number of sampling points was 10 points, the imaging distance was set to 300 mm, and the imaging system was as shown in
Figure 3.
The image pixel size was 128 × 128, and the pixel interval was 3 mm. Theoretically, if the image information needs to be restored accurately, the Nyquist sampling theorem should be satisfied when sampling the received data. The change of received data information mainly influences the phase information while having little effect on amplitude information. Therefore, according to the theory, in order to avoid spectrum aliasing, the sampling interval of the scattered echo data in the spatial domain should not exceed half of the wavelength corresponding to the highest frequency. The phase interval of adjacent sampling points is less than π, and the spatial frequency of phase information
Φ is expressed as follows:
The maximum value of
fx is as follows:
where
Lx is the transverse distance of the scanning range, and
Z0 is the distance between the front surface of the target and the scanning surface. According to the sampling theorem, the transverse sampling interval Δ
x is as follows:
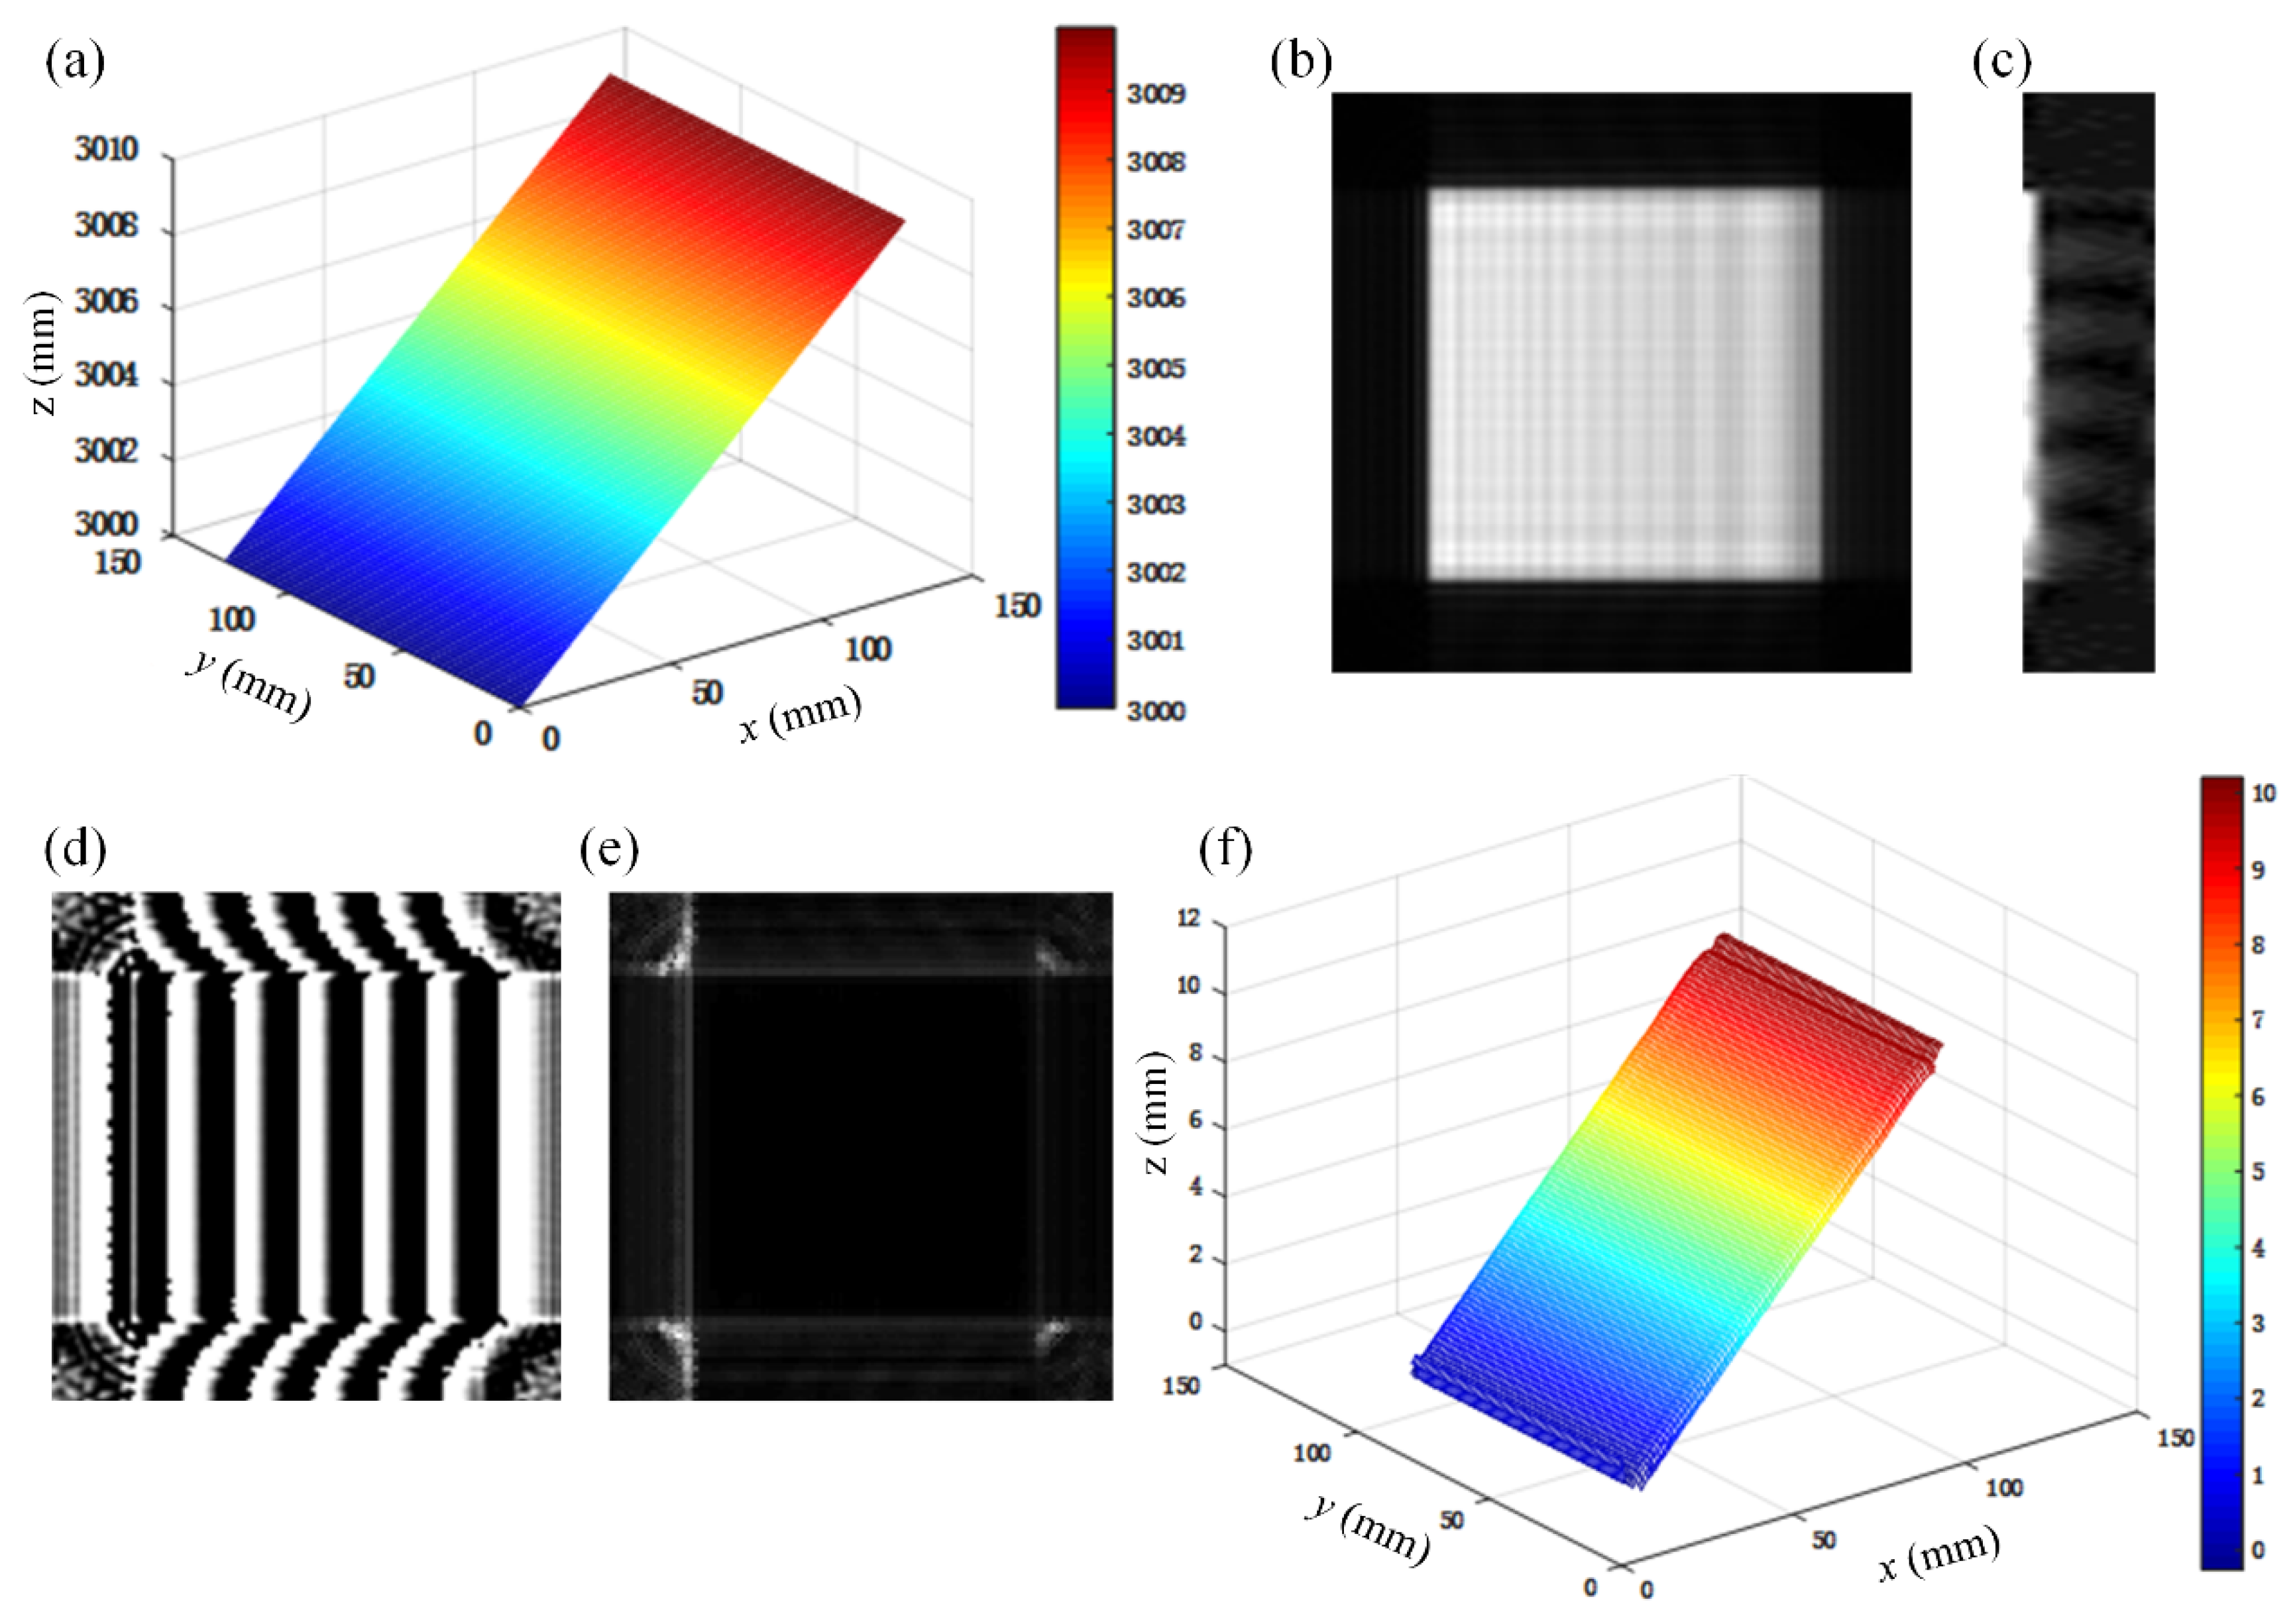
According to the sampling theorem, the calculated sampling interval was 4.5 mm, and the number of sampling points was the same as the size of the image pixels, which was also 128 × 128. The reconstruction results based on the traditional active millimeter wave imaging algorithm are shown in
Figure 4b,c, and the reconstruction results based on the phase unwrapping algorithm proposed in this paper are shown in
Figure 4f.
First, the traditional active millimeter wave imaging algorithm was used, and the results obtained by 3D reconstruction of the target are shown in
Figure 4b (front view) and
Figure 4c (side view). From the front view, the azimuthal distribution of the inclined plate was well restored. From the side view, the distance direction distribution of the inclined plate model could not be accurately recovered even after the traditional 3D reconstruction. According to traditional imaging methods, the resolution of the range direction is expressed as follows:
After calculation, the range direction resolution was 37.5 mm, that is, the minimum distance between the two objects that the system could distinguish was 37.5 mm. The oblique range direction distribution we chose was 10 mm, so the traditional imaging method could not distinguish the target. According to the phase unwrapping algorithm proposed in this paper, the phase diagram of the reconstructed target image was first calculated, as shown in
Figure 4d. Then, the algorithm was used to restore the wrapped phase. According to the quality figure method, the reliability of each phase point should be evaluated first. In common methods, the phase derivative variance is selected to evaluate the quality of phase points. The quality graph generated is shown in
Figure 4e, and the data size of the quality graph represents the level of reliability. In the quality map, phase unwrapping was carried out in the order of high and low quality according to the guidance of phase point quality. The result of phase unwrapping is shown in
Figure 4f. Because the phase is directly dependent on the distance, the recovered phase distribution can represent the distance distribution. By observing the reconstructed image 3f obtained by the phase unrolling algorithm in this paper, it can be seen that the range distribution of the original unresolved 3D image was restored to the original continuous state through phase unrolling, and the range distribution was about 10 mm, which is similar to the original 3D model distribution, with small error, and the range resolution was improved. Therefore, according to the reconstruction algorithm based on phase unwrapping proposed in this paper, the range resolution can reach millimeter level (the traditional imaging range resolution is centimeter level), and the 3D target can be well restored.
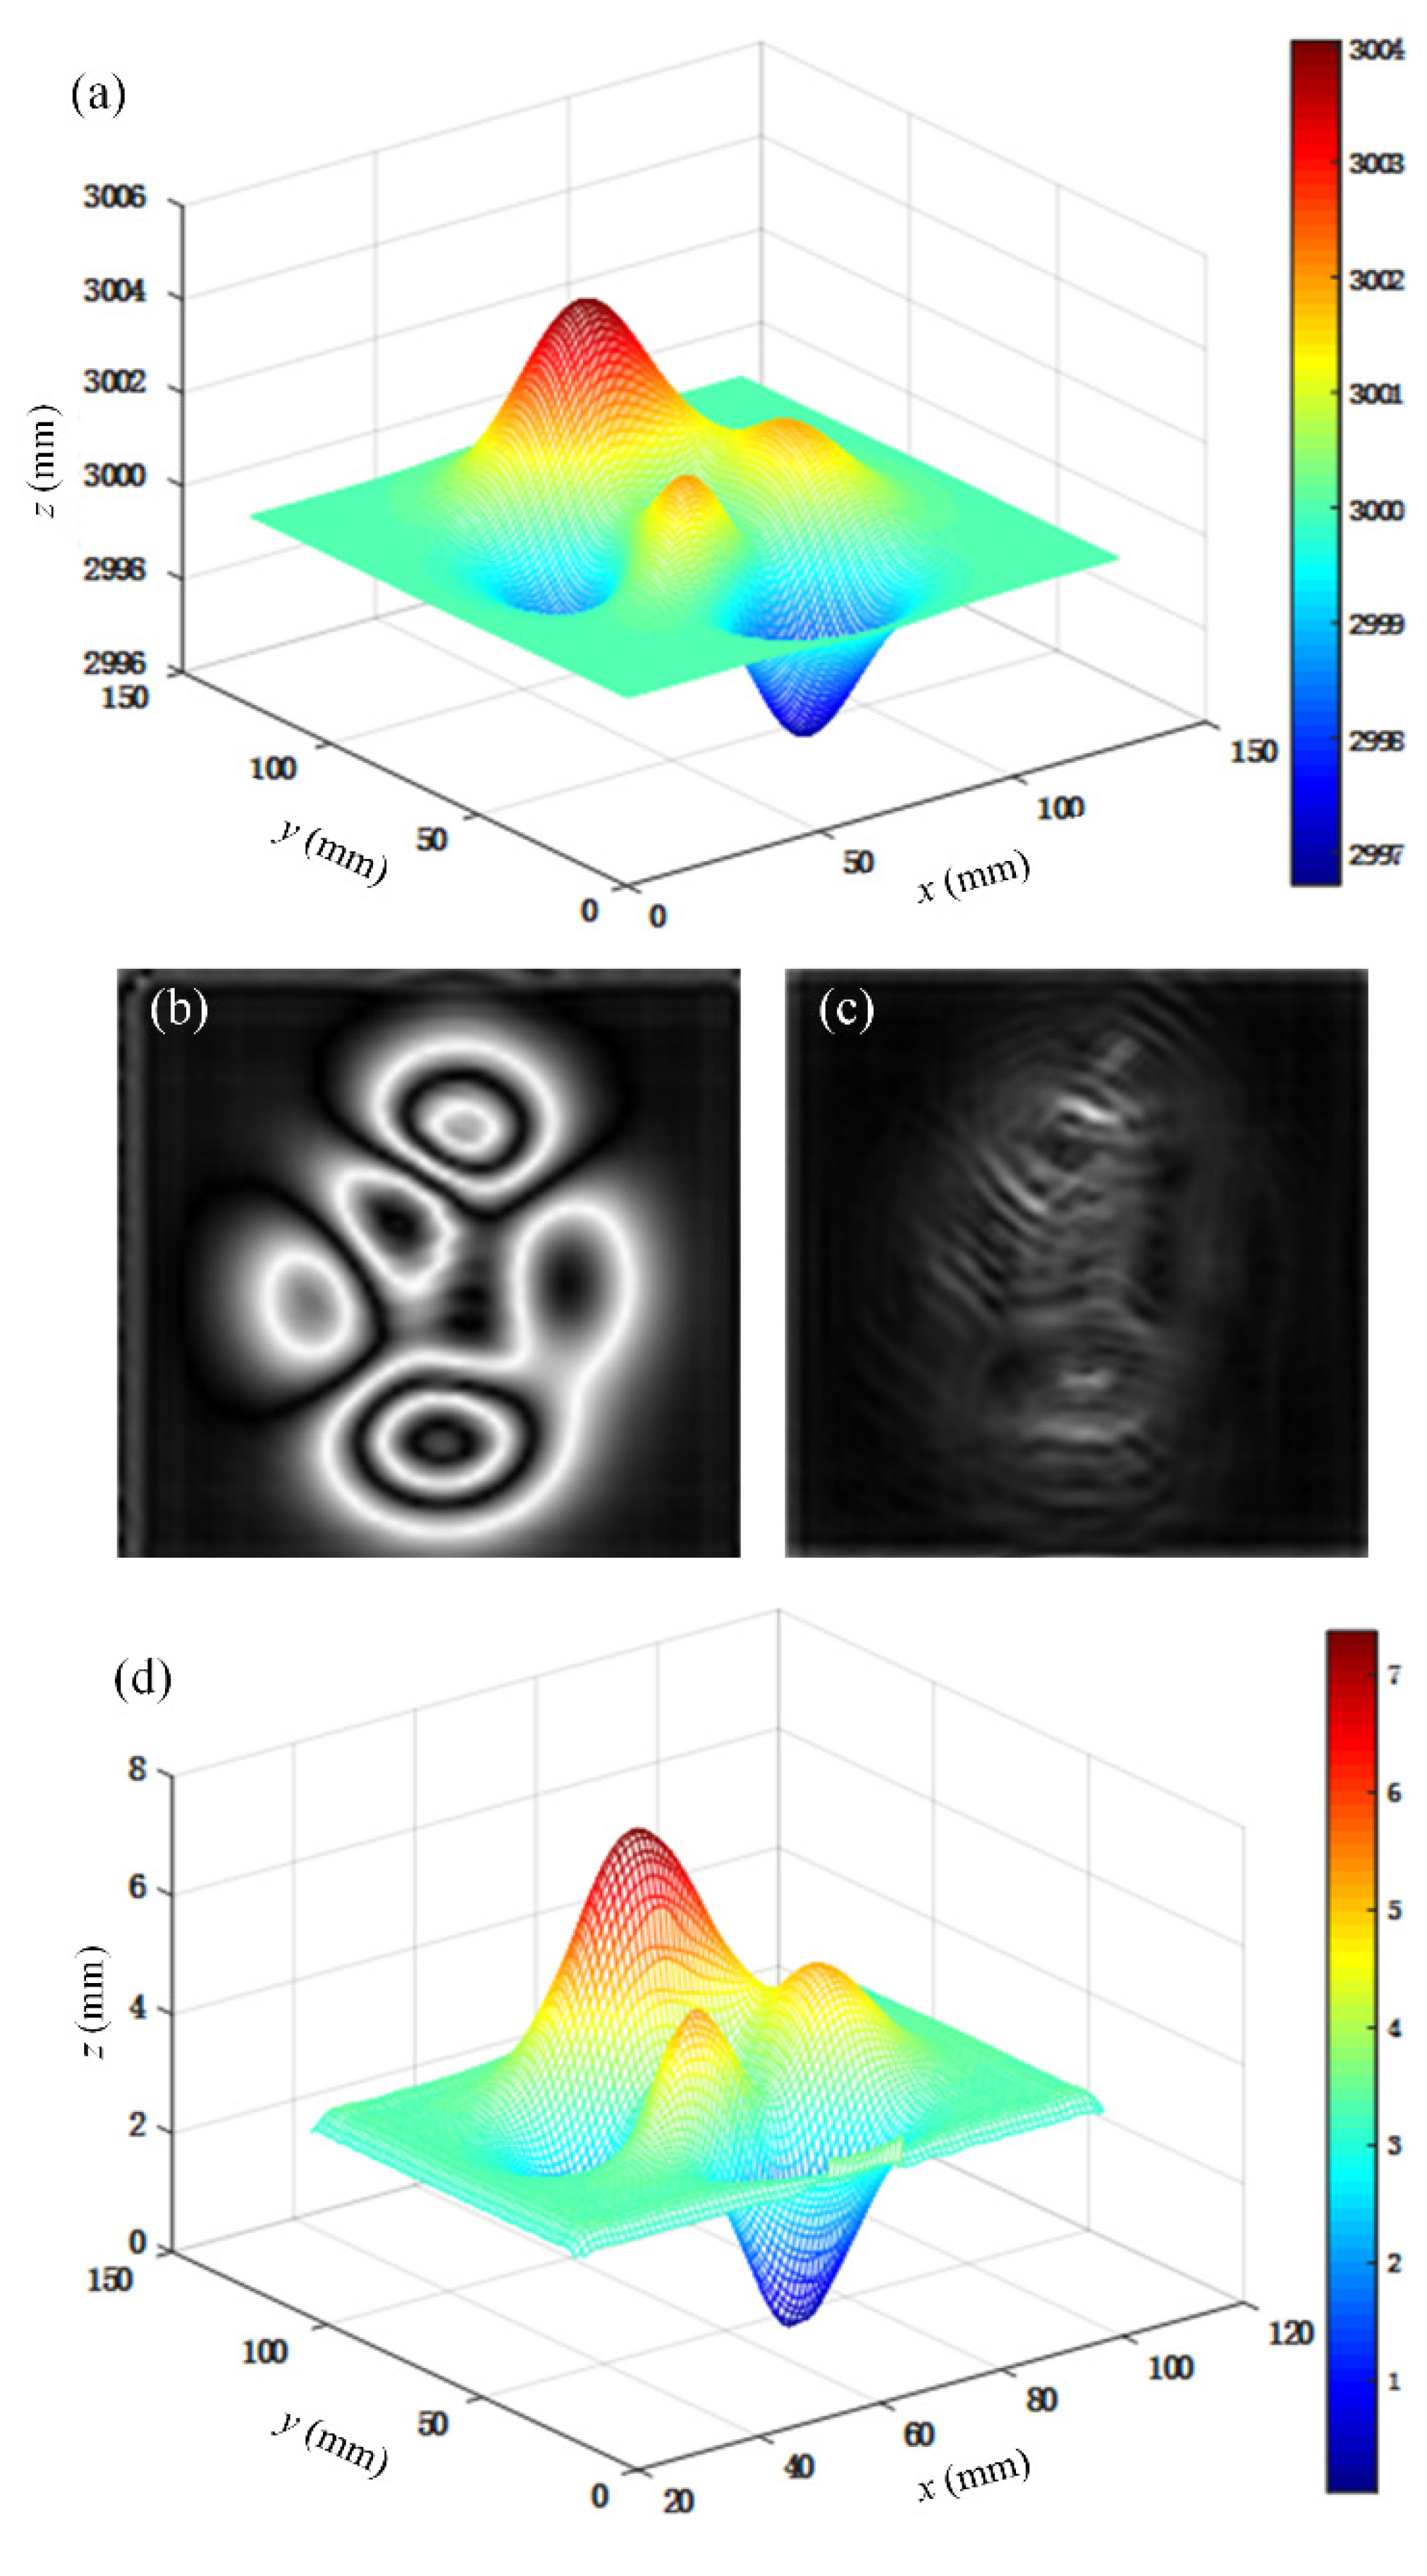
Next, a more complex three-dimensional model of distance distribution was used to replace the above planar model with the same pixel size of 128 × 128. Its distance distribution is shown in
Figure 5a. The wideband holographic data was obtained using the same experimental parameters as the above inclined plane model, and the 3D millimeter wave accurate reconstruction formula was then used to reconstruct it, which was the same as the inclined plane reconstruction. If only the 3D millimeter wave holographic algorithm were to be used to reconstruct the continuous range distribution, it would not be accurately restored. Therefore, the range-to-resolution improvement algorithm proposed in this paper was used. First, the phase diagram of the reconstructed image was calculated, and the phase diagram was then restored according to the phase quality diagram. The phase diagram and quality diagram of the reconstructed image are shown in
Figure 5b,c, and the reconstruction results obtained are shown in
Figure 5d.
From
Figure 5d, it can be seen that the algorithm proposed in this paper can also achieve the reconstruction of the range distribution of the 3D model with more complex range distribution. However, it can also be seen that there are some errors in the recovery where the phase changes rapidly. The phase unrolling algorithm is based on the continuity of the target, while the error of the reconstructed image mainly occurs in with abrupt change of distance. The drastic change of distance causes the change of phase, thus resulting in the phase error, which allows the original place with steep range distribution to be restored to a relatively smooth place. From the reconstruction results, the 3D millimeter wave reconstruction algorithm based on phase unwrapping can effectively improve the range direction resolution and achieve better 3D image reconstruction results.


