3.1. Basic Theory of the Impedance-Based System Stability Criterion
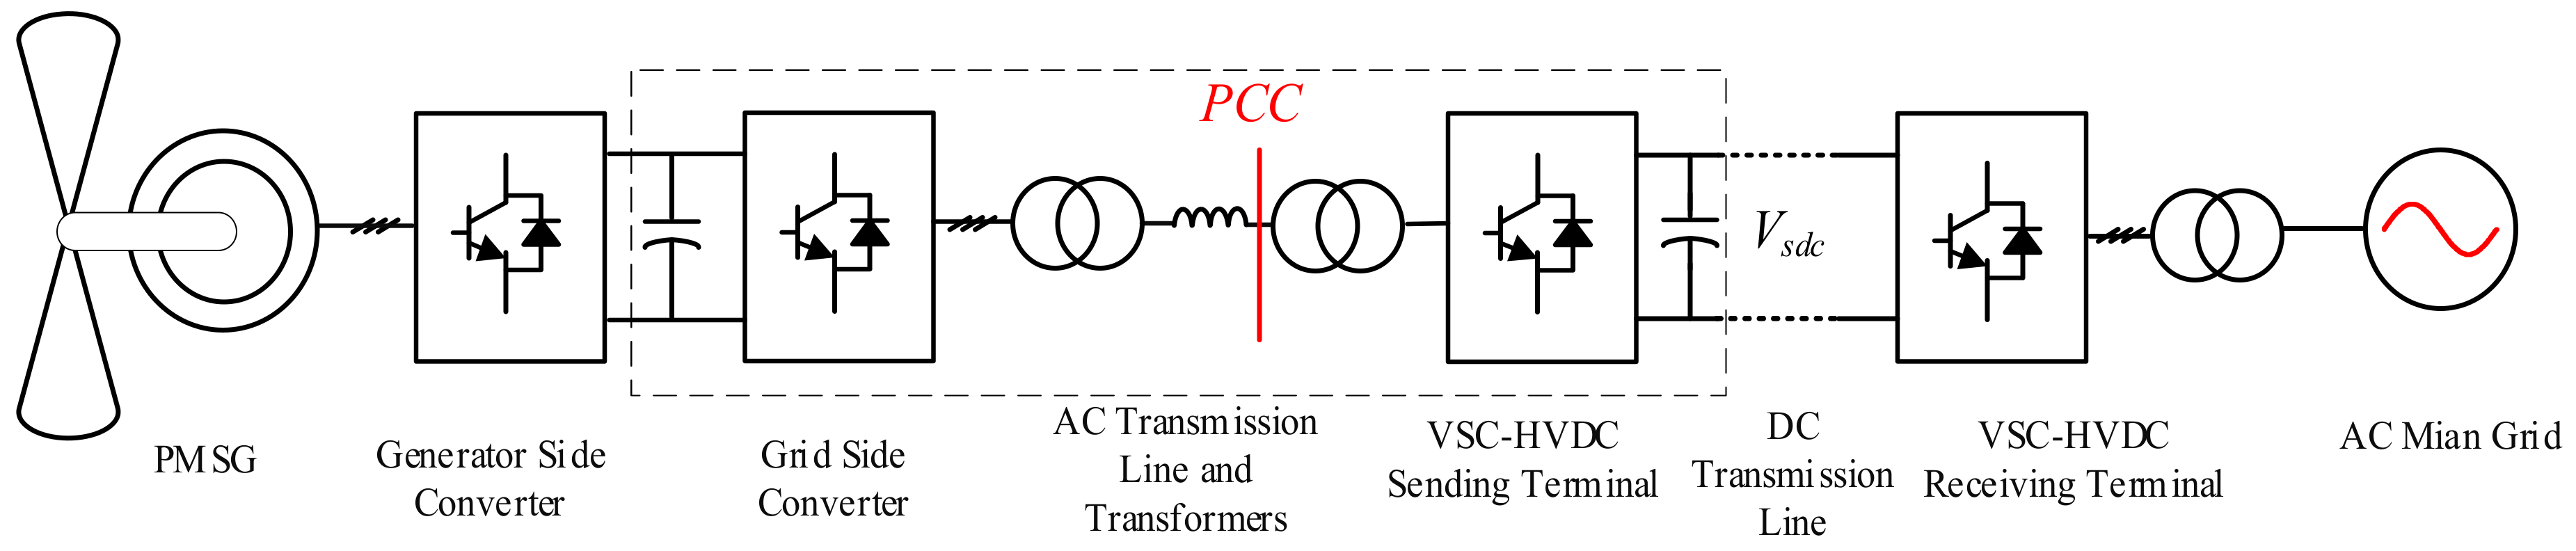
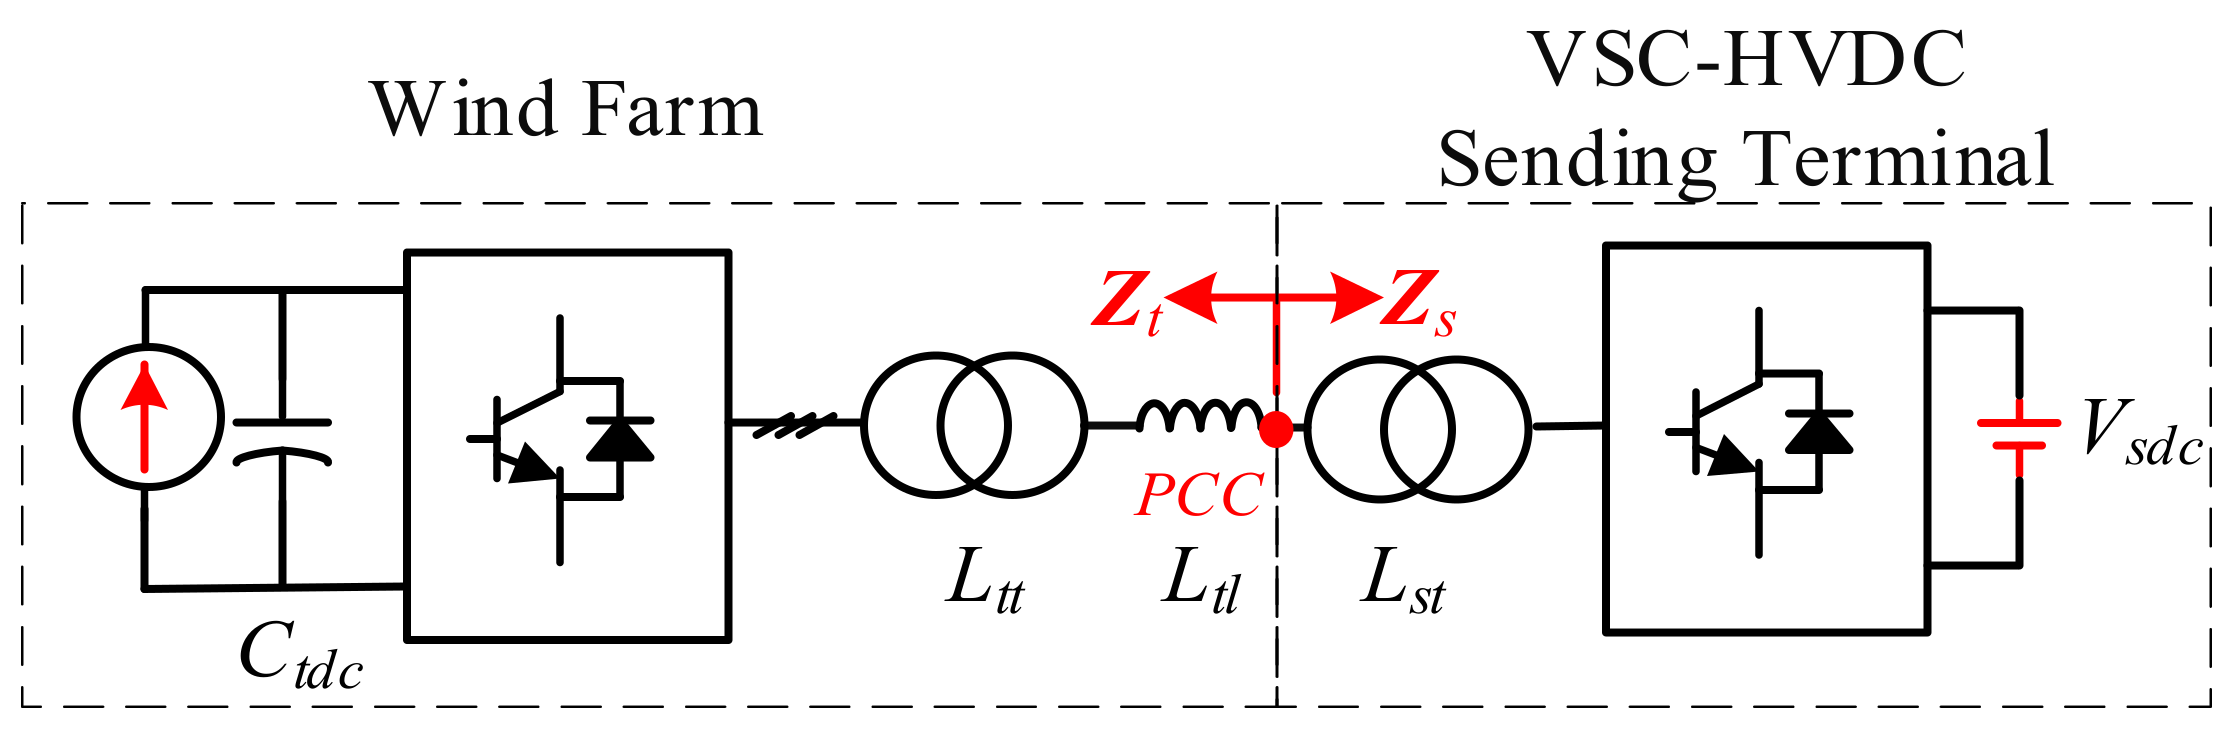
To employ the impedance stability criterion, the wind farm system with HVDC is divided into two interconnected parts by the PCC as shown in
Figure 7. The impedance of the HVDC sending terminal is given by
Zs and its transformer impedance is
Zst. Meanwhile,
Zt contains the impedance of the remaining parts that include wind grid side converters, step up transformer’s impedance
Ztt and AC transmission line impedance
Ztl. The expressions
Zs and
Zt are given by Equations (16) and (17), respectively.
The transformer ratios of the HVDC and wind converter sides are given by
Nst and
Ntt, respectively.
Nt is the number of grid-connected wind power grid side converters.
Both
Zs and
Zt are size 2 × 2 matrices, and the GNC can be used for system stability analysis. The minor loop gain of the equal feedback control system is given as:
which is also a 2 × 2 matrix. The minor loop gain matrix is defined as:
Generally,
G(s)H(s) is asymptotically stable if and only if the characteristic loci for the eigenvalues of
G(s)H(s),
λ1(s) and
λ2(s) taken together, do not encircle −1 for
s = jω, and −∞ <
ω < ∞ [
21], where:
If the off-diagonal elements
Zdq and
Zqd are relatively low in gain compared with the diagonal elements
Zdd and
Zqq, the eigenvalues of
G(s)H(s) can be simplified to an approximate form with negligible impact on the system stability analysis [
25,
26].
Because the Bode plots of Zdd and Zqq correspond to their Nyquist plot, the Bode criterion has the same function as the GNC, which will be explained later. Furthermore, the bode criterion can be used to easily observe individual magnitude and phase stability tendency. Therefore, the Bode criterion is used as the main system stability criterion.
Additionally, before using the impedance stability criterion, the two parts from the PPC shown in
Figure 7 should be individually stable. This requires the HVDC sending terminal to be stable when unloaded due to its voltage source working mode. Meanwhile, the wind power converter should be kept stable when connected to an ideal voltage source due to its current source working mode. All the cases in this study satisfied these two conditions.
3.2. Impedance Characters Analysis and Impact of Power Ratio on System Stability
To analyze the sub-/super-synchronous phenomenon by using the impedance criterion, detailed expression of
Zs and
Zt should be formulated. To apply the unity power factor control to wind power converters, the voltage and current in the
q-
axes are all considered to be equal to zero in the stable state. In addition, the wind grid side converter valve side voltage
utd and
utq can be replaced by the grid voltage and current in the
d-
axes as
utd = etd − Rtitd and
utq = −ωLtitd in the expression for the wind farm impedance in Equation (17). The off-diagonal elements in Equation (17) can also be neglected due to the unity power factor control [
17,
27,
28]. Therefore, the minor loop gain can be simplified to an approximate form as
λ1(s) =
Zsdd/Ztdd and
λ2(s) =
Zsqq/Ztqq. The PWM delay and the voltage and current sample delays can also be neglected due to their small impact on the frequency band this paper is concerned with.
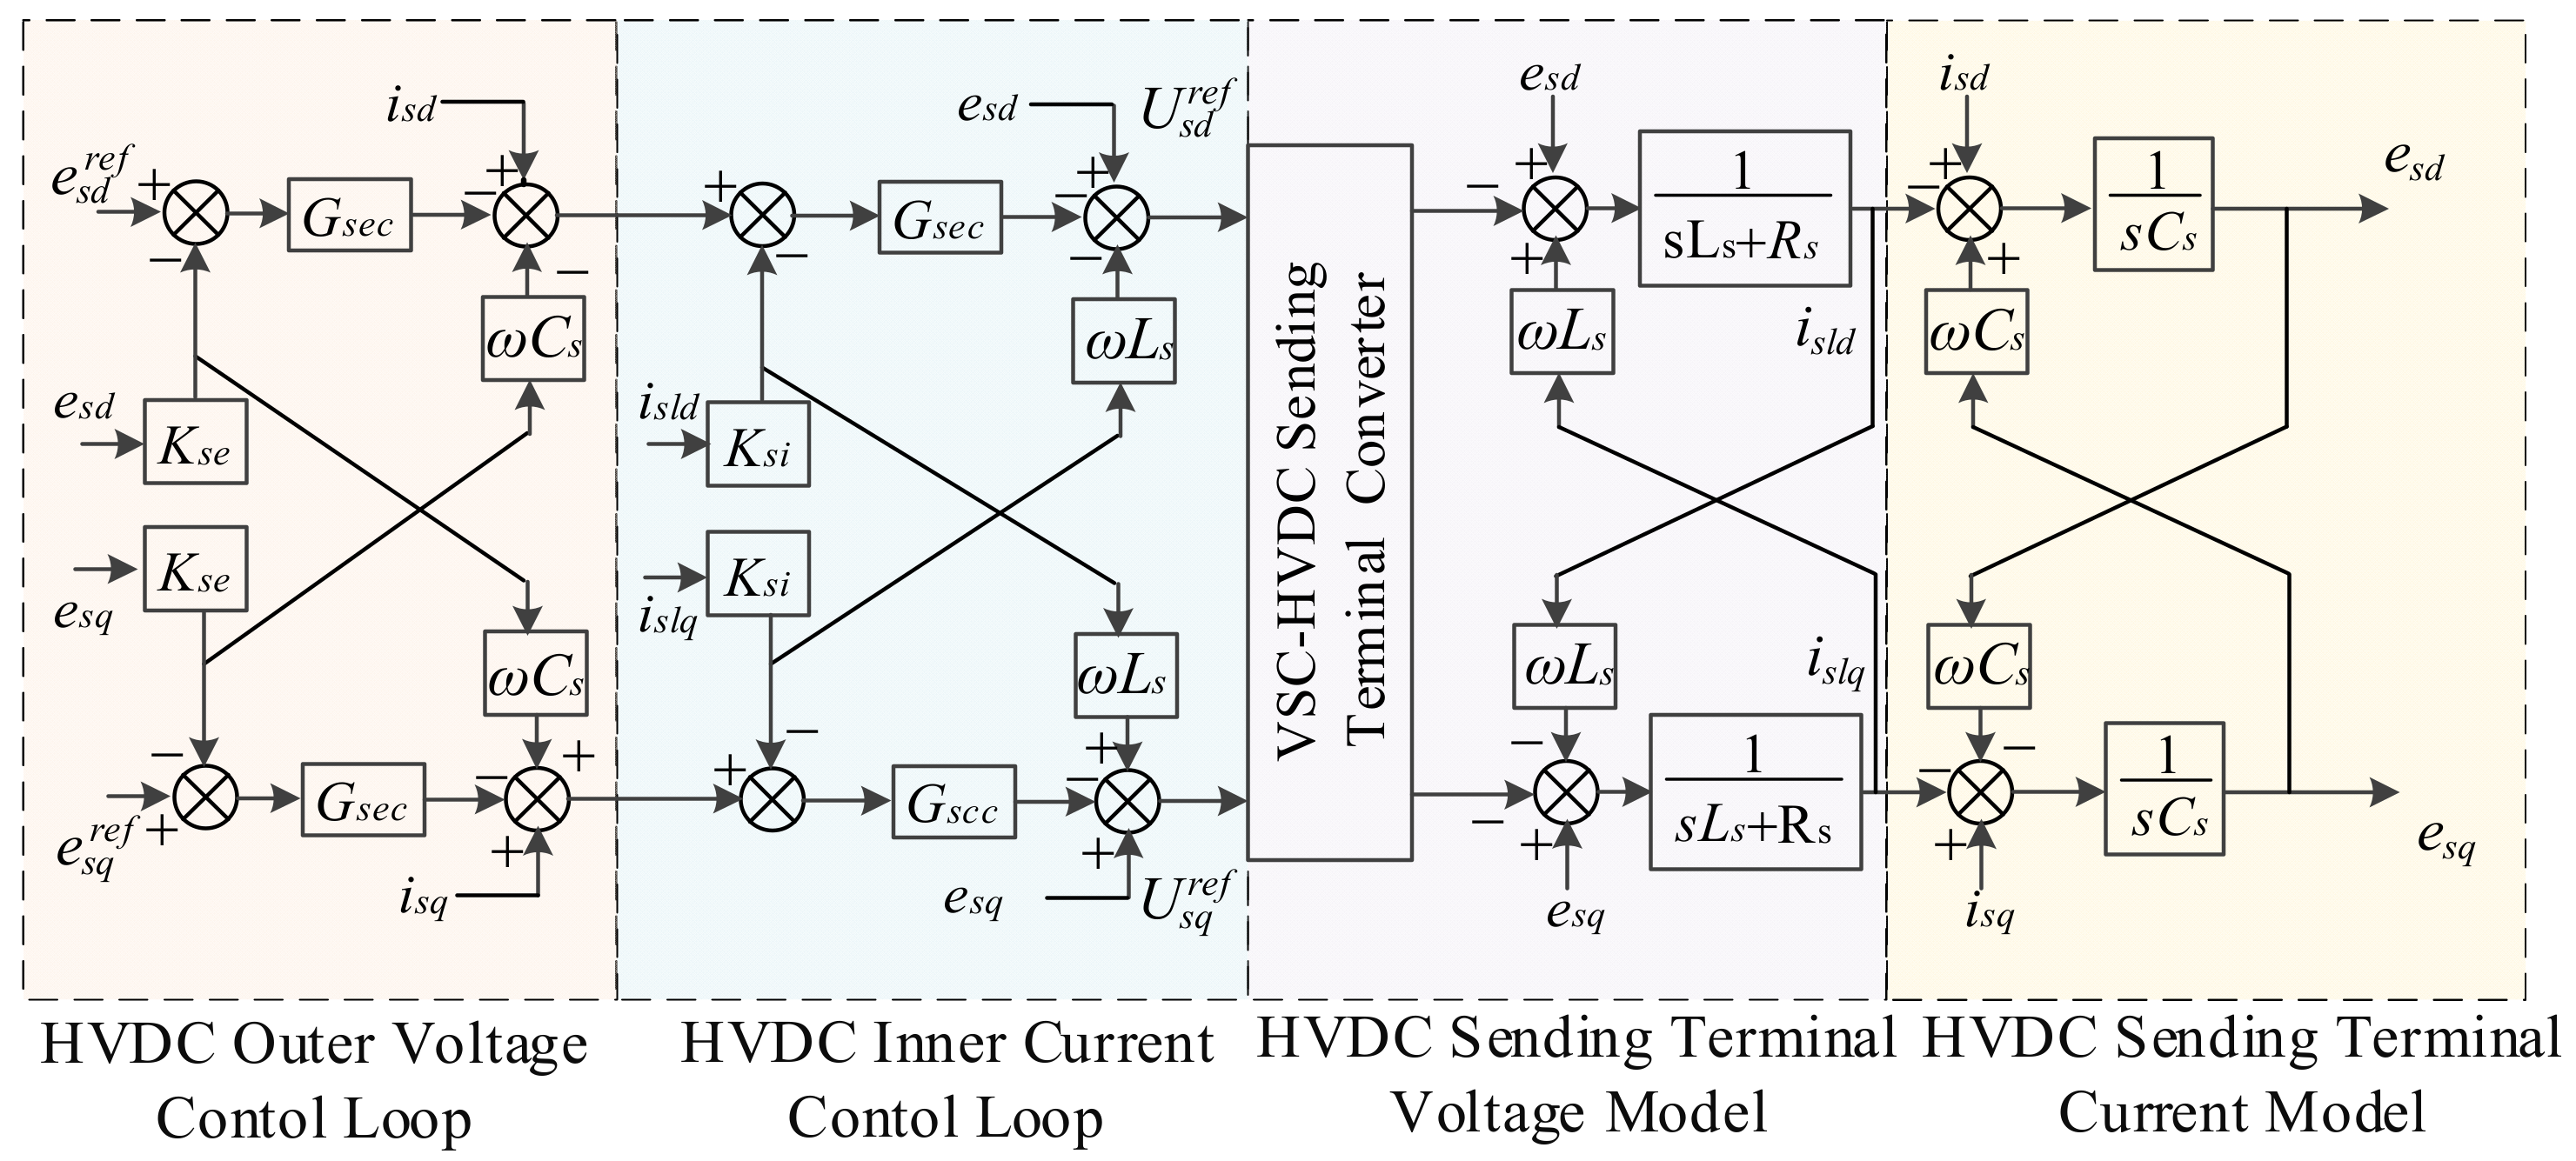
Based on the above conditions, the diagonal element expressions are given in Equations (18)–(20), where
Zsdd and
Zsqq represent HVDC sending terminal impedance on
d and
q-
axes, respectively,
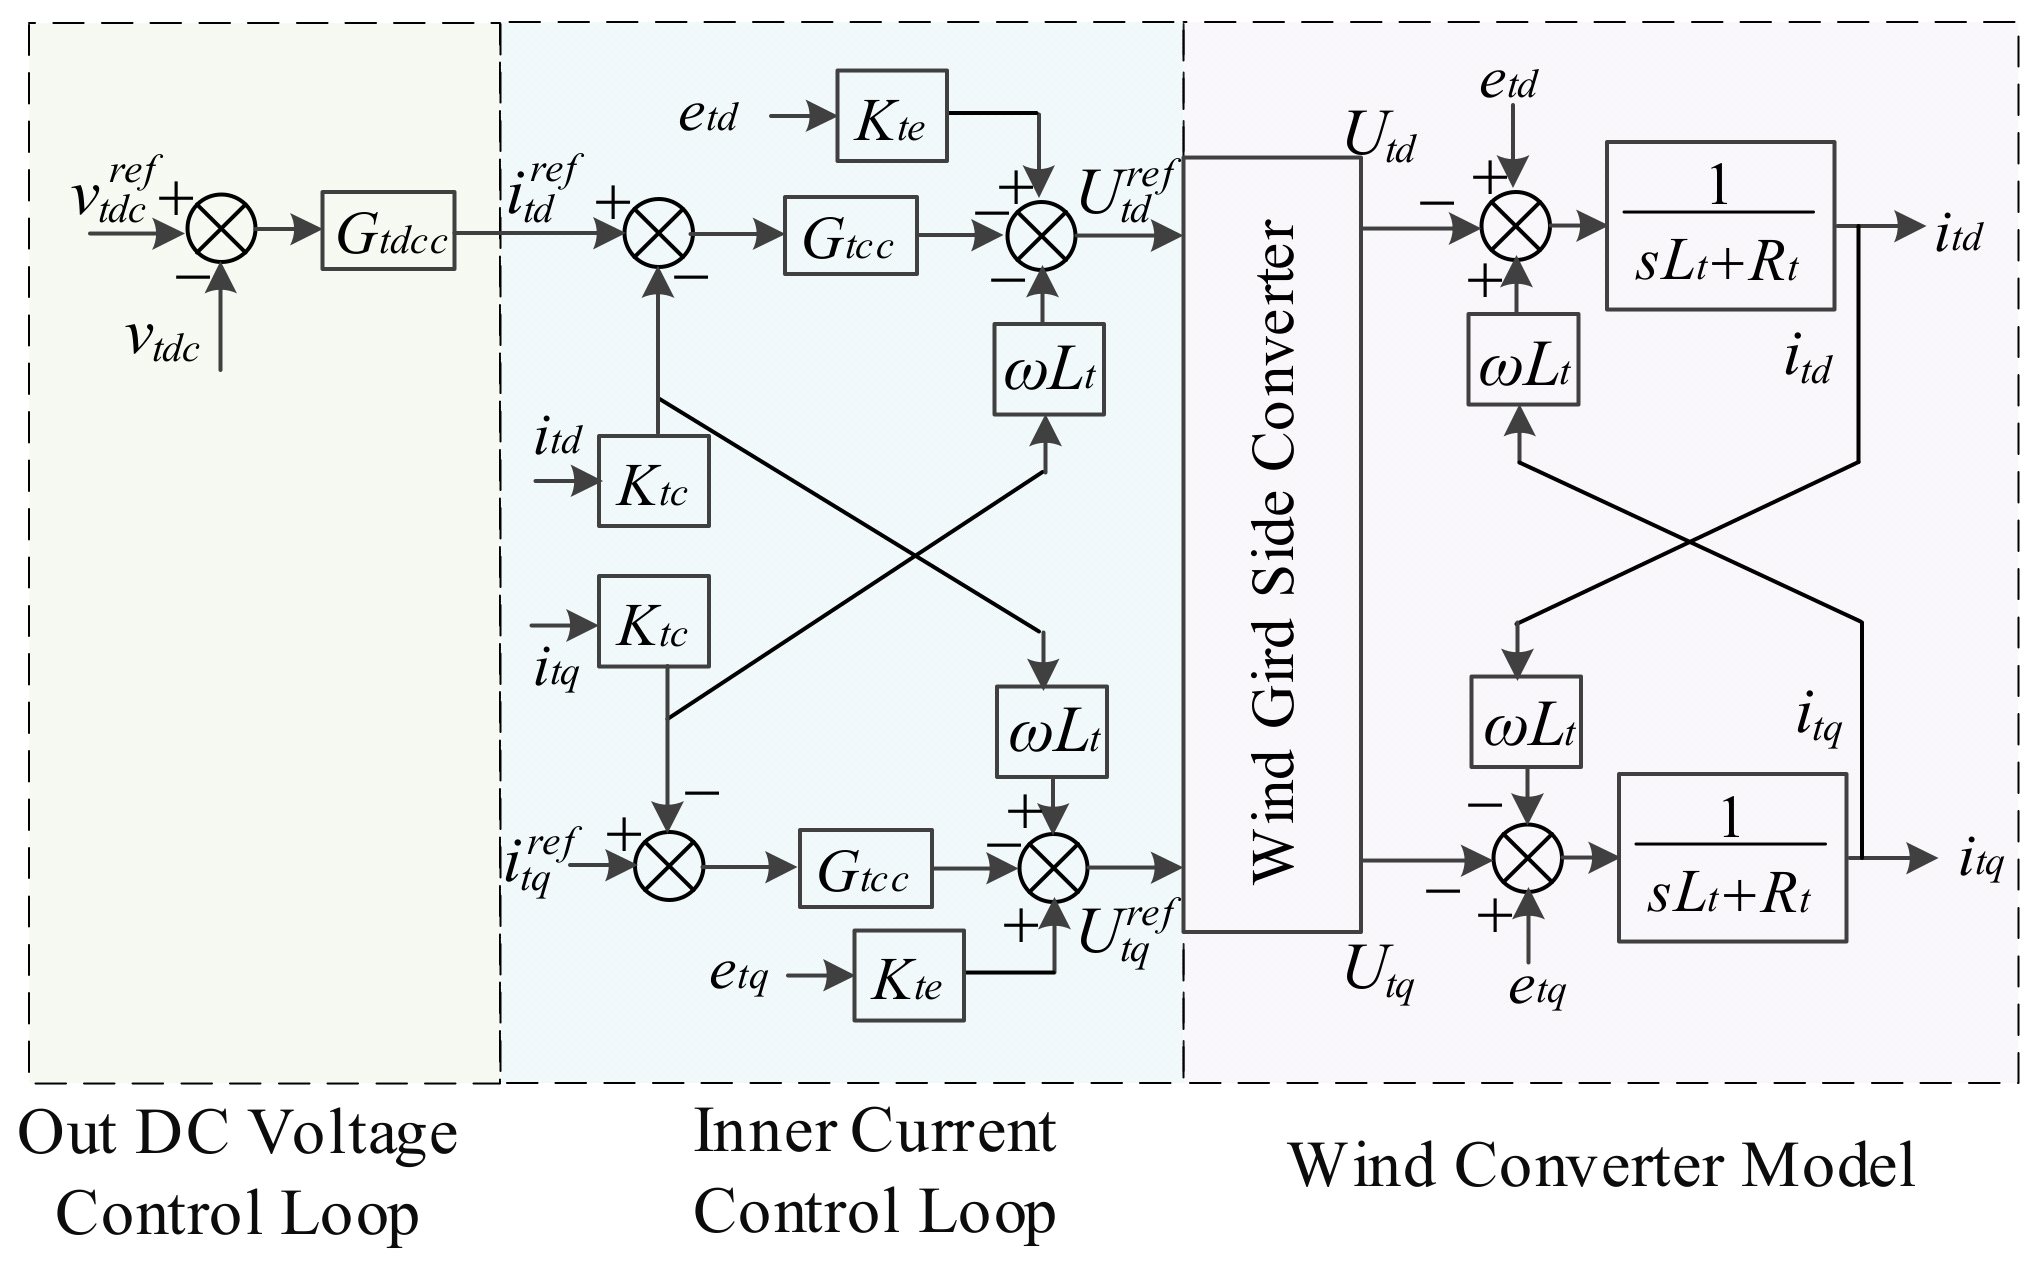
Ztdd and
Ztqq are the wind farm impedance in the
d and
q-
axes, respectively.
According to Equation (18), Zsdd is equal to Zsqq, because the HVDC sending terminal impedance does not contain coupling items and nonlinear parts such as PLL. Both Zsdd and Zsqq are independent of stable state points such as voltage and current. On the other hand, the inner current controller Gscc, outer AC voltage controller Gsec and LCL-filter parameters influence the HVDC impedance.
In contrast, according to Equations (19) and (20), the wind farm impedance Zsdd and Zsqq depend on stable state points such as etd, itd and vtdc. Both Ztdd and Ztqq include the inner current controller Gtcc and L filter parameters. Moreover, the Ztdd contains the DC voltage controller Gtdc because the DC voltage controller acts only on the d-axes, while Ztqq has the PLL Gtpll for it acts only on the q-axes.
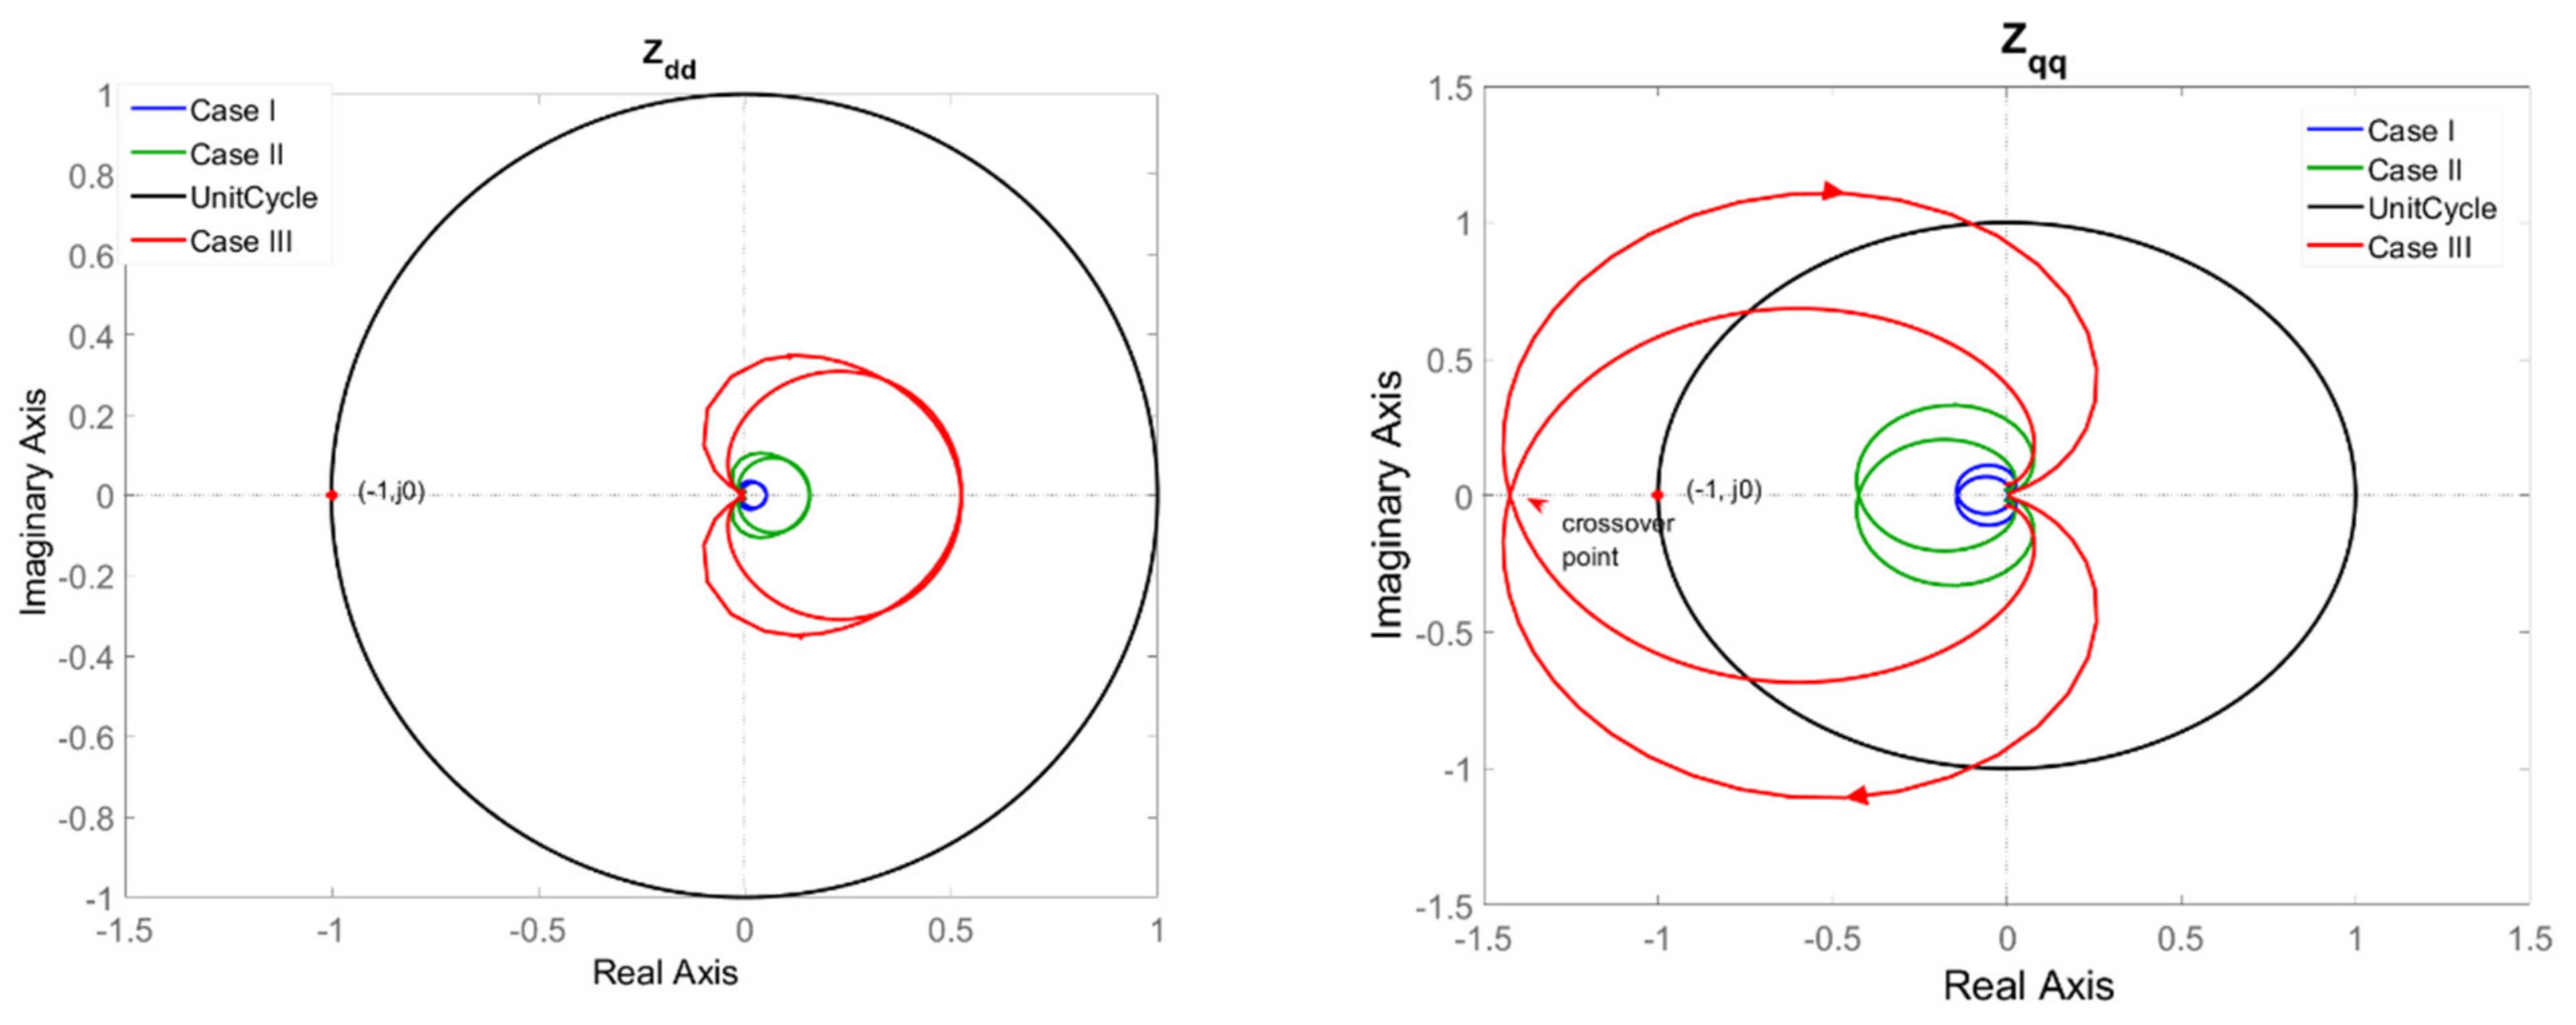
Figure 8 shows the
Zdd and
Zqq Nyquist plot of the HVDC and wind farm impedance interaction in increasing power ratios based on the system parameters in
Table 1. Case I, Case II and Case III represent impedance based on a power ratio of 0.1 pu, 0.6 pu and 2 pu. For
Zdd, the three curves close in but are still far away from encircling the point (−1,j0), which means
Zdd is stable under these power ratios conditions. On the contrary, for
Zqq, the curves close in and finally in Case III the curve encircles the point (−1,j0) clockwise. Therefore,
Zqq is unstable under the highest power ratio. According to the GNC, the system is unstable if either
Zdd or
Zqq satisfies the instability criterion.
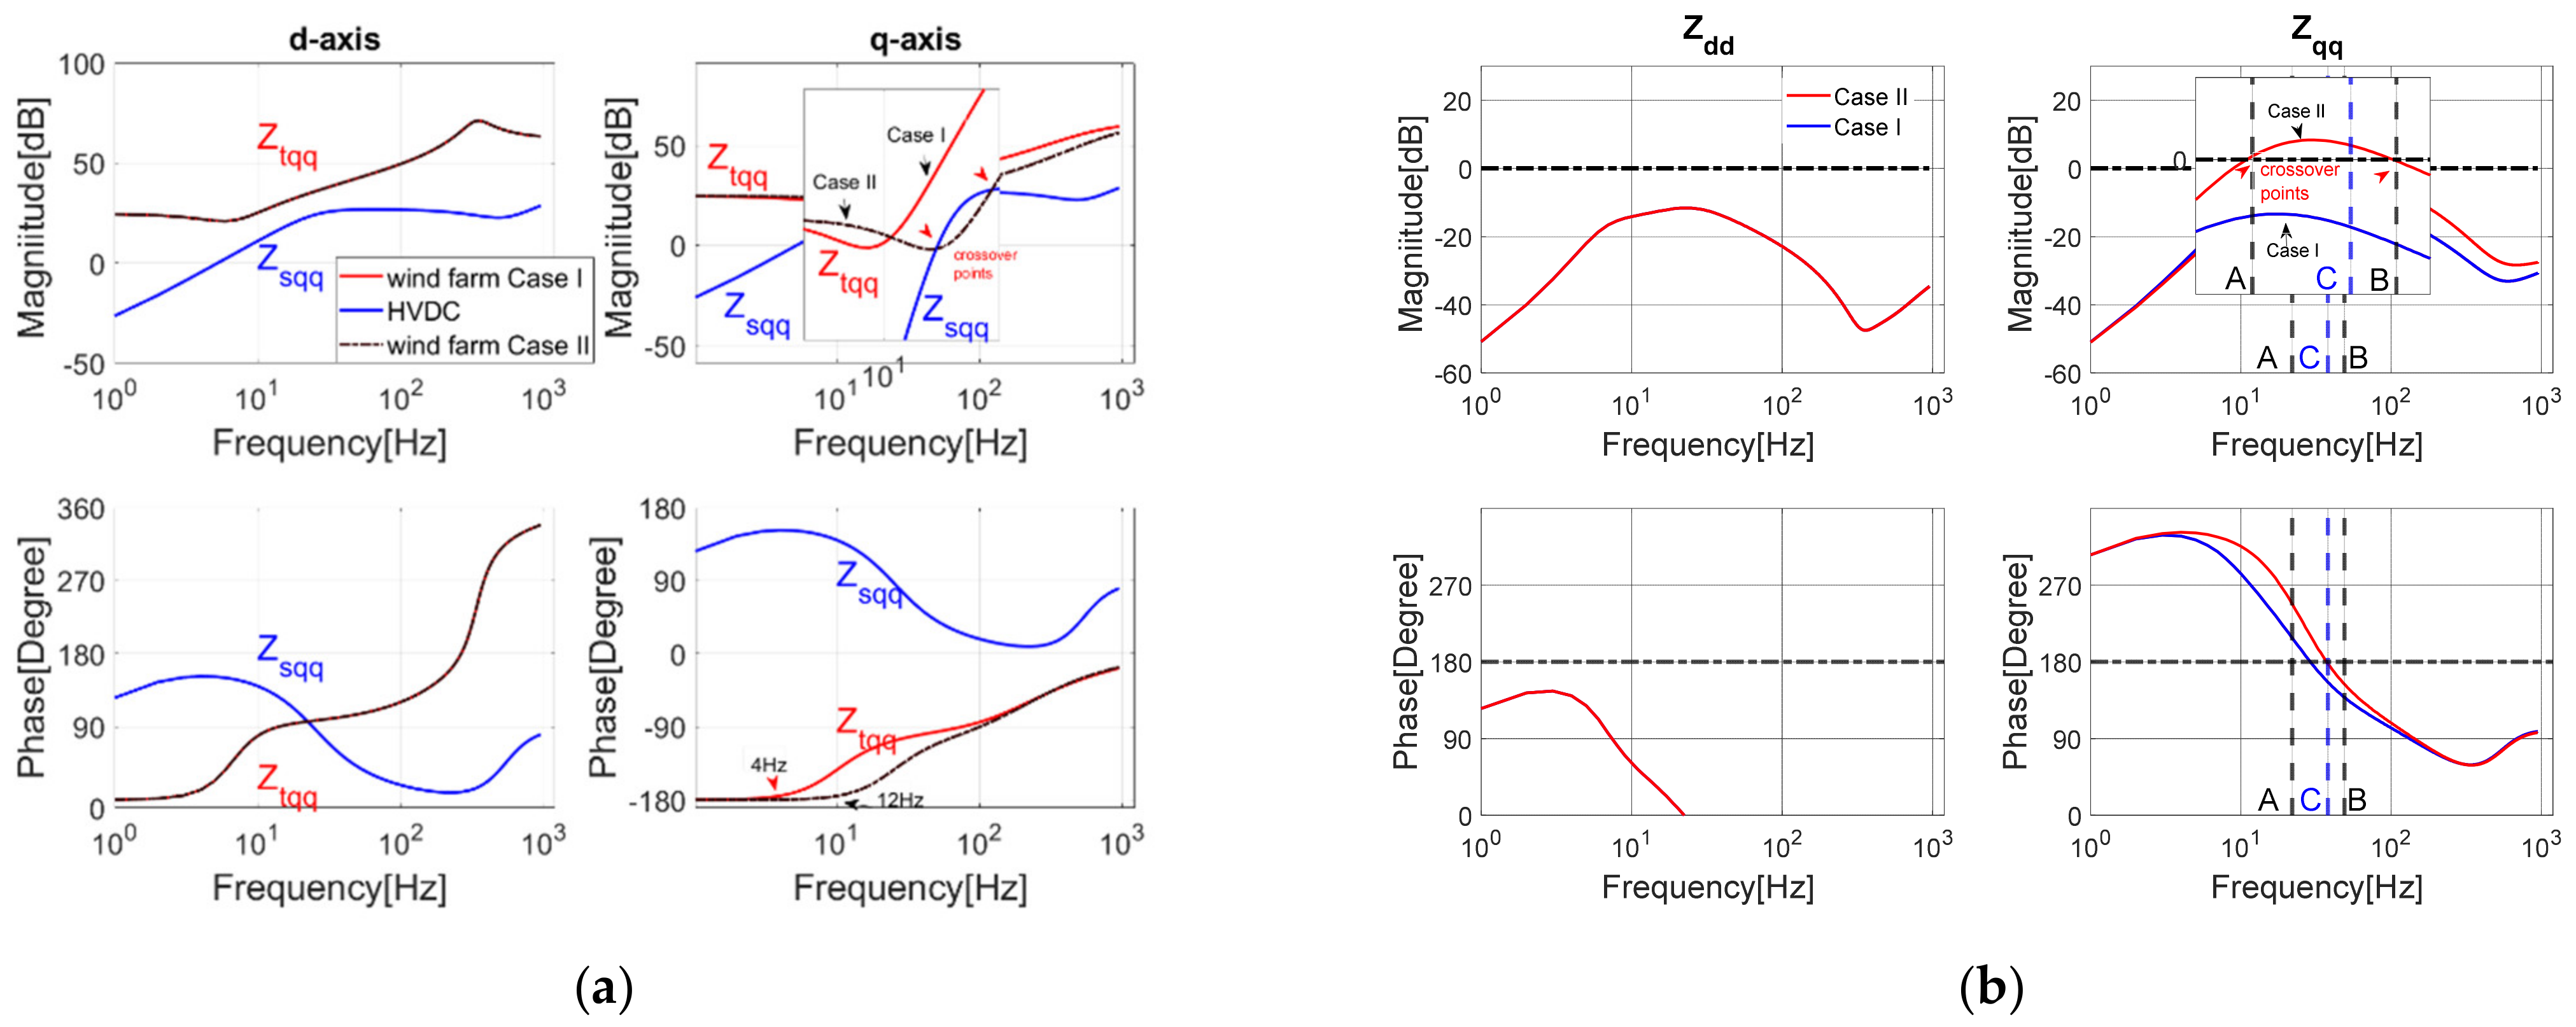
Figure 9a shows the corresponding Bode plots, which show that as the active current
itd increases, the HVDC impedance
Zsdd,sqq remains the same due to the independence of
itd. Meanwhile, the magnitude of wind farm impedance (
Ztdd and
Ztqq) decreases, as shown by the arrow. The
Ztqq in Case III reaches and crosses
Zsqq within 100 Hz. This tendency can be inferred by Equations (19) and (20), in which the active current
itd is the denominator of
Ztdd and
Ztqq.
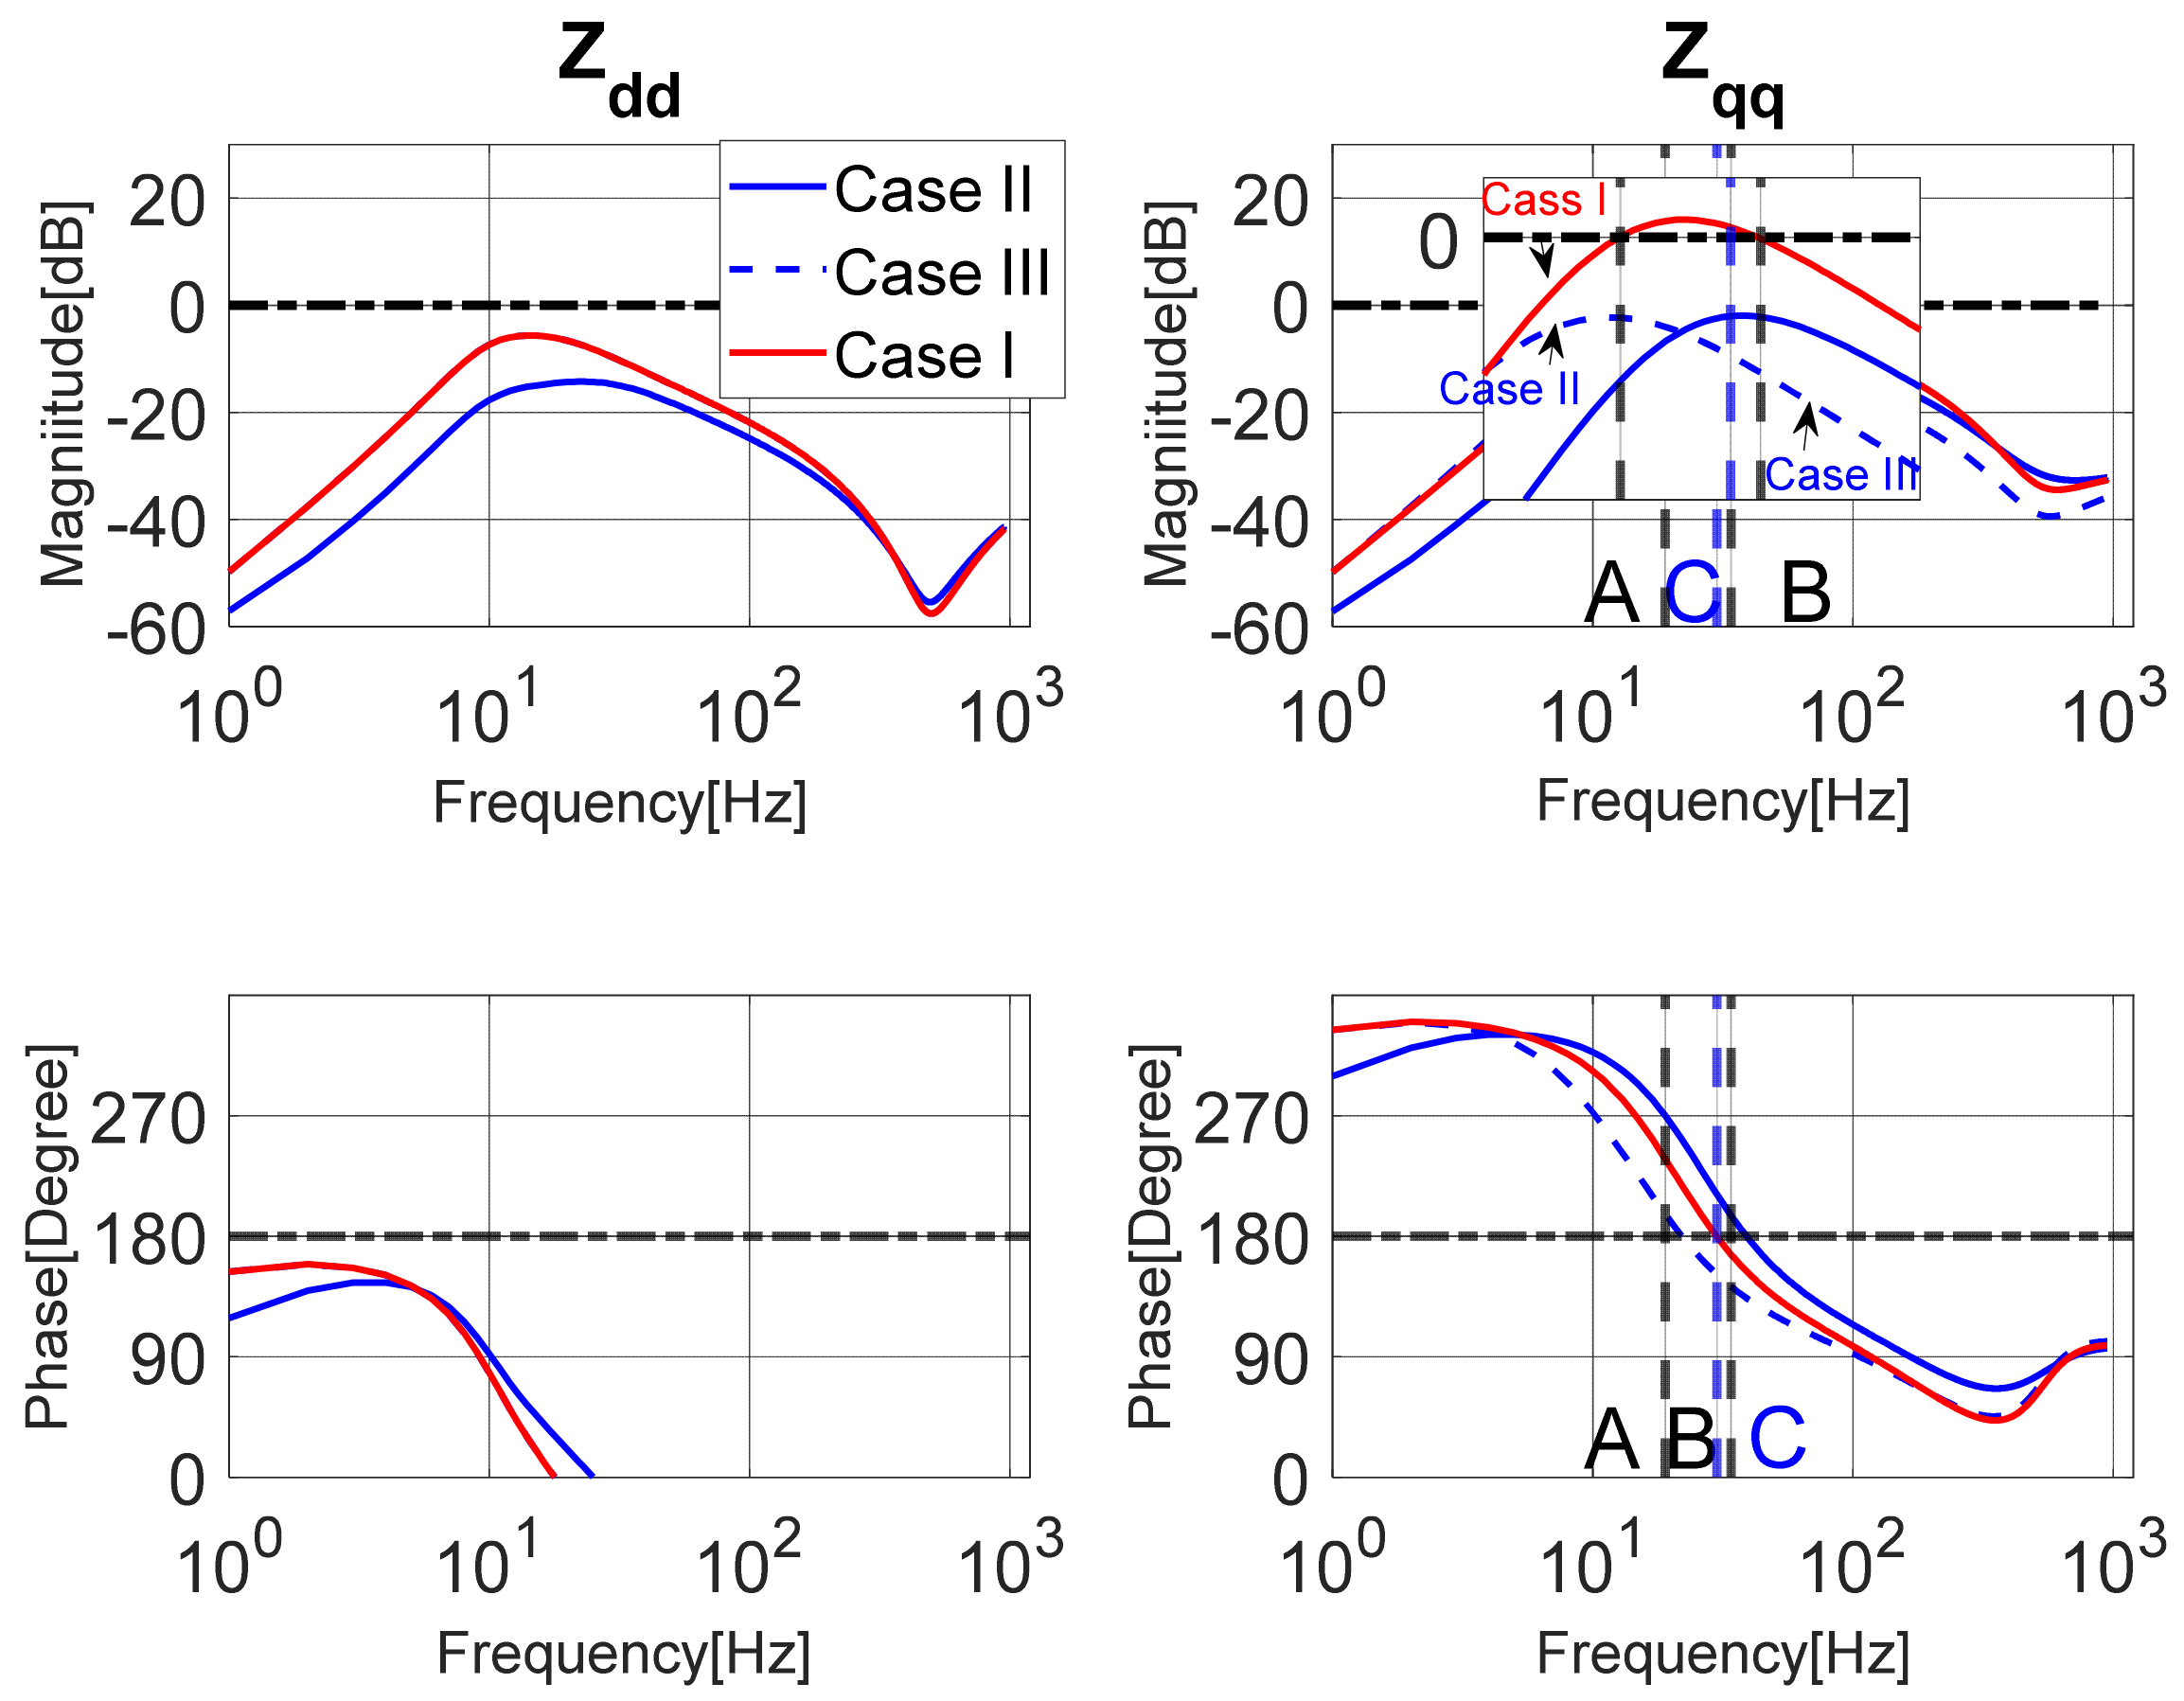
The magnitude and phase change trends are demonstrated in the Bode plots of
Zdd and
Zqq in
Figure 9b. The power ratios have small impact on the phases of
Zdd and
Zqq. The
Zdd phases cross at π on the frequency marked ‘C’. The
Zqq magnitudes for Cases I and II have no crossover at 0 dB. Case III goes up to 0 dB at frequency A and then down to 0 dB on frequency B. If the frequency C is between A and B,
Zqq is unstable for Case III. This is the application of the Bode criterion, which corresponds to encircling the point (−1,j0) in
Figure 8. On the other hand, the magnitudes of
Zdd have no crossover point, which demonstrates their stability.
The above discussion shows that the crossover points of magnitude are necessary for system instability, which is also the key reason for the sub/sup-SCI between the HVDC and wind farm system. To increase system stability, it is reasonable to avoid the crossover points by increasing the magnitudes of Ztdd and Ztqq, and decreasing those of Zsdd and Zsqq in the low range frequency.
Based on Equations (19) and (20), the number of grid-connected wind grid side converters Nt has an impact on the magnitude of wind farm impedance that is similar to that of the power ratio. It is obvious that the worst-case scenario occurs when the whole wind farm delivers its rated power. The following analysis will be based on this extreme condition.
3.3. Impact of Line Impedance on System Stability
To analyze the line impedance impact on the system stability, Ztdd and Ztqq are studied without line impedance and with 100 mH line impedance.
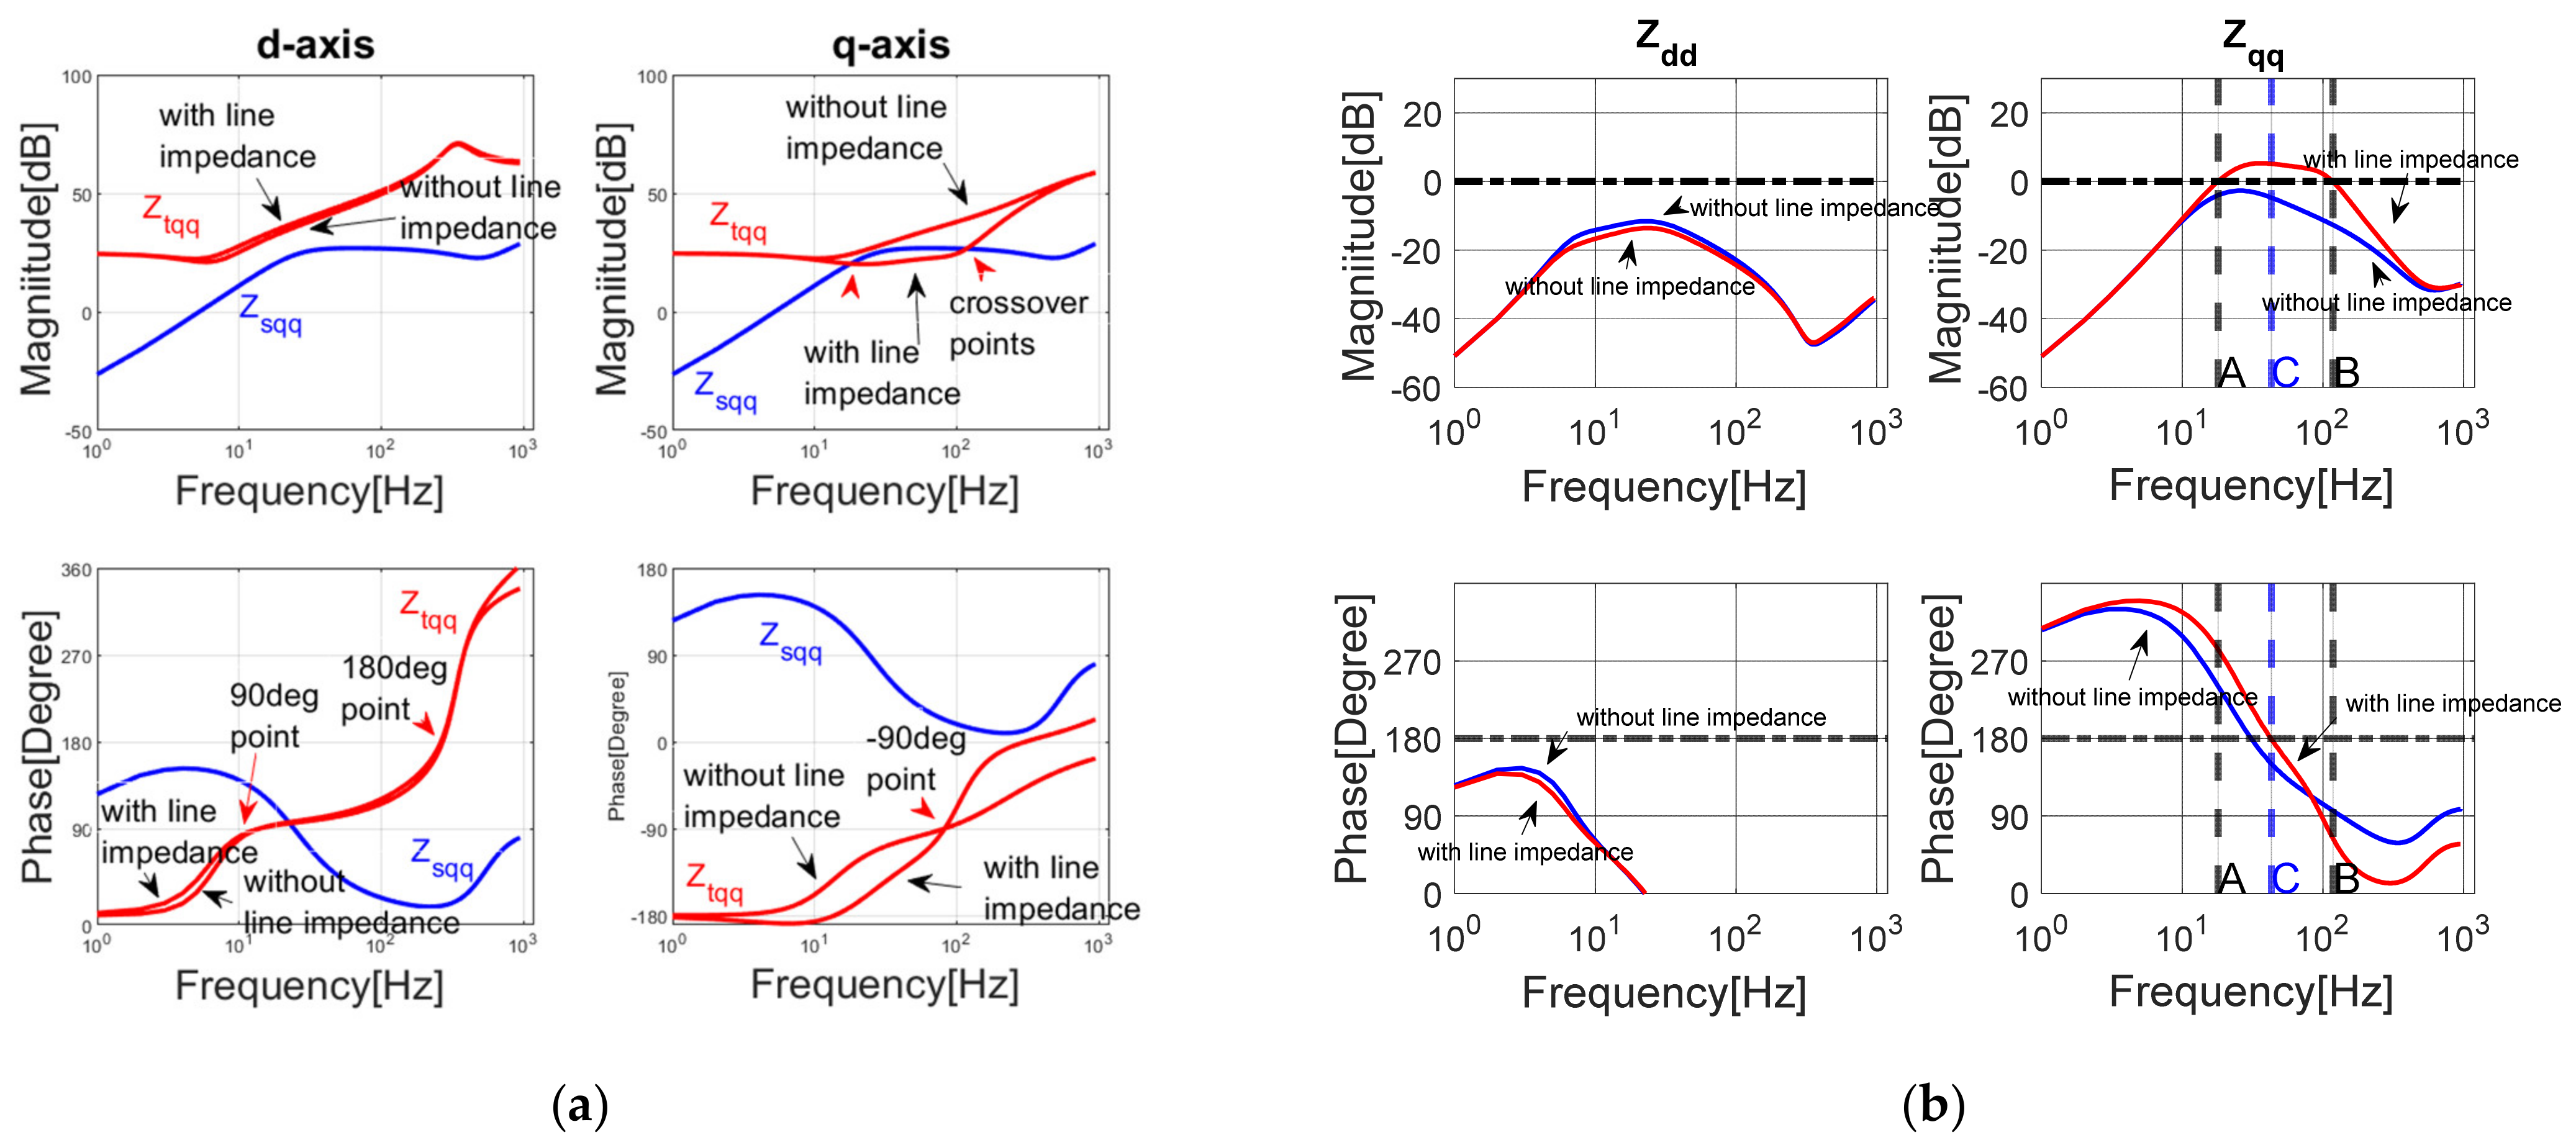
The HVDC and wind farm impedance interactions without and with line impedance are shown in
Figure 10a. The phase part of
Ztdd shows that it is a positive resistive-inductive load for very low frequency range (between 0 Hz and about 30 Hz), as the phase is between 0 and 90 degrees. Between 30 Hz and about 310 Hz, the
Ztdd impedance is a negative resistive-inductive load, when its phase is between π/2 and π. This is the main phase characteristic of
Ztdd in the frequency domain.
As the inductive line impedance is added, the magnitudes of
Ztdd increase for frequencies between 0 Hz and around 310 Hz, as shown in
Figure 10a. This increases the magnitude difference between the HVDC and wind farm on the
d-
axes and eliminates the possibilities of crossover. Based on the previous system stability analysis, the increased line impedance decreased the risk of
Ztdd instability.
On the contrary, the Ztqq impedance has a negative resistive-capacitive load when the frequency is between 0 Hz and around 30 Hz, with its phase between −π and −π/2. The impedance turns to a positive resistive-capacitive load for frequencies between 30 Hz and more than 100 Hz. Consequently, the amplitude of Ztqq decreases with the added line inductance impedance. This increased the possibility of HVDC and wind farm magnitude crossover points. Based on the previous system stability analysis, it can be stated that the line impedance increases the risk of Ztqq instability. As the Bode plots of interactions in the q-axes show, with the 100 mH line impedance, the magnitude of wind farm has crossover points with the HVDC magnitude, which will lead to system stability.
Figure 10b shows the Bode plots of
Zdd and
Zqq considering line impedance.
Zdd magnitudes do not have crossover points with the 0 dB line, which indicates their stability. Meanwhile, the line impedance causes crossover points for
Zqq magnitude with 0 dB. With the phase conditions and based on the Bode criterion mentioned previously,
Zqq with line impedance is unstable. This proves theoretically that a certain line impedance can cause system instability.
3.4. Impact of Control Loop Bandwidths on Stability
According to the previous interpretation, the impedance models contain PI controllers, which are designed by considering control loop bandwidth and the damping ratio (set to 0.707). Therefore, it is more reasonable to investigate the relationship between system stability and control loop bandwidths, rather than the individual proportional or integral coefficients.
The controllers can be redefined as follows, by replacing the proportional and integral coefficients by their bandwidth for each PI controller in Equations (3)–(5), and (7)–(14) where the defined damping ratios are equal to 0.707.
It is more specific to study the impact of bandwidth on stability by inserting these controllers into Equations (18)–(20) and obtaining Equations (21)–(23) below:
3.4.1. Impact of HVDC Controller Loop Bandwidths
Due to the inner and outer control loops design principle, the bandwidth of the inner current control loop should be set as 10 times that of the outer AC voltage control loop. Therefore, it is logical to keep the relationship between the two bandwidths fixed when discussing the impact of bandwidths on impedance.
From Equation (21), it is clear that the highest orders of the current control loop bandwidth ωscc and the AC voltage control loop bandwidth ωsec in the denominator are two and four, respectively, which are double those in their respective numerators. This signifies that the reduction in ωscc and ωsec will increase Bode plots magnitudes, which raises the stability risk.
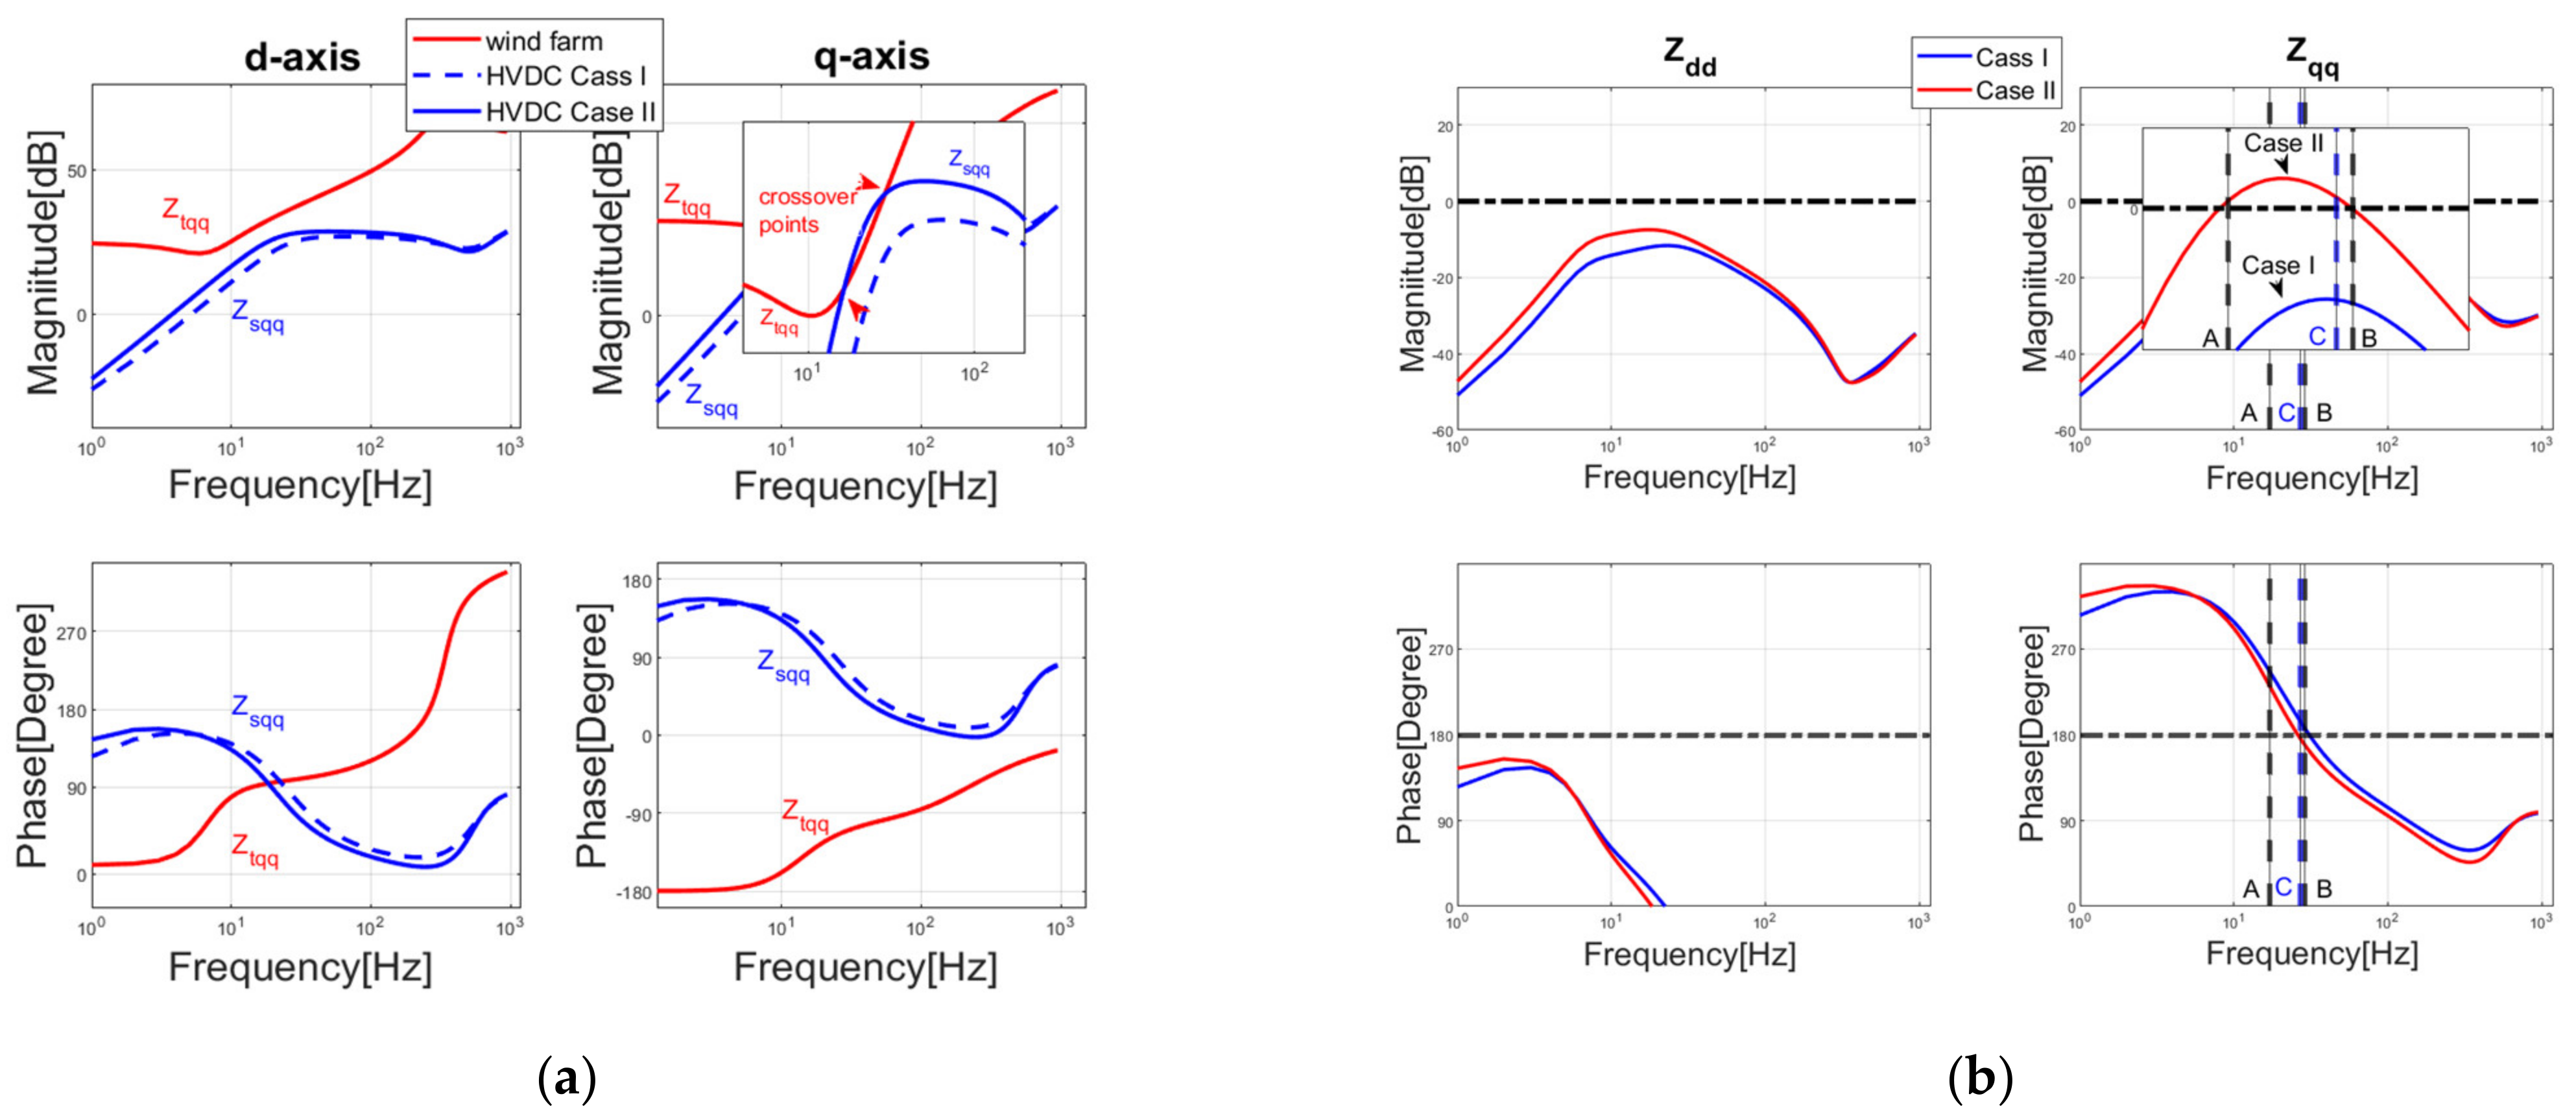
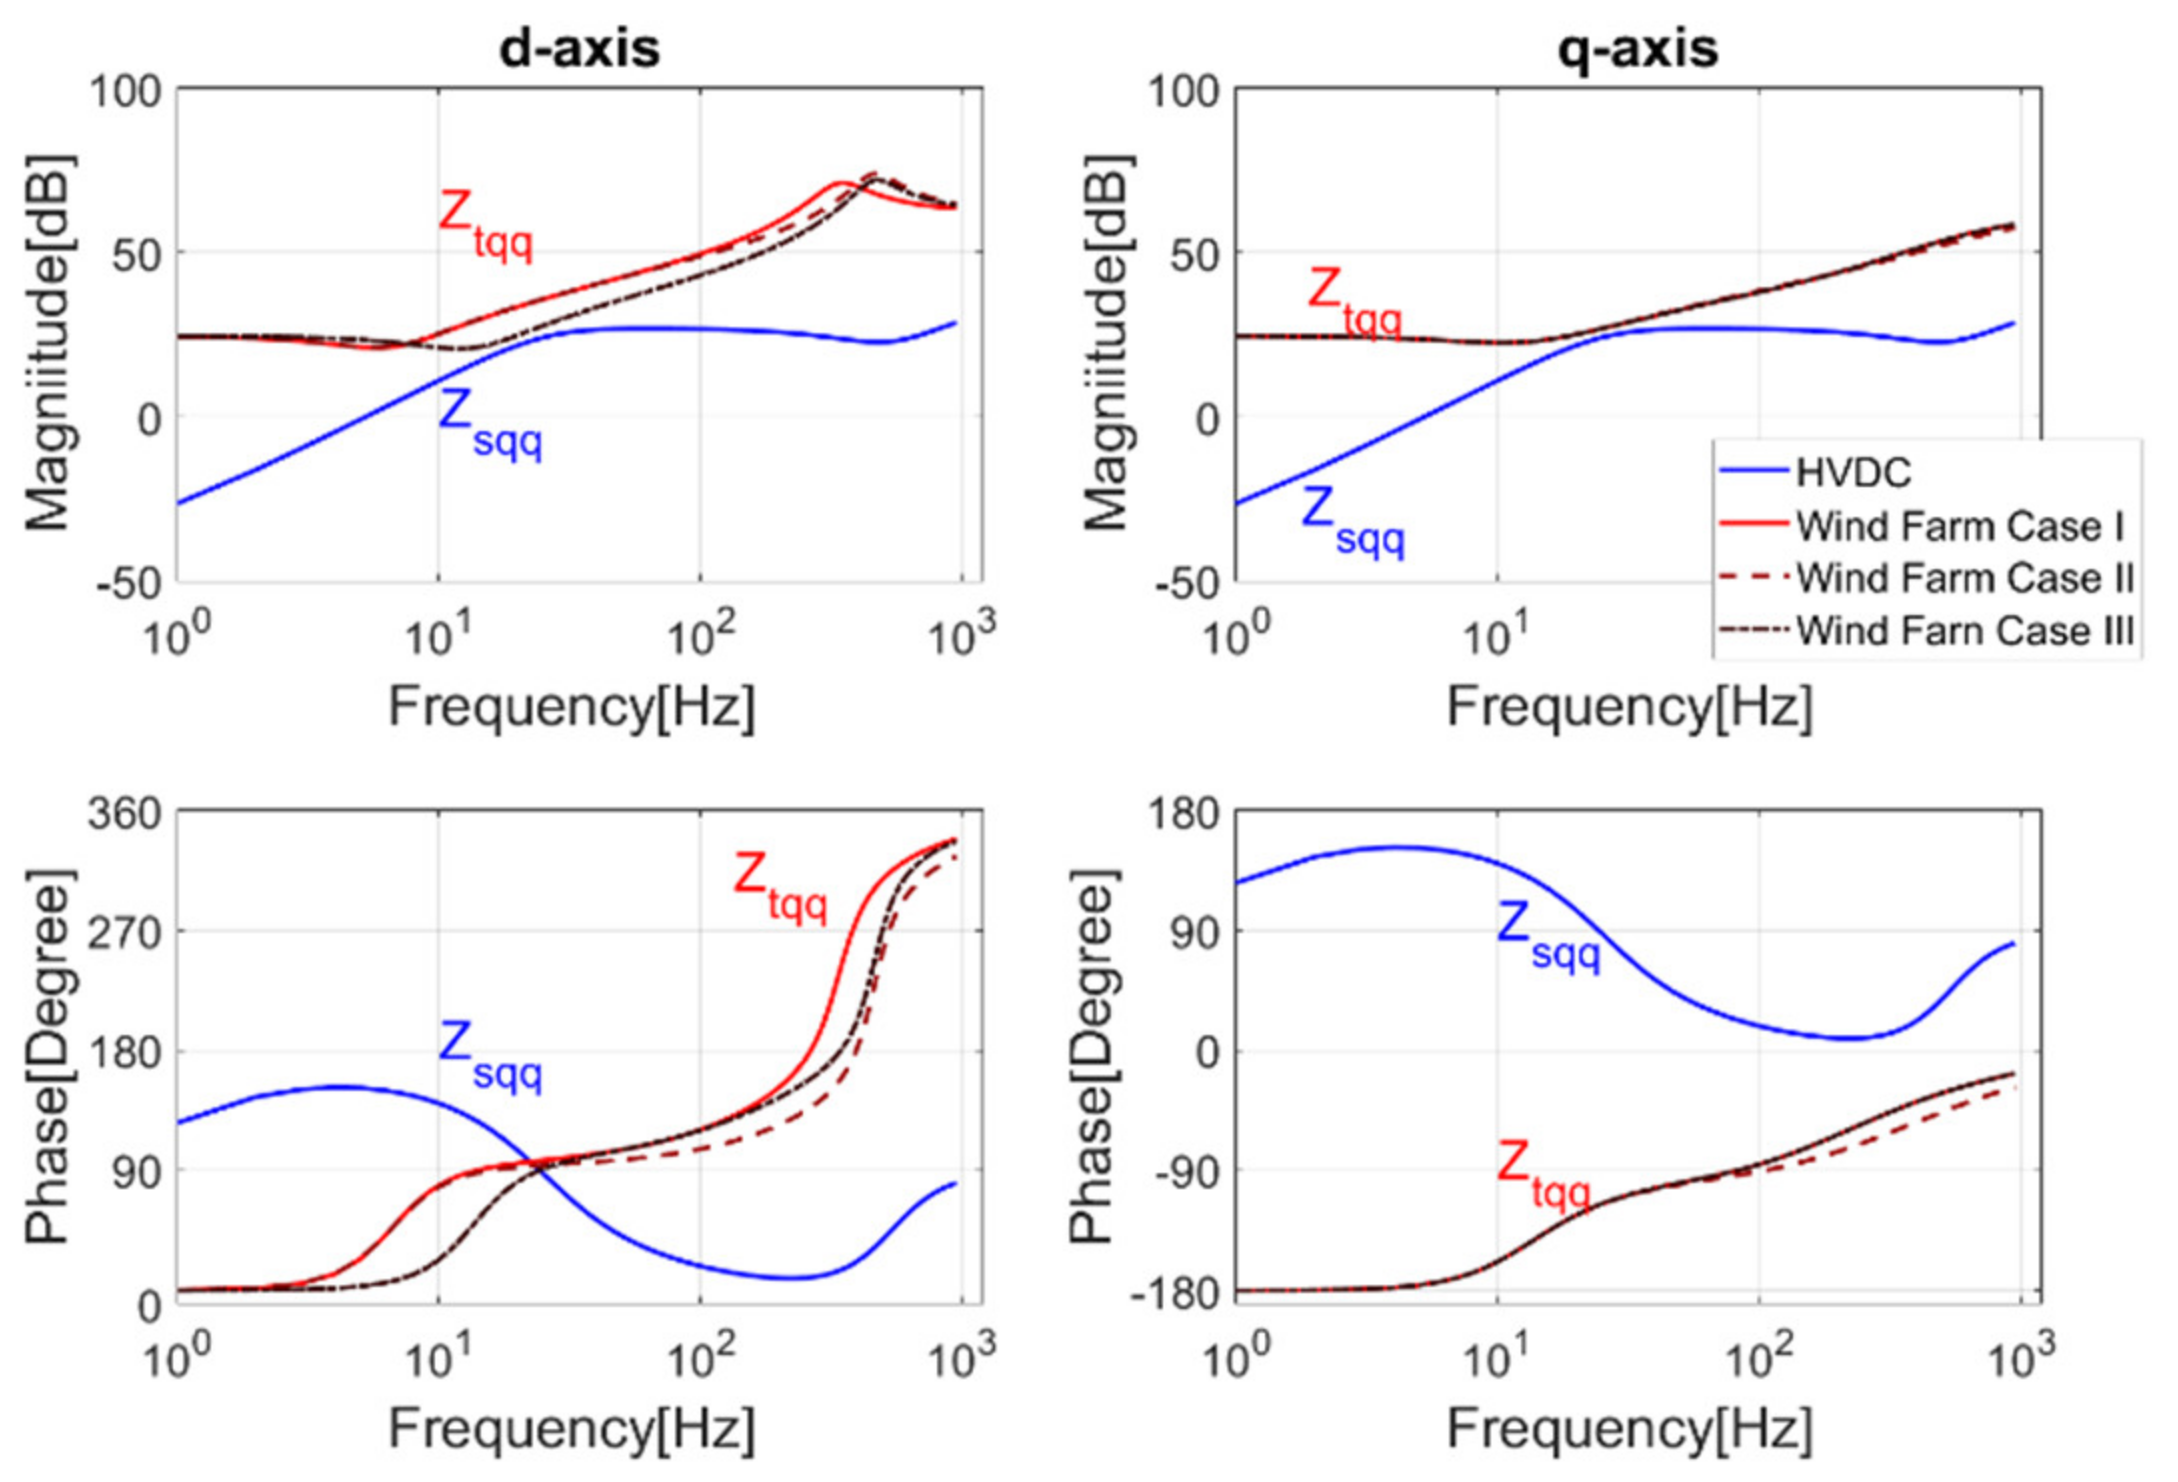
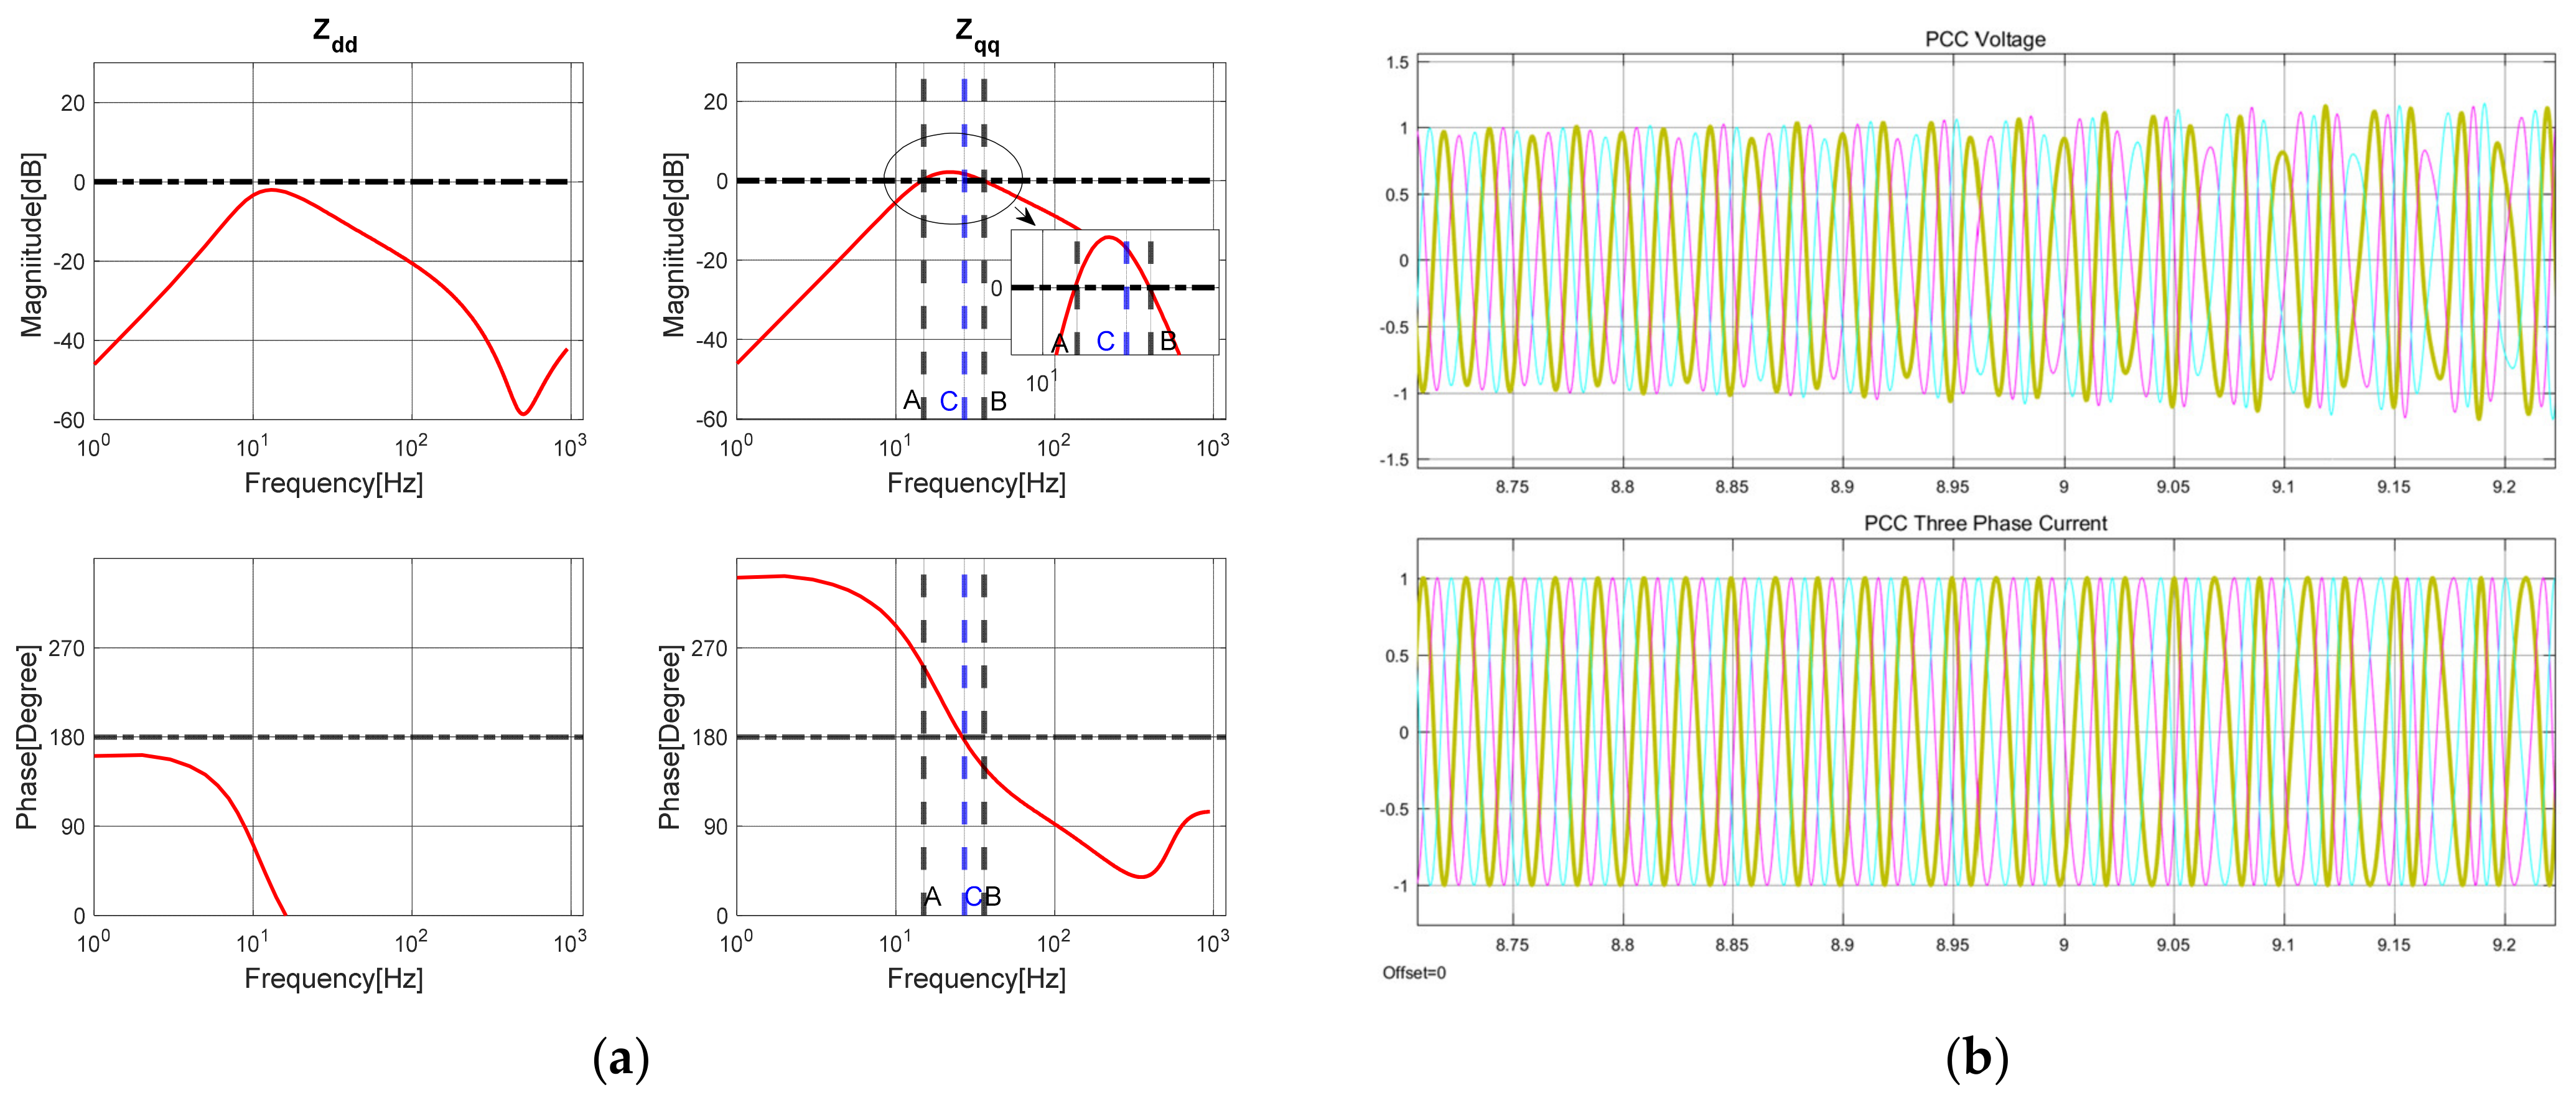
Figure 11a shows the
Ztdd and
Ztqq Bode plots under different bandwidths in proportional change. In the presence of the wind farm impedance, the current bandwidth is reduced from 10 pu (500 Hz) (Case I) to 9 pu (450 Hz) (Case II), while the outer AC voltage control loop bandwidth is reduced from 1 pu (50 Hz) (Case I) to 0.9 pu (45 Hz) (Case II), and the magnitude of
Ztqq rose and crosses the wind farm impedance.
In
Figure 11b, the Bode plots of
Zdd and
Zqq can show this variation from a stable to unstable condition. The magnitude of Case I in the
q-
axes has no crossover points with the 0 dB line. The magnitude of Case II in the
q-
axes has a crossover up to the 0 dB line before its phase crosses down to the π line, and subsequently crosses back down to 0 dB after the phase crosses down to π. This indicates that
Zqq changes from stable to unstable when the bandwidths change. Although the magnitude of
Zdd also increases, it is too small and the phase of
Zdd will not affect the system stability.
3.4.2. Impact of Wind Grid Side Controller Loop Bandwidths
According to Ztdd in Equation (22), ωtdcc exists only in the denominator. Therefore, the bandwidths and Ztdd magnitude are inversely proportional. It can be observed from Equations (22) and (23), that ωtcc exists in the form of s/ωtcc + 1 the in numerators of both equations. Due to its relatively higher value compared to 1, ωtcc has a small impact on the magnitudes of Ztdd and Ztqq.
Figure 12 compares
Ztdd and
Ztqq for different values of
ωtcc and
ωtdcc. Firstly, only
ωtcc increases from 4 pu (200 Hz) (Case I) to 8 pu (400 Hz) (Case II), while the
ωtdcc is fixed at 0.8 pu (40 Hz). These two cases show little impact on either
Ztdd or
Ztqq in magnitude or phase. Secondly, in Case III,
ωtdcc changes from 0.4 pu (20 Hz) (Case I) up to 0.8 pu (40 Hz), while
ωtcc is kept fixed at 4 pu (200 Hz). The magnitude of
Ztdd decreases while that of
Ztqq remains stable. The lowest magnitude points of
Ztdd move closer to those of
Zsdd, which indicates the rising risk of instability, but considering the phase conditions, it is hard for
Ztdd to lead to system instability.
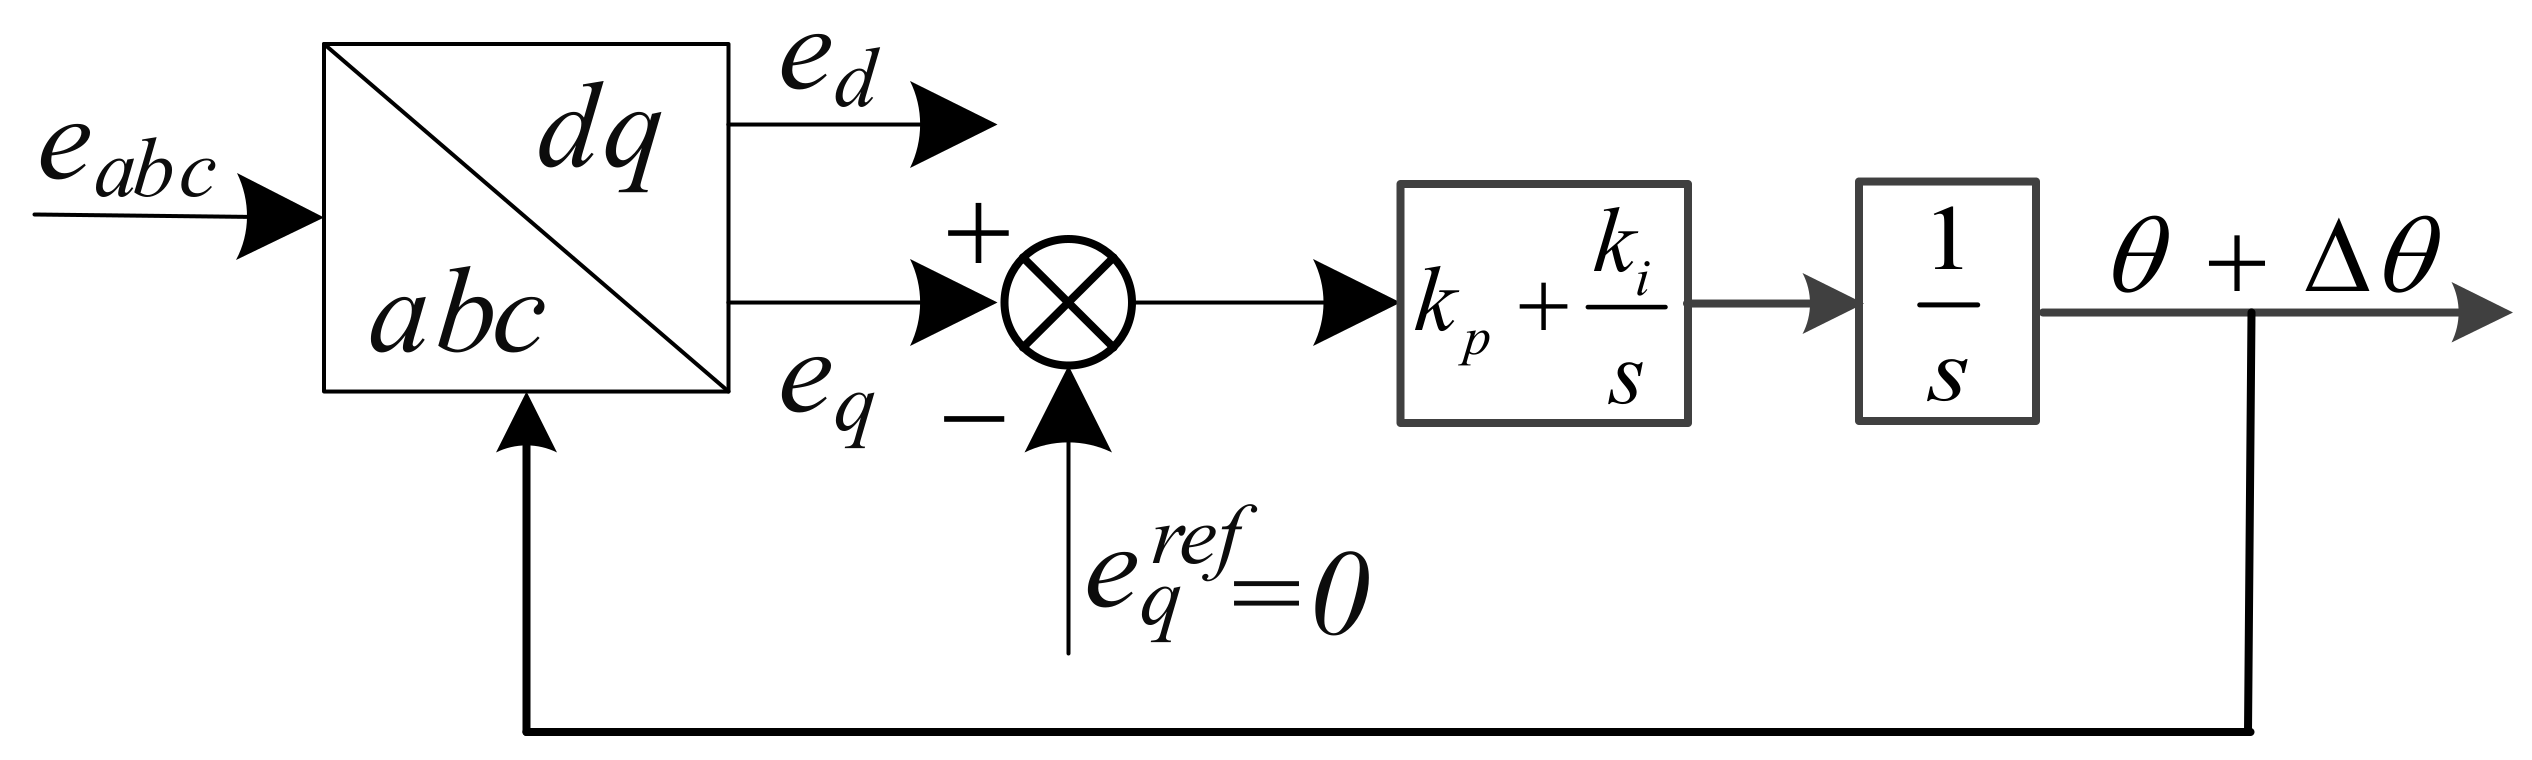
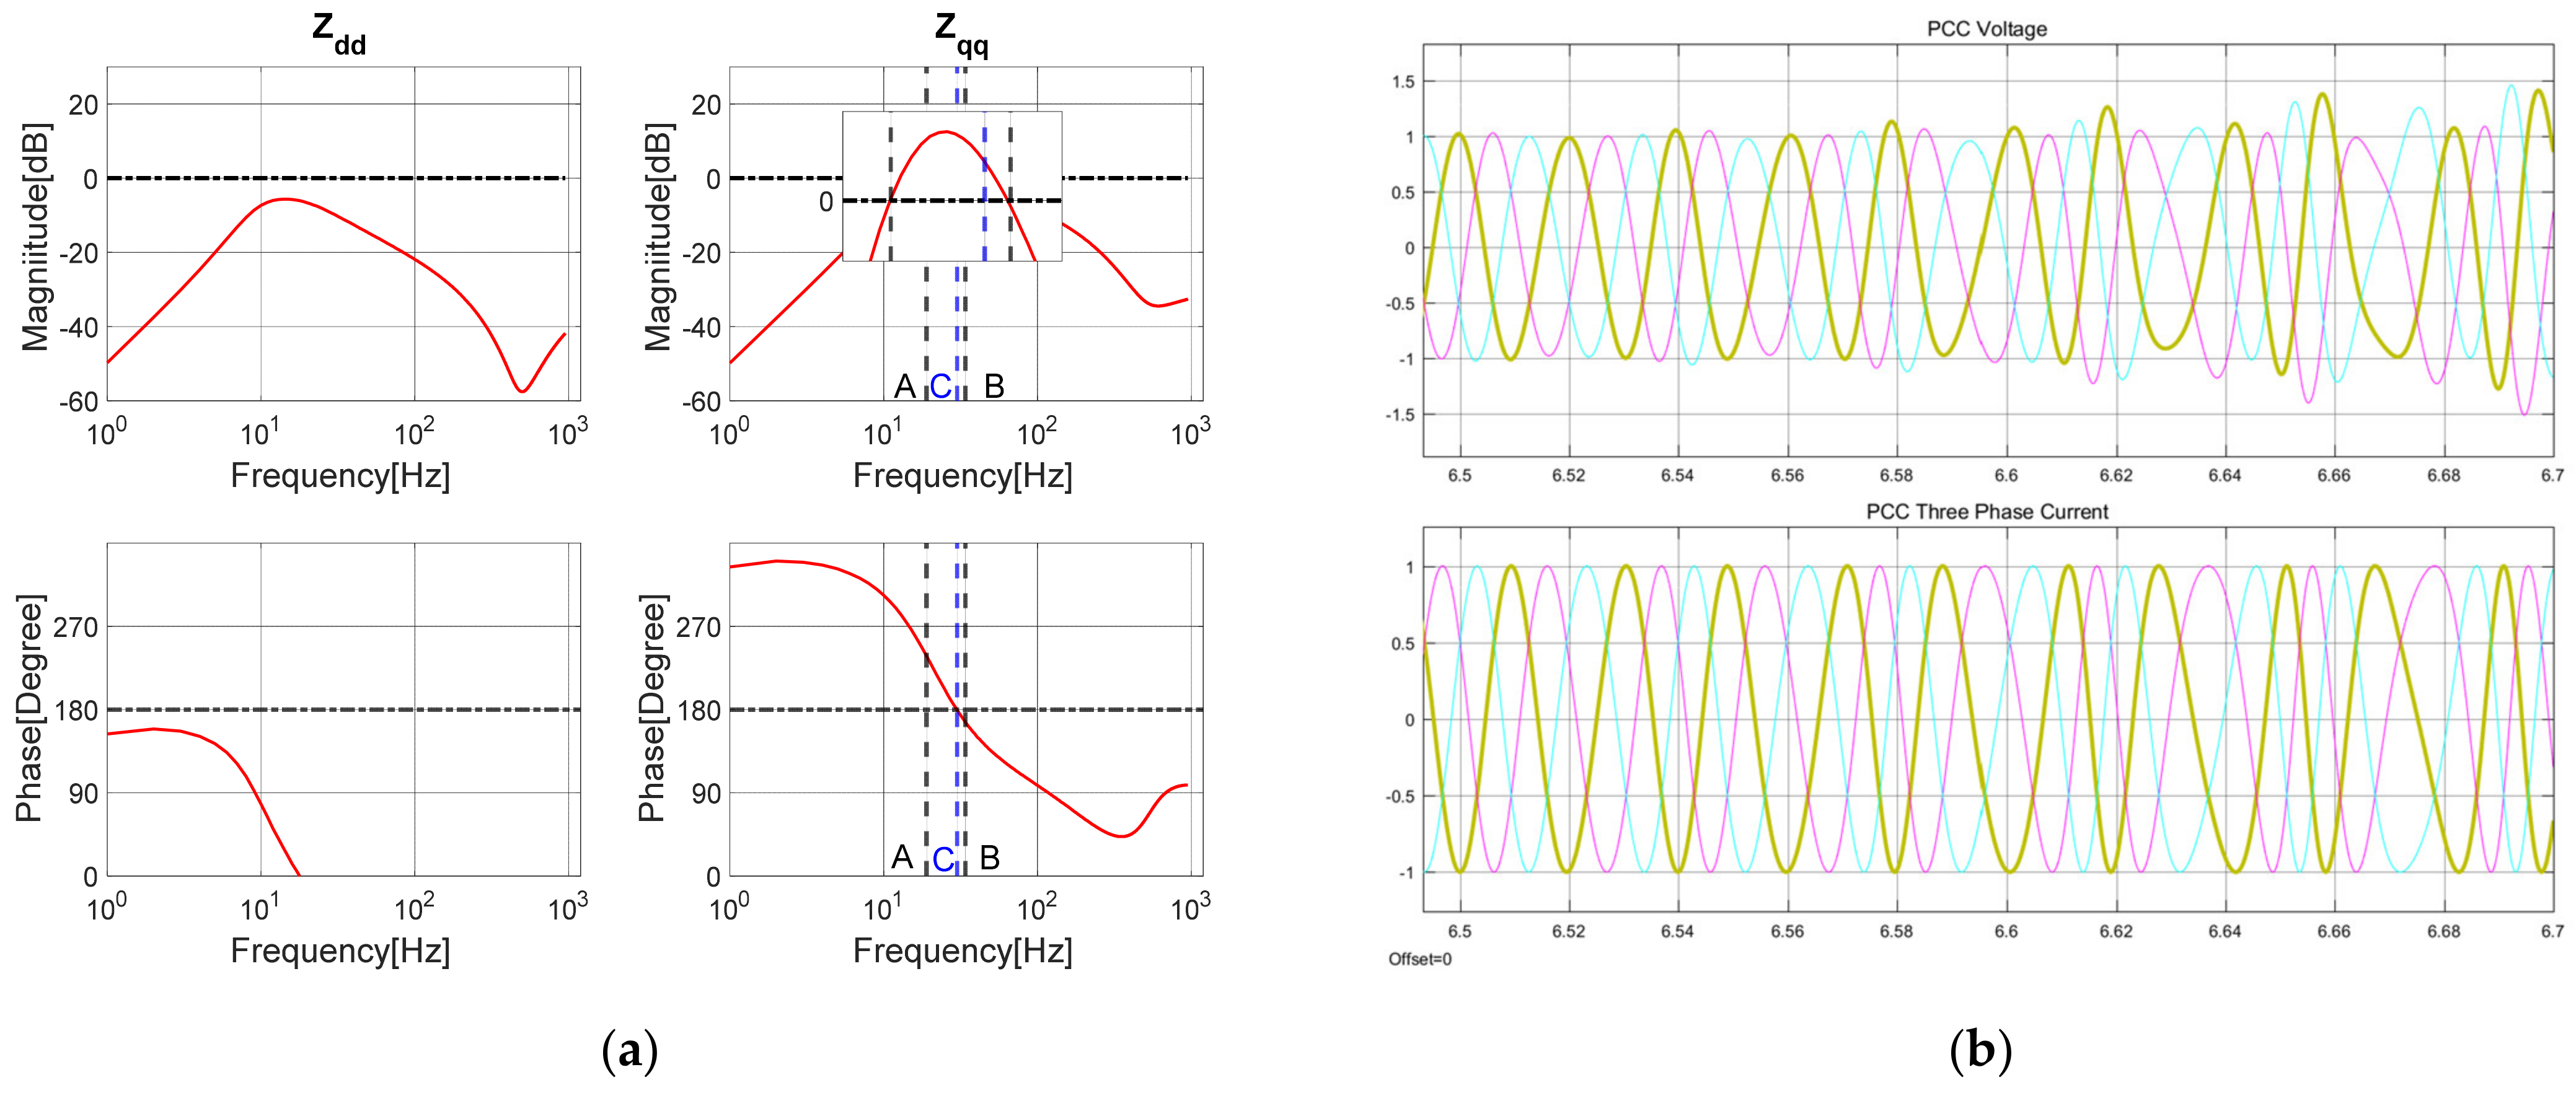
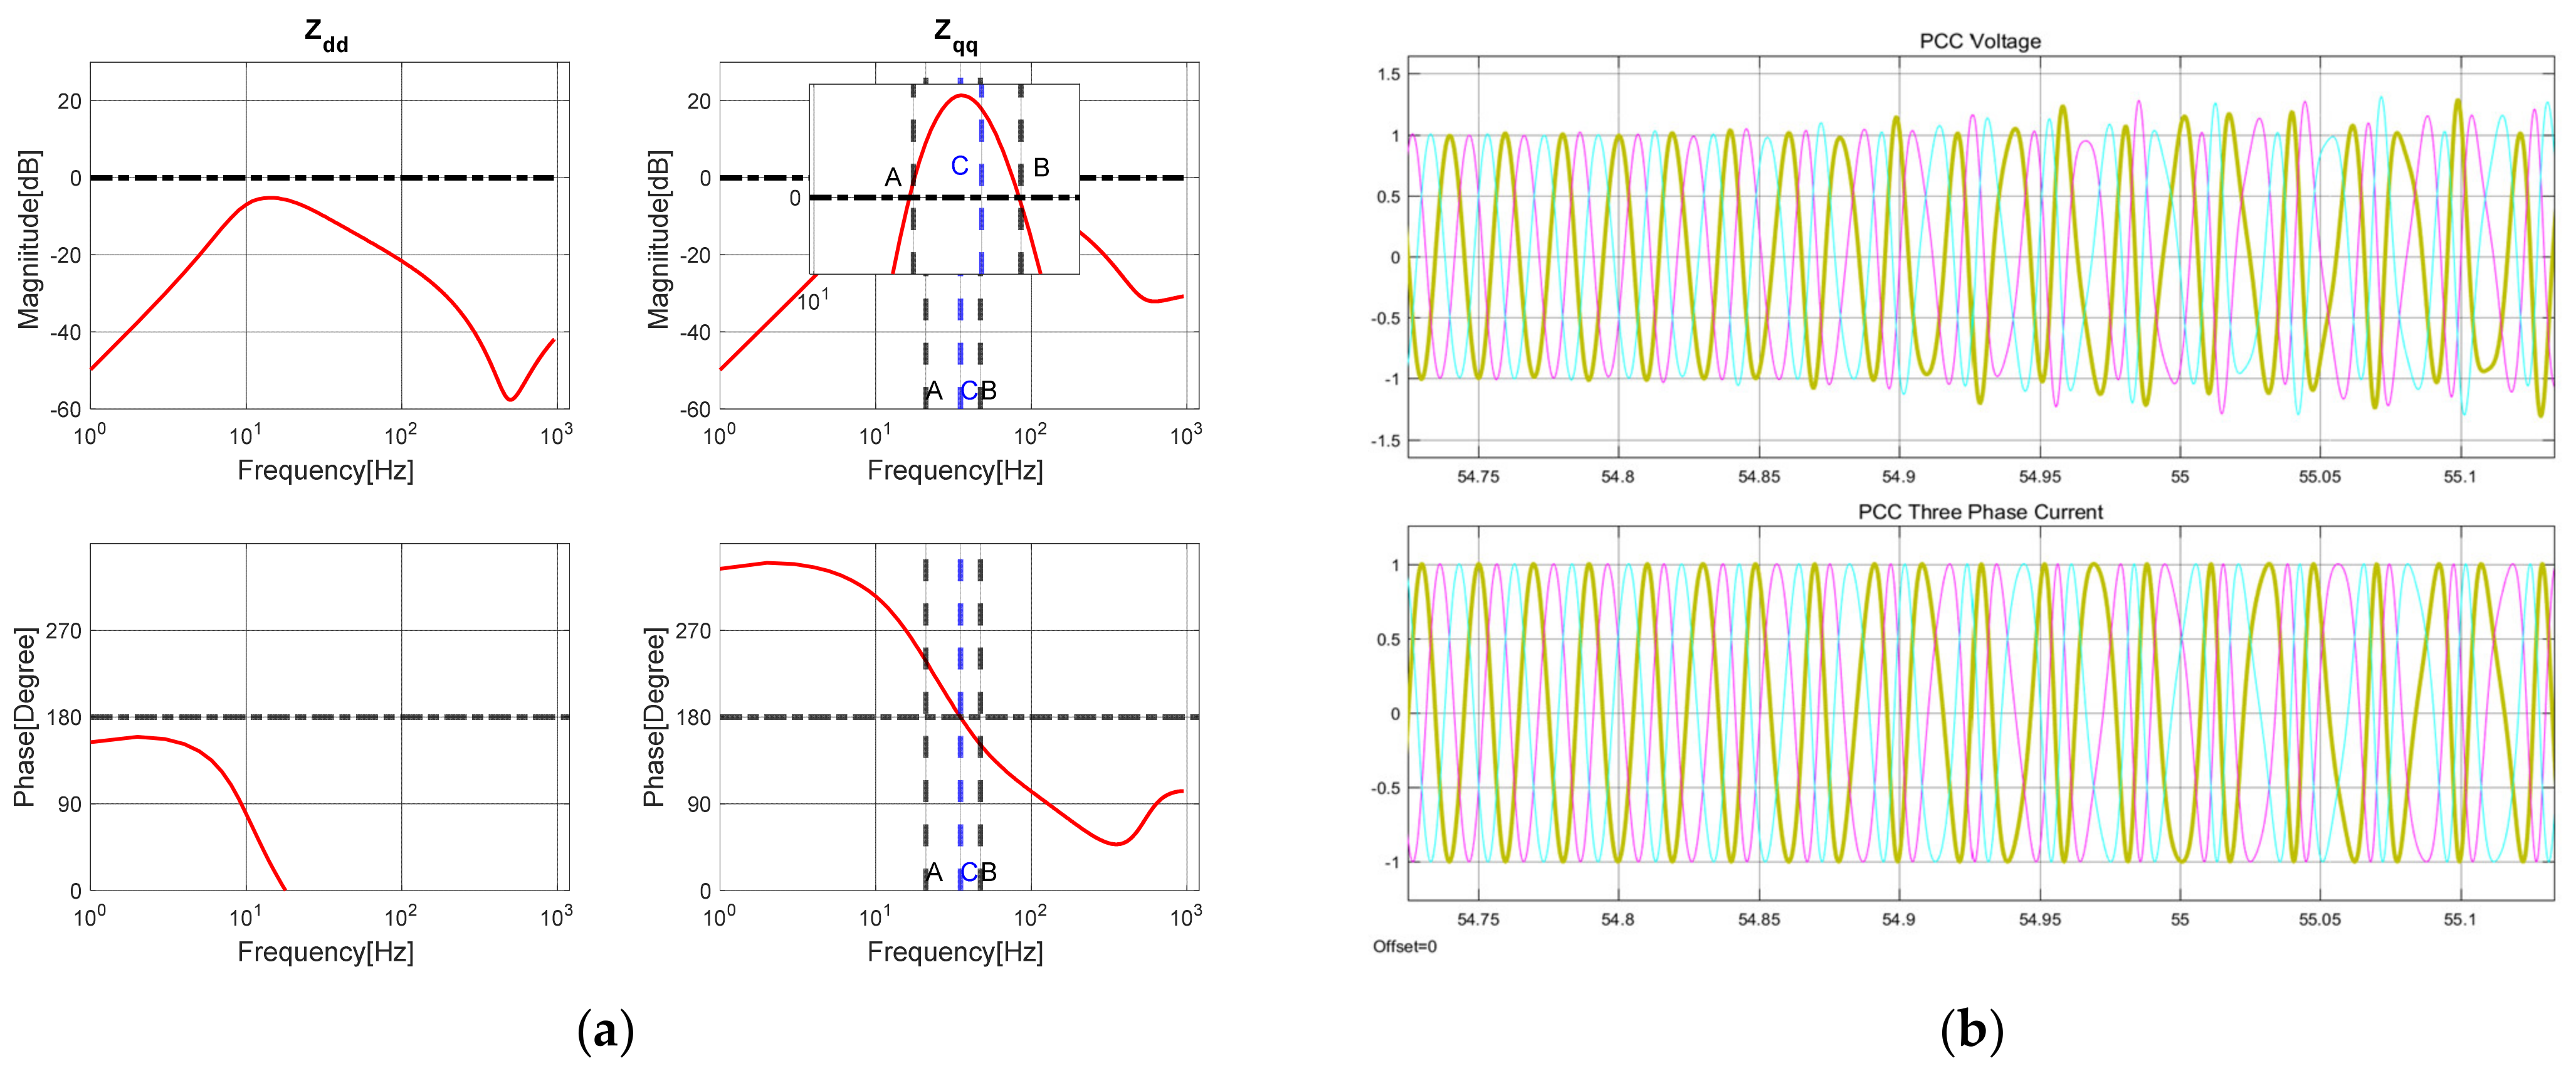
It can be observed from Equation (23) that the ωtpll is part of Ztqq denominator in a form of second-order function. Therefore, when the ωtpll increases, the Ztqq magnitude in the increased bandwidth area will decrease rapidly and rest frequency areas almost remain the same.
Figure 13a shows the
Ztqq with
ωtpll from 20 Hz (Case I) to 50 Hz (Case II). The magnitude falls to have crossover with
Zsqq. The range of phase near −π are extended from 4 to 12 Hz, which increased the possibility of phase instability. However, because
ωtpll has no impacts on
Zsdd as mentioned before,
Zsdd remains the same.
Figure 13b is the Bode plot of
Zqq and shows that
Zqq becomes unstable from an originally stable condition.


