Article

Power System Zone Partitioning Based on Transmission Congestion Identification Using an Improved Spectral Clustering Algorithm

1
College of Computer, National University of Defense Technology, Changsha 410073, China
2
Hunan Provincial Key Laboratory of Network Investigational Technology, Hunan Police Academy, Changsha 410138, China
3
Key Laboratory of Police Internet of Things Application Ministry of Public Security, Beijing 100089, China
4
College of Systems Engineering, National University of Defense Technology, Changsha 410073, China
5
Department of Electronic Information and Electrical Engineering, Changsha University, Changsha 410022, China
6
College of Meteorology and Oceanography, National University of Defense Technology, Nanjing 211101, China
*
Authors to whom correspondence should be addressed.
Electronics 2021, 10(17), 2126; https://doi.org/10.3390/electronics10172126
Submission received: 4 August 2021 / Revised: 27 August 2021 / Accepted: 30 August 2021 / Published: 1 September 2021
(This article belongs to the Section Power Electronics)

Abstract

:
The ever-expanding power system is developed into an interconnected pattern of power grids. Zone partitioning is an essential technique for the operation and management of such an interconnected power system. Owing to the transmission capacity limitation, transmission congestion may occur with a regional influence on power system. If transmission congestion is considered when the system is decomposed into several regions, the power consumption structure can be optimized and power system planning can be more reasonable. At the same time, power resources can be properly allocated and system safety can be improved. In this paper, we propose a power system zone partitioning method where the potential congested branches are identified and the spectral clustering algorithm is improved. We transform the zone partitioning problem into a graph segmentation problem by constructing an undirected weighted graph of power system where the similarities between buses are measured by the power transfer distribution factor (PTDF) corresponding to the potential congested branches. Zone partitioning results show that the locational marginal price (LMP) in the same zone is similar, which can represent regional price signals and provide regional auxiliary decisions.

1. Introduction

Recent interest in solving problems of power system operation and planning has focused on parallel or decentralized computing. It is difficult to handle a large amount of data processing by conventional centralized computing, which needs much computational effort [1]. Especially when the power system is expanding, it will be much too time-consuming with limited fault tolerance. However, the above problem can be overcome by decentralized computing, which achieves dimensionality reduction by decomposing a complex problem into smaller ones [2]. As a major technique to achieve decentralized computing, power system zone partitioning is also a set partitioning problem, which can be solved by set partitioning formulation [3]. After zone partitioning, system safety is enhanced by preventing a total system from suffering collapse owing to the curse of dimensionality [4]. In addition, the larger the scale of the power system, the more significant the effectiveness of zone partitioning [5]. One of the current topics is how to partition power system into zones and appropriate zone partitioning techniques are required for power system parallel solutions.
Transmission congestion is an essential factor that leads to narrow zone partitioning results, which cannot reveal the system operation rules with an impact on regional decision-making [6]. When the branch power flow exceeds the limit, additional power is introduced into the power market and low-cost generator buses cannot give priority to their output owing to the security constraints, which leads to a difference in the price of buses in each zone and the high price of zones with power input. In other words, transmission congestion directly affects the price distribution of power system, and regional economic characteristics cannot be represented by power system zones, which obstructs a rapid adjustment of system operation and economic dispatching. If transmission congestion is factored into power system zone partitioning, there are many benefits for power grids and microgrids in several applications including residential [7], industries [8], university districts [9], logistics facilities [10], and seaports [11], such as identifying the law of power resource allocation, clarifying the impact of the current price mechanism on each region, and guiding power market participants and power consumers to improve their power generation or power consumption habits.
A power grid can be described as a topology network where nodes and links denote buses and branches, respectively. Some electrical properties of the branch-like admittance or average power flow can be regarded as a weight for the link. Spectral clustering is usually used to reveal the internal connectivity structure of such a topology network with the eigenvalues and eigenvectors of an associated matrix [12]. It plays a vital role in image processing especially for image segmentation by taking local information such as edge weights to globalize them [13]. This paper proposes a power system zone partitioning method using an improved spectral clustering algorithm, which can avoid the defects of traditional clustering algorithms like k-means [14] that are sensitive to initial values and easy to fall into local optimization. It is expected that the proposed method provides more reliable solutions in terms of accuracy.
In our proposed method, the difference in price between buses caused by transmission congestion is transformed into the difference of power transfer distribution factor (PTDF) between buses and the similarities between buses are measured by PTDFs [15]. To identify the potential congested branches, a transmission congestion identification scheme including the maximization discrimination strategy and the comparison discrimination strategy is designed based on the economic dispatching optimization model of power system considering the transmission capacity limitation. With potential congested branches as the boundaries and considering the connections between buses, zone partitioning problem is transformed into a graph segmentation problem based on the similarities of PTDFs corresponding to the potential congested branches. Finally, power system is partitioned into zones by the k-means++ algorithm [16]. Specifically,
  • We achieve the possibility of decentralized computing in power system by partitioning the power grid into a finite number of smaller zones, which enables a flexible, distributed, and adaptable power system operation and control that utilizes the concept of smart grids [17].
  • We identify the potential congested branches before power system zone partitioning for a more reasonable zone partitioning result that can represent regional economic characteristics to support system operation decision-making.
  • We improve the spectral clustering algorithm by replacing the traditional k-means algorithm with the k-means++ algorithm for a more stable zone partitioning result without being affected by the selection of the initial values.
The remainder of this paper is organized as follows. Section 2 reviews the previous power system zone partitioning methods. Section 3 introduces the concept of PTDF. Section 4 identifies the potential congested branches based on PTDF. Section 5 explains our power system zone partitioning method. Section 6 presents the simulation results. Section 7 concludes the paper.

2. Related Work

There is a significant difference in the regional distribution of power energy supply and power consumption demand, which promotes the long-distance transmission of power energy and cross-regional interconnection of power grids, resulting in the increase of the difficulty in monitoring and protecting the critical infrastructure resources incorporated within the power system. For ease of operation management and security control, power system is usually split into smaller parts to be solved in parallel. Considering that zone partitioning based on geographical areas without fully considering electrical characteristics and actual operation of the system cannot reveal the characteristics of each zone, a series of studies are conducted on zone partitioning in the scenarios of reactive voltage control, black start strategy, and regional economic dispatching, which are mainly divided into three classes: zone partitioning based on optimization algorithm, zone partitioning based on clustering algorithm, and zone partitioning based on graph theory.

2.1. Zone Partitioning Based on Optimization Algorithm

Since the division of buses into different classes can be regarded as an optimal combination problem, in essence, buses can be classified by various optimization algorithms. For example, there are different heuristic optimization algorithms applied in the studies of reactive voltage zone partitioning of power system, such as simulated annealing algorithm [18], genetic algorithm [19], Tabu search algorithm [20,21], evolutionary algorithm [22], immune algorithm [23], etc.
Hu et al. [19] proposed a two-layer search method for bus division from the perspective of the number of balanced reactive power control equipment and the scale of zone partitioning. They solved the upper-layer problem of searching the first bus in each zone based on the genetic algorithm while solved the lower-layer problem of partitioning power system into zones based on the search results with the definition of electrical distance. Considering the impact of the number of nodes and branches between different zones on the system, Chang et al. [20] built a zone partitioning optimization model based on the Tabu search algorithm and partitioned power system into zones by solving this model in two stages where the number of electrical components such as generators, capacitors, and transformers within the zone were taken as the optimization constraints. Although the Tabu search algorithm could avoid a lot of repeated search work, it was still time-consuming to solve the optimization problem of a large-scale system. Considering the impact of reactive power source buses on load buses, Yan et al. [22] calculated the electrical coupling degree between buses and took into account the influence of reactive power margin and static reactive power balance to solve the zone partitioning problem by the adaptive evolutionary algorithm from the perspective of reactive power balance within the zone.

2.2. Zone Partitioning Based on Clustering Algorithm

According to the similarity measure between the objects in the application scenario, the clustering algorithm divides the objects with similar characteristics into classes to ensure that the objects in the same class have similarities while the objects in different classes have opposites. Since the clustering algorithm used in the power system defines the "distance" between buses based on the application scenario and classifies buses according to the closeness of the connection between buses, these buses can be regarded as the sample objects and the system zone partitioning problem can be transformed into an unsupervised clustering problem [13].
Electrical distance is a common index of bus similarity for power system zone partitioning. Guo et al. [24] established a reactive power source control space by analyzing the sensitivity of PV bus to the system change in quasi-steady state and constructed a high-dimensional space to map the controllability of reactive power source to buses, where the electrical coupling degree between different buses was defined to calculate the electrical distance between buses. Based on the agglomerative hierarchical clustering algorithm, they partitioned power system into zones when the demands of reactive voltage control were met. To obtain a more reasonable zone partitioning result of reactive voltage control, Zhao et al. [25] calculated the reactive voltage sensitivity between buses considering the membership of different buses. Based on this, they calculated the numerical similarity of each column of the sensitivity matrix by the vector similarity method, which was defined as the electrical distance, and then partitioned power system into zones by the fuzzy clustering method. The reactive voltage zones with the key load buses in each zone were given in [26], which proposed a clustering-based load bus division strategy that mapped the load bus into a multidimensional space and defined the electrical distance as the distance between buses to divide buses into classes by the spectral clustering algorithm in the high-dimensional space.
Before classifying the buses, some information can be referred to and added into the clustering algorithm as the supervisory information. Li et al. [27] proposed two stages of black start zone partitioning. In the first stage, the generators to be restored in the system were grouped to ensure that there must be black-start generator buses in each zone with the optimization objective of the total generator output and the total branch capacity within a certain period. In the second stage, the power system zone partitioning problem was solved based on the clustering algorithm where the generator bus classification information was taken as the supervised information and a more realistic zone partitioning result was obtained by transforming the unsupervised problem into a semi-supervised learning problem.

2.3. Zone Partitioning Based on Graph Theory

Power system has a complex topology structure where many parameters correspond to many concepts of graph theory. For example, the loop, the branch, and the bus in power system correspond to the circle, the edge, and the vertex in graph theory, respectively. Therefore, power system can be abstracted as a directed graph of graph theory for further study [12].
According to the power flow distribution, Zhang et al. [28] abstracted the power grid structure as a directed graph and determined the cut set corresponding to the congested branches based on graph theory. They searched for the circles in the graph by traversing the power grid topology and spanned them into a high-dimensional space with the basis of the smallest circle length for zone partitioning. α decomposition method was also a typical graph theory-based zone partitioning technique proposed in [29]. After the power system was abstracted as a graph, α decomposition method determined whether to eliminate the edges in the graph according to the threshold α , and obtained some independent subgraphs based on the remaining connections between vertices in the graph after the elimination of some edges. In this method, α denoted the electrical coupling degree between buses, and the electrical coupling degree within the subgraph was greater than α while the electrical coupling degree between subgraphs was less than or equal to α . Based on this method, power system could be partitioned into several non-intersected zones and the number of zones was related to the selection of the threshold α . If a smaller α was selected, the scale of each zone was larger and the number of zones was smaller; otherwise, the scale of each zone was smaller and the number of zones was larger.
To sum up, optimization algorithms, clustering algorithms and graph theory are usually used in the studies of power system zone partitioning, most of which focus on reactive voltage control or black start strategy but few of which pay attention to regional characteristics considering transmission congestion. With the expansion of the power system, zone partitioning can simplify the structure of the topology network and reduce the complexity of the dispatching control. Furthermore, appropriate power system zone partitioning can accurately reveal the difference between zone prices for reasonable resource allocation in the power market.

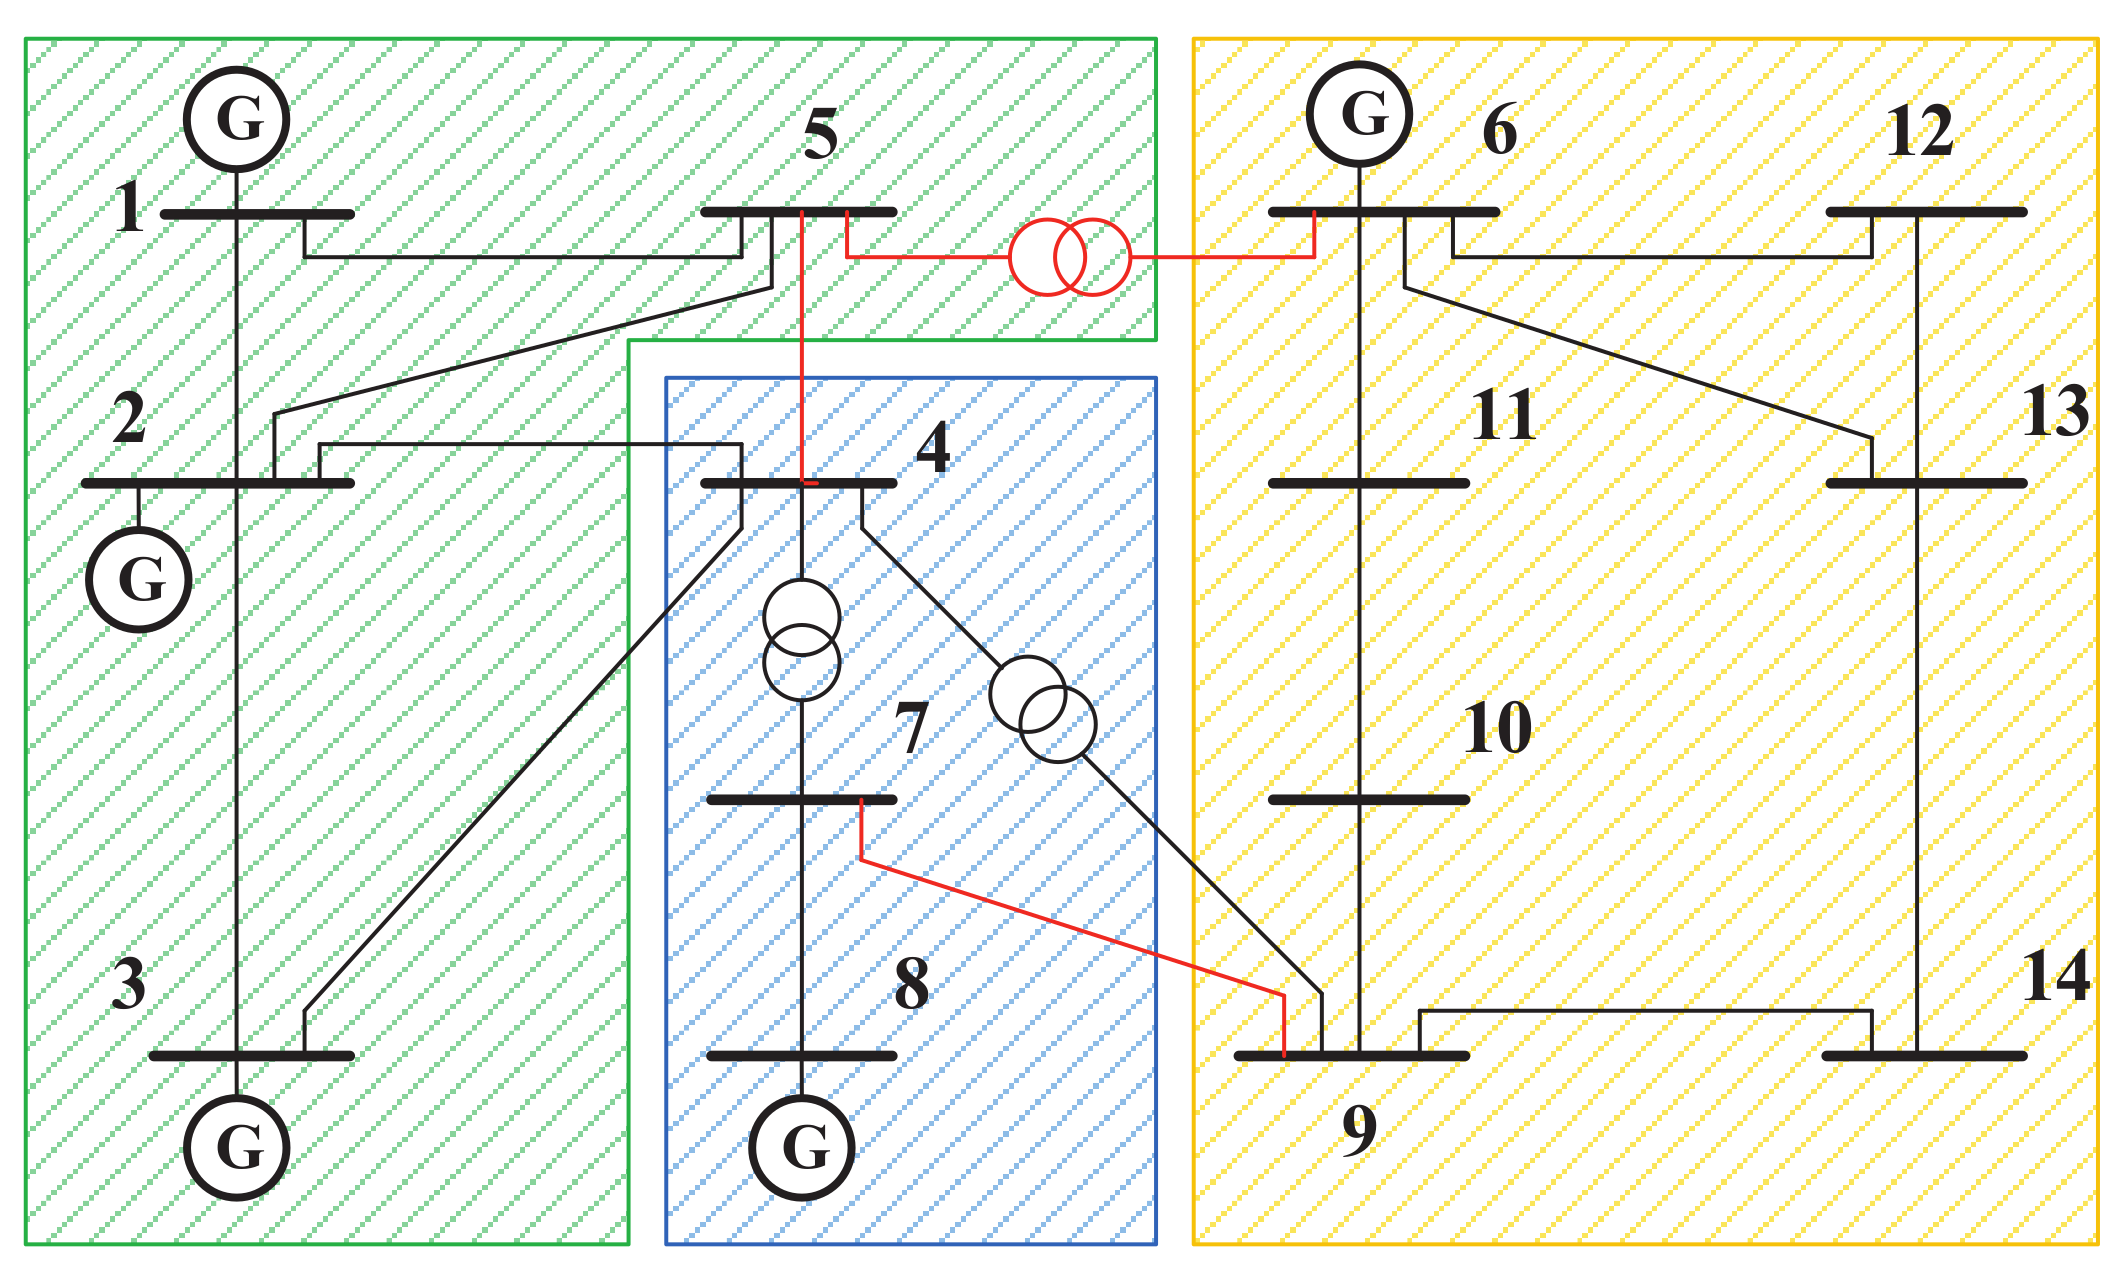
3. Power Transfer Distribution Factor

3.1. Sensitivity Analysis

Sensitivity analysis is a classic method for power system analysis, which simplifies the relationship between power system variables by linearization [30]. Sensitivity is a measure of the impact of a change in a variable on the overall system. Generally, power system can be represented by a nonlinear equation. When a characteristic of the system changes, the nonlinear equation can be approximated to a linear function within a relatively small range, which is usually the first derivative of the objective function to a characteristic variable. This first derivative can be taken as the sensitivity of the objective function to that characteristic variable, which is a kind of absolute sensitivity defined as
D x T = T x = lim Δ x T x
where T denotes the objective function of the system, x denotes the characteristic variable, and D x T denotes the absolute sensitivity.
However, the absolute sensitivity does not adequately represent the extent to which the characteristic variable affects the performance of the overall system. To make up for it, the relative sensitivity is defined as
S x T = T x · x T = T / T x / x = ln T ln x
The complex form of the relative sensitivity is expressed as
S x T = T x · x 100 S x T = T x · x 180
Equation (3) includes two parts of amplitude and phase angle, where S x T and S x T denote the impact on the overall system when the amplitude of a parameter changes by 1% and the phase angle of that changes by 1 , respectively.

3.2. Sensitivity Factor

Power system involving complex dynamic and static behaviors is often large in scale consisting of numerous components. The sensitivity analysis method can accurately describe the relationship between power system variables while ensuring its simplicity for rapid system analysis. Power system variables can be divided into two classes: control variable u and state variable x, where the former is the known data before system solution and the latter is an independent variable. To describe the network state of power system, the power flow equation is expressed as
h ( x , u ) = 0
Let the network function of power system be f = ( x , u ) . Thus, the sensitivity of power system refers to the change of the network function f induced by the disturbance of control variable u. The change of the network function f caused by the disturbance of control variable u and state variable x is expressed as
δ f = i = 1 m f x i δ x i + k = 1 n f u k δ u i
where u k denotes the kth control variable, and x i denotes the ith state variable.
Power transfer distribution factor ( P T D F ) is one of the sensitivity factors widely used in power system [15]. Based on the DC power flow model, P T D F defines the power flow variation of the transmission line when the power exchange between a pair of buses changes by one unit. The power flow problem is linearized by the DC power flow model to simplify the analysis and calculation for power system based on the following assumptions:
(1)
The branch resistance is much less than the branch reactance such that the branch resistance can be ignored in the calculation.
(2)
The phase angles at the two ends of the power system branch are basically the same. Since the difference is so small, we have s i n δ θ i θ j .
(3)
The voltage fluctuation of each bus is very small such that the voltage amplitude of all buses is set to 1.
(4)
All ground branches are ignored.
Under these assumptions, the power equation can be expressed as
P = B θ
where P denotes the bus power injection vector, B denotes the imaginary part of the bus admittance matrix, and θ denotes the bus phase angle vector. The branch power flow and the bus phase angle are related as
P b r a n c h = B b r a n c h θ
where P b r a n c h denotes the branch power flow vector, and B b r a n c h denotes the branch susceptance adjacency matrix. Equation (7) can be transformed into
P l , i j = θ i θ j x i j
where P l , i j denotes the power flow of branch l connecting buses i and j (i.e., branch i j ), θ i and θ j denote the phase angle of buses i and j, respectively, and x i j denotes the reactance of branch i j .
Based on the definition of Equation (5), the sensitivity of the power flow of branch i j to the change of the active power of bus m is
d P l , i j d P m = ( d θ i d P m d θ j d P m ) / x i j = ( X i m X j m ) / x i j
When the power of a pair of buses ( m , n ) changes, P T D F can be expressed as
P T D F i j , m n = d P l , i j d P m d P l , i j d P n = X i m X j m X i n + X j n x i j
where X i m denotes the element in row i and column m of the inverse matrix of the susceptance matrix.
For a fixed power grid, the value of P T D F is independent of the operation state and only depends on the topology structure and the branch parameters based on the assumptions of the DC power flow model. In addition, P T D F is capable of accurately describing the steady-state power flow variation owing to the advantage of fast calculation. With the ability to reveal the impact of the bus power variation on the branch power flow distribution, P T D F can be used to identify the congested branches according to the transmission capacity limitation.
In this paper, we analyze the branch power flow based on P T D F and identify the key branches that are unfavorable to system safety and prone to transmission congestion based on the active set theory. We take the P T D F as the similarity measure for power system zone partitioning to aggregate buses with similar economic characteristics. In the following we will introduce the transmission congestion identification technique for the potential congested branches based on P T D F .

4. Transmission Congestion Identification Scheme

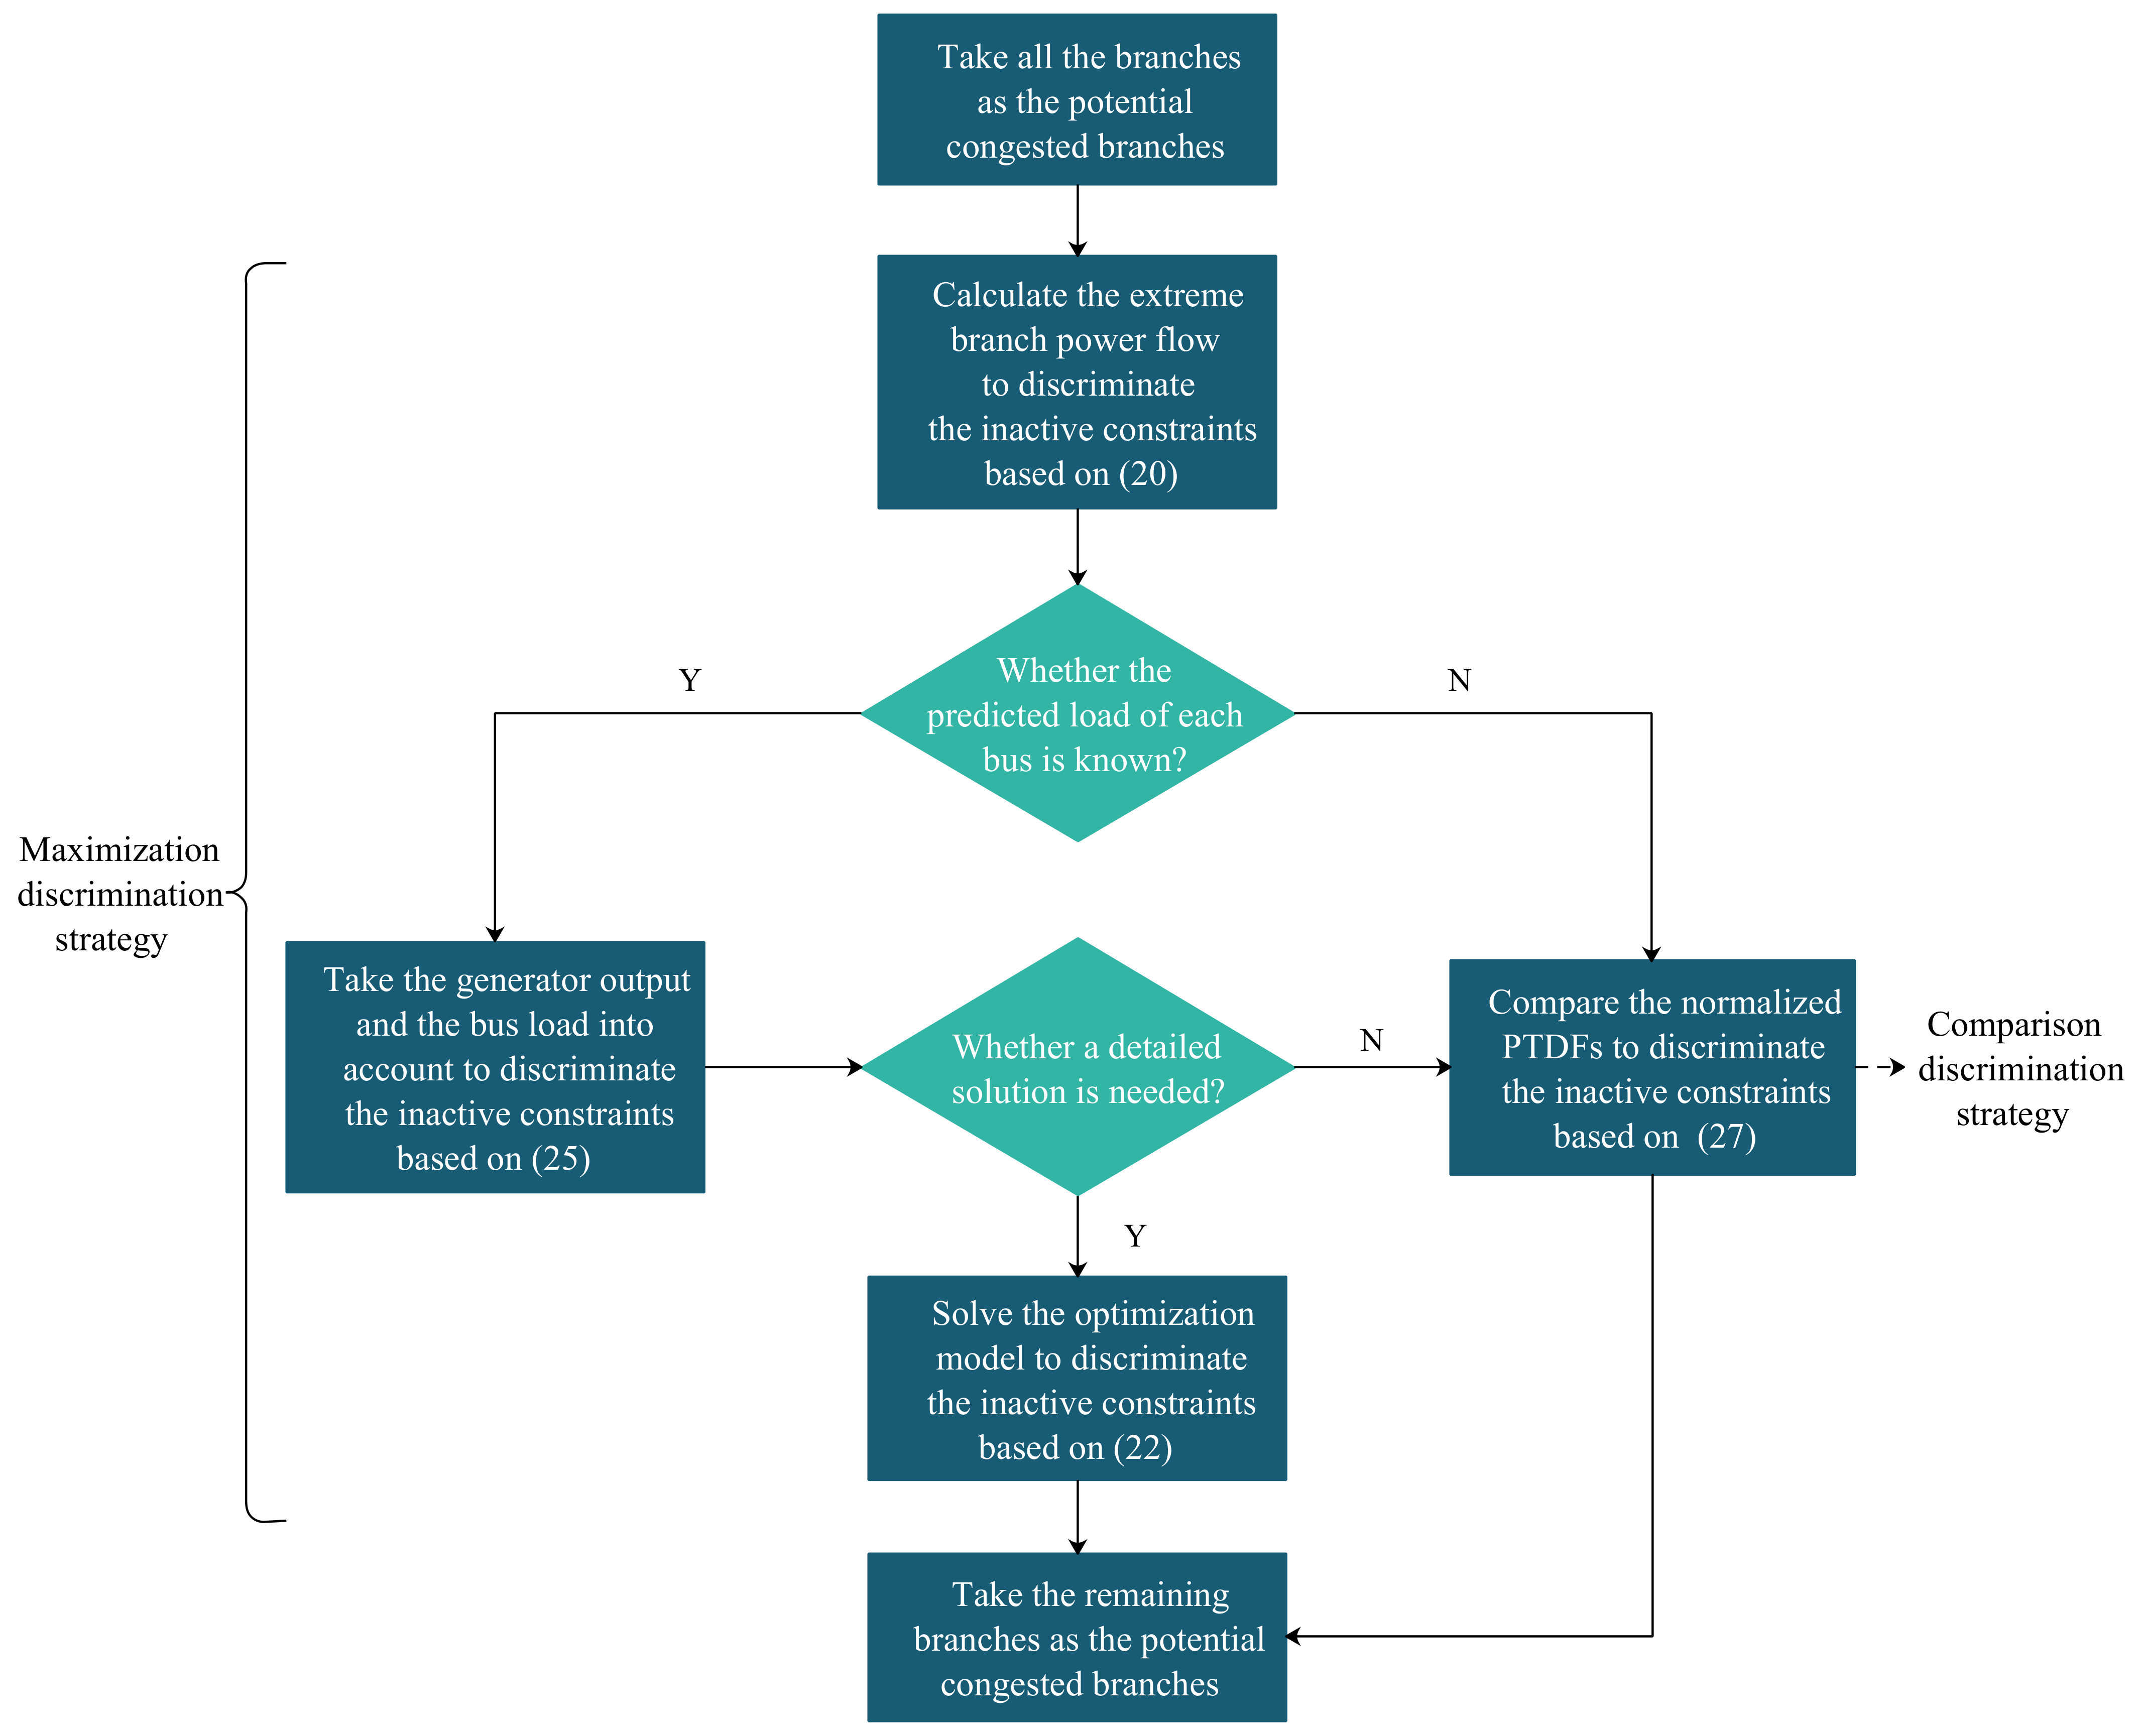
4.1. Congested Branch Identification Strategies

The power generation, transmission, and distribution of power systems are monopolized for a long time, which leads to low operation efficiency and poor economic benefits of the overall system. However, the introduction of the power market is beneficial to ameliorate the current economic situation [31]. In a power system with sufficient transmission capacity, electricity can be transferred from any generator bus to any load bus according to the result of market bidding. Because of the uneven distribution of power supply and bus load in the actual power system, free point-to-point transmission cannot be realized with the transmission capacity limitation, which may result in transmission congestion.
In a mature power market, transmission congestion has a regional influence on the locational marginal price (LMP) in power system [32]. To characterize the difference between zone prices, zone partitioning should take full account of the potential congested branches and place them at the boundaries of the zones to ensure the similarities between buses in each zone. In this paper, we rely on the physical network constraints in economic dispatching of power system to identify the potential congested branches based on the active set theory, which reduces the system dimension by constantly screening out the active constraints to improve the speed of model solving [33]. In the economic dispatching optimization model, the active branch is the congested branch. Based on this theory, we constantly simplify the solving model and propose an analytical method from different granularity to quickly identify the potential congested branches.
Consider the following economic dispatching problem:
min i = 1 N G ( a i P G i 2 + b i P G i + c i )
s . t . i = 1 N G p G i j = 1 N d p d i = 0
P G i P G i , max 0 , i 1 , , N G
P G i , min P G i 0 , i 1 , , N G
P L l , max P L l P L l , max , l 1 , , N L
P L = i = 1 N G h l , i · P G i j = 1 N d h l , j · P d j
where P G i denotes the active power output of generator i, P d j denotes the load of bus j, P G i , max , P G i , min denote the maximum and minimum active power output of generator i, respectively, P L l , max denotes the maximum power flow of branch l, N G , N d , N L denote the number of generator buses, load buses, and branches, respectively, and h l , j denotes the PTDF of bus i to branch l.
Equations (11)–(16) represent a typical economic dispatching optimization model of power system, where Equation (12) indicates the power balance constraint, and Equations (13)–(15) indicate the power system component limitations and the network constraints (i.e., the inequality constraints). These inequality constraints are combined to construct a feasible region represented as the shaded area in Figure 1, within which the optimal solution to this optimization model can be obtained. In solving the economic dispatching problem of power system with the network constraints, only a small number of branches are active constraints while most of them are inactive constraints. Therefore, the actual feasible region of the model solution is only a subset of the region based on the inequality constraints. The network constraints in the above model can be expressed as
H · ( p 1 , t , p 2 , t , , p n , t ) T P L , max
where H denotes the PTDF matrix of the power grid, p i , t denotes the power injection of bus i at time t, and P L , max denotes the transmission capacity limitation vector.
Let the feasible region be F R ( H , P L , max , P d t ) . Branch l is an inactive constraint, if we have
F R ( H , P L , max , P d t ) = F R ( H l , P L , max l , P d t )
where l denotes that the parameters are irrelevant to branch l. Equation (18) indicates that if the parameters relevant to branch l are removed, the feasible region does not change, which means that branch l has no impact on the results of economic dispatching and power trading, i.e., branch l is a non-congested branch. In the following we will introduce two strategies to identify the potential congested branches.

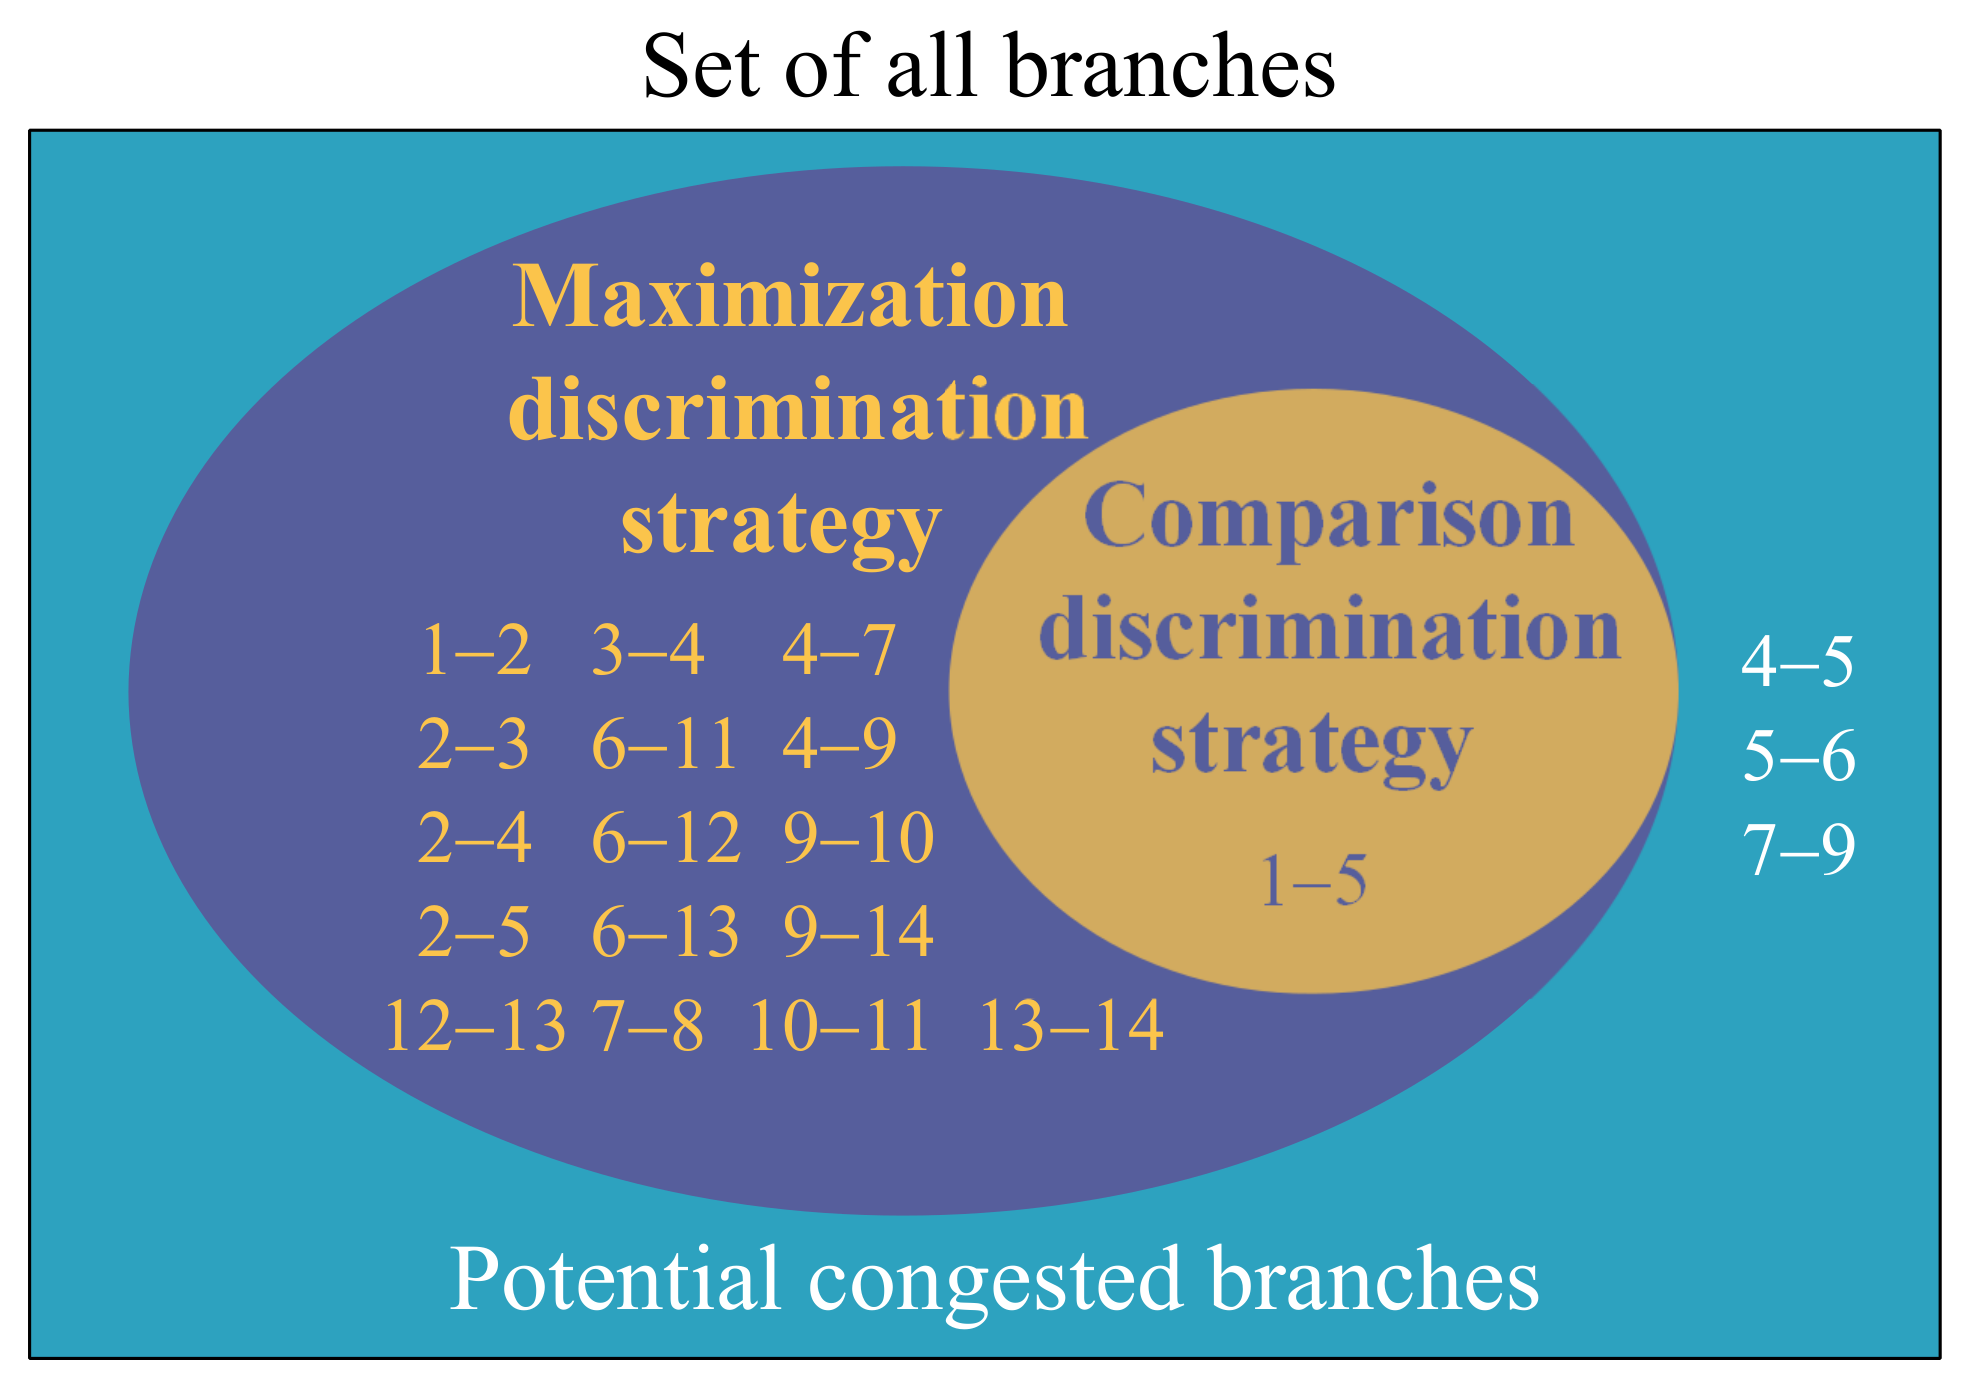
4.1.1. Maximization Discrimination Strategy

Equation (16) indicates that the branch power flow is determined by both the generator output and the bus load. When the P T D F and the power injection at each bus are different, the impact on the branch power flow is also different. Therefore, the power variation of the generator bus and the load bus should be considered in discriminating whether the branch is likely to be congested owing to the change of the operation state. For the generator bus, if the P T D F to branch l is positive, the power flow of branch l will increase with the increase of the generator output; otherwise, the power flow of branch l will decrease with the increase of the generator output. The opposite is true for the load bus.
Strategy 1: Calculate the maximum power flow of each branch without the network constraints and exclude the branches with a larger transmission margin from the set of the alternative potential congested branches. Consider the following problem:
P 1 L l , t * = max ( h l , min · D t ) + i = 1 N G h l , i · P G i , t s . t . P G i , min P G i , t P G i , max i = 1 N G P G i , t = D t
where D t denotes the total load of the system at time t, and h l , min denotes the minimum value of the negative P T D F s of the buses to branch l.
Equation (19) indicates the extreme power flow of branch l under certain load conditions without considering the voltage stability and other assumptions. If the above load constraint is loosened and only the generator output is considered, the extreme power flow of each branch can be calculated under the generator output limitation. Based on the P T D F symbol of each bus to branch l, buses can be divided into two groups: P T D F + and P T D F . If the P T D F of the generator bus is positive, the generator output of this bus is set as the maximum. Considering that the increase in both the bus load and the generator output will increase the burden of the branch power flow since h l , n < h l , min , if the P T D F of the generator bus is negative, the generator output of this bus is also set as the maximum. Thus, Equation (19) can be transformed into
P 2 L l * = h l , min · D 1 + m = 1 N G + h l , m + · P G m , max + n = 1 N G h l , n · P G n , max D 1 = m = 1 N G + P G m , max + n = 1 N G P G n , max
where N G + and N G denote the number of generator buses when the P T D F is positive or negative, respectively.
In the extreme case where only the branch power flows at the upper and lower limit of the generator output are considered, the solution results of Equations (19) and (20) can be related as P 1 L l * P 2 L l * . If P 2 L l , t * < P L l , max , branch l is unlikely to be congested under any circumstances, and it can be removed from the set of the alternative potential congested branches. Although only the forward flow is considered in the above case, the same is true for the reverse flow.
Strategy 2: Although Equation (20) can remove the branches that will definitely not be congested, it does not consider the influence of the load distribution in each period and the network constraints of other branches on the congested branch identification. Consider the following problem:
P 3 L l , t * = max P G i , t , z i , t i = 1 N G h j , i · P G i , t k = 1 N d h j , k · P d k , t s . t . i = 1 N G P G i , t = k = 1 N d P d k , t = D t z i , t P G i , min P G i , t z i , t P G i , max P L , max l H l · P i n l , t P L , max l P i n l , t = P G , t P d , t z i , t 0 , 1
where P i n l , t denotes the column vector of the bus power injection, and z i , t denotes the start-stop state variable of generator bus i at time t.
Equation (21) is a mixed-integer programming problem where the maximum power flow of branch l can be obtained by P 3 L l , t * that considers the network constraints of branches except branch l and the total load at time t. If P 3 L l , t * is still less than the transmission capacity limitation of branch l without considering the transmission capacity of branch l, branch l is a non-congested branch in this case and can be removed from the set of the alternative potential congested branches. However, the linear mixed integer programming problems for the number of all branches must be solved to obtain the set of the potential congested branches based on the above method. Considering that there are tens of thousands of transmission lines in a large-scale power grid, it will be very time-consuming to solve numerous mixed-integer programming problems. Thus, Equation (21) is simplified as
P 4 L l , t * = max P G i , t , z i , t i = 1 N G h j , i · P G i , t k = 1 N d h j , k · P d k , t s . t . i = 1 N G P G i , t = k = 1 N d P d k , t = D t 0 P G i , t z i , t P G i , max P L , max l H l · P i n l , t P L , max l P i n l , t = P G , t P d , t
Since P 3 L l , t * P 4 L l , t * , branch l will not be congested if P 4 L l , t * < P L l , max .
Strategy 3: The economic dispatching problem of power system has a feasible solution only when the generator output can meet the load demand, so there is an integer m ( 1 < m < N G ) such that
i = 1 m 1 P G i , max D t i = 1 m P G i , max
If Equation (21) has a feasible solution and satisfies Equation (23), it also satisfies
P i , t * = P G i , max i m 1 D t i = 1 m 1 P G i , max i = m 0 i > m
To obtain the maximum power flow of branch l, the corresponding PTDFs of each generator bus are sorted and the generator outputs are superimposed successively, as shown in Figure 2.
Thus, the power flow of branch l can be obtained:
P 5 L , l * = k = 1 m 1 ( h l , i k h l , i m ) P G k , max + h l , i m D t d = 1 N d P d , t · h l , d
If P 5 L , l * is less than the transmission capacity of branch l, it can be removed from the set of the alternative potential congested branches.

4.1.2. Comparison Discrimination Strategy

The maximization discrimination strategy is designed based on the transmission capacity limitation to discriminate whether the branch is likely to be congested and exclude the one that is unlikely to be congested. There may be a possibility whether some branches are congested depends on whether other branches are congested. For example, some branches may be congested only after some other branches are congested. In economic dispatching of power system, the objective of the transmission capacity limitation is to ensure the safe operation of power system. If a branch is congested, its power flow will be set as the upper limit of the transmission capacity to prevent another branch from being congested. Therefore, this branch can be removed from the set of the alternative potential congested branches since there is no transmission congestion after a certain branch is congested. To compare different transmission lines, the normalized PTDF is defined as
h n o r m , l i = h l , i P L l , max l = 1 , 2 , , N L i = 1 , 2 , , N G
The normalized transmission power constraint is expressed as
i = 1 N G h n o r m , l i · P G i + l = 1 N d h n o r m , l i · ( P d l ) 1
As mentioned above, P T D F reveals the sensitivity of the impact of the bus power injection on the branch power flow that is not sensitive to the change of the power injection at the bus corresponding to a smaller P T D F . Therefore, if the normalized P T D F s of bus i to branches p and q are both positive or both negative and satisfy h n o r m , p i h n o r m , q i , branch p may only be congested after branch q is congested. In this case, branch q prevents branch p from being congested and branch p can be removed from the set of the alternative potential congested branches.

4.2. Congested Branch Identification Procedure

The above two strategies discuss different cases of possible transmission congestion, which can be described by the Venn diagram, as shown in Figure 3. Both of the two strategies can identify the branches that are inactive constraints and there is an intersection between their identification results (i.e., the color mixing area where two circles meet in Figure 3). The difference between the area of the set of all branches and the purple-yellow area is the area of the set of the potentially congested branches (i.e., the cyan area in Figure 3). Based on these two strategies, the identification procedure of the potential congested branches is shown in Figure 4, where we search for the potential congested branches from different granularity by gradually reducing the search range of the branches according to the size of the feasible region.
First, only the generator output limitation is considered and the maximum power flow of each branch in the extreme case is calculated by Equation (20) to exclude the branches that are unlikely to be congested under any circumstances. Then, the maximum power flow of each branch in the remaining ones under the predicted load value of each period is calculated by Equation (25) and compared with the transmission capacity by Equation (27) to further exclude the branches that are unlikely to be congested in the current operation state. If a more granular discrimination is needed, the linear programming problem is solved for the remaining branches by Equation (22), and the feasible region of the problem is reduced by comprehensively considering a variety of factors such as the power grid structure, the predicted load value, and the generator output limitation to discriminate whether the branch is likely to be congested. Finally, the set of the potential congested branches is obtained by calculating the normalized PTDF of each branch based on the relationship between the parameters of different branches to exclude the branches that are likely to be congested only after other branches are congested.

5. Power System Zone Partitioning Method

5.1. Graph-Based Zone Partitioning Model

To describe the complex topology structure, power system can be abstracted as an unweighted sparse connected graph. Although the graph can reveal the topological characteristics and connection relationship of power system, it fails to reveal the closeness of the connection between buses. However, a graph with weights can compensate for this and represent the actual operation state of power system. Based on the application scenario, power system can be abstracted as an undirected weighted connected graph by selecting appropriate similarity measure as the weight.
The traditional weighted connected graph of power system takes the electrical distance as the measure criterion, which is not suitable for revealing the difference between buses caused by transmission congestion. Transmission congestion has a direct impact on the bus price of power system, which generates a congestion component in the price of different buses. Since the difference between LMPs can be transformed into the difference of P T D F s between buses, we choose the P T D F s corresponding to the congested branches as the similarity measure to construct the undirected weighted connected graph of power system. In the following we will derive the similarity measure between buses based on PTDF from the perspective of LMP.
Locational marginal price (LMP) refers to the economic cost that meets the bus load demand of power system under the cost-optimal condition when the load is increased by one unit at a certain bus. LMP is a power price mechanism widely used in the power market, which can reveal the economic benefit of power system [34]. In the DC power flow model, if there is no transmission congestion, the price at each bus is the same; otherwise, the price at each bus is different to some extent: the price in areas with surplus power generation is lower while the price in areas with scarce power generation is higher. Therefore, LMP can reveal not only the economic difference between buses, but also the transmission congestion. Consider the following problem:
min P T P G s . t . e T ( P G P d ) = 0 H ( P G P d ) P L , max P G , min P G P G , max
where P denotes the power purchase cost, and e denotes the unit vector. The Lagrange function of Equation (28) is
Γ = P T P G + λ e T ( P G P d ) μ T [ H ( P G P d ) P L , max ] + τ ^ T ( P G P G , max ) + τ ˇ T ( P G , min P G )
where λ , μ , τ ^ , τ ˇ denote the Lagrange multipliers of the power balance equation, the transmission line constraint, and the generator output constraint, respectively.
For the generator bus, the optimality condition is
Γ P G i = P i λ + i j Ω μ i j H i j , k = 0
Without considering the network loss, LMP only includes the energy component and the congestion component:
L M P k = λ i j Ω H i j , k μ i j
When the branch flow exceeds the limit, i.e., the branch is congested, there is a difference in the price between buses, which can be expressed as
L M P m L M P n = i j Ω H i j , n μ i j i j Ω H i j , m μ i j = ( H n T H m T ) μ
where H i denotes the column vector of the PTDF of bus i to each branch, μ denotes Lagrange multiplier vector corresponding to the transmission power constraint of L × 1 -dimensional transmission lines, and L denotes the number of branches.
According to Equation (32), if the branch is congested, μ is a non-zero vector and there is a difference between LMPs; otherwise, μ is a zero vector and LMPs are the same. Therefore, LMP can reveal the transmission congestion. Since the difference between LMPs is proportional to the PTDF, PTDF can reveal the impact of transmission congestion on power system indirectly. PTDF does not change with the operation state and only depends on the power grid structure, based on which relatively stable zone partitioning results can be obtained. In addition, the PTDF symbols of the two buses at both ends of the congested branch to this branch are opposite. Because of the large difference between these two buses, all the congested branches can be ensured to be placed at the boundaries of the zones when power system is partitioned.
Since the non-congested branches have little impact on the economic operation of power system, we only focus on the congested branches. Based on the transmission congestion identification scheme proposed in Section 4, the set of the potential congested branches can be obtained. Based on the P T D F s corresponding to the potential congested branches, the P T D F matrix for the key branches can be constructed as
H c = h c 1 , 1 h c 1 , 2 h c 1 , 3 h c 1 , n h c 2 , 1 h c 2 , 2 h c 2 , 3 h c 2 , n h c 3 , 1 h c 3 , 2 h c 3 , 3 h c 3 , n h c l , 1 h c l , 2 h c l , 3 h c l , n
Since spectral clustering is sensitive to the selection of scale parameters, the branch weights are constructed based on the Gaussian function of adaptive scale [35] to eliminate the influence of scale parameters:
s i j = exp ( H c , i H c , j 2 / ( σ i σ j ) )
where σ i = d ( h c , i , h c , k ) denotes the scale parameter, i.e., the distance between bus i and the nearest neighbor bus k, and H c , i denotes the ith column of H c .
According to Equation (34), the greater the weight between buses i and j, the closer the connection between buses i and j. After the branch weights are assigned, the power grid topology can be transformed into an undirected weighted graph G = ( V , E ) , where V = v 1 , v 2 , , v n denotes the set of all buses in the power grid, v i denotes the ith bus, n denotes the total number of buses, E = e 1 , e 2 , , e m denotes the set of all branches in the power grid, e i denotes the ith branch, m denotes the total number of branches, and E V × V . The branch weights can be represented by an adjacent matrix:
W = w 11 w 1 n w n 1 w n n
which includes the following relationships:
(a)
w j i = w i j , i.e., graph G is undirected and matrix W is symmetric.
(b)
If e i , e j E , the corresponding branch weight is w i j = 0 ; otherwise, w i j = s i j .
(c)
The diagonal elements of matrix W represent the degrees in graph theory, which are denoted as w i i = j = 1 N w i j .

5.2. Improved Spectral Clustering Algorithm
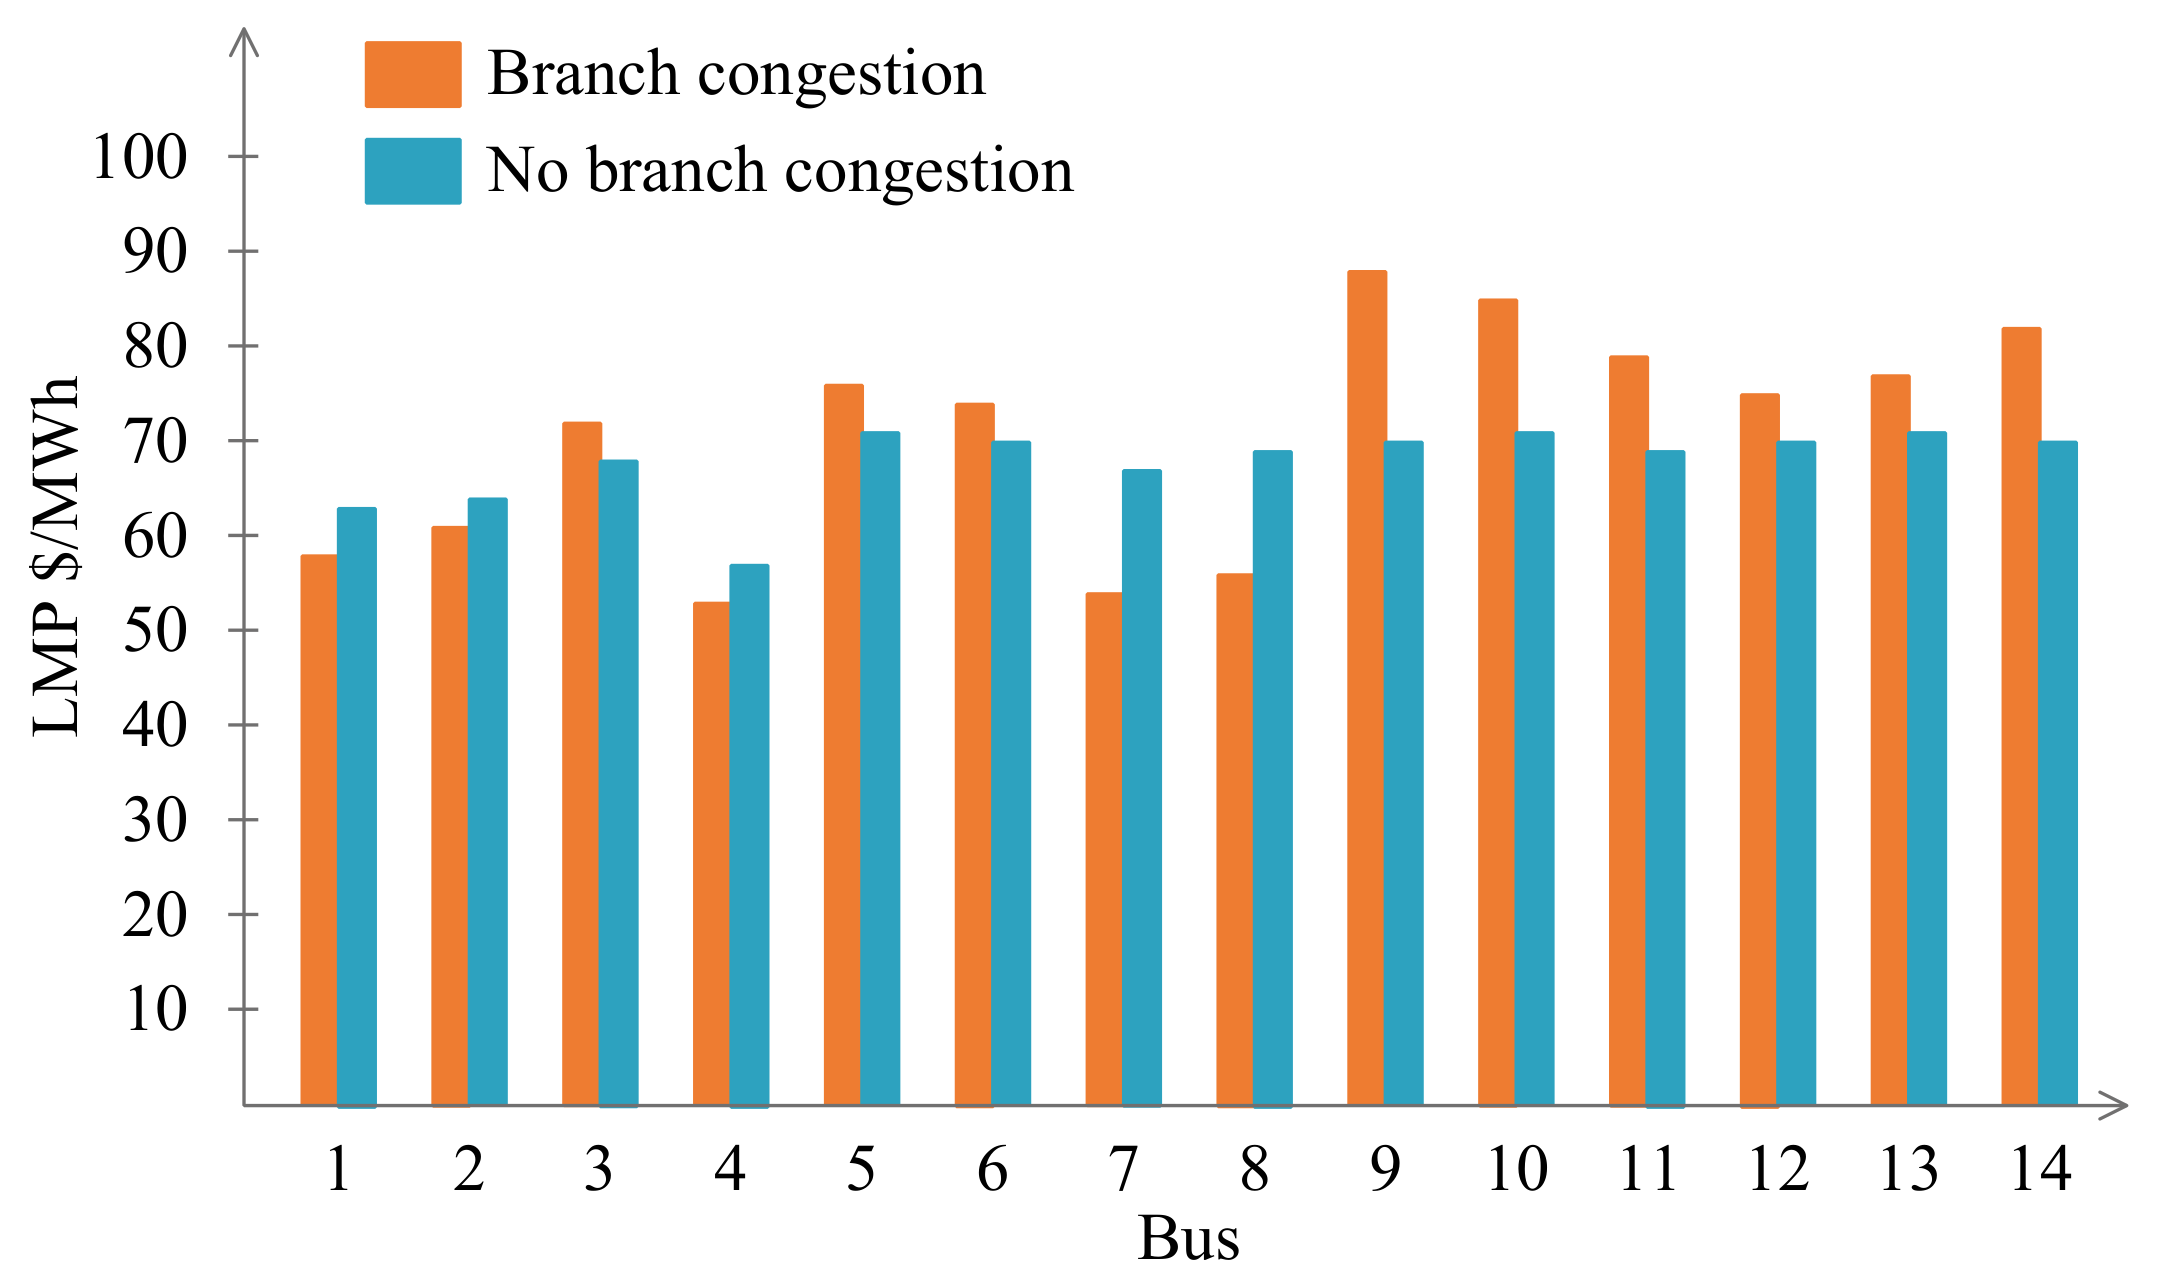
Since there is no reference target for each bus before zone partitioning, power system zone partitioning is a typical unsupervised learning problem that can be solved by the clustering algorithm. The purpose of clustering is to divide different objects into classes and ensure that the characteristics of objects in the same class are similar while those in different classes are quite different. Although traditional clustering algorithms like the k-means algorithm [14] and EM algorithm [36] are simple but suitable for the convex sample space, they can easily fall into local optimization with unstable clustering results for the non-convex sample space. In addition, some of these clustering algorithms like k-means are sensitive to the initial values. However, the spectral clustering algorithm can converge to the global optimal solution without being limited by the sample space type [12]. Therefore, we use the spectral clustering algorithm to solve the zone partitioning problem.
The spectral clustering algorithm first constructs a vertex set V where each sample data is regarded as a vertex, then an edge set E based on the relationship between sample data, and finally an undirected weighted graph G = ( V , E ) after each edge is weighted based on the similarities between sample data. Thus, the clustering problem of the sample data can be transformed into a subgraph segmentation problem of graph G. Suppose that graph G is segmented into k independent subgraphs, the cut of G m and G n based on graph theory can be expressed as
C ( G m , G n ) = i G m , j G n w i j
The sum of the weights of the edges connecting two independent subgraphs can be obtained by the cut of graph G, which can be used to measure the similarity between the two subgraphs. After the graph is segmented, the weight between each subgraph should be lower and the similarity of the vertices in the same subgraph should be higher. Based on the multiway normalized cut criterion [37], the objective function of power system zone partitioning can be expressed as
min G 1 , G 2 , , G k G C ( G 1 , G G 1 ) C ( G 1 , G ) + C ( G 2 , G G 2 ) C ( G 2 , G ) + + C ( G k , G G k ) C ( G k , G )
where G G i denotes the rest of graph G excluding the subgraph G i . This objective function can prevent power system from being partitioned into zones that contain only a few buses and obtain relatively stable zone partitioning results with similar zone size.
By adding the elements of each row of the adjacent matrix of the undirected weighted graph of power system, a diagonal matrix D can be obtained, which is called the degree matrix:
D = w 11 = j = 2 , , n w i j 0 0 0 w 22 = j = 1 , 3 , , n w i j 0 0 0 0 0 w n n = j = 1 , 2 , , n 1 w i j
The normalized Laplace matrix is constructed as
L s y m = 1 i = j w i j d i d i i j 0 otherwise
L s y m = D 1 / 2 LD 1 / 2 , L = D W
where d i denotes the element in row i of matrix D , and w i j denotes the weight between buses i and j.
The graph-based power system zone partitioning problem is essentially an NP-hard problem. However, spectral clustering can transform this problem into a P-hard problem by solving the spectral decomposition of the Laplace matrix. The zone partitioning results can be obtained by the k-means algorithm based on the eigenvectors corresponding to the first k smallest eigenroots of the normalized Laplace matrix L s y m . The procedure of the spectral clustering algorithm is as follows:
Step 1: Determine the number of zones as k and build the graph model of the sample data based on the similarity measure.
Step 2: Calculate the adjacent matrix W , the degree matrix D and the normalized Laplace matrix L s y m .
Step 3: Solve the eigenvectors of the normalized Laplace matrix L s y m and extract the first k eigenvectors to construct the normalized matrix T .
Step 4: Divide the objects into k classes based on the row vectors of matrix T by the k-means algorithm.
Owing to the disadvantage that the k-means algorithm is sensitive to the initial values, there must be great uncertainty in selecting the initial clustering center when the sample data are divided into k classes by the k-means algorithm. The concentration of the initial cluster center in a certain area is not conducive to sample data clustering. To eliminate the influence of the uncertainty of the initial clustering centers on clustering results, we improve this traditional spectral clustering algorithm based on k-means++ [16] by classifying the first k eigenvectors. The procedure of the improved spectral clustering algorithm is as follows:
Step 1: Select a random sample data x 1 as the first cluster center.
Step 2: Calculate the distance D ( x i ) from the other data point x i to the cluster center x 1 .
Step 3: Compare the distance D ( x i ) of each data point to select the one with the largest distance as the new cluster center.
Step 4: Repeat step 2 and step 3 until the number of cluster centers reach k.
Step 5: Classify the k initial clustering centers by the k-means algorithm.
Based on the k-means++ algorithm, more stable clustering results can be obtained by selecting the initial clustering centers with the largest difference. In summary, we measure the similarities between buses by the PTDFs corresponding to the congested branches to construct the undirected weighted graph of power system, and then partition power system into zones with the potential congested branches placed at the boundaries of the zones by the k-means++ algorithm. The procedure of the power system zone partitioning method is shown in Figure 5, which can be written as
Step 1: Create the potential congested branch set C based on the transmission congestion identification scheme.
Step 2: Calculate the PTDF matrix of power system to extract the matrix H c corresponding to set C.
Step 3: Measure the similarity w i j between buses to construct the undirected weighted graph G = ( V , E ) of power system based on Equation (34).
Step 4: Calculate the adjacent matrix W , the degree matrix D , and the normalized Laplace matrix L s y m based on Equations (35) and (38).
Step 5: Extract the first k eigenvectors of matrix L s y m to construct the normalized matrix T .
Step 6: Take each row of the normalized matrix T as a vector in the k-dimensional space and classify them by the k-means++ algorithm to partition power system into k zones.

6. Evaluation

To demonstrate our proposed method, simulations are performed based on IEEE 14 and IEEE 39 systems using the MATPOWER simulator [38], respectively. Suppose that the predicted load values have been obtained in advance and the load power variation is not considered owing to the slight change of the loads. First, we identified the potential congested branches in the operation of power system by the maximization discrimination strategy in the case where only the transmission capacity limitation of the generator bus was considered in discriminating whether the branch was likely to be congested and the maximum power flows of branches in the extreme case were calculated based on Equation (20). The results are shown in Figure 6.
By analyzing the two curves in Figure 6, we found that branches 6–11 and 9–14 under the current generator output limitation were still less than their transmission capacity limitations. This indicated that the transmission abundance of these two branches was high and transmission congestion could not occur. Therefore, these two branches could be excluded from the set of the potential congested branches, and then the possibility of other branches being congested could be considered. After the PTDFs corresponding to each branch were arranged in ascending order and descending order, respectively, the maximum forward and reverse power flows of the branches under the generator output limitation were calculated based on Equation (25). The results are shown in Table 1.
By comparing the larger one in the absolute values of the maximum forward and reverse power flows of the branches and the transmission capacity limitation, the set of the potential congested branches could be obtained by the maximization discrimination strategy. We could find from Table 1 that branches 1–2, 1–5, 2–3, 2–4, 2–5, 3–4, 4–7, 4–9, 6–12, 6–13, 7–8, 9–10, 10–11, 12–13, and 13–14 did not exceed the transmission capacity limitation. This indicated that these branches were unlikely to be congested under the current load condition.
Then, we analyzed the remaining branches based on the comparison discrimination strategy. We calculated the normalized PTDFs based on Equation (26) and classified the branches according to the PTDF symbol, i.e., the PTDF symbol of each bus corresponding to the branch was the same in the same class. The results are shown in Table 2.
Since only the PTDF symbols of buses to the corresponding branches in class I were the same, we analyzed the normalized PTDFs corresponding to this class of branches. When the load was fixed, the smaller absolute value of the normalized PTDFs had less impact on the branch power flows such that the corresponding branches could be excluded from the set of the potential congested branches. Through comparison, we could see that the normalized PTDFs of branch 1–2 were greater than those of branch 1–5, which made branch 1–2 obstruct the transmission congestion of branch 1–5, so branch 1–5 was excluded from the set of the potential congested branches.
The identification results based on the maximization discrimination and comparison discrimination strategies are shown in Figure 7, where the non-congested branches identified by the comparison discrimination strategy are a subset of the non-congested branches identified by the maximization discrimination strategy. All the inactive constraints could be obtained by the union set of the two strategies, which represented the set of the non-congested branches. We could find from Figure 7 that only branches 4–5, 5–6, and 7–9 were likely to be congested in the current operation state of power system, which represented the set of the potential congested branches. In this case study, only the identification results of the congested branches in a period were considered. However, the branches that were likely to be congested in a certain cycle could be obtained by the union of the sets of the potential congested branches in each period.
We constructed the undirected weighted graph of power system after the PTDF matrix H c corresponding to the potential congested branches was extracted to measure the similarities between buses. Based on the graph model, we partitioned the IEEE 14 system into three zones by the k-means++ algorithm. The results are shown in Figure 8.
We calculated the LMPs under the current generator quotation, as shown in Figure 9, where branches 4–5 and 7–9 were congested and branch 5–6 was not. We could see from Figure 9 that if the network constraints were considered, LMPs were the same; otherwise, LMPs were different owing to the transmission congestion. However, LMPs were similar in the same zone, which was in line with the purpose of zone partitioning. The price of the zone including bus 4 was lower because it was a power surplus zone with no load bus, while the price of the zone including bus 11 was higher because it had more load buses and fewer generator buses. In the later case, the expansion of generator construction and the increase of transmission capacity to introduce external power were usually required.
To compare the zone partitioning results of the improved spectral clustering algorithm (k-means++) and the traditional spectral clustering algorithm (k-means), another case study is performed based on IEEE 39 system whose topology is shown in Figure 10, where branches 3–4, 8–9, 14–15, and 16–17 are assumed to be the congested branches. We partitioned the IEEE 39 system into four zones by these two algorithms, respectively. The results are shown in Table 3.
We could see from Table 3 that there was a significant difference between the zone partitioning results by the two algorithms. The k-means algorithm divided buses 15 and 17 with buses 1, 9, and 39 into the same class (i.e., class IV in solution 1) without considering the connection relationship of power system. However, the topology of IEEE 39 system in Figure 10 showed that buses 15 and 17 were not connected to other nodes in class IV, which indicated that they should not be divided into the same class. Since our proposed method converted the zone partitioning problem into a graph segmentation problem considering the connection relationship of power system, the zone partitioning results were more reasonable based on the k-means++ algorithm. In addition, the zone partitioning results obtained by the k-means algorithm were unstable because the random selection of the initial cluster centers affected the final zone partitioning results. However, the k-means++ algorithm had been tested many times without such problem, which confirmed the stability of the zone partitioning results based on our proposed method.

7. Conclusions

In this paper, we propose a power system zone partitioning method that considers the regional influence of transmission congestion and improves the traditional spectral clustering algorithm. First, we introduce the concept of PTDF and take it as an essential index of zone partitioning. Next, we propose an analytical method to identify the congested branches where the transmission congestion identification problem is transformed into an analytical problem that is easy to solve by simplifying the solution model from different granularity based on the active set theory. Then, we design the transmission congestion identification scheme including the maximization discrimination and comparison discrimination strategies. Combined with the identification results of the two strategies, the set of the potential congested branches is obtained. Finally, we partition the system into zones by the k-means++ algorithm after the PTDFs corresponding to the potential congested branches are extracted as the similarity measure to construct the undirected weighted graph of power system. The zone partitioning results by our proposed method can reveal regional price signals and potential transmission congestion, which contribute to the decision-making of regional operation management and the guidance of reasonable resource allocation.

Author Contributions

Conceptualization, Y.H.; methodology, Y.H. and P.X.; software, Y.H. and W.S.; validation, P.X.; formal analysis, W.K.; investigation, Y.X.; resources, P.X.; data curation, P.X.; writing—original draft preparation, Y.H.; writing—review and editing, Y.H., W.K. and P.Z.; visualization, Y.H. and W.S.; supervision, P.Z.; project administration, Y.X.; funding acquisition, P.X., W.K., P.Z. and Y.X. All authors have read and agreed to the published version of the manuscript.

Funding

This research was supported by NSFC (61572514), Hunan NSF (2020JJ5621), Changsha NSF (kq2007088), High-tech Industry Sci. and Tech. Innovation Leading Plan (2020GK2029), Fund of Hunan Education Department (19C0160, 20B064), Fund of Hunan Key Lab. of Network Investi. Tech. (2020WLZC003), Research Plan of National University of Defense Technology (ZK21-41), and Key Laboratory of Police Internet of Things Application Ministry of Public Security. People’s Republic of China.

Conflicts of Interest

The authors declare no conflict of interest.

References

  1. Byk, F.; Frolova, Y.; Myshkina, L. The efficiency of distributed and centralized power system integration. In Proceedings of the International Conference of Young Scientists Energy Systems Research 2019, Irkutsk, Russia, 27–30 May 2019; p. 05007. [Google Scholar]
  2. Feng, Z.k.; Niu, W.j.; Cheng, C.t. China’s large-scale hydropower system: Operation characteristics, modeling challenge and dimensionality reduction possibilities. Renew. Energy 2019, 136, 805–818. [Google Scholar] [CrossRef]
  3. Iris, Ç.; Pacino, D.; Ropke, S.; Larsen, A. Integrated berth allocation and quay crane assignment problem: Set partitioning models and computational results. Trans. Res. Part E Logist. Transp. Rev. 2015, 81, 75–97. [Google Scholar] [CrossRef] [Green Version]
  4. Monteiro, M.R.; Alvarenga, G.F.; Rodrigues, Y.R.; de Souza, A.Z.; Lopes, B.; Passaro, M.C.; Abdelaziz, M. Network partitioning in coherent areas of static voltage stability applied to security region enhancement. Int. J. Electr. Power Energy Syst. 2020, 117, 105623. [Google Scholar] [CrossRef]
  5. Barroso, L.; Rudnick, H. The future power system: Centralized, distributed, or just integrated?[guest editorial]. IEEE Power Energ. Mag. 2019, 17, 10–14. [Google Scholar] [CrossRef]
  6. Finney, J.D.; Othman, H.A.; Rutz, W.L. Evaluating transmission congestion constraints in system planning. IEEE Trans. Power Syst. 1997, 12, 1143–1150. [Google Scholar] [CrossRef]
  7. Del Granado, P.C.; Wallace, S.W.; Pang, Z. The value of electricity storage in domestic homes: A smart grid perspective. Energy Syst. 2014, 5, 211–232. [Google Scholar] [CrossRef]
  8. Zhang, K.; Li, J.; He, Z.; Yan, W. Microgrid energy dispatching for industrial zones with renewable generations and electric vehicles via stochastic optimization and learning. Physica A 2018, 501, 356–369. [Google Scholar] [CrossRef]
  9. Del Granado, P.C.; Pang, Z.; Wallace, S.W. Synergy of smart grids and hybrid distributed generation on the value of energy storage. Appl. Energy 2016, 170, 476–488. [Google Scholar] [CrossRef] [Green Version]
  10. Iris, Ç.; Lam, J.S.L. A review of energy efficiency in ports: Operational strategies, technologies and energy management systems. Renew. Sustain. Energy Rev. 2019, 112, 170–182. [Google Scholar] [CrossRef]
  11. Iris, Ç.; Lam, J.S.L. Optimal energy management and operations planning in seaports with smart grid while harnessing renewable energy under uncertainty. Omega 2021, 103, 102445. [Google Scholar] [CrossRef]
  12. Sánchez-García, R.J.; Fennelly, M.; Norris, S.; Wright, N.; Niblo, G.; Brodzki, J.; Bialek, J.W. Hierarchical spectral clustering of power grids. IEEE Trans. Power Syst. 2014, 29, 2229–2237. [Google Scholar] [CrossRef] [Green Version]
  13. Challa, A.; Danda, S.; Sagar, B.D.; Najman, L. Power spectral clustering. J. Math. Imaging Vis. 2020, 62, 1195–1213. [Google Scholar] [CrossRef]
  14. Likas, A.; Vlassis, N.; Verbeek, J.J. The global k-means clustering algorithm. Pattern Recognit. 2003, 36, 451–461. [Google Scholar] [CrossRef] [Green Version]
  15. Duthaler, C.; Emery, M.; Andersson, G.; Kurzidem, M. Analysis of the use of Power Transfer Distribution factors (PTDF) in the UCTE transmission grid. In Proceedings of the Power System Computation Conference, Glasgow, UK, 14–18 July 2008. [Google Scholar]
  16. Arthur, D.; Vassilvitskii, S. k-means++: The advantages of careful seeding; Technical report; Stanford University: Stanford, CA, USA, 6 June 2006. [Google Scholar]
  17. McArthur, S.D.; Taylor, P.C.; Ault, G.W.; King, J.E.; Athanasiadis, D.; Alimisis, V.D.; Czaplewski, M. The Autonomic Power System-Network operation and control beyond smart grids. In Proceedings of the 2012 3rd IEEE PES Innovative Smart Grid Technologies Europe (ISGT Europe), Berlin, Germany, 14–17 October 2012; pp. 1–7. [Google Scholar]
  18. Mori, H.; Takeda, K. Parallel simulated annealing for power system decomposition. In Proceedings of the Conference Proceedings Power Industry Computer Application Conference, Scottsdale, AZ, USA, 4–7 May 1993; pp. 366–372. [Google Scholar]
  19. Hu, Z.C.; Wang, X.F.; Wang, X.L.; Chen, H.Y. A two-layered network partitioning approach for optimal reactive power dispatching. Power Syst. Technol. 2005, 29, 37–41. [Google Scholar]
  20. Chang, C.; Lu, L.; Wen, F. Power system network partitioning using tabu search. Electr. Power Syst. Res. 1999, 49, 55–61. [Google Scholar] [CrossRef]
  21. Liu, D.; Tang, G. Tabu search based network partitioning for voltage control. Autom. Electr. Power Syst. 2002, 26, 18–22. [Google Scholar]
  22. Yan, W.; Gao, F.; Wang, F. An optimal network partitioning algorithm for reactive power and voltage control considering subareaal reactive power margin. Power Syst. Technol. 2015, 39, 61–66. [Google Scholar]
  23. Xiong, H.G.; Cheng, H.Z.; Kong, T. Network partitioning for reactive power/voltage control based on immune-ventral point clustering algorithm. Autom. Electr. Power Syst. 2007, 31, 22–26. [Google Scholar]
  24. Guo, Q.L.; Sun, H.B.; Zhang, B.M.; Wu, W.C. Power network partitioning based on clustering analysis in Mvar control space. Autom. Electr. Power Syst. 2005, 29, 36–40. [Google Scholar]
  25. Zhao, J.; Liu, F.; Deng, Y.; Li, K.; Fang, Z.; Huang, W. Network partitioning for reactive power/voltage control based on a mapping division algorithm. Autom. Electr. Power Syst. 2010, 34, 36–39. [Google Scholar]
  26. Chen, H.H.; Yun, Y.Z.; Xing, W.Y.; Hu, X. A novel strategy of network partitioning for load node in power systems using spectral clustering. Power Syst. Prot. Control 2013, 41, 47–53. [Google Scholar]
  27. Li, L.I.; Zihao, F.U.; Sun, L.; Yang, Y.; Tan, Y.; Lin, Z.; Wen, F. Black-start zoning strategy based semi-supervised spectral clustering algorithm. Electr. Power Constr. 2017, 38, 9–17. [Google Scholar]
  28. Zhang, R.; Wang, D.; Yun, W.Y. Power-grid-partitioning model and its tabu-search-embedded algorithm for zonal pricing. IFAC Proc. Volumes 2008, 41, 15927–15932. [Google Scholar] [CrossRef] [Green Version]
  29. Hong, Y.R.; Kang, C.Q.; Xia, Q.; Jiang, J.J. Dynamic zonal pricing of power grid based on graph theory. Proc. CSEE 2005, 25, 1–7. [Google Scholar]
  30. Raza, S.; Mokhlis, H.; Arof, H.; Laghari, J.; Mohamad, H. A sensitivity analysis of different power system parameters on islanding detection. IEEE Trans. Sustain. Energy 2015, 7, 461–470. [Google Scholar] [CrossRef]
  31. Buyya, R.; Vazhkudai, S. Compute power market: Towards a market-oriented grid. In Proceedings of the Proceedings First IEEE/ACM International Symposium on Cluster Computing and the Grid, Brisbane, Australia, 15–18 May 2001; pp. 574–581. [Google Scholar]
  32. Singh, H.; Hao, S.; Papalexopoulos, A. Transmission congestion management in competitive electricity markets. IEEE Trans. Power Syst. 1998, 13, 672–680. [Google Scholar] [CrossRef]
  33. Musicant, D.R.; Feinberg, A. Active set support vector regression. IEEE Trans. Neural Networks 2004, 15, 268–275. [Google Scholar] [CrossRef]
  34. Conejo, A.J.; Castillo, E.; Mínguez, R.; Milano, F. Locational marginal price sensitivities. IEEE Trans. Power Syst. 2005, 20, 2026–2033. [Google Scholar] [CrossRef]
  35. Song, Y.; Peng, G.; Sun, D.; Xie, X. Active contours driven by Gaussian function and adaptive-scale local correntropy-based K-means clustering for fast image segmentation. Signal Process. 2020, 174, 107625. [Google Scholar] [CrossRef]
  36. Yang, M.S.; Lai, C.Y.; Lin, C.Y. A robust EM clustering algorithm for Gaussian mixture models. Pattern Recognit. 2012, 45, 3950–3961. [Google Scholar] [CrossRef]
  37. Meila, M.; Xu, L. Multiway Cuts and Spectral Clustering. 2003. Available online: http://citeseerx.ist.psu.edu/viewdoc/summary?doi=10.1.1.142.8591 (accessed on 4 August 2021).
  38. Zimmerman, R.D.; Murillo-Sánchez, C.E.; Gan, D. MATPOWER: A MATLAB Power System Simulation Package; Manual, Power Systems Engineering Research Center: Ithaca, NY, USA, 1997; Volume 1. [Google Scholar]
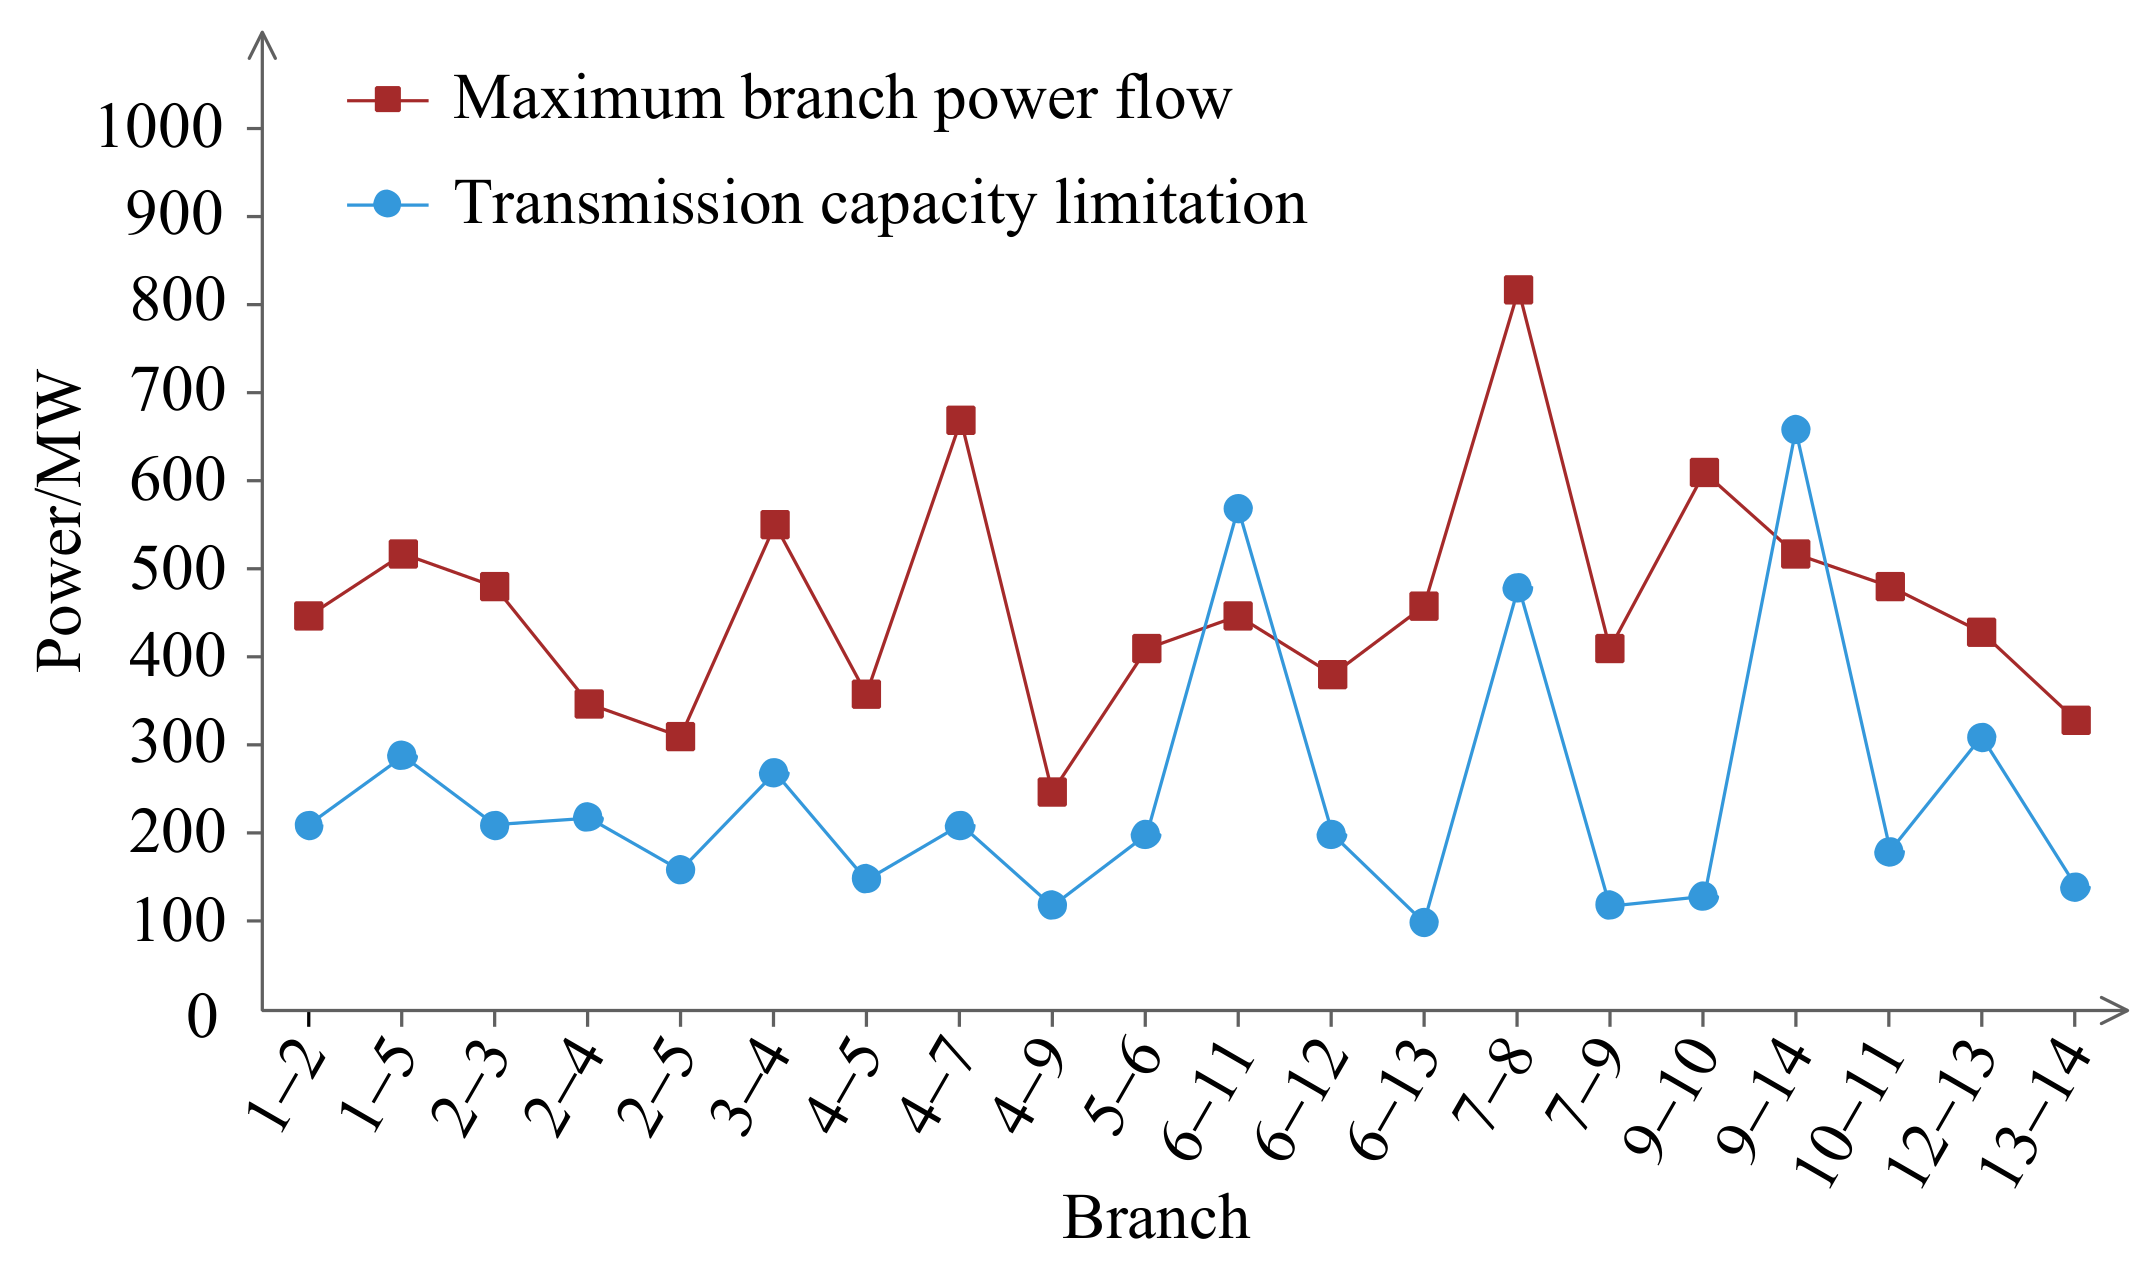
Figure 1. Formation of the feasible region.
Electronics 10 02126 g001
Figure 2. PTDF sequence of generator buses.
Electronics 10 02126 g002
Figure 3. Venn diagram based on two strategies.
Electronics 10 02126 g003
Figure 4. Transmission congestion identification procedure.
Electronics 10 02126 g004
Figure 5. Power system zone partitioning procedure.
Electronics 10 02126 g005
Figure 6. Maximum power flow of branches.
Electronics 10 02126 g006
Figure 7. Venn diagram of the potential congested branches.
Electronics 10 02126 g007
Figure 8. Zone partitioning result of IEEE 14 system.
Electronics 10 02126 g008
Figure 9. Locational marginal price (LMP) in the case of branches 4–5 and 7–9 being congested.
Electronics 10 02126 g009
Figure 10. Topology of IEEE 39 system.
Electronics 10 02126 g010
Table 1. Forward and reverse power flows of branches.
Branch1–21–52–32–42–53–44–54–74–95–6
Forward power flow181.2475.65104.54101.5277.47173.78−17.0598.3758.1493.57
Reverse power flow61.4541.2858.7841.4535.15−31.76−59.75−183.39−35.2142.37
Branch6–116–126–137–87–99–109–1410–1112–1313–14
Forward power flow71.3416.5248.6808.83−11.36−1.96−22.6412.0446.79
Reverse power flow25.1511.4325.31−340.13−39.85−60.04−32.86−69.425.2418.72
Table 2. Classification result of branches.
ClassBranch
I1–2, 1–5, 5–6
II2–3, 2–4, 2–5
III3–4, 4–7, 4–9
IV4–5, 7–9, 9–10, 9–14, 10–11
V6–11, 6–13, 13–14
Table 3. Zone partitioning results of IEEE 39 system based on two different algorithms.
ClassK-Means++K-Means (Solution 1)K-Means (Solution 2)
I4,5,6,7,8,10,11,
12,13,14,31,32
4,5,6,7,8,10,11,
12,13,14,31,32
4,5,6,7,8,10,11,
12,13,14,31,32
II2,3,17,18,25,26
27,28,29,30,37,38
2,3,18,25,26 27
28,29,30,37,38
2,3,17,18,25,26
27,28,29,30,37,38
III15,16,19,20,21,22
23,24,33,34,35,36
16,19,20,21,22,23
24,33,34,35,36
16,19,20,21,22,23
24,33,34,35,36
IV1,9,391,9,15,17,391,9,15,39
Publisher’s Note: MDPI stays neutral with regard to jurisdictional claims in published maps and institutional affiliations.

