Article

Active Sense: Early Staging of Non-Insulin Dependent Diabetes Mellitus (NIDDM) Hinges upon Recognizing Daily Activity Pattern

by
Erfanul Hoque Bahadur
1,
Abdul Kadar Muhammad Masum
1,
Arnab Barua
2 and
Md Zia Uddin
3,*
1
Department of Computer Science and Engineering, International Islamic University Chittagong, Chittagong 4210, Bangladesh
2
Department of Computer Science, Memorial University of Newfoundland, 230 Elizabeth Ave, St. John’s, NL A1C 5S7, Canada
3
Software and Service Innovation Department, SINTEF Digital, 0316 Oslo, Norway
*
Author to whom correspondence should be addressed.
Electronics 2021, 10(18), 2194; https://doi.org/10.3390/electronics10182194
Submission received: 16 June 2021 / Revised: 30 August 2021 / Accepted: 2 September 2021 / Published: 8 September 2021
(This article belongs to the Special Issue State-of-the-Art of Human Activity Recognition)

Abstract

:
The Human Activity Recognition (HAR) system allows various accessible entries for the early diagnosis of Diabetes as one of the nescient applications domains for the HAR. Long Short-Term Memory (LSTM) was applied and recognized 13 activities that resemble diabetes symptoms. Afterward, risk factor assessment for an experimental subject identified similar activity pattern attributes between diabetic patients and the experimental subject. Because of this, a trained LSTM model was deployed to monitor the average time length for every activity performed by the experimental subject for 30 consecutive days. Concurrently, the symptomatic diabetes activity patterns of diabetic patients were explored. The cosine similarity of activity patterns of the experimental subject and diabetic patients measured 57.39%, putting the experimental subject into moderate risk factor class. The experimental subject was clinically tested for risk factors using the diabetic clinical diagnosis process, known as the A1C. The A1C level was 6.1%, recognizing the experimental subject as a patient suffering from Diabetes. Thus, the proposed novel approach remarkably classifies the risk factor level based on activity patterns.

1. Introduction

The primary source of human nutrition is blood glucose. Insulin, a pancreatic hormone, allows glucose to reach human cells for energy intake. Sometimes, the human body does not make enough insulin; however, the body may not use insulin well. That being the case, glucose remains unused in the blood and does not enter the cells. With time, this can cause health issues due to too much glucose in the blood. Diabetes is a disorder that arises when blood glucose, commonly known as blood sugar, becomes too much.
Globally, Diabetes is a growing health concern, as the number of people suffering from Diabetes is increasing day by day. People who have Diabetes are more likely to be exposed to other medical issues. Unless Diabetes is not diagnosed and managed adequately to stabilize blood sugar levels, the risk of cardiovascular disease, including certain coronary artery diseases, heart attack, cortex, and blockage of the coronary arteries, may increase considerably. A significant peril of Diabetes is that it can trigger nerve damage, which is also known as neuropathy. Erectile dysfunction can also be ascribed to neuropathy. By procrastinating the diagnosis process, Diabetes can cause kidney damage, resulting in kidney failure and the need for renal transplants. Diabetes induces eye damage, also referred to as retinopathy, if the eye becomes too deteriorated before diabetes diagnosis. Over and above, Diabetes causes gastritis, which induces nausea, sprays, and stomach pain, causing the delay or avoidance of food movement in the intestines. Therefore, it is vitally important to recognize the early signs of Diabetes because it can become a chronic disease that threatens life. The above facts make it clear that Diabetes has a more significant impact if it is diagnosed late, and it should be controlled in the early stages to reduce its severity.
Except for specific symptoms, many diabetes symptoms can be so subtle that some people do not perceive them unless they acquire long-term disease casualties. Symptoms of type 2 diabetes are generally faster and often more catastrophic over several weeks or even months. The International Diabetes Federation revealed a worrying figure. They claimed that most adults in the UK could not name any of any symptoms indicating the early onset of Diabetes. They also affirmed that only 1 in 100 could spot any diabetes symptom and that only one in five could spot any of the significant diabetes symptoms. In the UK, 81% of adults were unable to identify weight loss, and 70% were unable to identify the slow healing of cuts and bruises as symptoms of Diabetes, which are regarded as major diabetes symptoms. In the blurred version, excessive thirst, and frequently using the bathroom, the recognition proportions were 67%, 31%, and 38%, respectively. Subsequently, 46% of people affected with Diabetes are undiagnosed in the UK. In the USA, there are 29.1 million people who have Diabetes, and one out of four of them do not know that they have Diabetes. Additionally, 86 million people, which is more than 32% of adults, have prediabetes.
Moreover, 91% of pre-diabetic patients overlook any symptoms of Diabetes. Diabetes is Australia’s seventh most frequent cause of illness and death. A total of 1.8 million Australians have Diabetes, including 1.3 million people who have been diagnosed, and an estimated 500,000 are undiagnosed.
The incidence of Diabetes disorder is becoming more common nowadays, but there is no cure available. One practical approach would be to have an early and accurate diagnosis of the disorder. Opportunistic pharmacological intervention is one diagnosing criterion that can be used before symptoms are identified. An oral glucose or fasting plasma glucose tolerance test is cumbersome and unpropitious. The A1C test, commonly referred to as the hemoglobin A1C or HbA1c test, is a standard test that examines the normal blood sugar levels used to diagnose prediabetes and Diabetes. It is costly and has notable problems in terms of standardization and performance. These tests are intense and involve training and experienced medical practitioners and laboratories to analyze samples, which are often challenging issues. Although several endeavours created paper and pencil screening tests for Diabetes that have been introduced, they remain ineffective, and their throughput varies widely from community to community [1]. Therefore, a consistent and reliable Point of Care (POC) capillary blood glucose test is recommended by the WHO to assess the risk factors in patients with irregular POC capillary blood glucose readings and monitor diabetes patients. This test has substantial benefits but also needs to be measured in terms of cost-effectiveness [2].
Diabetes is a major growing concern worldwide, as the number of people suffering from Diabetes is increasing day after day. New research on the projection of the overall expenditure for diagnosing Diabetes was released by the American Diabetes Association in 2018. The report provides a comprehensive breakdown of the costs along with the class, ethnicity, cultural lines, and state-by-state cost distribution. The overall projected expense of Diabetes was USD 327 billion in 2017, which was 26% more from previous figures of USD 245 billion in 2012. Undiagnosed Diabetes is often oriented towards potential adverse health conditions, diabetes complications, and associated cardiovascular diseases [3]. There may be additional financial implications for treating Diabetes and the chronic diseases associated with Diabetes. Diabetes puts considerable inflationary pressure on capital accumulation resources in the United States due to its growing incidence and elevated cost of treatment [4]. Roughly 20% of health care expenditure in the United States goes to Diabetes medication. An annual medical expenditure per capita is twice as much for a diabetes-free person [4]. Regardless of the age or type of Diabetes, the treatment often requires a transition period, increasing costs by a considerable margin. The Australian economy loses USD 14 trillion in diabetes-related expenditure annually. Therefore, should there be a contrivance to the early diagnosis of Diabetes to reduce the costs associated with the early diagnosis of Diabetes in a successful and resilient?
Based on early research, it is evident that Diabetes is negatively correlated with physical activities. Physical activities are identical to the daily tasks or actions that carry out other purposes. A phenomenological or meaningful pattern of body motions is comprised of human activities. Different human activities impair the life of a human being in various ways. Some activities are associated with cardiovascular endurance. Jogging, walking, cycling, walking upstairs, and walking downstairs are the commonly mentioned names of such activities. Conversely, drinking, eating, and using the toilet are associated with preserving the log concerning excretion. Furthermore, activities such as falling down make it easier to identify weaknesses. In addition, the discerning of an indication that these activities linked with type 2 diabetes, or NIDDM, is enhanced through activities including lying down, standing up, itching the genitals, and sitting. From previous studies, it can be seen that human activities certainly influence the development of NIDDM.
Where possible, public health service allocations should be focused on accurate assessments of an individual’s health condition, the incidence of disease, injury, and disability, their prevention, and the related costs. For instance, if the everyday life reflects a low level of exercise performance, a person will become obese in the future. Physical activity involves all movement to improve energy usage, while physical exercise is scheduled and organized [5]. Physical activities significantly stimulate the regulation of the blood glucose in Diabetes mellitus, enhance cardiovascular health conditions, increase the tendency of losing more weight, and enhance the possibly the achieving best-being. Experts advocate physical exercise to patients with Non-Insulin-Dependent Diabetes Mellitus (NIDDM) because it promotes insulin susceptibility [6]. Additionally, recommendations for physical activity and aerobic exercise should indeed be tailored to the individual’s particular preferences. Without weight decrease or little exercise, 15–30% of people living with prediabetes will be diagnosed with type 2 diabetes within five years. The risk of dying of Diabetes for adolescents is 50 times greater than it is for diabetes-free adolescents, and the cost to individuals with Diabetes is half as high as it is for individuals without Diabetes with an early diagnosis. More physical activity can create a safeguard against the growth of NIDDM by contributing to the maintenance of a fat balance.
As disclosed here, human activity comprises considerable sequences produced by the body parts. If a similar dataset can be developed, the detection of particular human activities is possible. The Human Activity Recognition (HAR) is a system that describes these techniques to classify activities from data produced by sensors according to the body’s movements. This seems to be directly applicable to video, image, or sensor data related to physical executability. Smartphone usage is skyrocketing in today’s world. Smartphones also come with a range of sensors, for instance, a barometer, magnetometer, GPS sensor, and many more. Smartphone sensors can considerably impact the values of sensor data based on the smartphone’s position and environment. The physical gestures of a human being assess these variations and address distinct sensor values even though they have a considerably distinct kinesthetic sensibility. Plenty of applications in divergent areas have already been conducted with HAR, but there are still a few areas where HAR may be appointed. Research works on intelligent households, protection of the elderly, falling prevention, and so forth are conducted using HAR. Nevertheless, they have still been incapable of operating HAR for the biomarker analysis of any disease.
One of the unattended applications of HAR is the diagnoses of diseases, such as Diabetes, mental disorders, cancer, insomnia, cardiovascular diseases, among others that are directly correlated with the pattern of daily activities [7,8]. The most notable gap in the research is a non-appearance of HAR used to diagnose any disease. Staging Diabetes by correlating the activity patterns of a diabetes-affected patient is a brand-new approach to HAR use. Thereby, our findings differed from those studies that have been previously conducted. This provisional scrutiny is one of such aspects of this study, including novel findings. With thorough knowledge of other studies regarding the associations of human activity with Diabetes and the advancement of HAR in recent years, we had an elementary foundation to forge ahead and accomplish the research goal. We sought to initiate an unprecedented mechanism to assist HAR based on smartphone sensors. HAR was unfolded in real-time to monitor activity patterns and carbohydrate intake with meals. Based on activity durations, if activities were mostly related to diabetic patients, we dispatched early diagnosis, notifying the subject before Diabetes could cause deterioration in the subject.
This study applies a sensor-based smartphone HAR application. Activities that facilitate identifying symptoms associated with type 2 diabetes or Non-Insulin Dependent Diabetes Mellitus were recognized as necessary information. After that, the sensor data were fused with the Long Short-Term Memory-related activities that were identified. Irrelevant activities, which are performed along with symptomatic diabetes activities, were also recognised to ensure the system’s robustness. We achieved 98.48% validation accuracy. Next, the risk factor for effective diabetes classification was measured using similar qualities characterizing the similarity of the activity patterns among diabetic patients and the experimental subject. An Android application was produced to gather sensor data from the experimental subject. We gathered data concerning the experimental subject’s day-to-day activities for 30 consecutive days. The experimental subject’s sensor data were processed in the pre-trained LSTM model. Daily activity patterns were recognised by prediction. In this way, we figured the mean time spent executing every activity from our experimental subject’s predicted activity log.
We also surveyed the diabetes symptomatic activity patterns of diabetic patients. After assembling required data from the diabetic patients, Cosine similarity was used to estimate the similarity of activity patterns of the experimental subject and diabetic patients. The similarity value was hypothesized as the risk factor for the experimental subjects. To determine the similarity, we considered the activity patterns and six progressively physical properties, i.e., height, weight, blood pressure, evidence of diabetic patients in first degree relatives, age, and gender. The Cosine similarity measure of 57.39% put the experimental subject into the moderate risk factor class. Concomitantly, the experimental subject was clinically tested to confirm the risk factor diagnosis using the diabetic clinical diagnosis process, called the A1C. The level of the A1C assay was 6.1%, which recognized the experimental subject as a patient suffering from Diabetes, which confirms the conclusion determined by our suppositional scrutinization.

2. Related Work

Investigators have used HAR recognition since the 1980s because of its field of implementation and its links with other areas such as safety and medicine, the relationship between people and computers, etc. As HAR is excellent for field research, researchers have chosen a range of approaches to conduct HAR. To briefly go over the history of the HAR system, we studied tri-axial gyroscope, triaxial accelerometer, relative humidity, and temperature sensor data to recognize activities, namely sitting, walking, jogging, lying down, walking upstairs and downstairs, cycling, standing, and squatting over the toilet to cover the background of HAR systems [9,10,11,12,13,14].
Ambient sensors were used to capture images or video by some researchers to execute HAR [15,16,17,18,19]. Some of these researchers used wearable sensors [20,21,22,23]. Smartphone sensors are also popular among researchers to implement HAR [24,25,26,27]. There are instances of researchers who worked on some particular sensors to execute a specific function, such as working as an accelerometer, gyroscope, magnetometer sensor, etc. [28,29]. When conducting the recognition process with different sensor positioning on different body positions, outcomes had several variations. Alsheikh, Selim [30] employed accelerometer and barometer sensors to perform the recognition process of seven activities states such as staying still, walking, running, going up to an elevator, going down an elevator, going upstairs, and going downstairs with the employment of six learning models and acquired accuracy up to 90.7%. Ignatov [29] employed a tri-axial accelerometer to recognize eight activities: falling, running, jumping, walking, walking quickly, step walking, walking upstairs, and walking downstairs using a Convolutional Neural Network (CNN) classifier incorporating 31,688 instances. Moreover, Alsheikh and Selim [30] trained a Deep Belief Network (DBN) and other standard classifiers on three non-identical datasets to exhibit a clear comparison. The accuracy of the deep model was 98.23%, 91.5%, and 89.38% in the WISDM, Daphnet, and Skoda datasets, respectively. On the M-health and Skoda datasets, Ha and Choi [28] had to use a multimodal CNN with two-dimensional kernels, achieving the accuracy of 98.26% and 97.92%, respectively. Similarly, Jiang and Yin [22] enhanced the implication of CNN on three public datasets for executing the HAR process. They acquired accuracies of 95.18%, 97.01%, and 99.93%. Ronao and Cho [24] also performed the activity recognition process on the data of 30 subjects, considering 21 of them for training and the rest for the testing phase using a CNN classifier. They performed the recognition process with the help of three classifiers, a custom decision tree, automatically generated decision tree, and an Artificial Neural Network (ANN), and had an overall accuracy of 82% for the custom decision tree classifier, 86% for the automatically generated decision tree, and 82% for the ANN. As mentioned earlier, images and videos were employed to perform the human activity recognition process. Moreover, Bodor and Jackson [15] developed an intelligent video system to detect pedestrian inroads and abnormal or suspicious pedestrian behaviours using vision algorithms. Furthermore, Weinland and Ronfard [17] detected poses and activities from a single image and image sequence and introduced a histogram of an oriented gradient-based pedestrian descriptor to achieve better outcomes.
In conducting our study on HAR, we have used Long Short-Term Memory (LSTM), which in and of itself is a developed specialization of a traditional Recurrent Neural Network over a very common deep level classifier. LSTM has been used in this research since highly publicized HAR application performance has shown comparable results with LSTM classification. There are several real-life mobile sensing applications. Such frameworks employ smartphone-built mobile sensors to perceive behavioural patterns so that human activity is easier to understand. Chen and Zhong [31] proposed a feature extraction approach based on LSTM to recognize human activities with tri-axial accelerometer data. Experimental findings on the LSTM public datasets (WISDM) show that LSTM is realistic and reliable, achieving 92.1% accuracy for the test dataset. In light of two standard datasets, Opportunity and Skoda, Ordóñez, and Roggen [32] implemented the LSTM and CNN network fusion to perform the dominant grading function. With regard to the Opportunity dataset, the former results of the other studies were overtaken by a 4% margin for day-to-day activities, and the margin of improvements of Skoda, a car manufacturing company dataset, was around 6%. Bidirectional LSTM has also confirmed a dominant output by feeding accelerometer and gyroscope sensor data to six human activities in [33], which achieved an accuracy of 92.67%. Moreover, Zhao, and Yang [34] found that better results were acquired while HAR was being introduced using the Public Dominant Datasets and Incentive Datasets to implement Residual Bidir-LSTM. The performance of the public domain dataset was improved by 4.8% compared to earlier results and was improved by 3.7% in terms of Opportunity F1.
Researchers argued that increased general exercise could prevent Diabetes and that greater exercise, including swimming, tennis, and racing, could still be more supportive than being less energetic [6]. The researchers conducted a cross-sectional and environmentally sound survey of 87,253 American females aged 34–59 [35]. After a follow-up of 8 years, they assumed that the risk factor of NIDDM for the most active woman was two-thirds of what it would be compared to the least active woman. Tuomilehto and Schwarz [36] examined 522 middle-aged, overweight individuals with reduced sugar sensitivity. They indicated that the non-pharmacological action of high-risk individuals with asthma discourages or postpones the occurrence of type 2 diabetes. The researchers indicated that physical engagement increases awareness and that regular strength workouts lead to weight reduction and improve alcohol tolerance [37]. These results show that the most engaged person showed a risk of NIDDM that was two-thirds less than the risk of the least actively engaged person. They also noted that obesity is one of the central insulin insensitive sites and that most obese people have improved opposition to insulin and/or some level of intolerance to glucose. Furthermore, around 80% of all patients with NIDDM are obese. Another study found that higher physical activity levels are associated with a lower prevalence of type 2 diabetes in cross-sectional and ecological studies [38].
A comparative study has shown that women who are constantly active in activities such as walking, jogging, running, biking, callisthenics, aerobiological dancing, rowers, lap swimming, squash, and tennis, are at the lowest risk of Diabetes in comparison to women who consistently participate in sedentary activities (RR = 0.59; 95% confidence interval) [39]. The research proposed that a considerably greater likelihood of obesity was linked to the time spent watching T.V. In recent studies on Australian aborigines and a survey of Zuni Indians, researchers stated that increased physical activity levels might benefit motivated volunteers with NIDDM [40]. The American Diabetes Association has argued that long-term periodic physical programs are viable for individuals with reduced glucose and type 2 diabetes with appropriate compliance levels or with the avoidance of glycemia [41]. Furthermore, periodic physical activity has continuously been demonstrated to decrease triglyceride-rich VLDL values; this indicates a lower degree of hyperglycemia. In contrast, Impaired Glucose Tolerance (IGT) was a mid-stage NIDDM connected to an elevated danger of creating NIDDM. Therefore, diet and exercise procedures substantially reduced diabetes incidence in people with IGT who were over six years of age. Moreover, Tuomilehto and Schwarz [36] studied 523 subjects (172 men and 350 women) who were members of high-risk groups, such as first-grade relatives of patients with type 2 diabetes, overweight, 40–65 years of age, and had impaired glucose tolerance and proposed exercises such as walking, jogging, swimming, and aerobics (140–200 mg per deciliter). They found that both men and women at a higher risk of type 2 diabetes could prevent the diagnosis of type 2 diabetes with modifications to their lifestyles. Additionally, in these cases, the overall incidence of Diabetes declined by 58%.
This study demonstrated the use of HAR in pointing out the relative prevalence of NIDDM. This provisional system may exclude the complexities and clinical diagnosis costs of Diabetes and might determine a prognosis of the risk factor for Diabetes staging before it becomes severe. Alongside this, previous researchers operated with a frequency of 50 Hz for the data collection process [42,43]. A data amassing process with higher frequency is profoundly energy-consuming. High-frequency data processing can help achieve more accuracy with the cost of power consumption. Lower frequency data processing can be energy efficient, but the accuracy slope will have a negative gradient. This provisional system differed from those of studies. We attempted to keep the accuracy level of the HAR process steady using a low frequency of 1 Hz for less energy consumption. Data amassment regarding symptomatic diabetes activities for different versatile conditions accelerated the activity recognition process. Concurrently, this system introduced a novel modus operandi to the early staging of Diabetes based on the patterns of daily performed activities.

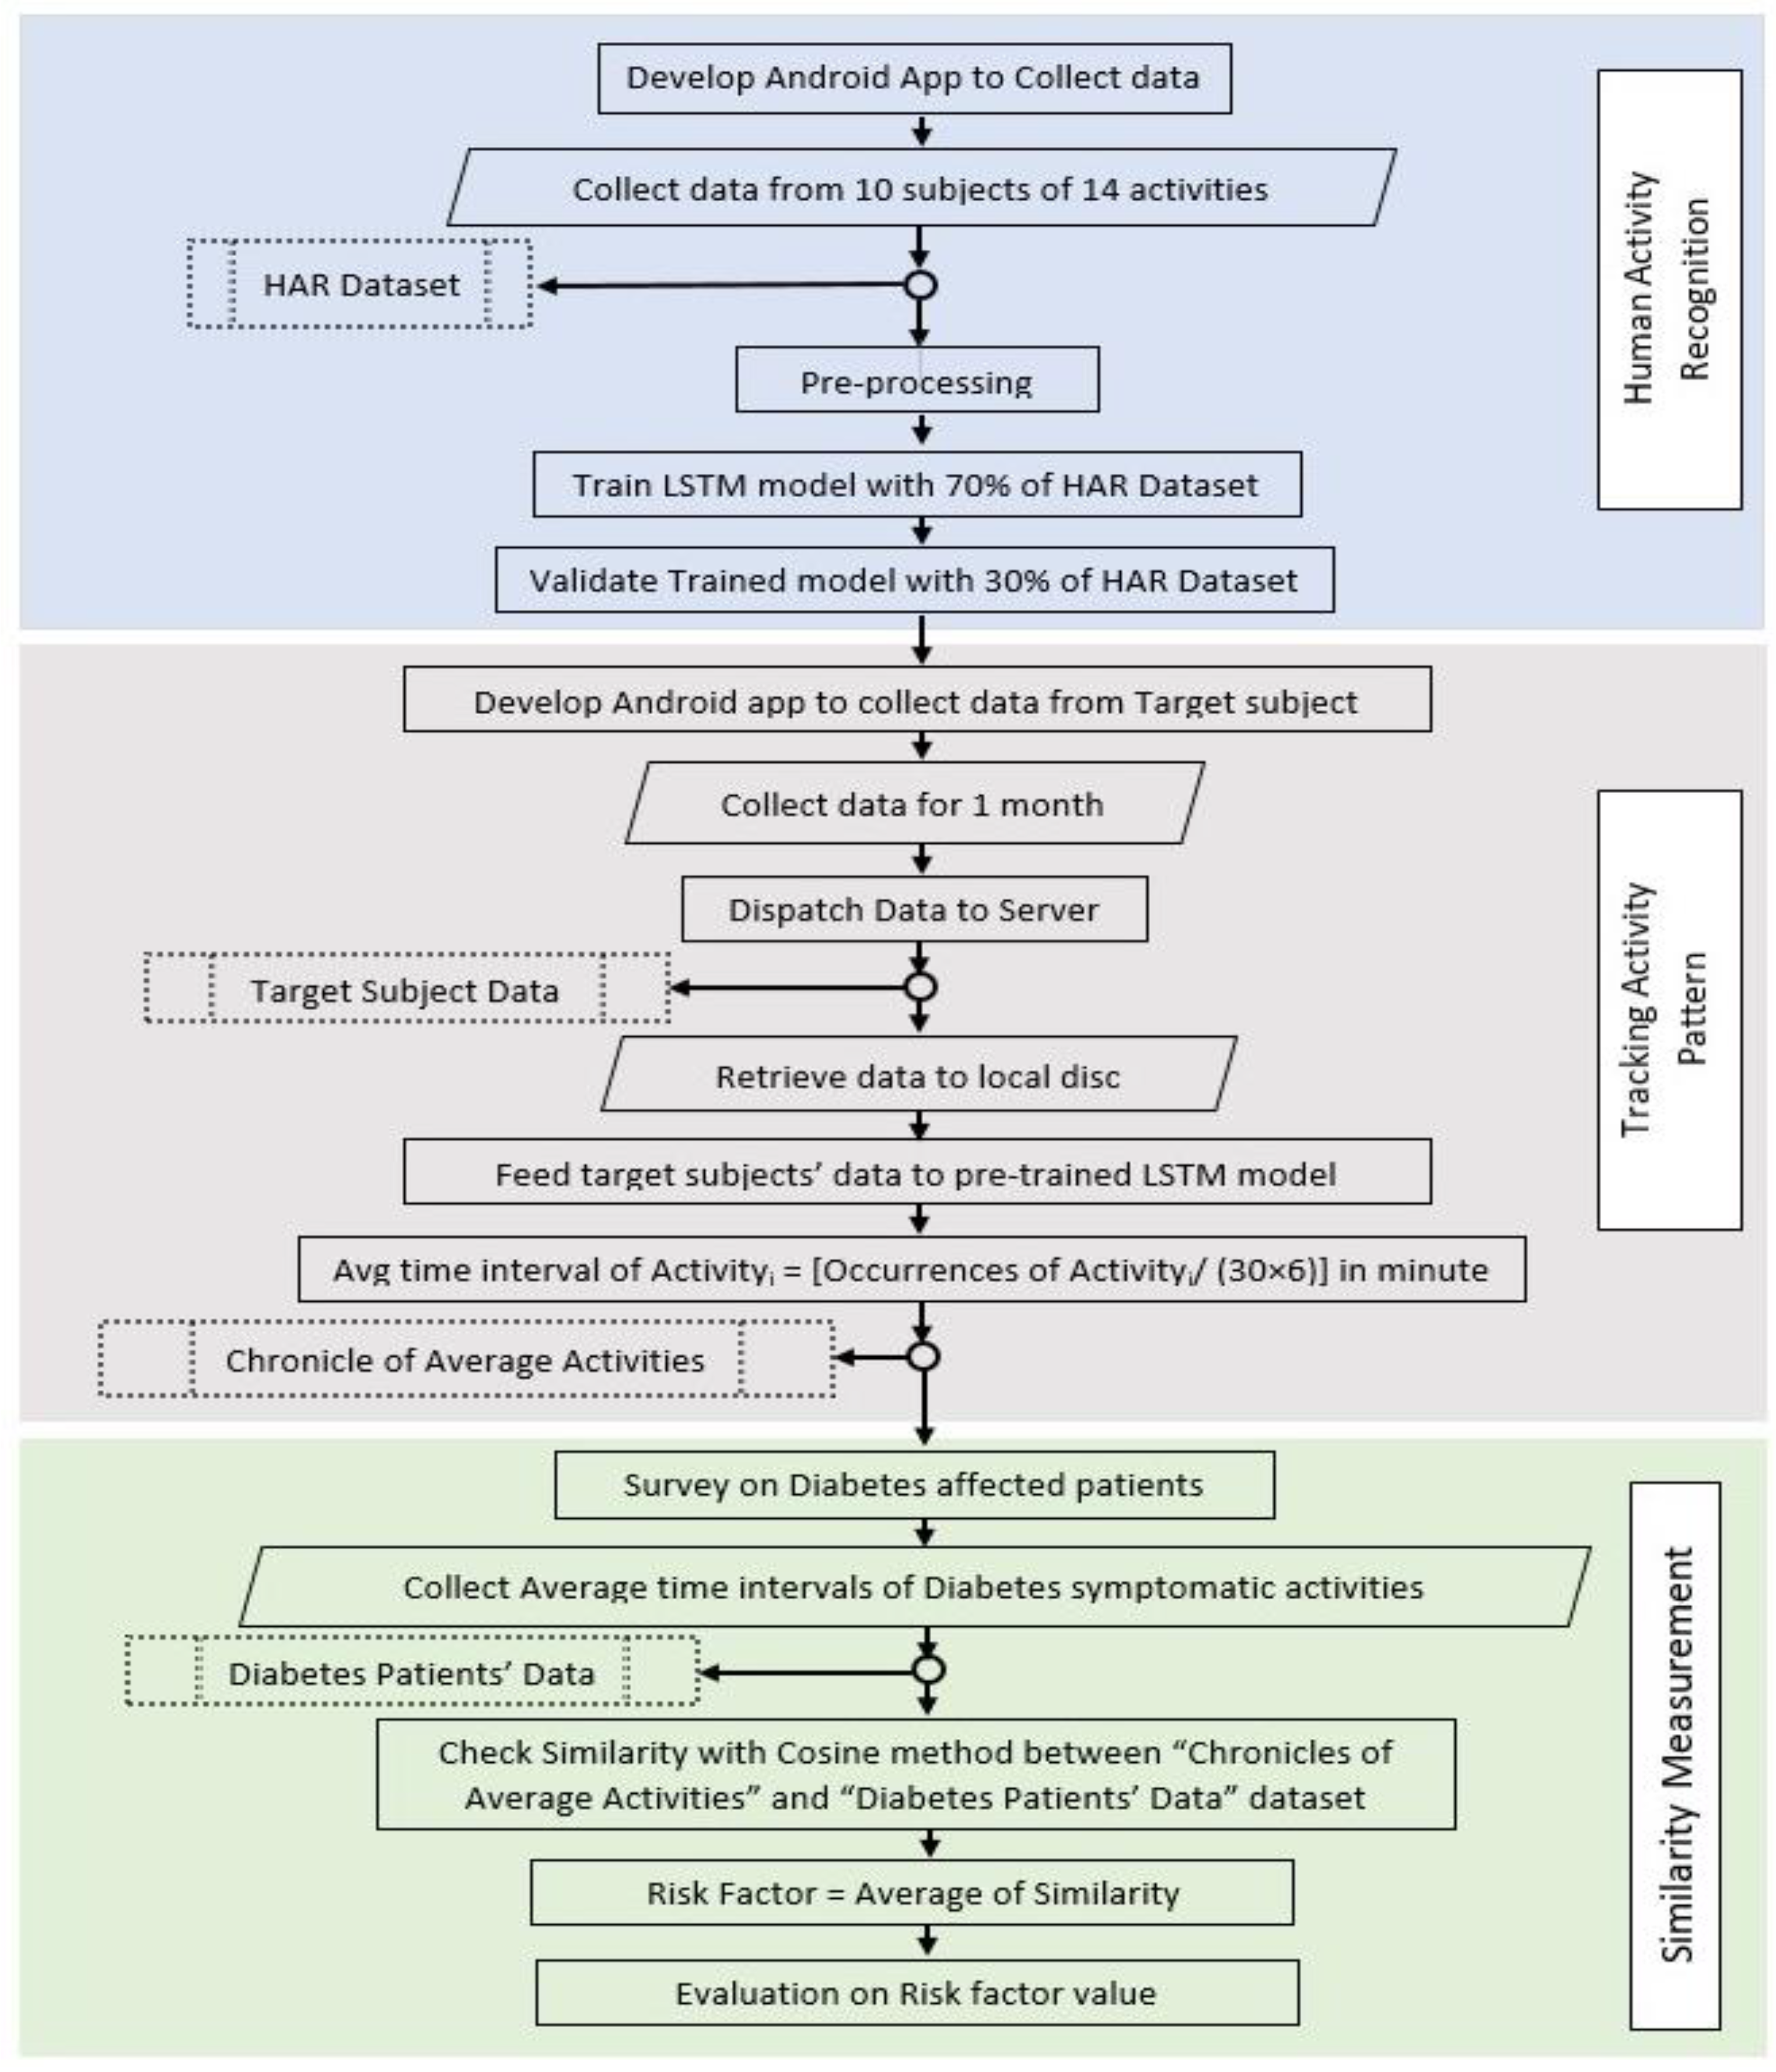
3. Materials and Methods

With knowledge of earlier studies on the associations between human activities and NIDDM, we had our elementary foundation to forge ahead to accomplish a real-time diagnosing system to forewarn people before the deteriorated effects of Diabetes occurred. We also emphasized creating possible improvements in HAR performance to corroborate a robust system. Furthermore, the applications of this scrutinization have also been encompassed in later sections to show new doors leading to the advancement of modern science. The process that determines the risk factor in HAR-assisted diabetes type 2 as well as NIDDM is composed of three sub-processes. The entire approach is formulated as it appears in Figure 1.

3.1. Human Activity Recognition

In the first sub-step, human activities are recognized with the effective implementation of the LSTM model. To conduct this task, this section narrates the processes for identifying the symptomatic activities of Diabetes.

3.1.1. Symptomatic Activities

We sought to identify activities similar to the symptoms of Diabetes because of a widely disparate aspect of Diabetes. Daily exercise could even reduce the risk of developing the development of insulin resistance. Types of Diabetes, the intensity of exercise, and the complicating factors associated with Diabetes differ in the complexities associated with blood glucose control [44]. Walking, walking upstairs, walking downstairs, jogging, and cycling were classified as activities linked with cardiovascular movement in this regard [45]. In contrast, we recognized drinking, eating, and toilet activities to record the urination log [46]. Moreover, acquisition activities, such as falling, make it easier to identify physical weakness [47]. The aptitude to recognize activities such as lying down, sitting, itching the genitals, and standing strengthens the capability to detect complaints correlated with type 2 diabetes [48].

3.1.2. Sensors’ Data Collection

On a 1 Hz frequency, we configured an application that gathers data from gyroscope, accelerometer, relative humidity, and temperature sensors. The linear acceleration of movement was measured through the accelerometer, whereas the gyroscope measured the angular rotational velocity. Smartphones perceive humidity and temperature within their surroundings using relative humidity and temperature sensors and interpret the records into electric signals. Accelerometer and gyroscope sensors measure the rate of change; they only measure the rate of change for different activities performed by the smartphone user. Moreover, symptomatic activities of Diabetes are also able to be differentiated based on the environment. Sitting on a chair in a room and sitting on a higher commode in a washroom shows different temperature and humidity levels than a living room and a washroom, respectively. On this account, we leveraged the accelerometer and gyroscope sensors together with the relative humidity and temperature sensors.
The smartphone might be removed from the user’s pocket; possible causes include placing the device on any chair, bed, or any other location or when the smartphone needs to be charged. Moreover, the user may use the device for browsing, typing, or talking. In typing, browsing, or talking via phone, the user may remain in the seated, standing, or lying positions. Therefore, we have included these activities in a separate category called irrelevant activities. Thus, we have included irrelevant activities to be recognized together with diabetic symptomatic activities. Another significant issue we needed to determine is whether an individual can place the smartphone in his/her pocket in any position, such as in the flipped position or if the smartphone is upside down or downside up. Because of this, we have amassed data by keeping the phone in four conceivable positions in the pocket. To ensure that the system is more robust, we collected data from indoors and from outdoor circumstances. For instance, the stipulated data subjects walked through a mall, on a free road, on a busy road, in a room, and so forth, and the data sensors collected walking data for all of these situations. We considered a mode for sitting in a squatting position and a normal sitting mode for using the toilet, with the sensors collecting data on the lower commode and the higher commode, respectively. We commenced the data collection process with the help of 10 volunteers who agreed to assist this study. Nominated volunteers were subjected to the data accumulation process and amassed data for 14 previously mentioned diabetic symptomatic activities. They were all young, healthy, and had no underlying health issues. The trial dataset had 7000 occurrences for each diabetic symptomatic activity, different from the irrelevant activities. There were 10,000 occurrences of irrelevant activities in the trial dataset. Altogether, the dataset holds 101,000 occurrences of 14 unique activities.

3.1.3. Data Pre-Processing

Data collection processes are reliable in the real world, and problems such as contradicting information, poor or upsetting data, out-of-go values, and null values can affect the information collection process. The term pre-processing refers to the transformation of information into a defensible arrangement to salvage such noisy data. Since we used an Android application, there was the potential for programming issues or execution over-burden, which may create flawed data.
All the more, null values may happen because of different problems, such as application blunders, flawed sensors, uproarious conditions or development, and so forth. To our benefit, the collected data demonstrated no null values; subsequently, pre-processing for dealing with missing values was not required. Another type of uproarious data, called outliers, alludes to such data values in a dataset that causes an unusual conveyance in a data arrangement. They dwell at an irregular separation from the general dissemination. Consequently, any value showing a z-score more prominent than a determined upper threshold value or a value that is not a lower threshold value were considered outliers. After finding all of the outliers for every specified feature, we replaced the outliers with the mean of that feature. Applying Min-Max standardization to a dataset with the characteristics of various scales brought under an unconcerned scale may encourage the learning process to master utilizing that dataset. Since the dataset additionally incorporates diverse properties with various units, for example, meter per square second for the tri-axial accelerometer, radian per second for the tri-axial gyroscope, the percentage for relative humidity, and Fahrenheit for temperature, we practised Min-Max standardization to scale them between an aloof scope of 0 and 1. Sensor signals lose their smoothness due to the gravitational field, and thus fluctuation occurs. The Butterworth low pass filter can be defined as a type of signal processing filter that is designed to convert a generated frequency into a smooth one. Fourier transforms break down any signal and can be exhibited as a sinusoidal signal, and a Fourier transform was employed in this process. After the employment of the filtration process, we achieved a valuable outcome, which can be depicted by the following figure, Figure 2, for the X-axis of the accelerometer sensor.
Low-dimensional subspace tradeoff lowers time complexity to speed up the classification process. We had to recognize activities from bulk smartphone sensor data. Consequently, we investigated the roughly equivalent value to select which vectors could be removed without losing an excess of data. The eigenvalues of the eight principal components (PCs) are depicted in Figure 3. In the wake of arranging the Eigen pairs, the following inquiry is “What number of essential segments are we going to decide upon for our new component subspace?” A helpful measure is the supposed “clarified fluctuation”, which can be determined from the eigenvalues [49]. The clarified change reveals how much data fluctuation can be accredited to every one of the chief segments. Though there were only eight features, the data size was too big. Therefore, we needed to make a reasonable tradeoff to speed up the classification approach. The PCs with a covariance that is greater than 0.1, an eigenvalue is greater than 1.0, and the covariance among the eigenvalues being greater than 0.1 have been selected for this study.

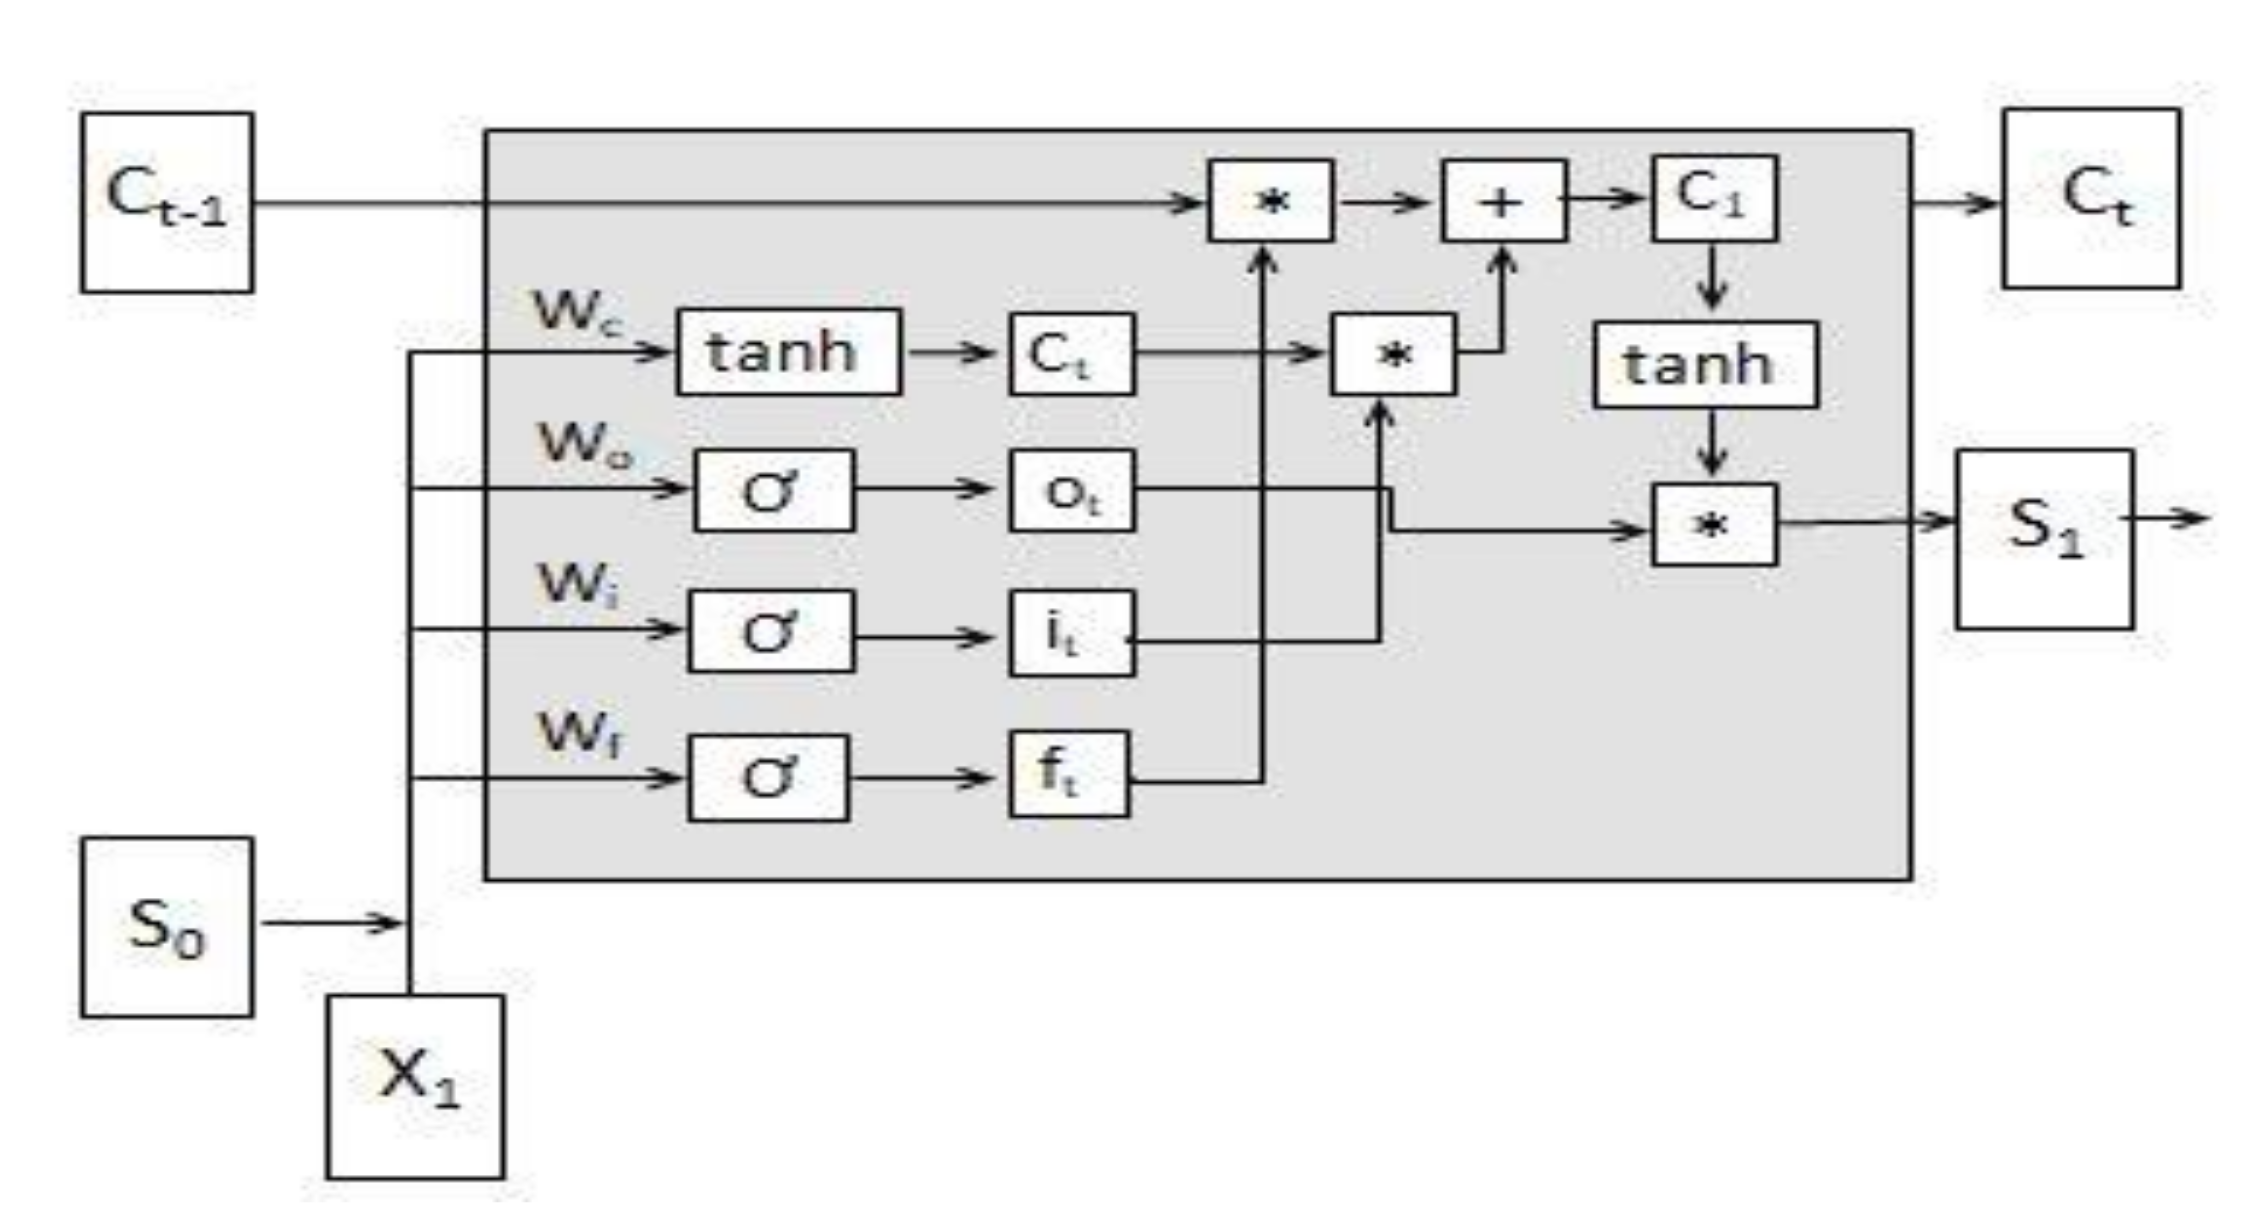
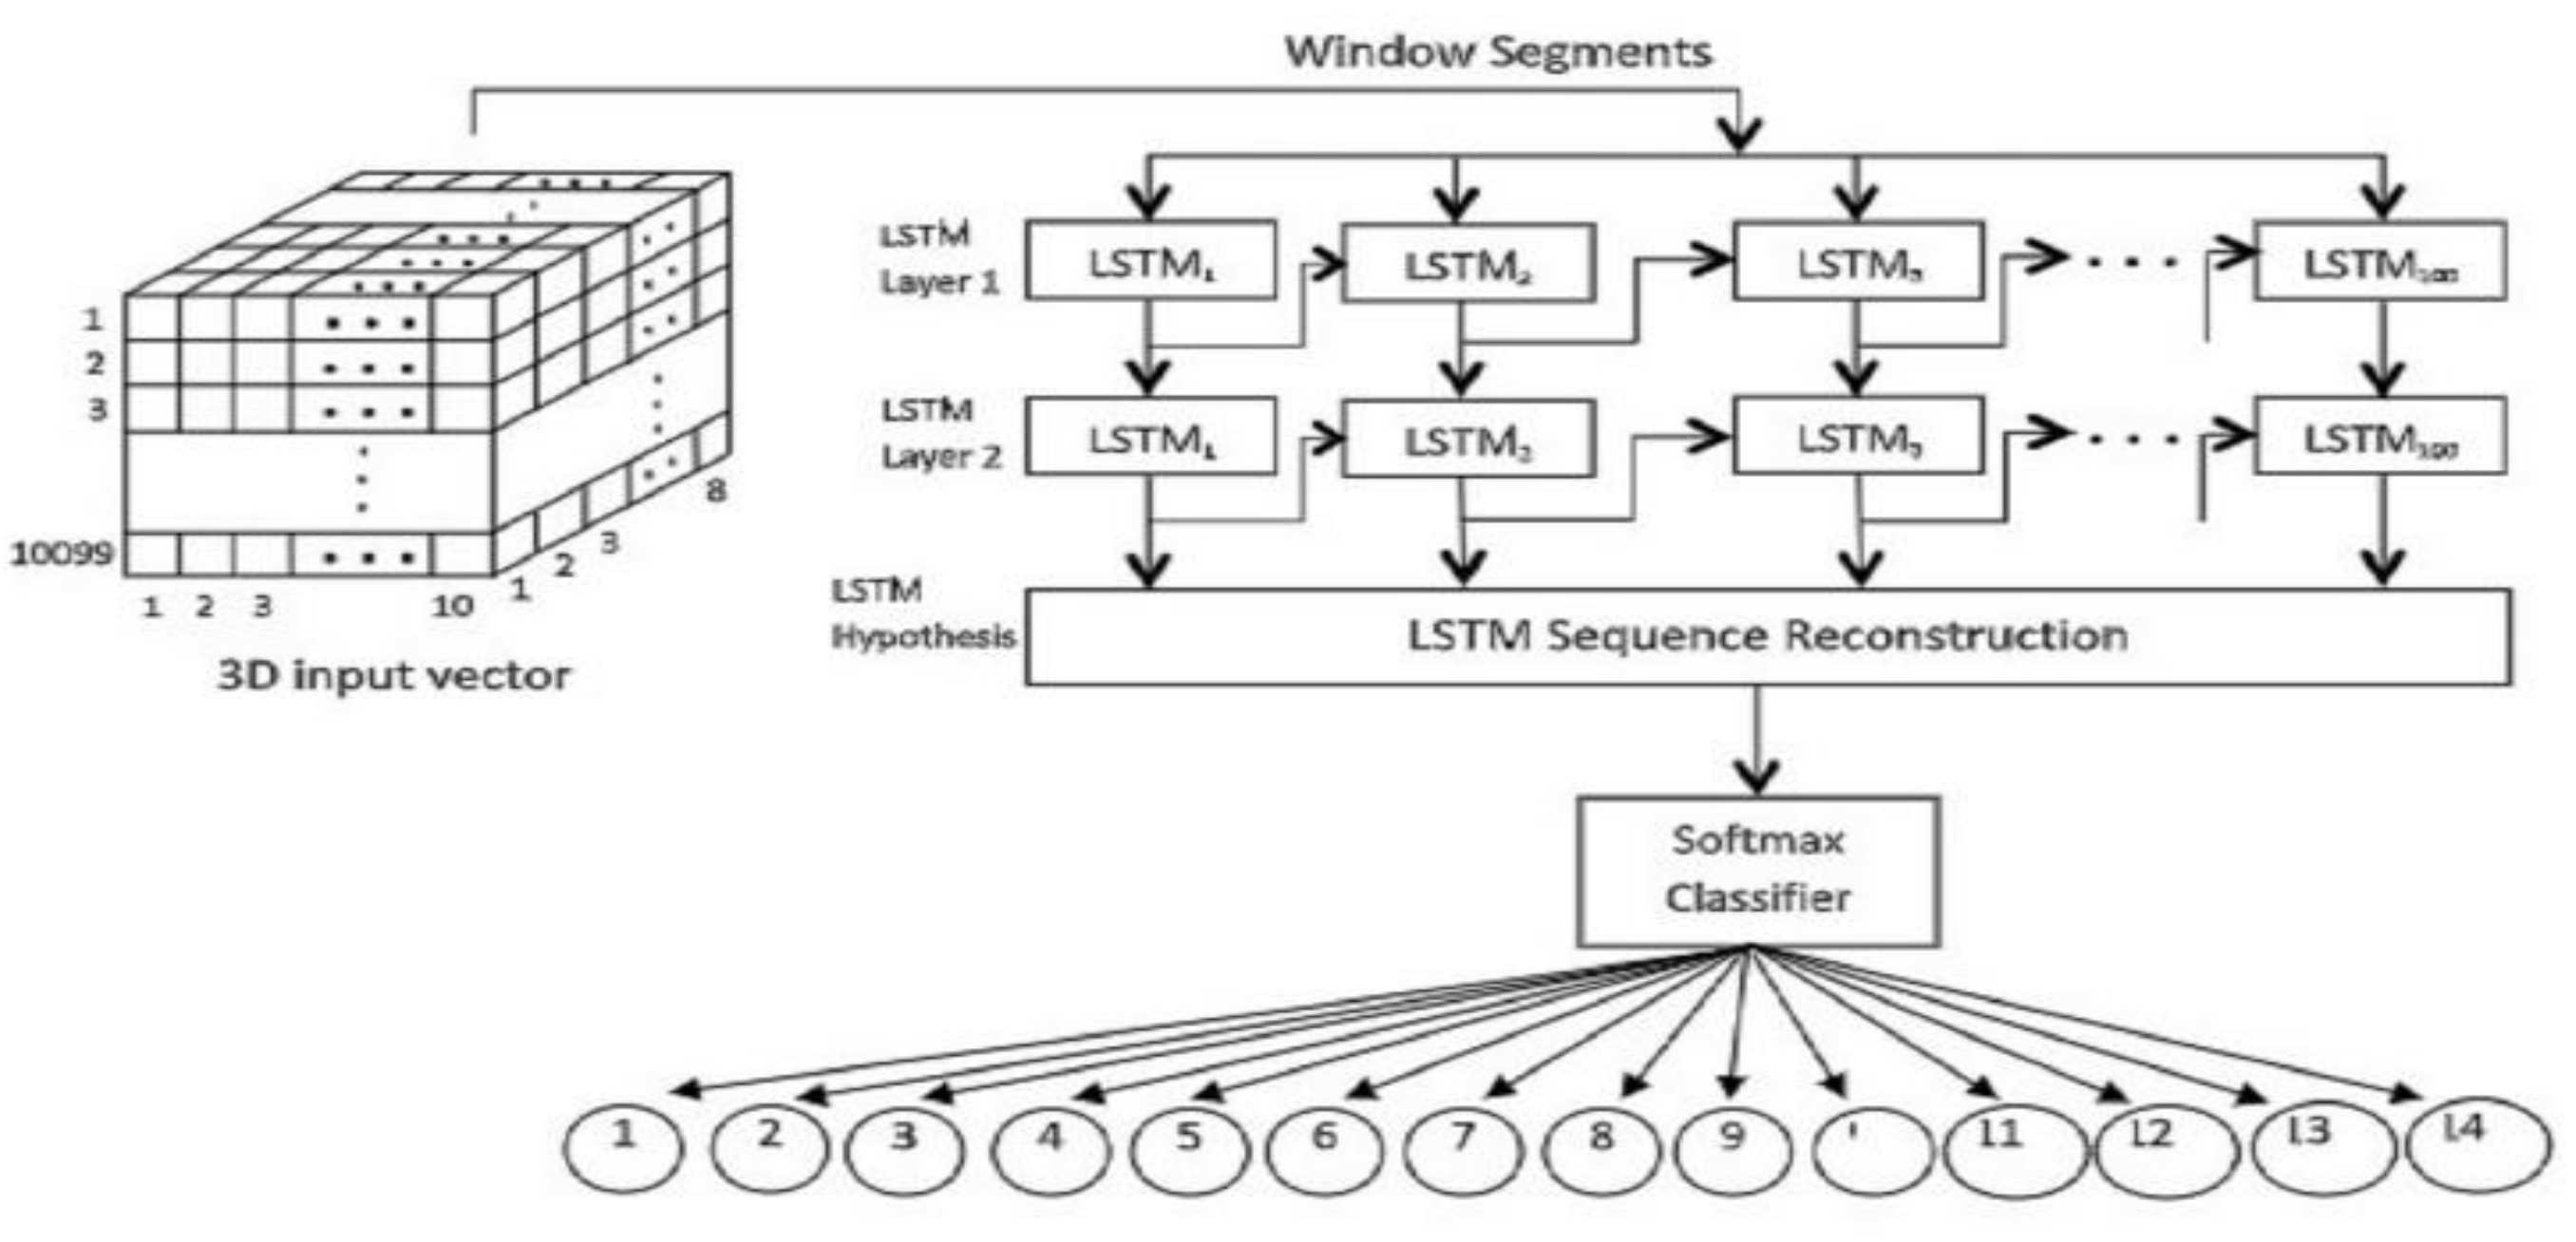
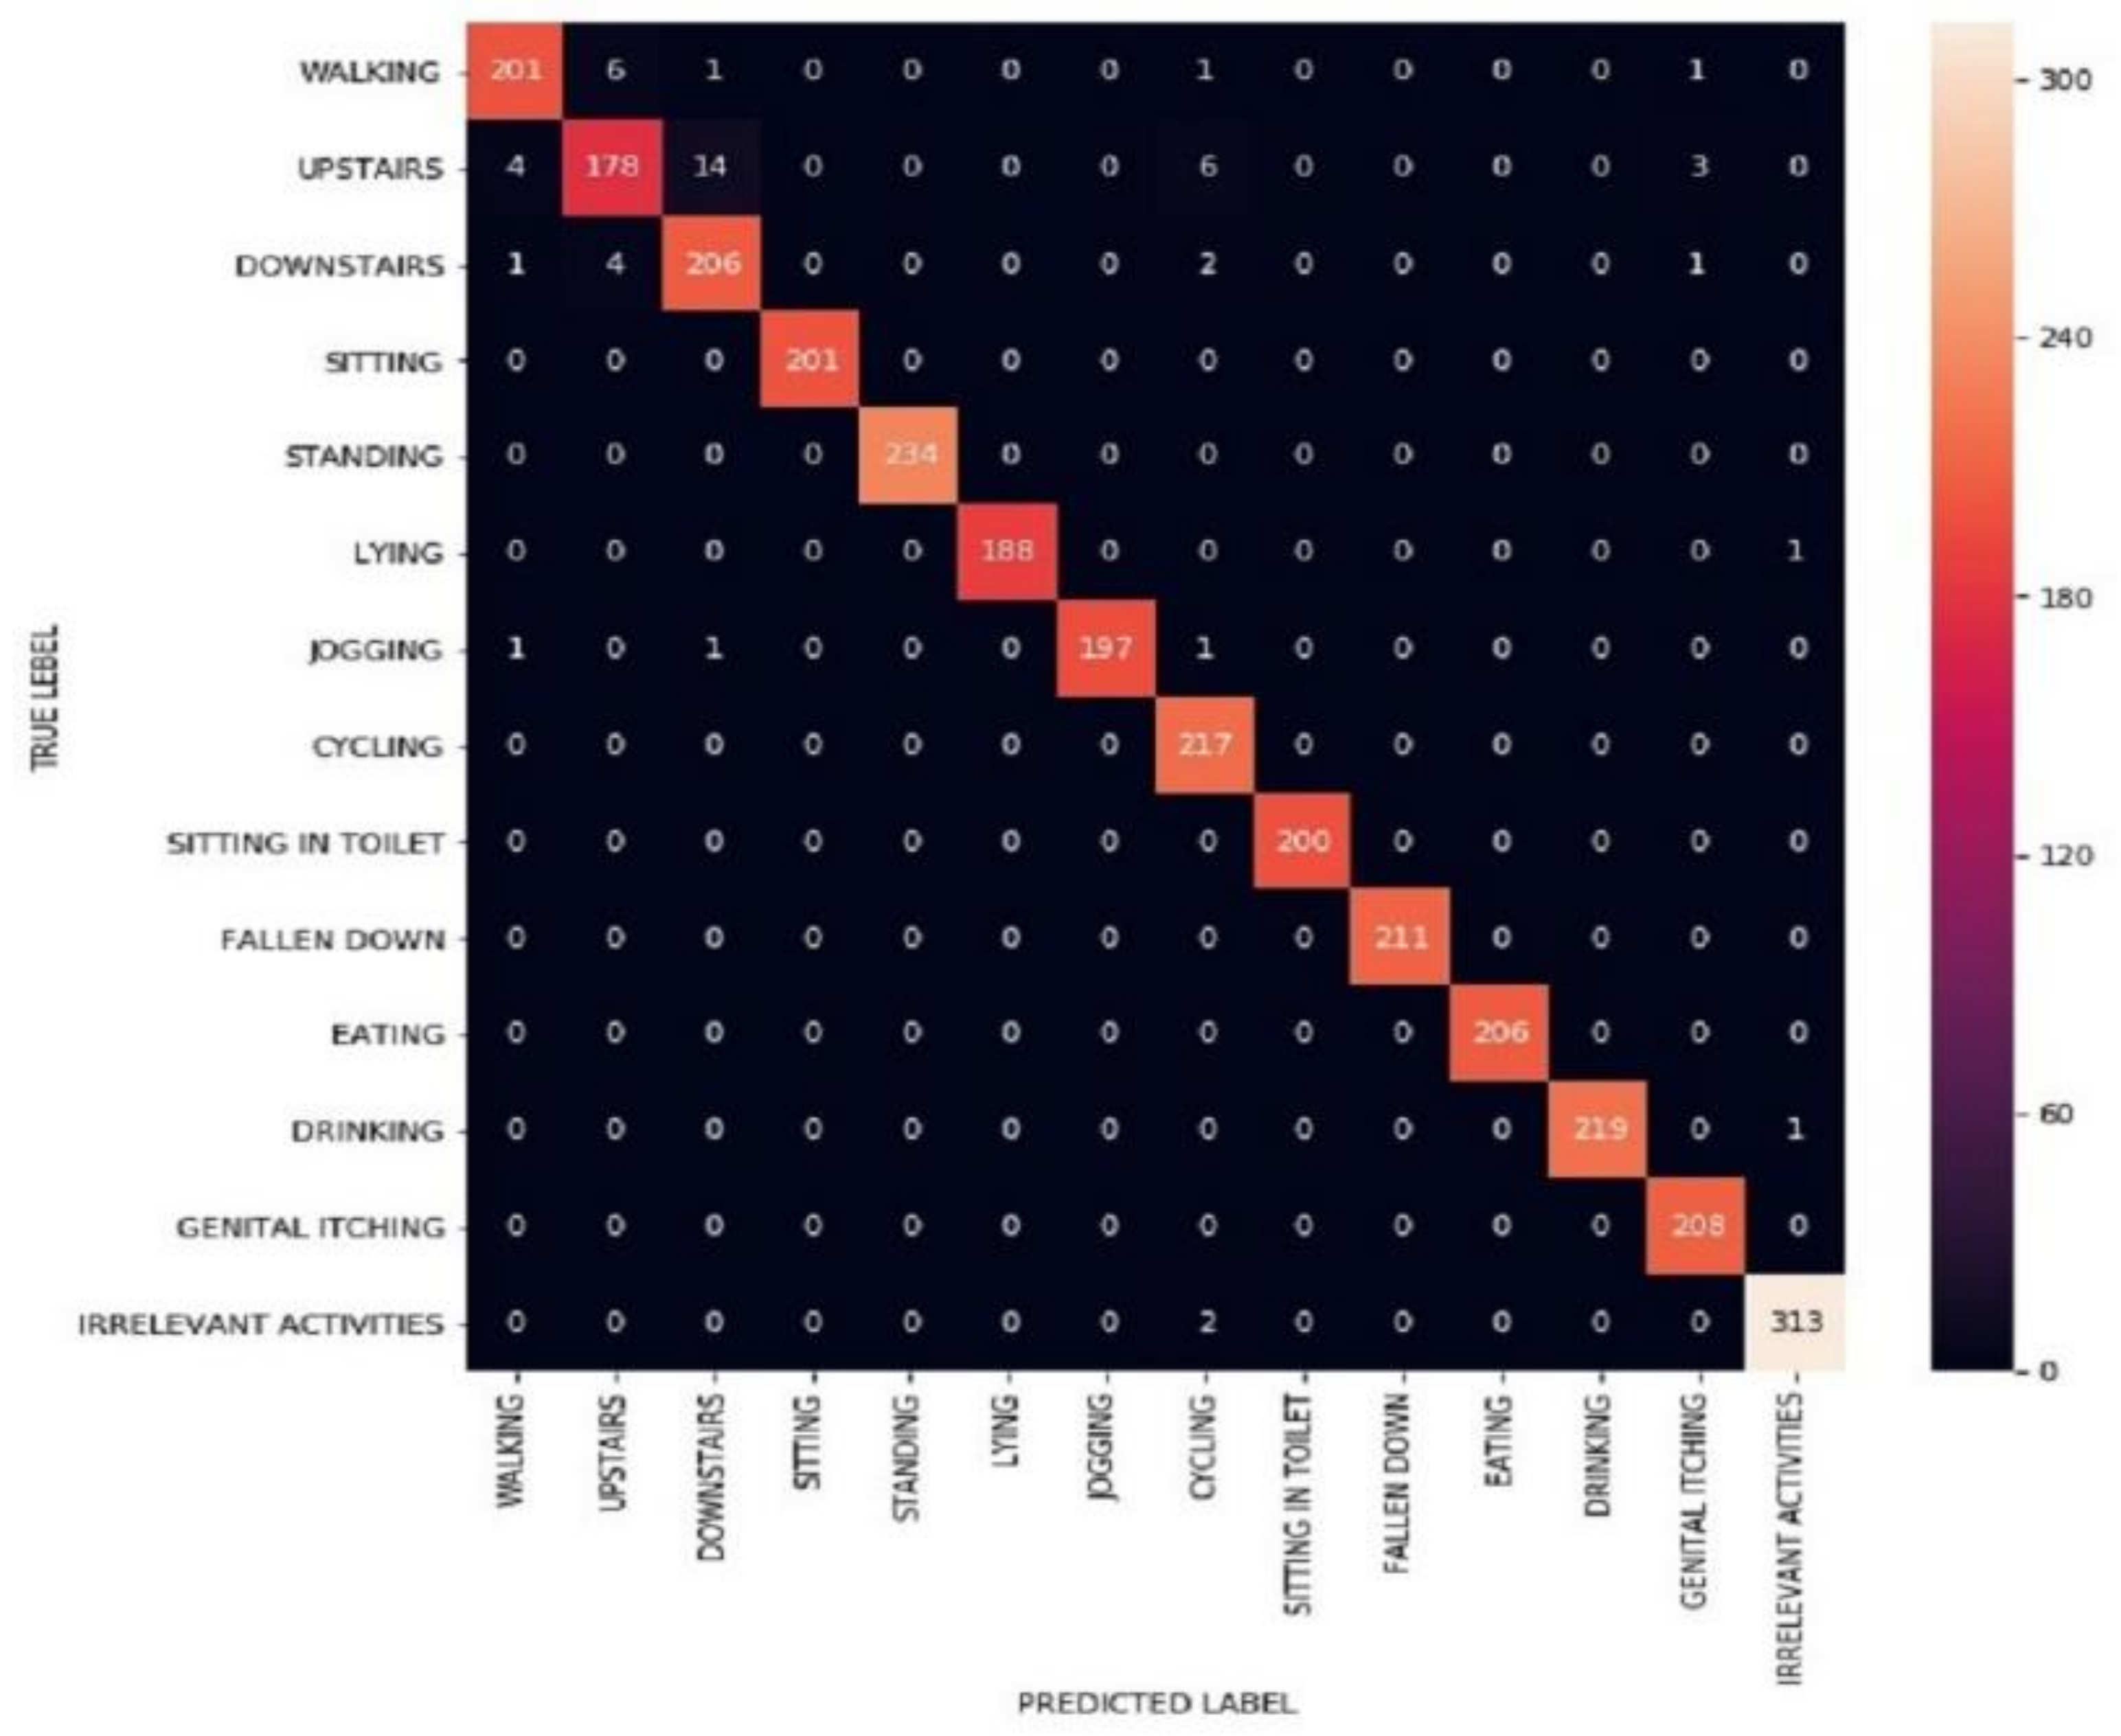
3.1.4. LSTM Model Assessment

Human consciousness or intelligence, despite their endurance, do not begin to think without assistance. In the same way as human reasoning, it is possible to develop a substantial pattern over fired data during back-propagating in a decision-making system. Data must, however, be generated progressively. Recurrent Networks outperform other neural systems in sequential machine learning by using conditional reflexive learning approaches. Compared with conventional recurring networks, LSTM conducts a superior event to ease the evaporation of the recurring network’s inclination when learning sequence. The basic notion underlying the LSTM model is that memory cells are retained or remembered long-distance constraints of prior inputs into the hidden state of the Recurrent Network, which stores previous groups that do not fade away. Human actions have developed consecutive subservient behaviours over time, and similarly, human activities recycle examples for specific activities. LSTM, therefore, examines and forms its input groups, a collection of sensor data for the activity recognition within the window. The backpropagation of LSTM is taught to perceive and forecast errors in time over the input.
An LSTM cell is formed through an architectural point of view by a considerable memory cell block, as demonstrated in Figure 4. Hidden state and cell state are two states that stream data and make minor alterations by multiplying and adding it individually. The vital mechanics, known as gates, are used to recall sequences and controls in memory blocks. A gate called the forget gate is used to improve the execution of the LSTM network by removing less important data or data that are never required again for the LSTM using channel multiplication. To determine which data to dispose of and which order needs to be maintained, a logistic function contains the input in that particular phase (xt) and the hidden state of the previous cell (ht−1). After the forgetting state, the cell state concludes in this manner:
C t = f t   C t 1
Here, forget state and the past cell state are represented by ft and Ct−1, respectively. The state of forgetting is defined as follows:
f t = 1 1 + e W f h t 1 , x t + b f
The weight matrix is Wf, and the bias vector is bf. The cell state is multiplied by the sigmoid function’s output vector. An input gate then adds to the cell state. The additional sigmoid function is a filter that manages which values are added to the cell state and makes a vector with a tangent function that includes any feasible value. Afterward, the cell state is complemented with the candidate values for the tangent function and the output of the sigmoid layer. Accordingly, only sequences that are essential and not excessive are then appended to the cell state. Consequently, after the input state, the cell state becomes:
C t = f t   C t 1 + i t   C t
Where its input state holds the sigmoid layer, and C′t holds candidate values. The two functions are listed below:
i t = 1 1 + e W i h t 1 , x t + b i
C t = 1 e 2 W c h t 1 , x t + b c 1 + e 2 W c h t 1 , x t + b c
Bi and bc are bias vectors in those cases, and Wi and Wc are the weight matrices of the input cell and the moderate cell state, respectively. A second filter is used to select which components of the cell state are to be produced. Following the setting of the cell state by hyperbolic tangent, the sigmoid function and vector are generated. The sigmoid function and the vector are used to scale data in the −1 to +1 range. Subsequently, the vector result of the regulatory filter and the tangent function is directed to the hidden state as output. This product generates only the most important sequences. As a direct consequence, the cell state is generated by output:
C t = o t   h t  
Here, ht is the vector of hyperbolic tangent values, and ot is the regulatory filter. Two functions are written below:
o t = 1 1 + e W c h t 1 , x t + b o  
h t = o t 1 e 2 C t 1 + e 2 C t
Where Wo and bo are the target gate’s weight matrix and bias vector, respectively. Gers and Schmidhuber [50] counseled a small adjustment in the peephole connection of the fundamental LSTM model. The increased peephole linked its interior cells to its multiplicative gates, familiarizing itself with the fine refinement between the spike sequences. The forget, input, and output gates were therefore allocated as:
f t = 1 1 + e W f h t 1 , x t + b f
o t = 1 1 + e W c h t 1 , x t + b o
Lu and Salem [51] combined the forget and input gates in a segregated study. In this paradigm, choosing what to forget and which new data should be incorporated is preferable. In the forget gate, this blended model tends to forget input sequences and injects additional values into the state while forgetting more established patterns. As a consequence, the cell state is obtained by this model:
C t = f t   C t 1 + i t   C t

3.1.5. Fusing LSTM and Evolution

The dataset was divided into two parts. The first segment can be fed into the model network to form a sequence that accounts for 70% of the dataset, and the trained model will be endorsed at a later stage and comprises 30% of the dataset.
The construction of an integrated vector is depicted in Figure 5 by rearranging the dataset as a sliding window. A 3D vector is required to measure the group and time stages, and the stacked layer sizes of the window are also called input shapes. 1000 values are installed as a batch. The batch size refers to how many different examples the network feeds at once. The frequency within each example in the time vibrating pattern is described in time steps. The input data are then sent to several mounted LSTM layers folded throughout all of the time steps, with the layer size equal to the LSTM model’s hidden layer dimension. The 3D vector is also present in the cell’s output, as it was in the input shape. The LSTM output cell incorporates an additional final output that performs a Softmax activation function to arrange multiclass characteristics.
With a standard deviation of 0.23% between 20-fold of the test dataset, the proposed LSTM model achieves 98.4818% classification accuracy. The model’s function was assessed using datasets from the public domain to make a comparative analysis. The model’s overall accuracy in the MHEALTH dataset was 78.09%, the WISDM dataset was 95.85%, the UCI-HAR dataset was 95.78%, the Skoda dataset was 95.81%, and the OPPORTUNITY dataset was 92.63%. Because the capabilities of the datasets can not only adaptively extract activity features but also has fewer parameters, the findings indicate that the proposed dataset has higher robustness and a better activity detection capability than the contenders. Contrarily, Chen and Zhong [31] and Hernández and Suárez [33] proposed a feature extraction approach based on LSTM and Bidirectional LSTM models, respectively. In the relevant literature, Ha and Choi [28] presented CNN-pf and CNN-pff models on the Skoda and M-health datasets and had a 98.26% and 97.92% accuracy rate, respectively. However, this proposed LSTM outperformed models from previous works and dominated in terms of accuracy. Cheng and Huang [52] proposed an activity recognition system using commodity WiFi devices. They presented a machine learning Gaussian Mixture Hidden Markov Model (GMM-HMM) and achieved an average accuracy greater than 97% on self-collected datasets. In another study, [53] evaluated among K-Nearest Neighbors (KNN), Linear Discriminant Analysis (LDA), Support Vector Machine (SVM), and Random Forest (RF) modeling. However, they showed the combined acceleration, and jerk features yielded above 87% for all classifiers describing the changes in body acceleration correctly and mutually exclusive from the sensor orientation. To make a fair comparison, we incorporated the performance of classical machine learning algorithms, which include Support Vector Machines (SVMs) and K-Nearest Neighbor (KNN). Using SVMs and KNN, we achieved 97.53% and 97.04% accuracy, respectively. This scenario shows that the LSTM model provides greater activity detection capability and robustness than some baseline machine learning algorithms. As a necessary consequence of reduced model parameters, factually pre-processing techniques, and robust regularization, the training matrices show smooth and independent fluctuations. Along with this state-of-the-art HAR, we can presume that the proposed LSTM had a high achievement rate in recognizing the symptomatic activities of Diabetes. To support the hypothesis, Figure 6 resembles a confusion matrix and reveals that walking, lying down, going upstairs, and cycling is all making significant prediction blunders on the propositional dataset. Both the true and predicted label quantities are multiples of thirty in this case.

3.2. Tracking Activities of Experimental Subject

Tracking activity patterns will open another way to progress human activity recognition. With the fruitful achievement of human activity recognition for thirteen of the referenced activities, we moved towards deploying the trained LSTM model to track the activity pattern of an experimental subject in this section.

3.2.1. Data Collection from Experimental Subject

Targets who had been assessed for their diabetes risk factor were symbolized based on the obtained data. We developed another Android application to collect data from a target data subject. The reason for developing a new application was to actualize the label-less data collection from an individual for thirty consecutive days. The new Android application had two core pages. On the main page, there were six fields where the subject could input their specific height, weight, blood pressure, evidence of diabetic patients in first-degree relatives, age, and gender. Here, we collected the height and weight to measure the Body Mass Unit known as BMI. We also required the sensor data from the participants’ smartphones. Thus, after filling in the basic information fields, in the second stage, pressing the start button would quickly begin amassing data from sensors and would persistently send them to the server. Moreover, associating the Android application to the server benefitted us by allowing data to be captured daily. Moreover, if there were any need to halt the amassing procedure under any circumstances, pressing the stop button would prove helpful. It was evident that when collecting data from smartphone sensors in a continuous manner for 30 days, ambiguity would emerge, such as maintaining the smartphone continually attached to the body, always keeping the data collection application on in the background, among other concerns. We made every effort to ensure that the data collection process went as smoothly as possible.
The target subject data arrived at a frequency of 1 Hz during the 30-day course. Although 30 days is roughly equivalent to 2,592,000 s, according to our calculations, there should be 2,592,000 instances, but in reality, we could not obtain the appropriate volume of data from the experimental subject. We amassed smartphone sensor data for 951,728 s concerning activities that persisted for 30 days for the experimental subject. This means that the individual collected data for 8.81 h a day on average. The reason why the amount of data has decreased is the fact that the application was unexpectedly shut down, smartphone operations accidentally stopped, etc. Despite these hurdles, the amounts of data collected from each subject satisfactorily represented their activity patterns.

3.2.2. Fusing Pre-Trained LSTM Model on Experimental Subject’s Dataset

Data were gathered from the experimental subject; we again pre-processed that data utilizing the referenced pre-processing approach and used that approach for the prepared data to predict the activities performed over the most recent thirty days. We delivered the data into our prepared classifier, the LSTM model, and recognized the activities employing prediction for the experimental subject. In the wake of classifying all of the attributes of the cases for each subject, we then gauged how much time an individual spent executing every activity. To do this, above all else, we determined the number of occurrences demonstrating a particular activity in Figure 7.
Since the data were gathered at the 1 Hz frequency, the total number of occurrences for every activity characterizes the number of seconds the subject executed the activity over the most recent 30 days. In this way, by ascertaining the number of times that every particular activity had been performed, we discovered the time spent executing every activity over the most recent thirty days. Yet, we needed the time in minutes, which is why we began calculating time in minutes instead of seconds. Furthermore, we needed an average time interval to prosecute every particular activity in a day. In this manner, we partitioned the total minutes for every activity over thirty days to discover the normal time for each activity in a day. We calculated the normal amount of time that a subject spent executing each activity every day following the above procedure.

3.3. Similarity Measurement

The valedictory phase assessed the risk factor of Diabetes with a method of similar interventions. To produce the final result, this section merged two divergent processes to fabricate the outcome. The data collection process from diabetic patients will be first explained and then accompanied by a risk factor computation and interpretation.
The main motive behind data collection for diabetes symptoms is to discover the time spent on the selected 13 activities. We attempted to determine how much time a patient spends performing walking, sitting, standing, eating, drinking, sleeping, jogging, cycling, walking upstairs, walking downstairs, falling, and genital itching activities. The motive behind recording the duration was to correlate a subject’s everyday activities with the duration that each activity was performed for. We collected data from the Chattogram Diabetic General Hospital patients who were either waiting to give blood for a test or to receive their test reports. Our research group visited the hospital for two months and talked to the patients individually to collect the data. We collected data from 97 patients at most, all of whom were suffering from Diabetes. The questionnaire that we used was an inquiry concerning secondary information, for example, the patients’ gender, weight, height, do/did their parents have Diabetes and the mode of their blood pressure. The questionnaire also contained inquiries about their activities, for instance, how much time they spent walking, jogging, eating, drinking; the amount of time the patients rest, keep standing, cycle, or lay down; how frequently the patient goes upstairs, downstairs, for urination; is there any incident where they have fallen on account of physical illness?; do they have any itching sensations?; and so on. Most people who have Diabetes, it is not due to a straight genetic group of factors or physical lifestyle or diet; rather, it is a combination of both [54,55]. Type 2 diabetes is related to cardiovascular health issues, including hypertension and excessive triglyceride levels in the body or a history of cardiac or stroke [56]. Type 2 diabetes mellitus and health issues and physical lifestyle overlap in the population; hence, we considered secondary information mentioned with their physical activities as primary information.
Similarity measure alludes to a function that evaluates the closeness between two objects or samples. It characterizes the separation between the comparing features or the dimensions of two items. Another factor we should be worried about when processing similarity measures is estimating the distinctive dimensions that must be normalized, and the general influence of a sole dimension may turn into a critical issue. Cosine similarity estimates the Cosine of the angle between two multidimensional vectors of inner item space. Euclidian distance estimates the ruler distance between two multidimensional objects where the Cosine similarity considers the angle between those two objects considering their characteristics as parts of the vector. Depending on the values of the θ , the similarity measurement is defined. When cos θ = 1 , the two vectors are similar when cos θ = 0 , which indicates that the two vectors or objects have no similarity. Let θ be the slanted angle of these two vectors. At that point, the Cosine similarity between these two items can be expressed by
cos θ = A . B A B = i = 1 p A i B i i = 1 p A i 2 2 i = 1 p B i 2 2
where Ai and Bi are segments of vectors A and B, and ‖A‖ and ‖B‖ are the Euclidian norms of vectors A and B.

4. Assessment of Risk Factor

We utilized Cosine similarity to estimate the similarity between the experimental subject’s data and data from the diabetic patients. We pre-processed the estimation of these measurements utilizing Min-Max normalization to take out the control of a single dimension. In the wake of normalizing the data, each line was changed into its relating vector representation when leading the similarity estimation process. T is a vector representing a case experimental subjects’ dataset, and P is a vector representing an example of a dataset of diabetic patients. Every vector has seventeen vector parts, specifically, age, gender, percentage of Diabetes in first degree relatives, blood pressure, Body Mass Index, walking, sitting, standing, jogging, cycling, fallen, urination, lying, itching, drinking, eating, and using stairs; looking at the seventeen dimensions, the Cosine similarity between these two vectors can be expressed as,
cos θ = T . P T P = i = 1 17 T i P i i = 1 17 T i 2 2 i = 1 17 P i 2 2
If the similarity value is more than 75%, we obtain a comparability estimation that there should be an occurrence of the subject having been drastically affected by Diabetes. Alternatively, an estimation of 35% is produced in the event of the ordinary one. As such, we decided that a similarity higher than 75% would be viewed as a high-risk factor level, and the percentage under 35% would be viewed as a low-risk factor level. Additionally, any incentive between 35% and 75% would be viewed as a moderate risk factor dimension.
When we contrasted the data of the diabetes=-affected people with the 97 cases of data gathered from diabetic patients, we discovered a moderate similarity estimation. Figure 8. includes a line graph so that the correlation values between the experimental subject and diabetic patients are better demonstrated. For the experimental subject, we achieve an average similarity estimation of 57.3916%, which legitimizes that the activities of that individual match the diabetes symptom patterns. Thus, the average similarity measure of 57.3916% puts the patient into the moderate risk factor class. The only target subject we previously referenced was that the target patient was moderately affected by Diabetes.
Notwithstanding, it is not possible to consider any single hypo-glycemia test related to the risk of microvascular or macrovascular complications. An acute glucose consumption metric is likely to be more informative than a previous glucose measurement concerning Diabetes. The A1C provides a dependable glycemic measurement and successfully correlates with the risk of complications of long-term Diabetes. The A1C assay offers several technical advantages compared to the currently used glucose lab measurements, including pre-analytic and analytics. The investigation of [57] postulated that the focal points of A1C in contrast with Fasting Plasma Glucose (FPG) or Plasma Glucose Concentration 2 hours after oral glucose challenge (2HPG) to determine a diabetes diagnosis. The International Expert Committee for the Diagnosis of Diabetes recommends that the A1C assay is an exact proportion of the incessant glycemic levels and corresponds well with the danger of diabetes complexities. Some past research propounded that individuals with an A1C level higher than 6% but less than 6.5% are likely to be the most at risk for Diabetes, but this should not be regarded as an outright limit for initiating deterrence measures [58,59,60].
During the experiment, we wanted to determine the risk factor level for the experimental subject. Thus, the experimental subject was tested using the A1C assay, and the level of A1C was 6.1%, indicating that the experimental subject is suffering from Diabetes, which corroborated the results determined through our procedure. Along these lines, we can presume that our procedure had a high achievement rate in discovering the diabetes risk factor from activity patterns. As far as the similarity measure is concerned, we have seen that our procedure of determining risk factors shows higher performance. It justifies that our process correctly classified the experimental subject as moderately affected by Diabetes and determined the diabetes risk level that the subject is suffering from.

5. Conclusions and Future Scopes

People who have diabetes are more likely to suffer severe health complications. Diabetes is a leading cause of cardiovascular disease, blindness, kidney failure, and lower limb amputation for almost all high-income countries. Furthermore, people with diabetes are at increased risk for infectious diseases. According to the Centers for Disease and Prevention (CDC), people with diabetes are at a higher risk of contracting a serious disease, for instance, pneumonia, for people with Diabetes who develop COVID-19. The immune system is not functioning well in people who suffer from Diabetes, making battling infection more difficult in their bodies. In the context of high blood glucose, the novel coronavirus can, however, continue to survive. In combination with chronic inflammatory disorders, elevated blood sugar levels make rehabilitation from diseases such as COVID-19 much slower among individuals with Diabetes. Diabetes patients also present a 7% risk of death from COVID-19. Consequently, diabetic patients need to be constantly monitored.
We endeavoured to determine such a procedure to assist in the early diagnosis of Diabetes in this study and applied extensive research to draw conceivable and fruitful results. The active sense can be effective in suppressing Diabetes by increasing the NIDDM risk factor at an early stage. The proposed system leverages the performance of Human Activity Recognition and determines a brand-new modus operandi for the early staging of Diabetes based on daily activity patterns. Lower power consumption by employing sensor data at the 1 Hz frequency in the data collection process, and data amassment regarding activities for different versatile conditions, applying various felicitous pre-processing of the training data along with an effective deep learning classifier were implemented in this work, corroborating a robust system to forewarn the patient before the deteriorative effects of Diabetes. In the future, we anticipate a few modifications to our approach such that our system is implemented in day-to-day practice. The proposed approach will be a successful start to work reporting on how human activity could also be used to recognize their probability of disease discrepancies.
We collected data whenever the smartphone was in the participant’s pant pocket. However, smartphones cannot always be kept in a pant pocket. Sometimes, it is kept in a shirt pocket or hand when performing the activities we considered. However, the LSTM classification model was not trained. Furthermore, no female subjects were included in the HAR data collection process, which is a significant flaw in our research. We, therefore, need to train our classifier to manage these specific types of information to create a more stable system. When resting, an individual may not always have their smartphone with them. However, we have ignored this condition. As such, a method should be determined to identify when the participant is sleeping and is without their smartphone. This system requires that people maintain a connection to the internet for information from their smartphone to be retrieved and transferred to a server. We also concentrated on smartphones, but our research would be stronger if we also concentrated on handheld devices, such as smartwatches.

Author Contributions

E.H.B. and A.B. conceived and designed the experiments, performed the experiments, analyzed the data, contributed reagents/materials/analysis tools, wrote the paper, prepared figures, and/or tables. M.Z.U. conceived and designed the experiments, reviewed drafts of the paper. A.K.M.M. conceived and designed the experiments, performed the experiments, analyzed the data, contributed reagents/materials/analysis tools, prepared figures and/or tables, reviewed drafts of the paper. He led the project. All authors have read and agreed to the published version of the manuscript.

Funding

This study was partially supported by the Center for Research & Publication, International Islamic University Chittagong, Bangladesh (Project No- IRG 180102). The funders had no role in study design, data collection, analysis, decision to publish, or manuscript preparation.

Data Availability Statement

Data is describing within the article. The data that support the findings of this study are available from the corresponding author upon reasonable request.

Conflicts of Interest

The authors declare no conflict of interest.

References

  1. Narayan, K.V. How generally applicable is a simple diabetes detection questionnaire? Nat. Clin. Pract. Endocrinol. Metab. 2006, 2, 196–197. [Google Scholar] [CrossRef] [PubMed]
  2. WHO. Definition and Diagnosis of Diabetes Mellitus and Intermediate Hyperglycaemia: Report of A WHO/IDF Consultation; WHO: Geneva, Switzerland, 2006. [Google Scholar]
  3. Li, R.; Zhang, P.; Barker, L.E.; Chowdhury, F.M.; Zhang, X. Cost-effectiveness of interventions to prevent and control diabetes mellitus: A systematic review. Diabetes Care 2010, 33, 1872–1894. [Google Scholar] [CrossRef] [PubMed] [Green Version]
  4. Association, A.D. Economic costs of Diabetes in the US in 2012. Diabetes Care 2013, 36, 1033–1046. [Google Scholar] [CrossRef] [PubMed] [Green Version]
  5. Chen, L.; Pei, J.H.; Kuang, J.; Chen, H.M.; Chen, Z.; Li, Z.W.; Yang, H.Z. Effect of lifestyle intervention in patients with type 2 diabetes: A meta-analysis. Metabolism 2015, 64, 338–347. [Google Scholar] [CrossRef] [PubMed]
  6. Helmrich, S.P.; Ragland, D.R.; Leung, R.W.; Paffenbarger, R.S., Jr. Physical activity and reduced occurrence of non-insulin-dependent diabetes mellitus. N. Engl. J. Med. 1991, 325, 147–152. [Google Scholar] [CrossRef]
  7. Duong, T.V.; Bui, H.H.; Phung, D.Q.; Venkatesh, S. Activity Recognition and Abnormality Detection with the Switching Hidden Semi-Markov Model. In Proceedings of the 2005 IEEE Computer Society Conference on Computer Vision and Pattern Recognition (CVPR’05), San Diego, CA, USA, 20–25 June 2005. [Google Scholar]
  8. Bachlin, M.; Plotnik, M.; Roggen, D.; Maidan, I.; Hausdorff, J.M.; Giladi, N.; Troster, G. Wearable assistant for Parkinson’s disease patients with the freezing of gait symptom. IEEE Trans. Inf. Technol. Biomed. 2009, 14, 436–446. [Google Scholar] [CrossRef]
  9. Barna, A.; Masum, A.K.M.; Hossain, M.E.; Bahadur, E.H.; Alam, M.S. A Study on Human Activity Recognition Using Gyroscope, Accelerometer, Temperature and Humidity Data. In Proceedings of the 2019 International Conference on Electrical, Computer and Communication Engineering (ECCE), Cox’sBazar, Bangladesh, 7–9 February 2019. [Google Scholar]
  10. Bahadur, E.H.; Masum, A.K.M.; Barua, A.; Alam, M.G.R.; Chowdhury, M.A.U.Z.; Alam, M.R. LSTM Based Approach for Diabetic Symptomatic Activity Recognition Using Smartphone Sensors. In Proceedings of the 2019 22nd International Conference on Computer and Information Technology (ICCIT), Dhaka, Bangladesh, 18–20 December 2019. [Google Scholar]
  11. Masum, A.K.M.; Bahadur, E.H.; Ruhi, F.A. Scrutiny of Mental Depression through Smartphone Sensors Using Machine Learning Approaches. Int. J. Innov. Comput. 2020, 10. [Google Scholar] [CrossRef]
  12. Masum, A.K.M.; Bahadur, E.H.; Shan-A-Alahi, A.; Chowdhury, M.A.U.Z.; Uddin, M.R.; Al Noman, A. Human Activity Recognition Using Accelerometer, Gyroscope and Magnetometer Sensors: Deep Neural Network Approaches. In Proceedings of the 2019 10th International Conference on Computing, Communication and Networking Technologies (ICCCNT), Kanpur, India, 6–8 July 2019. [Google Scholar]
  13. Masum, A.K.M.; Barua, A.; Bahadur, E.H.; Alam, M.R.; Chowdhury, M.A.U.Z.; Alam, M.S. Human Activity Recognition Using Multiple Smartphone Sensors. In Proceedings of the 2018 International Conference on Innovations in Science, Engineering and Technology (ICISET), Chittagong, Bangladesh, 27–28 October 2018. [Google Scholar]
  14. Masum, A.K.M.; Jannat, S.; Bahadur, E.H.; Alam, M.G.R.; Khan, S.I.; Alam, M.R. Human Activity Recognition Using Smartphone Sensors: A Dense Neural Network Approach. In Proceedings of the 2019 1st International Conference on Advances in Science, Engineering and Robotics Technology (ICASERT), Dhaka, Bangladesh, 3–5 May 2019. [Google Scholar]
  15. Bodor, R.; Jackson, B.; Papanikolopoulos, N. Vision-BASED human Tracking and Activity Recognition. In Proceedings of the 11th Mediterranean Conf. on Control and Automation, Rhodes, Greece, 18–20 June 2003. [Google Scholar]
  16. Ni, B.; Wang, G.; Moulin, P. Rgbd-Hudaact: A Color-Depth Video Database for Human Daily Activity Recognition. In Proceedings of the 2011 IEEE International Conference on Computer Vision Workshops (ICCV Workshops), Barcelona, Spain, 6–13 November 2011. [Google Scholar]
  17. Weinland, D.; Ronfard, R.; Boyer, E. A survey of vision-based methods for action representation, segmentation and recognition. Comput. Vis. Image Underst. 2011, 115, 224–241. [Google Scholar] [CrossRef] [Green Version]
  18. Xia, L.; Aggarwal, J. Spatio-temporal Depth Cuboid Similarity Feature for Activity Recognition Using Depth Camera. In Proceedings of the IEEE Conference on Computer Vision and Pattern Recognition, Portland, OR, USA, 23–28 June 2013. [Google Scholar]
  19. Aggarwal, J.K.; Xia, L. Human activity recognition from 3d data: A review. Pattern Recognit. Lett. 2014, 48, 70–80. [Google Scholar] [CrossRef]
  20. Mukhopadhyay, S.C. Wearable sensors for human activity monitoring: A review. IEEE Sens. J. 2014, 15, 1321–1330. [Google Scholar] [CrossRef]
  21. Attal, F.; Mohammed, S.; Dedabrishvili, M.; Chamroukhi, F.; Oukhellou, L.; Amirat, Y. Physical human activity recognition using wearable sensors. Sensors 2015, 15, 31314–31338. [Google Scholar] [CrossRef] [Green Version]
  22. Jiang, W.; Yin, Z. Human Activity Recognition Using Wearable Sensors by Deep Convolutional Neural Networks. In Proceedings of the Proceedings of the 23rd ACM International Conference on Multimedia, New York, NY, USA, 26–30 October 2015. [Google Scholar]
  23. Hammerla, N.Y.; Halloran, S.; Plötz, T. Deep, convolutional, and recurrent models for human activity recognition using wearables. arXiv 2016, arXiv:1604.08880. [Google Scholar]
  24. Ronao, A.C.; Cho, S.-B. Deep convolutional neural networks for human activity recognition with smartphone sensors. In International Conference on Neural Information Processing; Springer: Cham, Switzerland, 2015. [Google Scholar]
  25. Reyes-Ortiz, J.-L.; Oneto, L.; Sama, A.; Parra, X.; Anguita, D. Transition-aware human activity recognition using smartphones. Neurocomputing 2016, 171, 754–767. [Google Scholar] [CrossRef] [Green Version]
  26. Ronao, A.C.; Cho, S.-B. Human activity recognition with smartphone sensors using deep learning neural networks. Expert Syst. Appl. 2016, 59, 235–244. [Google Scholar] [CrossRef]
  27. Hassan, M.M.; Uddin, M.Z.; Mohamed, A.; Almogren, A. A robust human activity recognition system using smartphone sensors and deep learning. Future Gener. Comput. Syst. 2018, 81, 307–313. [Google Scholar] [CrossRef]
  28. Ha, S.; Choi, S. Convolutional Neural Networks for Human Activity Recognition Using Multiple Accelerometer and Gyroscope Sensors. In Proceedings of the 2016 International Joint Conference on Neural Networks (IJCNN), Vancouver, BC, Canada, 24–29 July 2016. [Google Scholar]
  29. Ignatov, A. Real-time human activity recognition from accelerometer data using Convolutional Neural Networks. Appl. Soft Comput. 2018, 62, 915–922. [Google Scholar] [CrossRef]
  30. Alsheikh, M.A.; Selim, A.; Niyato, D.; Doyle, L.; Lin, S.; Tan, H.P. Deep Activity Recognition Models with Triaxial Accelerometers. In Proceedings of the Workshops at the Thirtieth AAAI Conference on Artificial Intelligence, Phoenix, AZ, USA, 12–17 February 2016. [Google Scholar]
  31. Chen, Y.; Zhong, K.; Zhang, J.; Sun, Q.; Zhao, X. Lstm Networks for Mobile Human Activity Recognition. In Proceedings of the 2016 International Conference on Artificial Intelligence: Technologies and Applications, Bangkok, Thailand, 24–25 January 2016. [Google Scholar]
  32. Ordóñez, J.F.; Roggen, D. Deep convolutional and lstm recurrent neural networks for multimodal wearable activity recognition. Sensors 2016, 16, 115. [Google Scholar] [CrossRef] [PubMed] [Green Version]
  33. Hernández, F.; Suárez, L.F.; Villamizar, J.; Altuve, M. Human Activity Recognition on Smartphones Using a Bidirectional LSTM Network. In Proceedings of the 2019 XXII Symposium on Image, Signal Processing and Artificial Vision (STSIVA), Bucaramanga, Colombia, 24–26 April 2019. [Google Scholar]
  34. Zhao, Y.; Yang, R.; Chevalier, G.; Xu, X.; Zhang, Z. Deep residual bidir-LSTM for human activity recognition using wearable sensors. Math. Probl. Eng. 2018, 2018. [Google Scholar] [CrossRef]
  35. Manson, J.E.; Stampfer, M.J.; Colditz, G.A.; Willett, W.C.; Rosner, B.; Hennekens, C.H.; Speizer, F.E.; Rimm, E.B.; Krolewski, A.S. Physical activity and incidence of non-insulin-dependent diabetes mellitus in women. Lancet 1991, 338, 774–778. [Google Scholar] [CrossRef]
  36. Tuomilehto, J.; Schwarz, P.; Lindström, J. Long-term benefits from lifestyle interventions for type 2 diabetes prevention: Time to expand the efforts. Diabetes Care 2011, 34 (Suppl. 2), S210–S214. [Google Scholar] [CrossRef] [Green Version]
  37. Helmrich, S.P.; Ragland, D.R.; Paffenbarger, J.R. Prevention of non-insulin-dependent diabetes mellitus with physical activity. Med. Sci. Sports Exerc. 1994, 26, 824–830. [Google Scholar] [CrossRef]
  38. Hu, F.B.; Sigal, R.J.; Rich-Edwards, J.W.; Colditz, G.A.; Solomon, C.G.; Willett, W.C.; Speizer, F.E.; Manson, J.E. Walking compared with vigorous physical activity and risk of type 2 diabetes in women: A prospective study. JAMA 1999, 282, 1433–1439. [Google Scholar] [CrossRef] [Green Version]
  39. Hu, F.B.; Leitzmann, M.F.; Stampfer, M.J.; Colditz, G.A.; Willett, W.C.; Rimm, E.B. Physical activity and television watching in relation to risk for type 2 diabetes mellitus in men. Arch. Intern. Med. 2001, 161, 1542–1548. [Google Scholar] [CrossRef] [PubMed]
  40. Kriska, M.A.; Bennett, P.H. An epidemiological perspective of the relationship between physical activity and NIDDM: From activity assessment to intervention. Diabetes Metab. Rev. 1992, 8, 355–372. [Google Scholar] [CrossRef] [PubMed]
  41. Zinman, B.; Ruderman, N.; Campaigne, B.N.; Devlin, J.T.; Schneider, S.H. Physical activity/exercise and Diabetes mellitus. Diabetes Care 2003, 26, S73. [Google Scholar] [PubMed] [Green Version]
  42. Lee, J.; Kim, J. Energy-efficient real-time human activity recognition on smart mobile devices. Mob. Inf. Syst. 2016, 2016. [Google Scholar] [CrossRef] [Green Version]
  43. Li, C.; Niu, D.; Jiang, B.; Zuo, X.; Yang, J. Meta-HAR: Federated Representation Learning for Human Activity Recognition. In Proceedings of the Web Conference 2021, Ljubljana, Slovenia, 12–23 April 2021. [Google Scholar]
  44. Association, A.D. 3. Foundations of care and comprehensive medical evaluation. Diabetes Care 2016, 39 (Suppl. 1), S23–S35. [Google Scholar]
  45. Coombes, B.; Tucker, K.; Hug, F.; Scott, A.; Geytenbeek, M.; Cox, E.R.; Gajanand, T.; Coombes, J.S. Relationships between cardiovascular disease risk factors and Achilles tendon structural and mechanical properties in people with Type 2 Diabetes. Muscles Ligaments Tendons J. 2019, 9. [Google Scholar] [CrossRef] [Green Version]
  46. Hou, J.; Sun, H.; Xiao, L.; Zhou, Y.; Yin, W.; Xu, T.; Yuan, J. Combined effect of urinary monohydroxylated polycyclic aromatic hydrocarbons and impaired lung function on Diabetes. Environ. Res. 2016, 148, 467–474. [Google Scholar] [CrossRef]
  47. Sinclair, A.J.; Abdelhafiz, A.H.; Rodríguez-Mañas, L. Frailty and sarcopenia-newly emerging and high impact complications of diabetes. J. Diabetes Complicat. 2017, 31, 1465–1473. [Google Scholar] [CrossRef]
  48. Davies, T.T.; Graue, M.; Igland, J.; Tell, G.S.; Birkeland, K.I.; Peyrot, M.; Haltbakk, J. Diabetes prevalence among older people receiving care at home: Associations with symptoms, health status and psychological well-being. Diabet. Med. 2019, 36, 96–104. [Google Scholar] [CrossRef] [PubMed] [Green Version]
  49. Valle, S.; Li, W.; Qin, S.J. Selection of the number of principal components: The variance of the reconstruction error criterion with a comparison to other methods. Ind. Eng. Chem. Res. 1999, 38, 4389–4401. [Google Scholar] [CrossRef]
  50. Gers, F.A.; Schmidhuber, J. Recurrent Nets That Time and Count. In Proceedings of the IEEE-INNS-ENNS International Joint Conference on Neural Networks. IJCNN 2000. Neural Computing: New Challenges and Perspectives for the New Millennium, Como, Italy, 27 July 2000. [Google Scholar]
  51. Lu, Y.; Salem, F.M. Simplified Gating in Long Short-Term Memory (Lstm) Recurrent Neural Networks. In Proceedings of the 2017 IEEE 60th International Midwest Symposium on Circuits and Systems (MWSCAS), Boston, MA, USA, 6–9 August 2017. [Google Scholar]
  52. Cheng, X.; Huang, B.; Zong, J. Device-free Human Activity Recognition Based on GMM-HMM using Channel State Information. IEEE Access 2021, 9, 76592–76601. [Google Scholar] [CrossRef]
  53. Nurwulan, R.N.; Selamaj, G. A Comparative Evaluation of Acceleration and Jerk in Human Activity Recognition Using Machine Learning Techniques. In Proceedings of the 1st International Conference on Electronics, Biomedical Engineering, and Health Informatics, Surabaya, Indonesia, 8–9 October 2020. [Google Scholar]
  54. Kautzky-Willer, A.; Harreiter, J.; Pacini, G. Sex and gender differences in risk, pathophysiology and complications of type 2 diabetes mellitus. Endocr. Rev. 2016, 37, 278–316. [Google Scholar] [CrossRef] [PubMed] [Green Version]
  55. Bener, A.; Yousafzai, M.T.; Al-Hamaq, A.O.; Mohammad, A.G.; DeFronzo, R.A. Parental transmission of type 2 diabetes mellitus in a highly endogamous population. World J. Diabetes 2013, 4, 40. [Google Scholar] [CrossRef]
  56. Pell, S.; D’Alonzo, C.A. Some aspects of hypertension in Diabetes mellitus. JAMA 1967, 202, 10–16. [Google Scholar] [CrossRef]
  57. Committee, I.E. International Expert Committee report on the role of the A1C assay in the diagnosis of Diabetes. Diabetes Care 2009, 32, 1327–1334. [Google Scholar] [CrossRef] [Green Version]
  58. WHO. Use of Glycated Haemoglobin (HbA1c) in Diagnosis of Diabetes Mellitus: Abbreviated Report of a WHO Consultation; WHO: Geneva, Switzerland, 2011. [Google Scholar]
  59. Zhou, X.H.; Ji, L.N.; Luo, Y.Y.; Zhang, X.Y.; Han, X.Y.; Qiao, Q. Performance of HbA1c for detecting newly diagnosed Diabetes and prediabetes in Chinese communities living in Beijing. Diabet. Med. 2009, 26, 1262–1268. [Google Scholar] [CrossRef] [PubMed]
  60. Cohen, R.M.; Haggerty, S.; Herman, W.H. HbA1c for the Diagnosis of Diabetes and Prediabetes: Is It Time for a Mid-Course Correction? Oxford University Press: Oxford, UK, 2010. [Google Scholar]
Figure 1. Flowchart depicting the proposed methodology.
Electronics 10 02194 g001
Figure 2. Generating smooth signal from accelerometer sensor data (upper) using a Butterworth low pass filter (lower).
Electronics 10 02194 g002
Figure 3. Covariance value of principal components.
Electronics 10 02194 g003
Figure 4. The architecture of Long Short-Term Memory.
Electronics 10 02194 g004
Figure 5. Proposed LSTM Network.
Electronics 10 02194 g005
Figure 6. Confusion matrix of the LSTM model.
Electronics 10 02194 g006
Figure 7. Activities performed by the target subject over thirty persistent days.
Electronics 10 02194 g007
Figure 8. Correlation values between the experimental subject and the diabetic patients.
Electronics 10 02194 g008
Publisher’s Note: MDPI stays neutral with regard to jurisdictional claims in published maps and institutional affiliations.

