Article

A Behavior-Based Malware Spreading Model for Vehicle-to-Vehicle Communications in VANET Networks

1
Faculty of Information Technology, University of Science and Technology–The University of Danang, Danang 550000, Vietnam
2
College of Computing and Informatics, Saudi Electronic University, Riyadh 11673, Saudi Arabia
3
Telecommunication Networks and Data Transmission, The Bonch-Bruevich Saint-Petersburg State University of Telecommunications, 193232 Saint Petersburg, Russia
4
Department of Applied Probability and Informatics, Peoples’ Friendship University of Russia (RUDN University), 6 Miklukho-Maklaya St., 117198 Moscow, Russia
*
Author to whom correspondence should be addressed.
Current address: Nguyen Luong Bang 54, Danang 550000, Vietnam.
Electronics 2021, 10(19), 2403; https://doi.org/10.3390/electronics10192403
Submission received: 2 September 2021 / Revised: 23 September 2021 / Accepted: 27 September 2021 / Published: 1 October 2021
(This article belongs to the Section Computer Science & Engineering)

Abstract

:
Network attacking using malware has become very popular on the Internet and in many other networks, namely Vehicular Ad-hoc Network (VANET) networks. It is required to have the model describing the malware spreading based on factors, which directly affect this process to limit its influences. In this paper, we propose a mathematical model called SEIR-S (Susceptible–Exposed–Infectious–Recovered–Susceptible) based on the characteristics of the VANET network and the well-known disease-spreading model SIR (Susceptible–Infectious–Recovered). We take into account possible behaviors of malware and provide the corresponding states to vehicles: Susceptible (S), Exposed (E), Infectious (I), Recovered (R). We evaluate the basic reproduction number R 0 of the model and perform a stability analysis of the proposed model. The results show that, when R 0 < 1, the malware spreading will gradually decrease, and, when R 0 > 1, that spreading cannot be extinguished. We also point out the condition that we can control the endemic in the VANET network. In addition, the correctness of the proposed model is verified using both numerical analysis and agent-based simulation on NetLogo.

1. Introduction

1.1. VANET Security Challenges

A Vehicular Ad-hoc Network (VANET) is a type of Mobile Ad-hoc Network (MANET). In VANET, the vehicles will be equipped with a signal receiver/transmitter to connect with adjacent vehicles. These vehicles will become the nodes as in an Ad-hoc network. The vehicles will be in contact with each other (Vehicle-to-Vehicle (V2V) Communication) or connect with the infrastructures along the roads to share/receive information (Vehicle-to-Infrastructure (V2I) Communication) (Figure 1). A vehicle can also become a relay node to transmit information to other vehicles using different wireless connection standards.
VANET has become an active area of research and development because it has many advantages to improve safety, convenience, and traffic efficiency, especially in the smart city context. Because the goal of VANET is to enhance the safety of both drivers and passengers, the security issues in VANET, such as integrity, privacy, and confidentiality, always gain huge attention. An inherent disadvantage of VANET is that its transmission information is spread in open access environments, and anyone can access it for both good and bad purposes. Moreover, VANET currently operates on the IEEE 802.11p standard [1,2], which is a technology based on IEEE 802.11a known as a Wireless Local-Area Network (WLAN) format for Mobile Ad-Hoc Networks. IEEE 802.11p also has many security vulnerabilities [3], and onboard units used to send or receive the packets do not use any form of encryption or security method. These issues become problematic because of the rise of networks sizes (number of vehicles), speed of the vehicles, their geographical position, and the randomness of the connectivity between them [4]. Despite the efforts to prevent unauthorized access to resource and critical information, ensuring protection and safety, or assuring the services, integrity, and managing access control in VANET [5,6,7,8], there are still many security threats due to the lack of consensus between nodes in the network. It is challenging to deploy the solution across the entire network.
In this section, we will briefly review the security challenges in the VANET networks.
The black hole attack, also known as a packet drop attack, is the first threat in the VANET. This kind of attack is related to a malicious node within a network. This node will first fool the network’s nodes by claiming to have the quickest path to a node that requests a route. The goal is to persuade as many nodes as possible to send their traffic through this rogue node. Then, instead of relaying network traffics to destinations, the malicious node drops the packets and prevents traffics. It results in the source’s ability to communicate with the destination being blocked [9,10,11].
Another type of attack in VANET is the wormhole attack. This attack requires establishing a wormhole link between at least two malicious nodes located in distinct physical locations. This link is used to tunnel packets between valid nodes by convincing them that they are neighbors and have the quickest path to the destination. Both attackers will be positioned in the network’s most critical positions, constructing an overlay tunnel over the wireless medium to intercept communications throughout the network. As a result, malevolent nodes gain control of every traffic that passes through them, endangering the security of data contained within packets or deleting them entirely. This attack causes significant network disruption, particularly in networks that utilize on-demand routing protocols, such as Ad-hoc On-demand Distance Vector (AODV) or Dynamic Source Routing (DSR) [12].
Broadcasting tampering and message tampering are prevalent attacks in VANET. In broadcasting tampering, the attackers inject false safety messages into the network to cause severe issues. Meanwhile, in message tampering, the attackers attempt to change the content of messages exchanged between vehicles or between vehicles with the roadside unit (RSU). The primary purpose is to interfere with the process of authentication in VANET [13,14]. Node Impersonation [15,16] attack also works in the same manner.
Any type of network can be a victim of Denial of Service Attacks (DoS) and Distributed Denial of Service (DDoS) [17]. These attacks also cause availability threats for VANET. The primary purpose of the attackers is to deny the legal vehicles and communications from accessing the network. In addition, this type of attack can also control the vehicle resources and jamming the communication channels [18].
Another critical threat in VANET is the threat to the authentication process [19,20,21,22]. This threat is usually caused by masquerading attacks. An attacker can disguise itself as a legitimate node by using other vehicles’ identities (Media Access Control (MAC) addresses or Internet Protocol (IP) addresses) and carrying out any attacks. The attacker often uses false information, such as message fabrication, alternation, and relay to perform this attack. Replay attack [23] also causes similar consequences.
The vehicles in VANET use Global Positioning System (GPS) module for identifying the geographic location. Therefore, GPS Spoofing [24] is a potential attack related to traceability and authentication. In this attack, the attacker uses a GPS simulator to generate more strong signals than the original satellite signals and fools the legitimate nodes by making them think they are in different locations.
In recent years, malware attack has emerged as a perilous threat for the VANET network. Malware can penetrate the network through the news updates from RSU and spread throughout the entire network, causing major threats to safety, availability, and privacy [25]. The diversity in malware’s attack techniques makes detection and preventing this type of attack becomes very difficult. Furthermore, to the present time, there is almost no anti-malware software that can be deployed on actual or embedded in On-Board Units (OBU) or RSU devices. Modern malware, such as Emotet [26], is fully capable of breaking authentication mechanisms with brute-force technique and quickly spreading between vehicles, causing tremendous consequences. In this study, we will focus on malware attacks and build the malware spreading model in VANET based on the characteristics of this network and the behaviors of malware.
In addition to the above security issues, there are still many other critical threats that need to be considered, such as spamming attack [27], greedy driver attack [28], sybil attack [29,30,31], passive eavesdropping [32], repudiation attack [33], and collision attack [34]. Readers can find out more details of security challenges in VANET through the studies in References [13,35,36,37,38,39,40,41,42,43,44,45,46,47,48].

1.2. Malware Attacks in VANET

According to the AV-TEST (https://www.av-test.org/en/statistics/malware/, accessed on 20 September 2021) report, malware has been spreading exponentially since 2013. Especially, the total number of malware generated increased from 719.15 million in 2017 to 1269.75 million in 2021. This report also claims that, in 2021, malware threats occupy 78.66% of the total distribution of threats. There are more statistics about malware attacks that require us to focus specifically on malware problems:
  • In the first half of 2020, SonicWall [49] recorded over 3.2 billion malware attacks.
  • According to SonicWall, ransomware increased by 62% in 2020, while IoT malware increased by 66%, with 56.9 million attacks against IoT devices.
  • Between 2017 and 2018, the number of hackers using destructive malware increased by 25% according to Symantec report [50].
Currently, there are many different types of malware, such as Computer viruses, Worm, Trojan, Ransomware, Rootkits, Spyware, Backdoor, Remote Access Trojan, Adware, and Botnet. Most of these malwares work on computer systems, mobile devices. Depending on the characteristics of each malware, there are different infection vectors. The selection of the infection vector and dimensions of an infection vector, such as speed, stealth, coverage, or shelf-life, depends on each attacker’s goal and ability.
Although the number of malwares and malware families is great, not all of them can spread from one host to another. Only a few of them can duplicate themselves to another host or location without user interaction [51], such as computational viruses: macro and script viruses. They can copy themselves and spread to other computers by attaching themselves to various programs and executing code when the user launches those programs. Another type of malware, which is also capable of self-replicating and spreading independently, in the same way as computational viruses, is a worm. However, different from viruses, worms can spread without any interference from the user. It is a scary possibility of malware, and it helps malware spread silently and quickly in any network system that lacks preventive measures and prevention methods.
Besides worms, there are some other types of trojan or backdoor also have similar capabilities. In particular, many types of trojan become “Malware Distribution Service” or “Malware-as-a-Services” (MaaS). It means these trojans will carry other kinds of malwares with many outstanding features to attack computer systems. A typical representative is Emotet. This malware can spread and perform brute-force attacks to destroy encryptions and bypass the authentication systems [52,53]. It is considered a threat for Wi-Fi and other mobile ad-hoc networks, such as VANET and Flying Ad-hoc Network (FANET) [54]. Another example of malware, which spreads between multiple hosts, is spyware [55]. This malware can entirely hide in messages or masquerade as valid applications, such as trojan, and spread between hosts. The characteristics of spyware are to infiltrate into the system and operate silently with connections to Command & Control Server (C2C) to steal user-sensitive information. A rootkit is the last malware we want to introduce. It is often related to hardware and is capable of hiding very well. A rootkit is also considered a type of hardware malware [56], causing much damage and destroying the functions of hardware devices.
Although those malwares have many advanced futures, not all of them can spread on the VANET network and impact OBU devices [25,55,57]. Other computer malwares often affect the systems or devices located in the RSU along the roads. However, it is not possible to ignore these malware types because their features are improved daily, and many malwares already exist, which can spread from mobile devices to wireless routers or wireless signal transceiver equipment [58,59].
Below, we give some hypothetical scenarios in which malware performs its behavior and causes severe consequences to the performance of the network’s and user’s safety.
  • For drivers, when an OBU system is infected with malware, the driver’s personal information can be stolen. Besides, the information about location, carID, means of vehicles, routes, or services can also be exploited and transferred to attackers through Internet connections. Taking advantage of this information, the attackers can perform man-in-the-middle attacks, proofing, or tampering attacks. It can lead to deviations in the message content or control signal and seriously affecting the driver’s safety.
  • VANET applications [60], such as forward collision warning, electronic emergency brake light systems, lane change assistance, and curve speed [61], are critical. Once the malware enters the system and interferes with the operation of the network, these emergence services may be misleading, and it leads to collisions or accidents on the road.
  • Some malwares can spread to many vehicles and turn these vehicles into malicious bots, thereby creating a botnet network. This botnet network is controlled by attackers and is used to execute DDoS attack commands [62]. Multimedia services or even connected services, network services of legitimate nodes, may be denied or not working correctly.
  • Automatic parking is a technology that enables a car to park itself without the driver intervening. To execute autonomous parking, a vehicle requires accurate distance estimators and a localization system with sub-meter precision. If the malware changes GPS information or creates a fake location, this application cannot be implemented.
  • In addition to the above scenarios, there are many other services related to entertainment, weather updates, maps, direction guide, driver assistance, and searching roadside locations, which will also be affected by the activity of malwares in the network.
From the above analysis, we can see that it is essential to keep malware from spreading over the network. Many elements influence this process. To minimize the impact of malware and prevent it from spreading, a malware spreading model based on the features of each type of network is required. There are some spreading models, which will be recalled in the next section. However, most spreading models only use three states (Susceptible-Infectious-Recovered) for all vehicles.
On the other hand, modern malware has many new features and can cause many different states to vehicles in the network instead of only three states. What states do we need to consider? How does the transition between the states occur? How do the characteristics of VANET impact this state transition? To answer these questions, in this paper, we propose a new malware spreading model based on malware behaviors and characteristics of VANET. Our main contributions are:
  • Proposing a mathematical SEIR-S model based on the behaviors of malware and the characteristics of VANET with four states: Susceptible (S), Exposed (E), Infectious (I), Recovered (R) to model the malware spreading in VANET.
  • Providing the formula to calculate basic reproduction number R 0 and analyzing the stability of malware-free equilibrium, as well as endemic equilibrium. The value R 0 indicated whether the process of malware spreading would be weakened or remained high over time.
  • Pointing out the possibility of controlling the malware epidemic by controlling the transition rate (or patching rate) from Infectious state to Recovered state.
The remainder of this paper is organized as follows: Section 2 presents the related works in this field. In Section 3, we recall the well-known SIR (Susceptible–Infectious–Recovered) model. Section 4 details the proposed Malware Spreading Model in VANET. Section 5 conducts the stability analysis and the evaluation using simulation. In Section 6, we conclude what has been achieved in this paper and point out some limitations of the proposed model.

2. Related Works

Many factors affect the spread of malware in VANET. These factors are often divided into three groups: mobility factors, communication factors, and malware infection factors [57].
  • Mobility factors: traffic density, velocity, interval, number of lanes.
  • Communication factors: the form of topology, level of connectivity, the distance between vehicles, path loss effect, fading effect, communication range, packet collision, hops per second (most of these parameters are then used to approximate the probability of a link between two VANET nodes using a log-normal shadow fading model [25]).
  • Malware infection factors: the time required for self-copy, malware strength, malware lifetime (persistence techniques), infection vectors.
Syed A. Khayam and Hayder Radha explored the characteristics influencing active worm spread over VANET in Reference [25]. Syed A. Khayam and Hayder Radha investigated the traffic model and behavior of a VANET link operating as a log-normal shadow fading channel in this paper. They proposed a stochastic model for the propagation of a worm via a VANET based on the classic SIR epidemic model. However, the assumptions about traffic distribution and the distance between vehicles (using uniform distribution) were not suitable for real cases.
Maziar Nekovee, in Reference [63], used a realistic model of node movement with a velocity-dependent shadow-fading model of wireless VANET links to create a model of worm spreading with highway traffic in a VANET. Maziar Nekovee also analyzed the network’s entire topology. However, the author assumed that the average speed allocated to all vehicles on the road is constant and that the vehicles are distributed uniformly, which may not be the case in real traffic flow. The worm propagation model used in this study is a multi-hop broadcast with infection probability. Maziar Nekovee concluded that worm propagation is highly dependent on node mobility patterns and traffic conditions in a VANET. Additionally, in all traffic conditions evaluated, the initial spreading rate is much slower than the exponential spreading rate found in Internet worm attacks.
Wang et al. [64] focused their study on modeling and simulating worm propagation in static and dynamic topology on urban situations rather than highway scenarios. They employed a well-known Intelligent Driver Model (IDM) [65] for the vehicle mobility model. Although the study’s mobility model differs from that of Reference [63], both studies developed a velocity-dependent shadow-fading model based on the traditional log-normal shadow-fading model. That is, the authors constructed the worm propagation model using the average link probability between two vehicles. The findings indicate that the rate at which a wireless worm spreads in urban traffic is highly dependent on the transmission range, velocity, and vehicle density. The worm can infect an entire network of vehicles with extensive transmission ranges, high driving speeds, and high densities. Additionally, as velocity increases, the effect of transmission ranges on worm spread is weakened, resulting in a gradually decreasing infection rate required to infect the entire network. As with Maziar Nekovee, Wang et al. described the worm propagation model using a multi-hop broadcast with infection probability.
In Reference [66], Lin Cheng and Rahul Shakya incorporated propagation and fading effects based on the dual-slope path loss and shadowing model. This spreading model is used for highway corridor and static topology. In comparison to other research, this one contributes in that the authors collected actual data under varying traffic volumes to determine vehicle distribution under diverse traffic situations. The multi-hop broadcast propagation model in this study also considered the factors, such as velocity, time interval, path loss effect, fading effect, and packet collision.
Oscar Trullols-Cruces et al., in Reference [67], studied worm epidemics in vehicular networks with highway and urban scenarios. Their evaluation was carried out on a large scale (a 10,000 km 2 region with over 3600 km of heterogeneous roads) with realistic datasets of road traffic. When developing a model of broadcast-carrier worm propagation, the authors took into account the time necessary for self-copy and malware strength. Additionally, Oscar Trullols-Cruces et al. considered the condition in which the worm propagates to only one neighboring vehicle, named the unicast carrier model. The simulation results indicate that the worm diffusion’s exceptional performance is due to (i) the increased mobility of nodes in the vehicular network and (ii) the large number of short-lived connections formed by vehicle movement. Both of these variables contribute to the optimal condition for self-propagation of a fast worm.
In Reference [68], Lei Wei et al. developed a two-layer model named the virus-traffic coupled dynamic model for studying virus spread in V2V communication networks. This model built the virus propagation process in the upper layer using the well-known SIR model. The lower layer is a traditional traffic flow model known as a cellular automata (CA), which is used to simulate traffic flow and vehicular mobility characteristics. Several findings were reached: (i) the communication range and travel distance of infected vehicles are proportional to the virus’s infection probability. Increased traffic density, on the other hand, decreases the likelihood of virus infection. This finding contrasts somewhat with the disease-spreading theories. (ii) The greater the likelihood of virus infection, the shorter the time required for the virus to propagate to the outbreak stage. It makes perfect sense in terms of epidemic models. (iii) The authors identified certain minimum proliferation thresholds for viruses. (iv) Reducing the probability of virus infection is critical for virus management under a variety of communication range constraints and traffic levels.
Some studies focus on the impact of worm propagation on V2X communications, the factors affecting malware spreading, or proposing similar worm models. The readers can refer to the studies in References [69,70,71,72,73,74,75] for more details.
In the research mentioned above, we noticed that any spreading model consists of two parts: (i) VANET model, including mobility and channel models, related to mobility and communication factors. (ii) Malware spreading model, which is related to malware infection factors. However, these research studies primarily focused on building the models showing VANET characteristics instead of being interest in the behavior of malware. In this paper, we try to build a malware spreading model based on VANET characteristics, malware’s possible behaviors, and the corresponding states of a vehicle in the network. We will analyze the spreading states based on the basic reproduction number and provide the condition to control the spread of malware.

3. SIR Model

Because our proposed malware spreading model in the VANET network is based on the most basic model of epidemics, the SIR model of Kermack and McKendrick [76], we will present a brief SIR model in this section.
In the SIR model, the population was divided into three groups, based on the disease state: (i) those who are capable of getting diseased (Susceptible); (ii) those who are infected and can spread to other people (Infected), and (iii) those who are no longer able to get sick (Removed or Recovered). In this model, the state of a person can only move from S to I (infected) or from I to R (recovered or dead, but cannot be infected again) (Figure 2).
The number of people in each group at a time t is denoted S(t), I(t), and R(t). In the simple SIR model, the total population is considered to be constant, which means S(t) + I(t) + R(t) = N does not depend on t. The most concerning quantity is I(t): the rise or fall (according to t), and its magnitude, indicate the epidemic’s tendency to spread and scale.
When the population N is “large enough”, the change of the SIR model can be approximated by the following system of differential equations:
d S d t = β S I d I d t = β S I γ I d R d t = γ I .
The equations, in turn, represent the changing rate (left-hand side) of the S, I, and R at the time t according to the state of the system at that time (right-hand side). The β parameter represents the infection rate (per capita), which can be interpreted as a probability (average) for a healthy person to be infected (transferred from S to I). Parameter γ presents the recovery rate. In other words, the average disease period (i.e., in I state) is 1/ γ .
One of the essential quantities for an epidemic model is the basic reproduction number, or often called the “ R 0 coefficient”. If R 0 < 1 , the disease will be extinguished before the outbreak, and if R 0 > 1 , the disease will break out. For example, in the above simple SIR model, R 0 = β N / γ , in which β N is the average number of healthy people that a person with the disease can spread to in disease period 1/ γ . Intuitively, it is pretty reasonable: if a person with the disease spreads to more than one person, the number of people with the disease must increase, and if, on average, a person with the disease infecting less than one other person, the number of people suffering must decrease gradually.

4. The Proposed Malware Spreading Model in VANET

4.1. Notation

In Table 1, we briefly sum up the symbols and descriptions that we use in this paper.

4.2. Link Characteristics in the VANET Network

The proposed malware spreading model is based on two essential elements: (i) VANET characteristics and (ii) propagation characteristics of malware. Therefore, in this section, we will investigate an important model expressing the VANET elements affecting the spread of malware. The model that we mentioned here is the shadow fading link model.
In the usual geometric link model, a node can communicate with another node in its radius r 0 (Figure 3a). Nevertheless, due to the influence of many external elements, the links are not entirely within a circle with r 0 radius. It may have the shape as in Figure 3b, which is called the shadow fading link model.
There have been many different link models, as we have reviewed in the related works section. Each model has its advantages and disadvantages. However, because we focus primarily on building the malware spreading model based on the well-known SIR model and the possible states of a vehicle corresponding to the behavior of malware, therefore, we will reuse some results and models built before to describe the characteristics of the VANET network instead of creating a new link model. Specifically, we will use the log-normal shadow fading link model proposed by Syed A. Khayam and Hayder Radha in Reference [25] because it is considered one of the first studies describing the relationship between the characteristics of VANET with the spreading characteristics of a worm. Moreover, this study is also based on the SIR model as the way we are doing. This shadow fading model was used to calculate the probability of two nodes communicating via a communication channel.
According to Reference [25], the average probability of a communication link between two nodes in VANET can be represented by the average effective distance and a pre-defined receiver sensitivity using the error function [77] as follows:
p l i n k = 1 2 + 1 2 erf β t h α 10 log v a τ / L 2 σ .
The descriptions of parameters in (2) are presented in Table 1. There are some notes as follows:
  • v a τ / L defined the average distance between two vehicles.
  • Path loss exponent α depends on the environment (generally 2 α 5 ). It is a parameter that indicates the rate at which the received signal strength (RSS) diminishes with distance and varies according to the propagation environment.
  • The error function is defined by:
    erf x = 2 π 0 x e φ 2 d φ , < φ < .
  • In Reference [25], the authors used p link to construct the geometric random graph and then examine worm spread’s pace using the geometric random graph’s average degree. In this paper, we only use p link as an input parameter for our model because this model depends on VANET characteristics. The assessment of the ability to spread and the speed of malware propagation will be performed by evaluating our proposed epidemic spreading model.
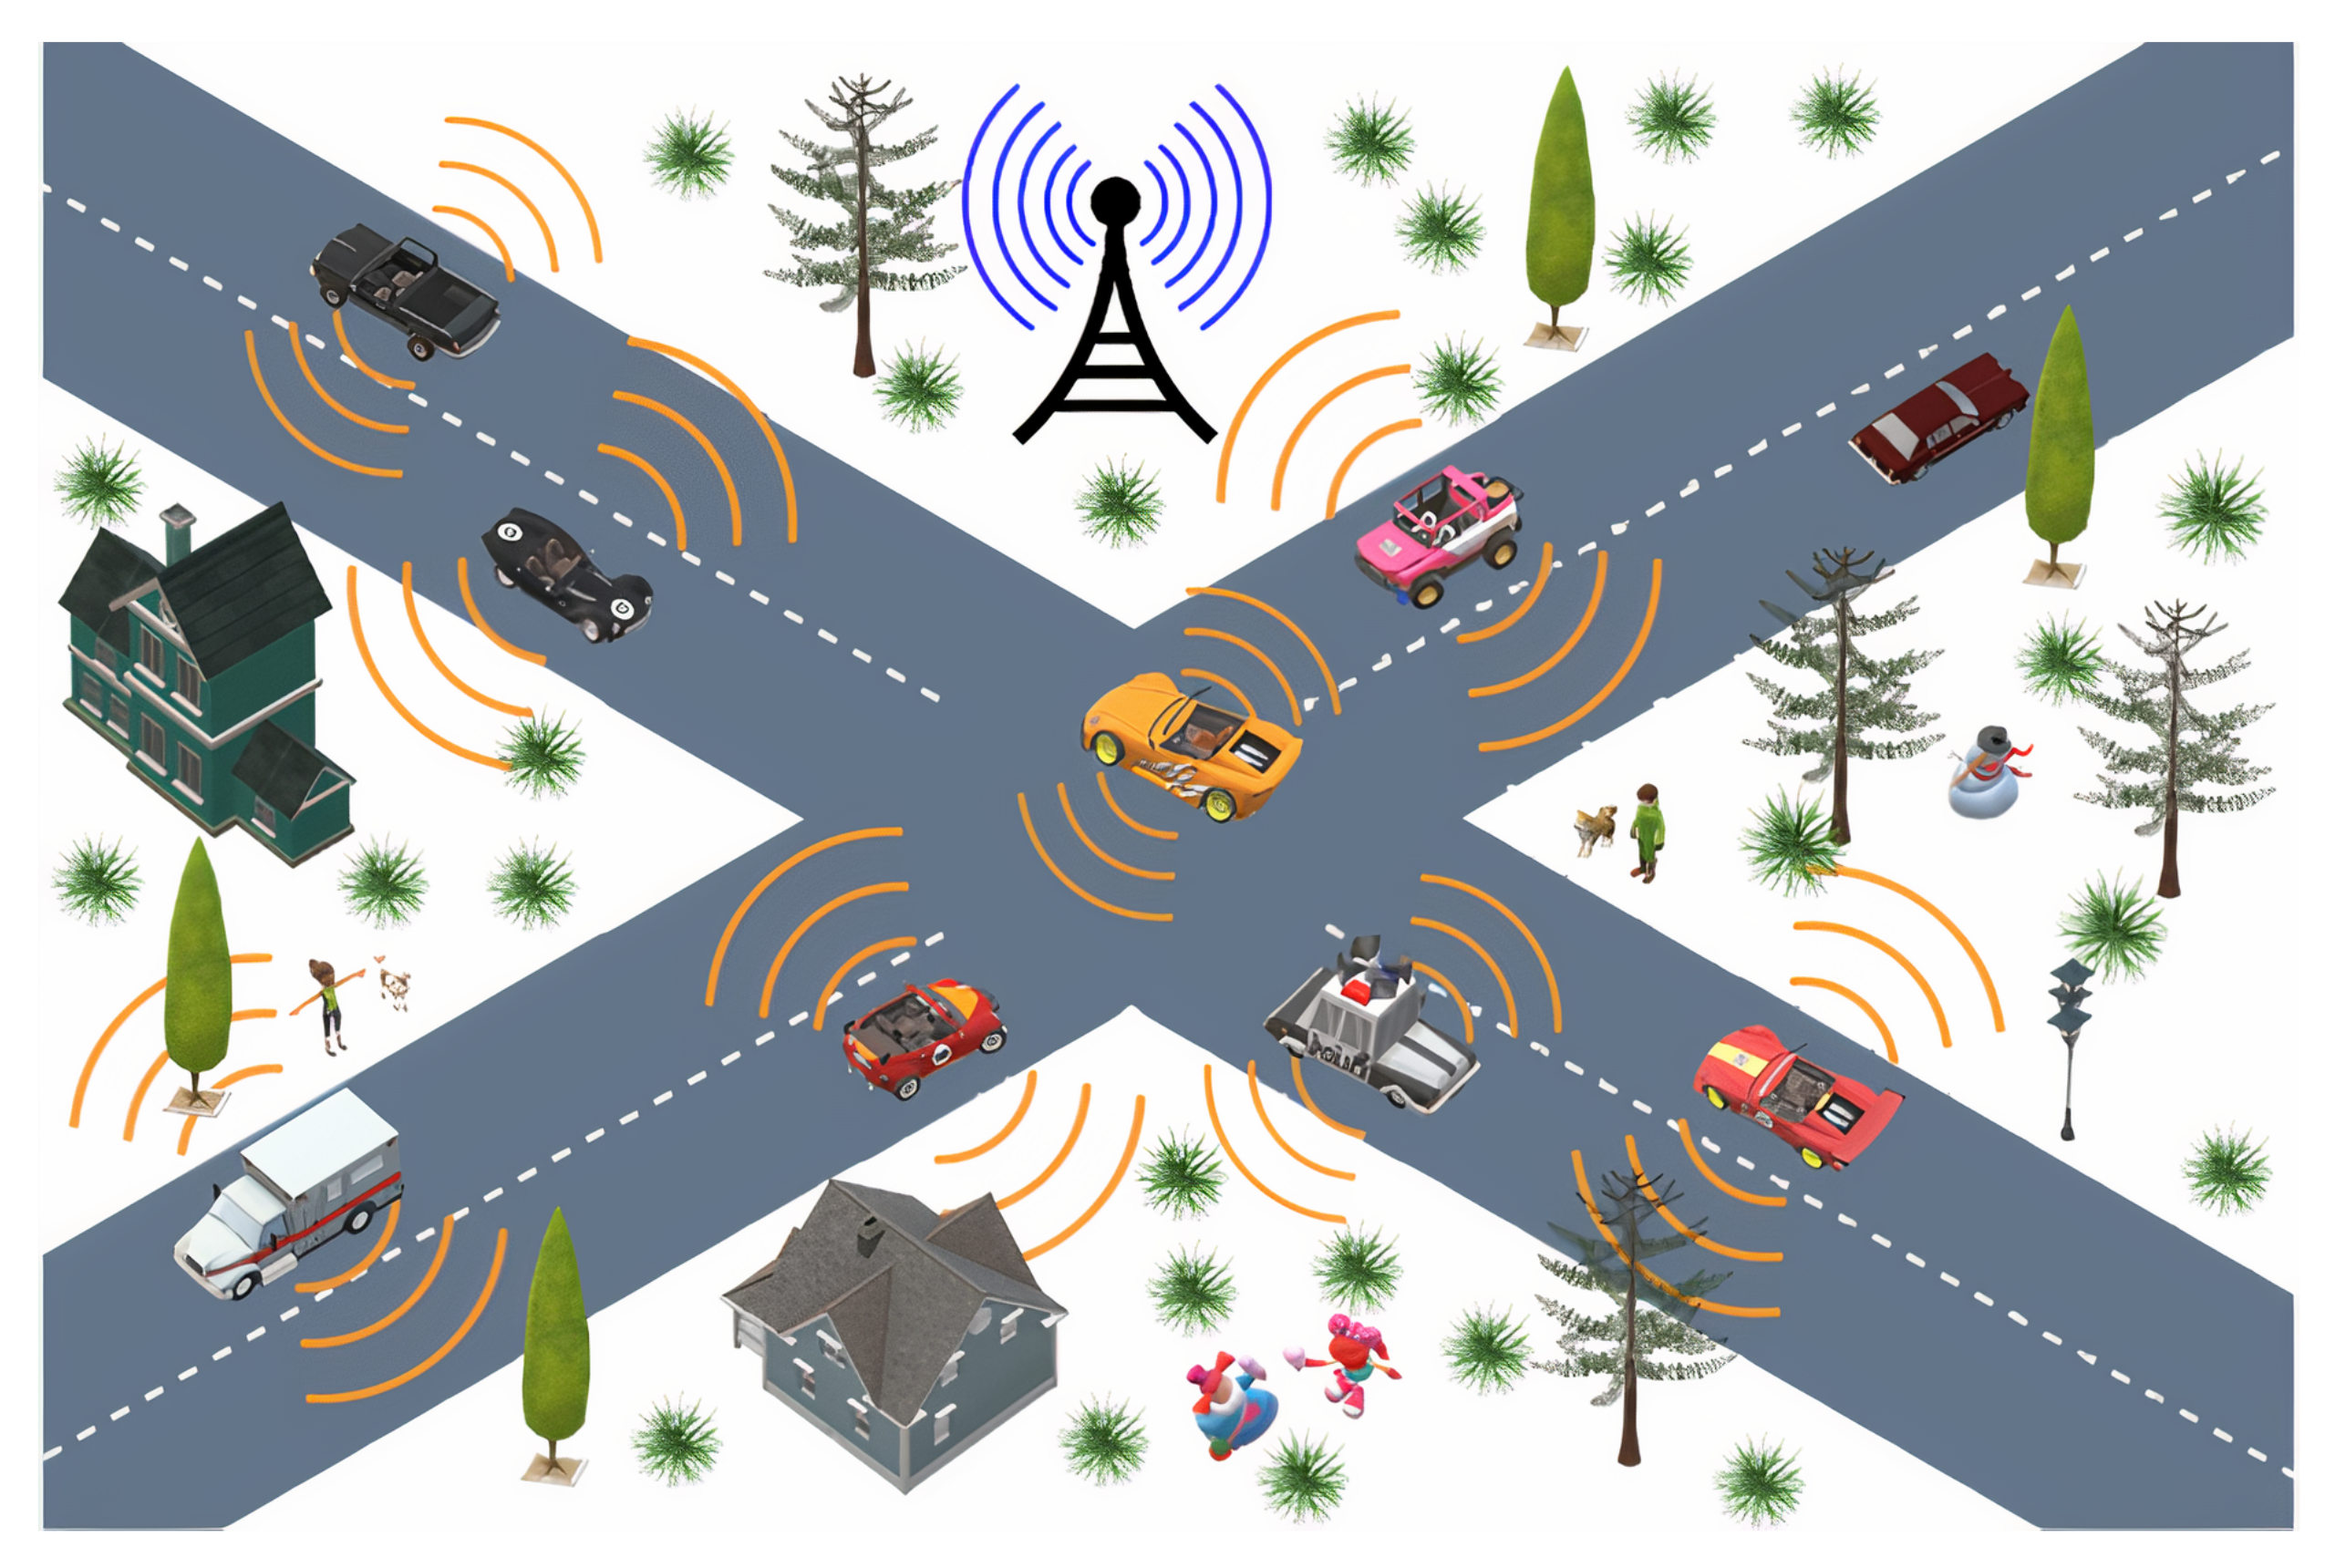
  • We combine all parameters and models related to VANET’s characteristics and call the VANET model (Figure 4).
  • In the next section, for simplicity, we will use the symbol p instead of p link .

4.3. Proposed Malware Spreading Model SEIR-S

4.3.1. Motivation

As described in related works, some studies have used the SIR model to build a worm spreading model in VANET. However, the SIR model is straightforward and can describe only some basic states of vehicles when considering the spread of malware. There are many other states related to different characteristics of different malware types. In [40], the author presented some usual types of behavior and dynamic malware spreading models, including Susceptible (S), Exposed (E), Infectious (I), Recovered (R), Quarantined (Q), Vaccinated (V), and Immunized (I). It can be seen that these states correspond to the states in epidemiology. We can build many different versions from these states depending on each specific case, such as SIRS, SEIR, SEIQRS, SEIQV, and SIRQ. The combination of these states has motivated us to build a new model for malware spreading in the VANET network.
While the Susceptible and Infectious have the same meaning as in the epidemic model, the Exposed state should be explained further. A node in the network has this state if it has been infected with malware but has not infected other vehicles. We propose to use this state because there are many types of malware using Windows API functions [78], such as Sleep, Sleepex, NtdelayExecution, and GetSystemTimeSfiletime [79], to delay their operations on the victim system for a period. Malware does this with many purposes:
  • To control the resource consumption. This activity supports malware in avoiding detection and preventing denial of service because of a high load.
  • To control the execution of other threads by suspending and resuming the threads at specific intervals.
  • To hide itself with a long sleep until some condition triggers the start of its activity.
  • To cause the dynamic analysis to time out because this kind of analysis usually is limited in a certain period.
In addition, when observing the VANET network, we noticed that an infected vehicle usually needs a particular period to contact another vehicle and infect that vehicle, especially in the case of low density.
In epidemiology, an infected person has been healed and back to the community in the Recovered state. For the vehicles in VANET, it is the case when malware is handled, and the vehicle can back to regular operation. For example, the user can use some patchings [25,80] to eliminate the malware when detecting an infected vehicle. Note that, in this process, when using multi-channel operation [81], the vehicle can still maintain its connection with the network using the control channel (CCH) and does not perform any transmission on the service channel (SCH). Therefore, it cannot cause any other infections. After removing the malware, these vehicles can return to the S state. We propose the transition state from R to S because, in VANET, many types of different malwares can exist. Other malwares can infect this vehicle again.
We do not use a Quarantined state because there is no way to insulate a vehicle but still maintain that vehicle’s existence in the network. In this paper, the Vaccinated, Immunized states are also not considered because, until now, to the best of our knowledge, there is almost no anti-malware software for devices used in VANET.
From the above analysis, we propose a model that describes the spread of malware in VANET via the states of the vehicles. This model is called SEIR-S.

4.3.2. SEIR-S Model

Mathematical Model Formulation

In this section, we present details of the proposed model SEIR-S. This model operates with four states of the vehicles: (i) S–vehicles are at risk of infection with malware; (ii) E–vehicles are infected but have not caused infections for other vehicles; (iii) I–the vehicles have been infected, and they are infecting other vehicles; (iv) R–the vehicles have been removed malware, and are ready to perform the communications in the network.
This model is built on some conventions as follows:
  • Vehicles only get infected from other vehicles belonging to I.
  • A vehicle will switch from S state to I state ( S I ) or E state ( S E ) with a certain probability after being infected from I.
  • If a vehicle is in the chain of infection and is in E state, it will switch to I state ( E I ) with a specific rate. However, it can also be detected and removed ( E R ).
  • After removing malware, a vehicle can return to the S state ( R S ). The vehicle, which is removed from the network will not be able to re-enter the network.
  • The total number of nodes in the network changes over time due to new vehicles entering the network, and some vehicles are removed from the network.
  • In each state, a vehicle may be removed from the network but not caused by malware. For example, due to damaged vehicles, the connection device fails. We assume that this rate is the same in all S, E, I, and R states. In addition, although malware can still cause loss of connection and get a vehicle out of the network, we assume that probability is small and ignore this case.
Figure 4 presents the SEIR-S model with VANET characteristics and parameters, which rule the change of states.
VANET has a dynamic link structure between vehicles in the network. Therefore, in VANET, besides the contact rate of vehicles in a time unit, we need to consider the probability of a connection between vehicles in each contact. That is the probability p link shown in (2).
It should be noted that the values above the lines in Figure 4 (for example, b S I p / N , e E , f E ) are the number of vehicles moving from one state to the other state. The symbols in the model are interpreted as follows:
  • In some other studies, the number of vehicles of each state at a particular time is often denoted as N(t), S(t), I(t), E(t), R(t). To simplify, we only use the symbols N, S, I, E, R in this paper.
  • a: This rate determines the number of new vehicles joining the network. aN is the number of new vehicles joining the network at certain times.
  • b: The transition rate from S to E of a vehicle. It is the product of the contact rate (between the infected and susceptible vehicles) with the probability of infection, which is the probability that a vehicle becomes infected after contacting other vehicles.
  • c: The transition rate from S to I of a vehicle. The meaning of c is similar to b. The only difference is the state where a vehicle becomes (E or I) after being infected with malware.
With parameters b, c, we can find the number of vehicles switching from S to E and S to I at each time. As presented above, due to the characteristics of the VANET network, the probability that a vehicle will be infected when contacting the other vehicle also depends on the probability that those vehicles create the connection. Therefore, the number of vehicles switching from S to E is b p S I / N and from S to I is determined by c p S I / N .
  • e: The transition rate from E to I.
  • f: The transition rate from E to R.
  • g: The transition rate from I to R.
  • h: The transition rate from R to S.
  • k: The rate that a vehicle is removed from the network but not by the impact of malware.
  • p: The probability of linking between the two vehicles. It is calculated according to Formula (2). It is p link .
Based on the SIR model, we build a differential equation system that describes the transition between states in the SEIR-S model as follows:
S = a N + h R b p S I N c p S I N k S E = b p S I N ( e + f + k ) E I = c p S I N + e E ( g + k ) I R = f E + g I ( h + k ) R ,
where derivative notation S , E , I , R are the rates of change of S, E, I, R versus time:
S = d S d t E = d E d t I = d I d t R = d R d t .
N is the total number of vehicles in the network at the time t:
N = S + E + I + R .
Summing equations in (4), we can obtain ( S + E + I + R ) a N k ( S + E + I + R ) . Because 0 a , k 1 , we will have lim sup t [ S + E + I + R ] N , so the set Ω = ( S , E , I , R ) R 4 , S + E + I + R N is positively invariant for (4). Therefore, we will consider the global stability of (4) on the set Ω .

Malware-Free Equilibrium and Basic Reproduction Number R 0

To study the stability of model (4), first, we must find the malware-free equilibrium point at steady states of the SEIR-S model.
It is easy to see that model (4) always has a malware-free equilibrium when all equations in (5) are equal to 0 at P 0 = S 0 , E 0 , I 0 , R 0 . With E 0 = 0 , I 0 = 0 , R 0 = 0 , we have P 0 = a N k , 0 , 0 , 0 .
Let x = S * , E * , I * , R * . x is the group states in the model (4), in which the malware spreads in the network, or it is also called malware-epidemic state. Then, the model (4) can be written as:
d x d t = F ( x ) V ( x ) ,
where
F ( χ ) = 0 b p S I N c p S I N 0 and V ( x ) = a N h R + b p S I N + c p S I N + k S ( e + f + k ) E e E + ( g + k ) I f E g I + ( h + k ) R .
F ( x ) is the matrix representing the rate of appearance of new infections in the infection states. V ( x ) is the matrix showing the change between the states without the impact of new infections.
Differentiating F ( x ) and V ( x ) with respect to S, E, I, R and evaluating at the malware-free equilibrium P 0 = a N k , 0 , 0 , 0 , respectively, we have Jacobian matrices:
D F P 0 = 0 0 0 0 0 0 b p S N 0 0 0 c p S N 0 0 0 0 0 ,
D V P 0 = k 0 b p S N + c p S N h 0 e + f + k 0 0 0 e g + k 0 0 f g h + k .
At this point, we can find the basic reproduction number R 0 . We recall that R 0 is the estimated number of secondary cases generated by a typical infective individual in an entirely susceptible community. Diekmann et al., in Reference [82], defined R 0 as the spectral radius of the next generation matrix. The next-generation matrix is defined as the square matrix G with the ijth element of G, g i j , representing the expected number of secondary infections of type i generated by a single infected individual of type j, once again assuming that the population of type i is completely susceptible. That is, each element of the matrix G represents a reproduction number, but one where who infects whom is accounted for [83].
The spectral radius is also known as the dominant eigenvalue of G. It should be noted that G is a non-negative matrix. There will always be a single, unique eigenvalue that is positive, real, and strictly greater than others. It is R 0 .
Following Diekmann et al. [82], we call G = F V 1 the next generation matrix for the model and set:
R 0 = ρ F V 1 ,
where ρ ( A ) denotes the spectral radius of a matrix A.
Then, we have:
R 0 = S 0 p ( b e + c e + c f + c k ) N ( g + k ) ( e + f + k ) .
Replacing S 0 = a N k to (9), we have:
R 0 = a p ( b e + c e + c f + c k ) k ( g + k ) ( e + f + k ) .

The Stability Analysis for Equilibriums

The equations determine the equilibriums of the model (4):
a N + h R b p S I N c p S I N k S = 0 b p S I N ( e + f + k ) E = 0 c p S I N + e E ( g + k ) I = 0 f E + g I ( h + k ) R = 0 .
As we can see, for the case of E * = 0 , I * = 0 , R * = 0 , we have the malware-free equilibrium P 0 = S 0 , E 0 , I 0 , R 0 = a N k , 0 , 0 , 0 .
For the case of E * > 0 ,   I * > 0 ,   R * > 0 , we have the endemic equilibrium P * = S * , E * , I * , R * , where:
S * = E * ( a c + b e + c e + c f ) a b a E * = E * [ a c + ( b + c ) ( e + f ) ] b R * a R * a I * = a R * = E * ( a + e + f ) N a b S * .
Let
φ 1 = a c + b e + c e + c f a b φ 2 = a c + ( b + c ) ( e + f ) b φ 3 = ( a + e + f ) N a b .
From (12) and (13), we will have:
S * = E * φ 1 a E * = a 1 + R * φ 2 R * I * = a R * = E * φ 3 E * φ 1 a
So, we have the endemic equilibrium
P * = S * , E * , I * , R * = E * φ 1 a , a 1 + R * φ 2 R * , a , E * φ 3 E * φ 1 a .

Malware-Free Equilibrium and Its Stability Analysis

It can be easily obtained that model (4) has a malware-free equilibrium given by P 0 = a N k , 0 , 0 , 0 .
Lemma 1.
If R 0 < 1 , P 0 is locally asymptotically stable with respect to Ω . Otherwise, P 0 is unstable.
Proof of Lemma 1.
According to P 0 = a N k , 0 , 0 , 0 , the Jacobian matrix at the malware-free equilibrium P 0 is:
J P 0 = k 0 b p S 0 N + c p S 0 N h 0 ( e + f + k ) b p S 0 N 0 0 e c p S 0 N ( g + k ) 0 0 f g ( h + k ) .
The corresponding eigenvalues of J P 0 are real roots λ of the equation:
det J λ I 4 = 0 ,
where the left part of (16) is characteristic polynomial, and I 4 is the identity matrix of size 4.
Solving the Equation (16), we have λ 1 = k ,   λ 2 = ( h + k ) , λ 3 and λ 4 , where λ 3 , λ 4 are the roots of Equation (17), as follows:
( e + f + k + λ ) g + k + λ a c p k a b e p k = 0 .
Letting ε 1 = e + f + k , ε 2 = g + k , ε 3 = a c p k , ε 4 = a b e p k , Equation (17) becomes:
λ 2 + ε 1 + ε 2 ε 3 λ + ε 1 ε 2 ε 3 ε 4 = 0 .
This equation has sum and product of roots, respectively:
Σ = ε 3 ε 1 ε 2 Π = ε 1 ε 2 ε 3 ε 4 .
By the stability theory [84], the sufficient condition for the four-dimensional model to be asymptotically stable is that λ i < 0 , for i = 1 , 2 , 3 , 4 . It is easy to see λ 1 < 0 and λ 2 < 0 . To have λ 3 < 0 and λ 4 < 0 , equations in (19) must satisfy:
Σ = ε 3 ε 1 ε 2 < 0 Π = ε 1 ε 2 ε 3 ε 4 > 0 .
It is equivalent to the following condition:
a c p k ( e + f + g + 2 k ) < 0 ( e + f + k ) g + k a c p k a b e p k > 0 .
From the second part of (21), we have:
k ( e + f + k ) ( g + k ) acp ( e + f + k ) abep > 0 k ( e + f + k ) ( g + k ) > a p ( b e + c e + c f + c k )
a p ( b e + c e + c f + c k ) k ( e + f + k ) ( g + k ) < 1 .
From (10) and (22), we have R 0 < 1 .
The inequation (22) is also equivalent to the following inequation:
a c p k < ( g + k ) a b e p k ( e + f + k ) < ( g + k ) + ( e + f + k ) ,
and it satisfies the first part of (21).
Hence, we can conclude that if ( 21 ) is satisfied or R 0 < 1 , P 0 is locally asymptotically stable. Otherwise, P 0 is unstable.
If R 0 < 1 , an infected individual produces on average less than one new infected individual during its infectious period, and the infection cannot spread. On the other hand, if R 0 > 1 , each infected individual produces more than one new infection on average, allowing the disease to spread across the community.  □
Lemma 2.
When R 0 1 , the malware-free equilibrium P 0 is globally asymptotically stable in Ω. When R 0 > 1 , otherwise, P 0 is unstable.
Proof of Lemma 2.
L ( S , E , I , R ) = I > 0 as a Lyapunov function; then L P 0 = 0 . Its derivative along the solutions to the model (4) is:
d L d t ( S , E , I , R ) = c p S I N + e E ( g + k ) I = I c p S N + bepS N ( e + f + k ) ( g + k ) = I ( g + k ) a p ( b e + c e + c f + c k ) k ( g + k ) ( e + f + k ) 1
d L d t ( S , E , I , R ) = I ( g + k ) R 0 1 .
We can see that, L = 0 if and only if I = 0 or R 0 = 0 . Thus, the largest compact invariant set in ( S , E , I , R ) L = 0 is the singleton P 0 . When R 0 1 , the global stability of P 0 follows from LaSalle’s invariance principle [85]. LaSalle’s invariance principle implies that P 0 is globally asymptotically stable in Ω . When R 0 > 1 , it follows the fact L > 0 if I > 0 . Thus, the lemma is proved.  □

Endemic Equilibrium and Its Stability Analysis

Now, we examine the endemic equilibrium’s local stability P * = S * , E * , I * , R * . The Jacobian matrix of (4) at the endemic equilibrium P * is:
J P * = X 1 0 X 2 h b p I * N ( e + f + k ) b p S * N 0 c p I * N e X 3 0 0 f g ( h + k ) ,
where
X 1 = b p I * N c p I * N k X 2 = b p S * N c p S * N X 3 = c p I * N g k .
Thus, the corresponding characteristic equation can be denoted as:
λ 4 + C 1 λ 3 + C 2 λ 2 + C 3 λ + C 4 = 0 ,
where
C 1 = e X 3 X 1 + f + h + 2 k > 0
C 2 = X 1 e X 1 X 3 k 2 + X 3 e + X 1 f + X 3 f + X 1 h + X 3 h + 2 X 1 k + 2 X 3 k e h f h e k f k h k + I * X 2 c p / N + N S * b e p / N
C 3 = X 1 k 2 + X 3 k 2 X 1 X 3 e X 1 X 3 f X 1 X 3 h 2 X 1 X 3 k + X 1 e h + X 3 e h + X 1 f h + X 3 f h + X 1 e k + X 3 e k + X 1 f k + X 3 f k + X 1 h k + X 3 h k + I * X 2 b e p / N + I * X 2 cep / N + I * X 2 c f p / N + I * X 2 chp / N + 2 I * X 2 c k p / N S * X 1 b e p / N + I * b f h p / N + I * cghp / N + S * b e h p / N + S * bekp / N
C 4 = I * N X 2 c k 2 p N 2 X 1 X 3 e h N 2 X 1 X 3 f h N 2 X 1 X 3 e k N 2 X 1 X 3 f k N 2 X 1 X 3 h k N 2 X 1 X 3 k 2 + I * N c g h k p + I * S * b c f h p 2 + I * N X 2 b e h p + I * N X 2 c e h p I * N X 3 b f h p + I * N X 2 c f h p + I * N X 2 b e k p + I * N X 2 c e k p + I * N X 2 c f k p + I * N X 2 c h k p N S * X 1 b e h p N S * X 1 b e k p + I * N b e g h p + I * N c e g h p + I * N c f g h p / N 2 .
From (25), we can obtain elements of the Hurwitz matrix H as follows:
H 1 = C 1 H 2 = C 1 C 2 C 3 H 3 = C 1 C 3 0 1 C 2 C 4 0 C 1 C 3 = C 3 H 2 C 1 2 C 4 H 4 = C 4 H 3 .
From these expressions, we can obtain that, with P * = S * , E * , I * , R * , we have H 1 > 0 , H 2 > 0 , H 3 > 0, and H 4 > 0 . According to the theorem of the Routh-Hurwitz criterion [84], all roots of the Equation (25) have negative real components. As a result, the endemic equilibrium P * is locally asymptotically stable.
Using the same way of proof as in Lemma 2 with P * = S * , E * , I * , R * , we have:
d L d t ( S , E , I , R ) = I ( g + k ) c p S * N ( g + k ) + b e p S * N ( g + k ) ( e + f + k ) 1 = I ( g + k ) S * k a p ( b e + c e + c f + c k ) a k N ( g + k ) ( e + f + k ) 1 d L d t ( S , E , I , R ) = I ( g + k ) S * k a N R 0 1 .
Model (4) is globally asymptotically stable if d L d t ( S , E , I , R ) 0 at P * = S * , E * , I * , R * . It means that we need:
I ( g + k ) S * k a N R 0 1 0 S * k a N R 0 1 k a R 0 1 0 R 0 a k .
From the above discussion, we can summarize the following conclusion: if R 0 a k , the unique positive equilibrium P * of the model (4) is globally asymptotically stable in Ω .

Malware Epidemic Control

Lemma 2 indicates that the combined efforts (represented by the formulation of R 0 ) can eliminate malware prevalence in the whole network. Under the SEIR-S propagation model, we investigate how to control the malware-free equilibrium in network administration.
There are two patching rates or the recovered rates, which help to control the malware spreading speed. They are transition rate from E to R (denoted by f) and transition rate from I to R (denoted by g). However, because malware detection in the exposed state is much more complicated than the infectious state, we are primarily interested in the parameter g.
From (10) and (23), we have:
g > a p ( b e + c e + c f + c k ) k ( e + f + k ) k .
To stop the malware’s propagation, the patching rate should satisfy the condition (26). If this inequality cannot be satisfied, the malware will spread widely through networks.

5. Numerical & NetLogo Simulations

5.1. Numerical Simulation

In this section, the numerical simulation is used to illustrate and analyze model SEIR-S. We will evaluate the correlation between the states for the process of malware spreading. Note that the numerical simulation results on the graphs (in Figure 5 and Figure 6) are represented by solid lines.
We use two sets of different parameters as in Table 2 for two cases R 0 < 1 and R 0 > 1 .
Case 1 : R 0 < 1
Using the above parameters, we can obtain the basic reproduction number R 0 = 0.632 . The malware will be gradually decreased according to Lemma 1 and Lemma 2. It can be seen that, because the parameters b , c (the transition rates from S to E and S to I , respectively), as well as the link probability p link = 0.894 ), are pretty high, the process of spreading occurs fast in the early stages (Figure 5). However, after a period, the spreading is slowed down due to the effective patching process. Corresponding to this process, the number of nodes in the S state increases due to adding new vehicles with a parameter and recovered vehicles from the R state.
Case 2 : R 0 > 1
With this parameter set, we have R 0 = 1.711 . In this case, we only change the transition rate from I to R   g parameter), other parameters remain unchanged. With R 0 > 1 it is easy to realize that the infection state cannot be extinguished in the network. Because b and c do not change, therefore, the infection process took place quickly. The number of infected vehicles with malware quickly reached the maximum value then dropped, but still at a high level (Figure 6). The decrease in the number of infected vehicles is due to the transition to the R state. Although the S state always gets a certain number of new vehicles, the number of vehicles in this state is almost impossible to increase due to the malware spreading in the network. It is perfectly consistent with the above stability analysis of endemic equilibrium.
Because we only changed the g parameter in both cases, the change of R 0 and the increase in the number of infected vehicles depend on g very clearly. This conclusion was pointed out with condition (26) for malware epidemic control. The dependence of R 0 into g is shown in Figure 7. The result shows that the higher g is (the patching rate increases), the higher R 0 becomes. It means that the spread of malware in the network will gradually decrease over time.

5.2. NetLogo Simulation

In this paper, the simulation experiments are also produced using NetLogo (https://ccl.northwestern.edu/netlogo/index.shtml, accessed on 20 September 2021), an agent-based simulation environment (ABMS). The ABMS paradigm is a powerful tool for simulating complicated communication networks. Because network nodes behave independently and have individual characteristics during the malware dissemination process, agents are well suited for abstracting them. As a result, we studied the malware spreading process using agent-based modeling. NetLogo is ideally suited for simulating complex systems that change with the times. Modelers can issue commands to hundreds or thousands of “agents” that operate autonomously. It enables the investigation of the relationship between individuals’ micro-level behavior and the macro-level patterns that arise from their interaction.
To simulate the malware spreading for the VANET network on NetLogo, we need to ensure the characteristics of the VANET are taken into account. As mentioned above, our primary goal is not to develop a link model for the VANET but to build a malware spreading model based on VANET’s characteristics. Therefore, instead of building a traffic model in NetLogo, we will use the initial parameter sets to provide the link probability between the vehicles. It not only reduces the simulation time but also ensures the characteristics of VANET in NetLogo.
The vehicles, i.e., the agents, will move randomly in a specific range. We assume that the vehicles are located at the center of the circle representing the linking range. When a vehicle is in another vehicle’s radius area, a connection can happen between those two vehicles. Each state of the vehicle is represented with a corresponding color. We use simulated parameter sets as in numerical simulation to assess the accuracy of the model. Figure 8 illustrates the simulation process of our model with NetLogo.
As seen in Figure 8, the results of NetLogo’s agent-based SEIR-S model of malware propagation are consistent with the analytical SEIR-S model results in numerical simulation under the same parameters. These results, denoted by dashed lines in Figure 5 and Figure 6, confirm the correctness and validity of the SEIR-S model. We can see that the numerical curves and simulation curves are very similar. There is little difference between the curves because the analytical model has a high level of abstraction. Additionally, the model does not explicitly examine the network topology, and we only used the link probability to ensure the VANET characteristics in NetLogo.

6. Conclusions

Preventing malware from spreading in any network is a challenging task. Many factors impact this spreading process. It is necessary to build a malware spreading model based on the characteristics of each type of network to limit the impact of malware and prevent malware from spreading. In this paper, we proposed a mathematical SEIR-S model with four states: Susceptible (S), Exposed (E), Infectious (I), Recovered (R) to model the malware spreading behavior in VANET. We considered the characteristics of VANET, especially the link model, which decides the infection rate and the characteristics of modern malwares, which threaten the security in VANET.
We provided the basic reproduction number R 0 and analyzed the stability of malware-free equilibrium, as well as endemic equilibrium. The value R 0 indicated whether the process of malware spreading would be weakened ( R 0 < 1 ) or remained high over time ( R 0 > 1 ).
The mathematical analysis pointed out the possibility of controlling the malware epidemic by controlling the transition rate (or patching rate) from I to R.
Finally, we used both numerical analysis and agent-based simulation NetLogo to verify the correctness of our model. The comparison results proved the validity of the model.
However, we should note that the proposed model still has some limitations as follows:
  • The model is built on some assumptions, and, in some cases, it may not be suitable for real cases.
  • We did not consider the V2I infrastructure in the model. However, the malware also can spread from the RSU to vehicles.
  • We used the log-normal shadow fading link model proposed by Syed A. Khayam and Hayder Radha in Reference [25] because it is considered one of the first studies describing the relationship between the characteristics of VANET with the spreading characteristics of a worm. However, this link model seems to have some limitations, and we did not evaluate the impacts of these limitations on our proposed model.
In future works, we will consider more malware behaviors to build the model more accurately and find the appropriate methods to prevent malware from spreading in VANET.

Author Contributions

Conceptualization, D.T.L. and K.Q.D.; methodology, D.T.L.; software, K.Q.D.; validation, K.Q.D. and Q.L.T.N.; writing—original draft preparation, K.Q.D.; writing—review and editing, D.T.L., A.M. and S.A.; visualization, K.Q.D. and Q.L.T.N.; supervision, D.T.L. and A.M.; project administration, D.T.L.; funding acquisition, D.T.L. and A.M. All authors have read and agreed to the published version of the manuscript.

Funding

This paper has been supported by the RUDN University Strategic Academic Leadership Program.

Acknowledgments

This work was supported by The University of Danang, University of Science and Technology, code number of Project: T2021-02-06.

Conflicts of Interest

The authors declare no conflict of interest. The funders had no role in the design of the study; in the collection, analyses, or interpretation of data; in the writing of the manuscript, or in the decision to publish the results.

References

  1. Jiang, D.; Delgrossi, L. IEEE 802.11p: Towards an International Standard for Wireless Access in Vehicular Environments. In Proceedings of the VTC Spring 2008-IEEE Vehicular Technology Conference, Singapore, 11–14 May 2008. [Google Scholar] [CrossRef]
  2. Arena, F.; Pau, G.; Severino, A. A Review on IEEE 802.11p for Intelligent Transportation Systems. J. Sens. Actuator Netw. 2020, 9, 22. [Google Scholar] [CrossRef]
  3. Ucar, S.; Ergen, S.C.; Ozkasap, O. Security Vulnerabilities of IEEE 802.11p and Visible Light Communication Based Platoon. In Proceedings of the 2016 IEEE Vehicular Networking Conference (VNC), Columbus, OH, USA, 8–10 December 2016. [Google Scholar] [CrossRef]
  4. Kumar, V.; Shalni, S.R.; Singh, R.; Banerjee, G. A Comprehensive Analysis on The Threats and Vulnerabilities in VANET Technology. Int. J. Comput. Eng. Res. Trends 2015, 2, 280–283. [Google Scholar]
  5. Rajput, U.; Abbas, F.; Eun, H.; OH, H. A Hybrid Approach for Efficient Privacy-Preserving Authentication in VANET. IEEE Access 2017, 5, 12014–12030. [Google Scholar] [CrossRef]
  6. Palaniswamy, B.; Camtepe, S.; Foo, E.; Simpson, L.; Baee, M.A.R.; Pieprzyk, J. Continuous Authentication For VANET. Veh. Commun. 2020, 25, 100255. [Google Scholar] [CrossRef]
  7. Sumra, I.A.; Hasbullah, H.B.; lail Bin AbManan, J. Attacks on Security Goals (Confidentiality, Integrity, Availability) in VANET: A Survey. In Advances in Intelligent Systems and Computing; Springer: Singapore, 2014; pp. 51–61. [Google Scholar] [CrossRef]
  8. Stanica, R.; Chaput, E.; Beylot, A.L. Enhancements of Ieee 802.11p Protocol For Access Control an A VANET Control Channel. In Proceedings of the 2011 IEEE International Conference on Communications (ICC), Kyoto, Japan, 5–9 June 2011. [Google Scholar] [CrossRef]
  9. Tobin, J.; Thorpe, C.; Murphy, L. An Approach to Mitigate Black Hole Attacks on Vehicular Wireless Networks. In Proceedings of the 2017 IEEE 85th Vehicular Technology Conference (VTC Spring), Sydney, Australia, 4–7 June 2017. [Google Scholar] [CrossRef]
  10. Kumar, M.; Jain, V.; Jain, A.; Bisht, U.S.; Gupta, N. Evaluation of Black Hole Attack with Avoidance Scheme Using AODV Protocol in VANET. J. Discret. Math. Sci. Cryptogr. 2019, 22, 277–291. [Google Scholar] [CrossRef]
  11. Kumar, A.; Varadarajan, V.; Kumar, A.; Dadheech, P.; Choudhary, S.S.; Kumar, V.A.; Panigrahi, B.; Veluvolu, K.C. Black Hole Attack Detection in Vehicular Ad-hoc Network Using Secure AODV Routing Algorithm. Microprocess. Microsyst. 2021, 80, 103352. [Google Scholar] [CrossRef]
  12. Safi, S.M.; Movaghar, A.; Mohammadizadeh, M. A Novel Approach for Avoiding Wormhole Attacks in VANET. In Proceedings of the 2009 Second International Workshop on Computer Science and Engineering, Qingdao, China, 28–30 October 2009. [Google Scholar] [CrossRef]
  13. Junaid, M.A.H.A.; Syed, A.; Warip, M.N.M.; Azir, K.N.F.K.; Romli, N.H. Classification of Security Attacks in VANET: A Review of Requirements and Perspectives. MATEC Web Conf. 2018, 150, 06038. [Google Scholar] [CrossRef]
  14. Leinmuller, T.; Schmidt, R.K.; Schoch, E.; Held, A.; Schafer, G. Modeling Roadside Attacker Behavior in VANETs. In Proceedings of the 2008 IEEE Globecom Workshops, New Orleans, LA, USA, 30 November–4 December 2008. [Google Scholar] [CrossRef]
  15. Nema, M.; Stalin, S.; Lokhande, V. Analysis of Attacks and Challenges in VANET. Int. J. Emerg. Technol. Adv. Eng. 2014, 4, 831–835. [Google Scholar]
  16. Chhatwal, S.S.; Sharma, M. Detection of impersonation attack in VANETs using BUCK Filter and VANET Content Fragile Watermarking (VCFW). In Proceedings of the 2015 International Conference on Computer Communication and Informatics (ICCCI), Coimbatore, India, 8–10 January 2015. [Google Scholar] [CrossRef]
  17. Adhikary, K.; Bhushan, S.; Kumar, S.; Dutta, K. Hybrid Algorithm to Detect DDoS Attacks in VANETs. Wirel. Pers. Commun. 2020, 114, 3613–3634. [Google Scholar] [CrossRef]
  18. Alheeti, K.M.A.; Gruebler, A.; McDonald-Maier, K.D. An Intrusion Detection System Against Malicious Attacks on the Communication Network of Driverless Cars. In Proceedings of the 2015 12th Annual IEEE Consumer Communications and Networking Conference (CCNC), Las Vegas, NV, USA, 9–12 January 2015. [Google Scholar] [CrossRef]
  19. Siddiqui, N.R.; Khaliq, K.A.; Pannek, J. VANET Security Analysis on the Basis of Attacks in Authentication. In Dynamics in Logistics; Springer International Publishing: Berlin/Heidelberg, Germany, 2016; pp. 491–502. [Google Scholar] [CrossRef]
  20. Vijayalakshmi, N.; Sasikumar, R. An ID-Based Privacy Preservation for VANET. In Proceedings of the 2015 International Conference on Computing and Communications Technologies (ICCCT), Chennai, India, 26–27 February 2015. [Google Scholar] [CrossRef]
  21. Nandy, T.; Idris, M.Y.I.B.; Noor, R.M.; Ahmedy, I.; Bhattacharyya, S. An Enhanced Two-factor Authentication Protocol for V2V Communication in VANETs. In Proceedings of the 2020 the 3rd International Conference on Information Science and System, Cambridge, UK, 19–22 March 2020. [Google Scholar] [CrossRef]
  22. Hamdi, M.M.; Yussen, Y.A.; Mustafa, A.S. Integrity and Authentications for Service Security in Vehicular Ad-hoc Networks (VANETs): A Review. In Proceedings of the 2021 3rd International Congress on Human-Computer Interaction, Optimization and Robotic Applications (HORA), Ankara, Turkey, 11–13 June 2021. [Google Scholar] [CrossRef]
  23. Al-shareeda, M.A.; Anbar, M.; Hasbullah, I.H.; Manickam, S.; Abdullah, N.; Hamdi, M.M. Review of Prevention schemes for Replay Attack in Vehicular Ad hoc Networks (VANETs). In Proceedings of the 2020 IEEE 3rd International Conference on Information Communication and Signal Processing (ICICSP), Shanghai, China, 12–15 September 2020. [Google Scholar] [CrossRef]
  24. Bittl, S.; Gonzalez, A.A.; Myrtus, M.; Beckmann, H.; Sailer, S.; Eissfeller, B. Emerging Attacks on Vanet Security Based on GPS Time Spoofing. In Proceedings of the 2015 IEEE Conference on Communications and Network Security (CNS), Florence, Italy, 28–30 September 2015. [Google Scholar] [CrossRef]
  25. Khayam, S.A.; Radha, H. Analyzing the Spread of Active Worms over VANET. In Proceedings of the First ACM Workshop on Vehicular ad Hoc Networks, Philadelphia, PA, USA, 1 October 2004. [Google Scholar] [CrossRef]
  26. Team, S.R. Emotet Exposed: Looking Inside Highly Destructive Malware. Netw. Secur. 2019, 2019, 6–11. [Google Scholar] [CrossRef]
  27. Sumra, I.A.; Ahmad, I.; Hasbullah, H. Behavior of Attacker and Some New Possible Attacks in Vehicular Ad Hoc Network (VANET). In Proceedings of the 2011 3rd International Congress on Ultra Modern Telecommunications and Control Systems and Workshops (ICUMT), Budapest, Hungary, 5–7 October 2011; pp. 1–8. [Google Scholar]
  28. Mejri, M.N.; Ben-Othman, J. GDVAN: A New Greedy Behavior Attack Detection Algorithm for VANETs. IEEE Trans. Mobile Comput. 2017, 16, 759–771. [Google Scholar] [CrossRef]
  29. Karn, C.K.; Gupta, C.P. A Survey on VANETs Security Attacks and Sybil Attack Detection. Int. J. Sens. Wirel. Commun. Control 2016, 6, 45–62. [Google Scholar] [CrossRef]
  30. Chaubey, N.K.; Yadav, D. A Taxonomy of Sybil Attacks in Vehicular Ad-Hoc Network (VANET). In IoT and Cloud Computing Advancements in Vehicular Ad-Hoc Networks; IGI Global: Hershey, PA, USA, 2020; pp. 174–190. [Google Scholar] [CrossRef]
  31. Funderburg, L.E.; Lee, I.Y. A Privacy-Preserving Key Management Scheme with Support for Sybil Attack Detection in VANETs. Sensors 2021, 21, 1063. [Google Scholar] [CrossRef]
  32. Choudhari, D.P.; Dorle, S.S. Maximization of Packet Delivery Ratio for DADCQ Protocol after Removal of Eavesdropping And DDoS Attacks in VANET. In Proceedings of the 2019 10th International Conference on Computing, Communication and Networking Technologies (ICCCNT), Kanpur, India, 6–8 July 2019. [Google Scholar] [CrossRef]
  33. Li, J.; Lu, H.; Guizani, M. ACPN: A Novel Authentication Framework with Conditional Privacy-Preservation and Non-Repudiation for VANETs. IEEE Trans. Parallel Distrib. Syst. 2015, 26, 938–948. [Google Scholar] [CrossRef]
  34. Tolba, A. Trust-Based Distributed Authentication Method for Collision Attack Avoidance in VANETs. IEEE Access 2018, 6, 62747–62755. [Google Scholar] [CrossRef]
  35. Verma, A.; Saha, R.; Kumar, G.; hoon Kim, T. The Security Perspectives of Vehicular Networks: A Taxonomical Analysis of Attacks and Solutions. Appl. Sci. 2021, 11, 4682. [Google Scholar] [CrossRef]
  36. Sheikh, M.S.; Liang, J. A Comprehensive Survey on VANET Security Services in Traffic Management System. Wirel. Commun. Mob. Comput. 2019, 2019, 1–23. [Google Scholar] [CrossRef] [Green Version]
  37. Sheikh, M.S.; Liang, J.; Wang, W. A Survey of Security Services, Attacks, and Applications for Vehicular Ad Hoc Networks (VANETs). Sensors 2019, 19, 3589. [Google Scholar] [CrossRef] [Green Version]
  38. Azam, F.; Kumar, S.; Yadav, K.; Priyadarshi, N.; Padmanaban, S. An Outline of the Security Challenges in VANET. In Proceedings of the 2020 IEEE 7th Uttar Pradesh Section International Conference on Electrical, Electronics and Computer Engineering (UPCON), Prayagraj, India, 27–29 November 2020. [Google Scholar] [CrossRef]
  39. Azees, M.; Vijayakumar, P.; Deborah, L.J. Comprehensive Survey on Security Services in Vehicular Ad-Hoc Networks. IET Intell. Transp. Syst. 2016, 10, 379–388. [Google Scholar] [CrossRef]
  40. Bariah, L.; Shehada, D.; Salahat, E.; Yeun, C.Y. Recent Advances in VANET Security: A Survey. In Proceedings of the 2015 IEEE 82nd Vehicular Technology Conference (VTC2015-Fall), Boston, MA, USA, 6–9 September 2015. [Google Scholar] [CrossRef]
  41. Al-kahtani, M.S. Survey on Security Attacks in Vehicular Ad hoc Networks (VANETs). In Proceedings of the 2012 6th International Conference on Signal Processing and Communication Systems, Gold Coast, Australia, 12–14 December 2012. [Google Scholar] [CrossRef]
  42. Nguyen, H.P.D.; Zoltan, R. The Current Security Challenges of Vehicle Communication in the Future Transportation System. In Proceedings of the 2018 IEEE 16th International Symposium on Intelligent Systems and Informatics (SISY), Subotica, Serbia, 13–15 September 2018. [Google Scholar] [CrossRef]
  43. Choudhary, S.; Purohit, K. VANET: Its Applications, Security Requirements, Types of Attacks and its Corrective Measures. In Proceedings of the 2018 International Conference on Computing, Power and Communication Technologies (GUCON), Greater Noida, India, 28–29 September 2018. [Google Scholar] [CrossRef]
  44. Mustafa, A.S.; Hamdi, M.M.; Mahdi, H.F.; Abood, M.S. VANET: Towards Security Issues Review. In Proceedings of the 2020 IEEE 5th International Symposium on Telecommunication Technologies (ISTT), Shah Alam, Malaysia, 9–11 November 2020. [Google Scholar] [CrossRef]
  45. Abassi, R. VANET Security and Forensics: Challenges and Opportunities. Wiley Interdiscip. Rev. Forensic Sci. 2019, 1, e1324. [Google Scholar] [CrossRef]
  46. Hamdi, M.M.; Audah, L.; Abood, M.S.; Rashid, S.A.; Mustafa, A.S.; Mahdi, H.; Al-Hiti, A.S. A Review on Various Security Attacks in Vehicular Ad-hoc Networks. Bull. Electr. Eng. Inform. 2021, 10, 2627–2635. [Google Scholar]
  47. Phull, N.; Singh, P. A Review on Security Issues in VANETs. In Proceedings of the 2019 6th International Conference on Computing for Sustainable Global Development (INDIACom), New Delhi, India, 13–15 March 2019; pp. 1084–1088. [Google Scholar]
  48. Gamal, M.; Nasr, A.; Nouh, S. VANET Security: Defense and Detection, A Review. J. Al-Azhar Univ. Eng. Sect. 2020, 15, 810–827. [Google Scholar] [CrossRef]
  49. Sonicwall. Cyber Threat Report—Cyber Threat Intelligence for Navigating the New Business Reality. Available online: https://www.sonicwall.com/medialibrary/en/white-paper/2021-cyber-threat-report.pdf (accessed on 21 September 2021).
  50. Symantec. ISTR-Internet Security Threat Report. 2019. Available online: https://docs.broadcom.com/doc/istr-24-2019-en (accessed on 21 September 2021).
  51. del Rey, A.M. Mathematical Modeling of the Propagation of Malware: A Review. Secur. Commun. Netw. 2015, 8, 2561–2579. [Google Scholar] [CrossRef]
  52. Lindsey, O. Emotet Now Hacks Nearby Wi-Fi Networks to Spread Like a Worm. 2020. Available online: https://threatpost.com/emotet-now-hacks-nearby-wi-fi-networks-to-spread-like-a-worm/152725/ (accessed on 30 August 2021).
  53. Atanassov, N.; Chowdhury, M.M. Mobile Device Threat: Malware. In Proceedings of the 2021 IEEE International Conference on Electro Information Technology (EIT), Mount Pleasant, MI, USA, 14–15 May 2021. [Google Scholar] [CrossRef]
  54. Hu, H.; Myers, S.; Colizza, V.; Vespignani, A. WiFi Epidemiology: Can Your Neighbors’ Router Make Yours Sick? arXiv 2007, arXiv:0706.3146. [Google Scholar]
  55. Fadel, M.A.; Hazem, M.H. VSpyware: Spyware in VANETs. In Proceedings of the IEEE Local Computer Network Conference, Denver, CO, USA, 10–14 October 2010. [Google Scholar] [CrossRef]
  56. Krieg, C.; Dabrowski, A.; Hobel, H.; Krombholz, K.; Weippl, E. Hardware Malware. Synth. Lect. Inf. Secur. Privacy Trust. 2013, 4, 1–115. [Google Scholar] [CrossRef]
  57. Boukerche, A.; Zhang, Q. Countermeasures against Worm Spreading. ACM Comput. Surv. 2019, 52, 1–25. [Google Scholar] [CrossRef]
  58. Liu, W.; Liu, C.; Yang, Z.; Liu, X.; Zhang, Y.; Wei, Z. Modeling the Propagation of Mobile Malware on Complex Networks. Commun. Nonlinear Sci. Numer. Simul. 2016, 37, 249–264. [Google Scholar] [CrossRef]
  59. del Rey, Á.M.; Sánchez, G.R. A CA Model for Mobile Malware Spreading Based on Bluetooth Connections. In Advances in Intelligent Systems and Computing; Springer International Publishing: Berlin/Heidelberg, Germany, 2014; pp. 619–629. [Google Scholar] [CrossRef]
  60. Hamdi, M.M.; Audah, L.; Rashid, S.A.; Mohammed, A.H.; Alani, S.; Mustafa, A.S. A Review of Applications, Characteristics and Challenges in Vehicular Ad Hoc Networks (VANETs). In Proceedings of the 2020 International Congress on Human-Computer Interaction, Optimization and Robotic Applications (HORA), Ankara, Turkey, 26–28 June 2020. [Google Scholar] [CrossRef]
  61. Martinez, F.J.; Toh, C.K.; Cano, J.C.; Calafate, C.T.; Manzoni, P. Emergency Services in Future Intelligent Transportation Systems Based on Vehicular Communication Networks. IEEE Intell. Transp. Syst. Mag. 2010, 2, 6–20. [Google Scholar] [CrossRef]
  62. Hoque, N.; Bhattacharyya, D.K.; Kalita, J.K. Botnet in DDoS Attacks: Trends and Challenges. IEEE Commun. Surv. Tutor. 2015, 17, 2242–2270. [Google Scholar] [CrossRef]
  63. Nekovee, M. Modeling the Spread of Worm Epidemics in Vehicular Ad Hoc Networks. In Proceedings of the 2006 IEEE 63rd Vehicular Technology Conference, Melbourne, Australia, 7–10 May 2006. [Google Scholar] [CrossRef]
  64. Wang, J.; Liu, Y.; Deng, K. Modelling and Simulating Worm Propagation in Static and Dynamic Traffic. IET Intell. Transp. Syst. 2014, 8, 155–163. [Google Scholar] [CrossRef]
  65. Treiber, M.; Hennecke, A.; Helbing, D. Congested Traffic States in Empirical Observations and Microscopic Simulations. Phys. Rev. E 2000, 62, 1805–1824. [Google Scholar] [CrossRef] [PubMed] [Green Version]
  66. Cheng, L.; Shakya, R. Worm Spreading and Patching in Inter-vehicle Communications. Int. J. Commun. Netw. Inf. Secur. 2010, 2, 50. [Google Scholar]
  67. Trullols-Cruces, O.; Fiore, M.; Barcelo-Ordinas, J.M. Worm Epidemics in Vehicular Networks. IEEE Trans. Mob. Comput. 2015, 14, 2173–2187. [Google Scholar] [CrossRef] [Green Version]
  68. Wei, L.; Qin, H.; Wang, Y.; Zhang, Z.; Yu, G. Virus-Traffic Coupled Dynamic Model for Virus Propagation in Vehicle-To-Vehicle Communication Networks. Veh. Commun. 2018, 14, 26–38. [Google Scholar] [CrossRef]
  69. Galluccio, L.; Morabito, G. Impact of Worm Propagation on Vehicular Sensor Networks Exploiting V2V Communications. In Proceedings of the 2019 International Conference on Wireless and Mobile Computing, Networking and Communications (WiMob), Barcelona, Spain, 21–23 October 2019. [Google Scholar] [CrossRef]
  70. Wang, Z.; Qian, H.Y.; Wang, J.Y.; Gao, S.; Xu, Y.G. Novel IOV Worm Model and Its Corresponding Hybrid Anti-Worm Strategy in Expressway Interchange Terminal. J. Cent. South Univ. 2013, 20, 1259–1268. [Google Scholar] [CrossRef]
  71. Guang, M.L.; Dan, S. Modeling the Propagation of Wireless Worms among Vehicles. Key Eng. Mater. 2011, 480–481, 833–840. [Google Scholar] [CrossRef]
  72. Liu, B.; Zhou, W.; Gao, L.; Zhou, H.; Luan, T.H.; Wen, S. Malware Propagations in Wireless Ad Hoc Networks. IEEE Trans. Dependable Secur. Comput. 2018, 15, 1016–1026. [Google Scholar] [CrossRef]
  73. Trullols-Cruces, O.; Fiore, M.; Barcelo-Ordinas, J.M. Understanding, Modeling and Taming Mobile Malware Epidemics in A Large-Scale Vehicular Network. In Proceedings of the 2013 IEEE 14th International Symposium on “A World of Wireless, Mobile and Multimedia Networks” (WoWMoM), Madrid, Spain, 4–7 June 2013. [Google Scholar] [CrossRef]
  74. Liu, B.; Zhou, W.; Gao, L.; Wen, S.; Luan, T.H. Mobility Increases the Risk of Malware Propagations in Wireless Networks. In Proceedings of the 2015 IEEE Trustcom/BigDataSE/ISPA, Helsinki, Finland, 20–22 August 2015. [Google Scholar] [CrossRef]
  75. Joe, M.M.; Ramakrishnan, B.; Bai, S.K.; Shaji, R.S. Modelling and Detection of Worm Propagation for Web Vehicular Ad Hoc Network (WVANET). Wirel. Pers. Commun. 2019, 109, 223–241. [Google Scholar] [CrossRef]
  76. Kermack, W.; Mckendrick, A. Contributions to the Mathematical Theory of Epidemics—I. Bull. Math. Biol. 1991, 53, 33–55. [Google Scholar] [CrossRef] [PubMed]
  77. Andrews, L.C. Special Functions of Mathematics for Engineers; Spie Press: Bellingham, WA, USA, 1998; Volume 49. [Google Scholar]
  78. Hoey, J.V. Using the. In Beginning x64 Assembly Programming—From Novice to AVX Professional; Apress: New York, NY, USA, 2019; pp. 377–382. [Google Scholar] [CrossRef]
  79. Oyama, Y. Investigation of the Diverse Sleep Behavior of Malware. J. Inf. Process. 2018, 26, 461–476. [Google Scholar] [CrossRef] [Green Version]
  80. Al-Sabaawi, A.; Al-Dulaimi, K.; Foo, E.; Alazab, M. Addressing Malware Attacks on Connected and Autonomous Vehicles: Recent Techniques and Challenges. In Malware Analysis Using Artificial Intelligence and Deep Learning; Springer International Publishing: Berlin/Heidelberg, Germany, 2020; pp. 97–119. [Google Scholar] [CrossRef]
  81. Kakarla, J.; Sathya, S.S. A Survey and Qualitative Analysis of Multi-channel Mac Protocols for VANET. Int. J. Comput. Appl. 2012, 38, 38–42. [Google Scholar] [CrossRef]
  82. Diekmann, O.; Heesterbeek, J.; Metz, J. On the Definition and the Computation of the Basic Reproduction Ratio R0 in Models for Infectious Diseases in Heterogeneous Populations. J. Math. Biol. 1990, 28, 365–382. [Google Scholar] [CrossRef] [PubMed] [Green Version]
  83. Jones, J.H. Notes on R0. Calif. Dep. Anthropol. Sci. 2007, 323, 1–19. [Google Scholar]
  84. Robinson, R.C. An Introduction to Dynamical Systems: Continuous and Discrete; American Mathematical Society: Providence, RI, USA, 2012; Volume 19. [Google Scholar]
  85. La Salle, J.P. The Stability of Dynamical Systems; Society for Industrial and Applied Mathematics: Philadelphia, PA, USA, 1976; Volume 25. [Google Scholar]
Figure 1. Vehicular ad-hoc network.
Electronics 10 02403 g001
Figure 2. SIR spreading model.
Electronics 10 02403 g002
Figure 3. Link models in VANET. (a) Geometric link model. (b) Shadow fading link model.
Electronics 10 02403 g003
Figure 4. SEIR-S malware spreading model.
Electronics 10 02403 g004
Figure 5. Fraction of vehicles in four states when R 0 < 1 .
Electronics 10 02403 g005
Figure 6. Fraction of vehicles in four states when R 0 > 1 .
Electronics 10 02403 g006
Figure 7. The dependence of R 0 on transition rate I-R.
Electronics 10 02403 g007
Figure 8. Malware spreading SEIR-S model simulation in NetLogo.
Electronics 10 02403 g008
Table 1. Notation.
Table 1. Notation.
NameUnitDescription
p link or p-Probability of link between two nodes
β th dBThreshold attenuation (receiver characteristics)
α -Path loss exponent
τ sThe average time lag between two vehicles
v a km/hThe average velocity of vehicles
L-Number of lanes
σ dBFading effects coefficient
erf-Error function
N or N ( t ) vehicleTotal number of vehicles in the network at time step t
S or S ( t ) vehicleNumber of susceptible vehicles at time step t
E or E ( t ) vehicleNumber of exposed vehicles at time step t
I or I ( t ) vehicleNumber of infectious vehicles at time step t
R or R ( t ) vehicleNumber of recovered vehicles at time step t
a-The rate determines the number of new vehicles joining the network
b-The transition rate from S state to E state of a vehicle
c-The transition rate from S state to I state of a vehicle
e-The transition rate from E state to I state of a vehicle
f-The transition rate from E state to R state of a vehicle
g-The transition rate from I state to R state of a vehicle
h-The transition rate from R state to S state of a vehicle
k-The rate that a vehicle is removed from the network but not due to the
impact of malware
P 0 -Malware-free equilibrium
P * -Endemic equilibrium
G -Next-generation matrix
R 0 -Basic reproduction number
Table 2. Parameters for the simulation.
ParameterCase 1: R 0 < 1 Case 2: R 0 > 1
β th (dB)4040
α 22
τ (s)55
v a (km/h)3030
L22
σ (dB)22
N ( 0 ) (vehicle)10001000
E ( 0 ) (vehicle)11
I ( 0 ) (vehicle)11
R ( 0 ) (vehicle)00
a 0.0003 0.0003
b 0.46 0.46
c 0.37 0.37
e 0.422 0.422
f 0.03 0.03
g 0.126 0.045
h 0.076 0.076
k 0.00263 0.00263
Publisher’s Note: MDPI stays neutral with regard to jurisdictional claims in published maps and institutional affiliations.

