1. Introduction
The agricultural sector is vital in our society for various reasons. It is a great source of employment, with 26.26% of the world population working in this sector [
1]. In countries like India, the population employed in the agricultural sector may reach 43.21% [
2], and for countries like Somalia and Burundi, the employment in agriculture surpasses 80% of the population [
1]. It is then a great source of revenue for countries with the highest employment rates in this sector. Furthermore, the importance of producing food for its local consumption has been in the spotlight during the COVID-19 pandemic, where the uncertainty regarding transport and the closure of the airspace led to a fear of shortage of food and other first need products. Moreover, the produce not used for consumption in the country can be utilized as a resource for foreign exchange, leading to more revenue gains for the country.
The need of optimizing the production of produce, the usage of resources such as water and energy, and the time of the farmers resulted in the introduction of technology in the fields. The first technologies employed in agriculture included pipe systems for irrigation and motored vehicles to perform difficult tasks. Then, the automation in irrigation was introduced. This allowed setting start and finish times to activate and deactivate the irrigation system. Nowadays, the performance of automation and monitoring tasks using technology is common in many fields. The introduction of advanced technologies in agriculture led to the creation of the term precision agriculture. Sensors, actuators, and nodes are deployed in the field to capture information, execute commands, and store, analyze, and transmit the gathered information to local or remote databases [
3]. The most commonly monitored parameters can be classified into water, soil, and weather factors. Regarding water, the most monitored parameters are water quality, water tank levels, water flow, water temperature, and water salinity [
4]. Soil moisture, soil pH, soil temperature, and soil nutrients are the most monitored soil parameters. Air temperature and humidity, rain, or wind, are often considered when monitoring the weather. Finally, the crops can also be monitored by measuring aspects such as leaf wetness or plant height. Most smart irrigation systems use a combination of some of the aforementioned parameters that are analyzed using algorithms to determine the optimal irrigation in a field. Currently, professional systems employ expensive sensors to monitor these parameters. However, recent papers explore the use of low-cost sensors and nodes [
5].
The use of low-cost nodes and sensors has been very popular in recent research as it allows for the creation of affordable irrigation systems that can be deployed in developing countries. Arduino Uno, Arduino Mega, Node MCU, WEMOS Mini D1, Raspberry Pi 2 Model B, and Raspberry Pi 3 Model B+ are the most utilized nodes for IoT irrigation systems [
3]. Low-cost actuators are also utilized to open and close water valves or to activate coolers, fans, heaters artificial lights, and buzzers. The gathered data are often forwarded to a cloud platform that allows for the creation of graphs and statistics that help farmers keep track of the evolution of their fields. One of the most utilized cloud platforms in IoT is ThingSpeak [
6]. However, the use of databases like MySQL [
7] as a storage system is also very widespread.
There are different types of irrigation whose usage depends on the type of crop, the content and characteristics of the soil, and the topography of the land. Therefore, irrigation techniques such as drip irrigation, sprinkler irrigation, flood irrigation, and subsurface irrigation can be found in the fields. Among the recent papers on IoT irrigation systems, the majority utilizes motor pumps, sprinklers, valves, or drip irrigation [
3]. However, the use of IoT for flooding irrigation has not been widely investigated. In this paper, we present an IoT flood irrigation control system based on WiFi that monitors the presence of water in the water canals and allows the farmer to control the water gates from a remote location. An Android application that gives the farmer access to the logs and the irrigation controls is also presented.
The rest of this paper is structured as follows. The materials and methods, jointly with the analytical study used to evaluate path loss of the signal and the theoretical coverage area of our system, are presented in
Section 2.
Section 3 depicts the experimental results of our system.
Section 3 presents some related works and discusses their differences with our proposal. Finally, the conclusions and future work are presented in
Section 4.
2. Materials and Methods
This section presents the proposal description, the system design and implementation, and the cloud service deployment.
2.1. Proposal Description
This subsection presents a brief description of the system requirements as well as the overall description of our system.
2.1.1. System Requirements
The proposed system tries to solve a problem that is very present in classical agriculture: the control of irrigation by flooding. Therefore, the objective of this system is to provide a remote-control method to make the work easier for farmers. The system must have the following features:
It should allow detection of when the water has reached the end of the ditch without having to physically be at the end of the ditch to observe the control point.
The system must be able to uniquely identify each ditch.
Considering the possibility that farmers of an area tend to group together in irrigation communities and on many occasions share the irrigation channels, it is necessary to collect information about the irrigation shift as well as determine whether the gate of the main channel is open or not.
Complementing the previous point, an application similar to a shared calendar would be required. In it, the members of the irrigation community could request/plan their irrigation.
An alert system and simple management application that allows the farmer to know when to close the gates of the secondary channels to stop irrigation.
Finally, a graphical interface as simple as possible is required since we must consider that the application will be used by the end-users without specialized technical knowledge.
There is no one-size-fits-all solution to meet the defined requirements. However, the final solution must be simple and inexpensive since in this way, we will be able to reach more users.
2.1.2. Overall Description
The complete system is made up of a deployment of wireless nodes with sensors in charge of monitoring different parameters in the field. Concretely, the system is composed of a Raspberry Pi3B+ [
8] that acts as a gateway and uses Raspbian as the operating system (O.S.). The sensor nodes were developed using Wemos D1 Mini modules [
9] whose firmware is based on the basic firmware provided by Arduino. However, it was customized to enable only those elements that we only really needed. These wireless nodes were connected to a gateway based on WiFi technology. Both sensor nodes and the gateway require a protocol to exchange the collected information. In this case, we used the version of Firmata protocol published on 23 July 2021. This gateway is in charge of creating the local network that will allow farmers to visualize the events detected by the sensors and the end of each stream. To do that, the farmers use a smart phone that runs Android 9.0 Pie as an O.S.
The system can be used in two different ways: (1) we can consider it as a fixed system installed in the field that must be powered by batteries and solar panels to keep it running; and (2) we can consider this system as a complementary equipment or tool that the farmer would use during irrigation tasks (as a hoe is used to make a hole). After finishing the irrigation, the farmer would remove the equipment and store it for the next irrigation. There are crops such as citrus that do not require more than 2–3 irrigations per year (depending on the area), so there is no sense in maintaining the system in the field. Although other crops such as vegetables, which will require irrigations with a frequency of 2–3 times a month. The use of the system we investigated is the one described in the second approach.
Many papers have discussed the use of the available wireless technologies for precision agriculture systems [
10,
11,
12] and provide the advantages and disadvantages of each solution. However, the requirements of each IoT system for precision agriculture need to be analyzed to select the most suitable technology. Considering the requirements of the system presented in this paper and the ways the system can be utilized, the selected wireless technology was WiFi.
Table 1 presents the characteristics of popular technologies for precision agriculture. Considering the required coverage range of the system and the monitored scenario, BLE (Bluetooth low energy) and LoRa were not suitable protocols. One of the key aspects in selecting WiFi is the high availability of WiFi devices both for low-cost nodes and devices such as smartphones, tablets, and computers that the user can use to visualize the data. It is important to consider that the user is a person without technical knowledge and using their own smartphone to access the data through the local network makes the system more accessible. Furthermore, the use of WiFi in IoT systems for agriculture is very popular, as shown in [
3]. Furthermore, [
10] states that ZigBee nodes are required to be deployed with an available line of sight, which can be difficult for crops due to the height of the plant and the foliage. Nonetheless, the use of WiFi has its limitations due to the higher energy consumption. This problem can be addressed using techniques to reduce the energy consumption such as data-driven techniques, or by utilizing energy-harvesting systems. Using the presented system in the first approach, the WiFi radio only needs to be active when the user is irrigating the fields, whereas for the second approach, the battery of the nodes would not be depleted before the user finishes the irrigation process. Therefore, the energy consumption of using WiFi for this system is not a problem. Finally, utilizing WiFi provides the system with scalability, allowing the introduction of more sensors, particularly IP cameras that need higher data rates to transmit the data.
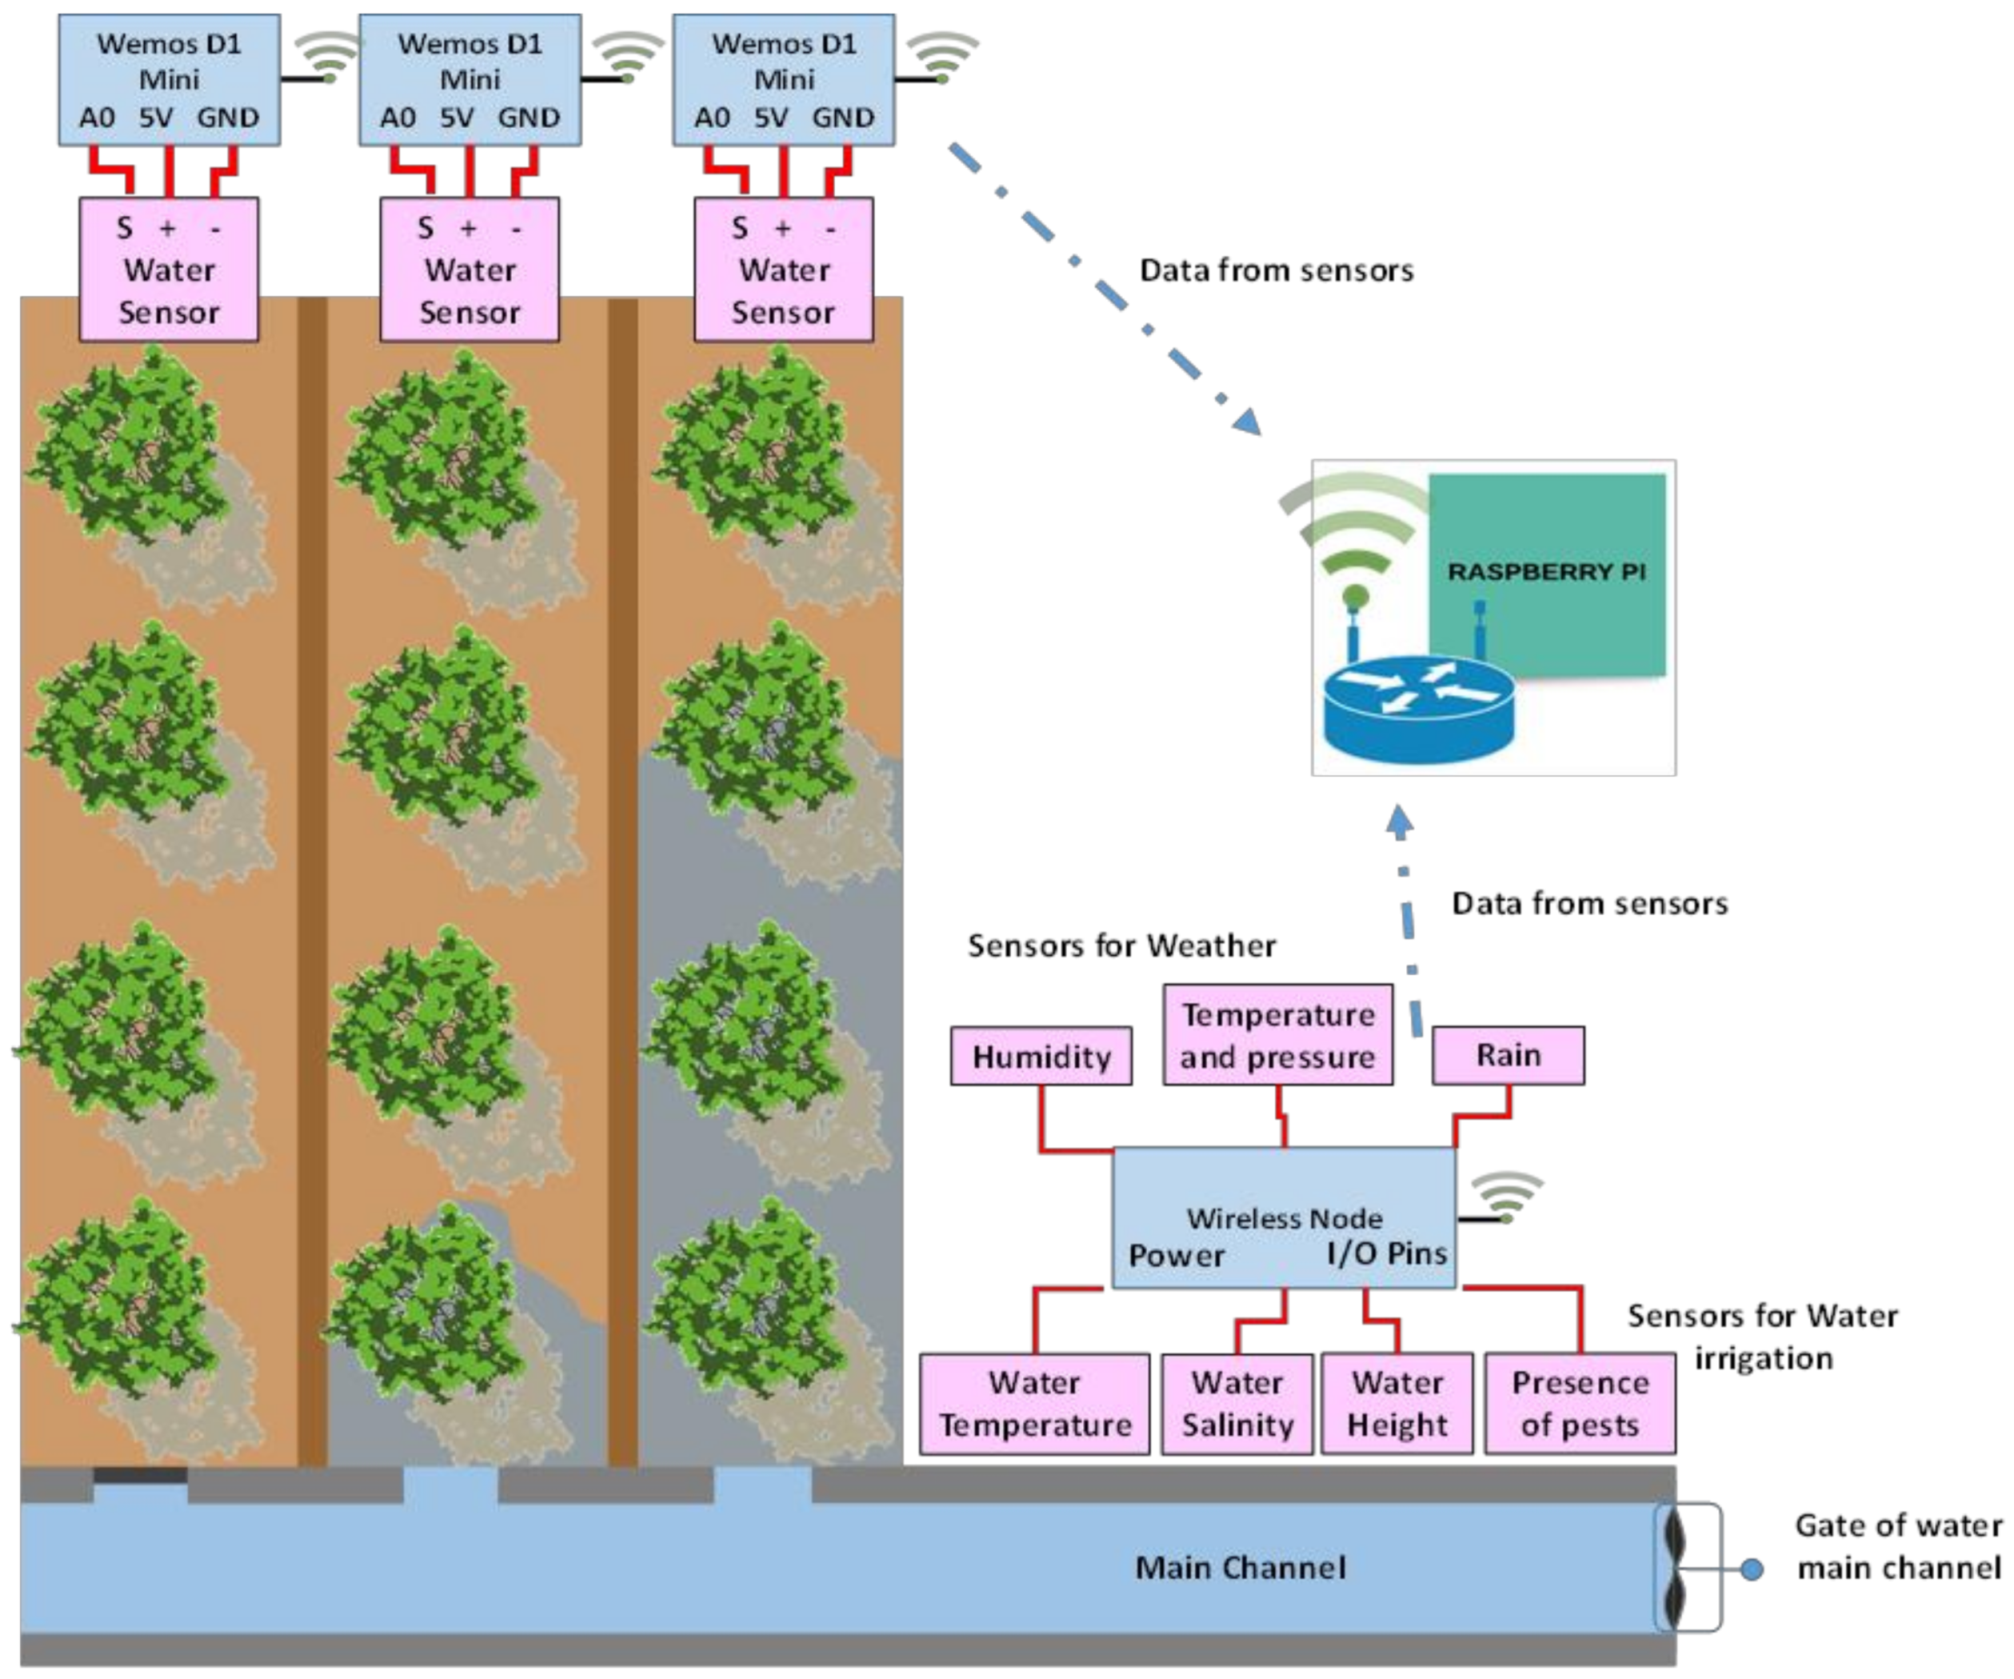
Figure 1 shows the deployment diagram of the proposal, where water detection sensors are located at the end of the different streams. There were also a series of sensors (temperature, humidity, height of the canal water and presence of pesticides) in the main canal to determine the quality of the irrigation water.
Although it is possible to add several sensors to our system, to perform our tests, we used a water sensor for soil for measuring the presence of water, a DHT11 to measure temperature and relative humidity, a distance sensor, and a light-dependent resistor (LDR).
Figure 2 includes the electronic schematic of the sensors used to carry out our tests.
Figure 2a shows that the moisture soil sensor presents two probes, although it is possible to have models with multiple stripes, which are places in contact to the soil or water. Each probe or strip is plated with a conducting material, often copper, and both probes act as a variable resistor. While one probe supplies positive voltage, the other is connected to ground. When both probes are dipped in water, an electric path is created between the two probes and the sensor starts the conducting current. The value of conductance and current depends on the level of water.
Figure 2b shows the diagram for the relative air humidity and temperature sensor (DHT11 sensor). As can be seen, it provides a digital output that requires some discrete components to filter the signal.
Figure 2c presents light sensor. It is the electric circuit that uses a resistor variable with the light. It works as a normal resistor and for this reason, a voltage divisor is required.
Finally,
Figure 2d shows the operation diagram for the distance sensor. As we can see the sensor transmits a sound wave as a pulse in its surroundings. This pulse collides with some objects, and the object reflects the pulse back to the ultrasonic sensor. Finally, the sensor can measure the distance as a value proportional to the total time elapsed during the transmission and receiving the reflected wave (i.e., the round trip time (RTT)).
In addition to the sensors, the system should also include microprocessor devices in charge of collecting and processing the collected data. The system is designed for obtaining a cheap solution that any farmer can buy. This is achieved by using cheap but reliable hardware and developing the wireless network with an extremely cheap technology that does not depend on any type of license [
13].
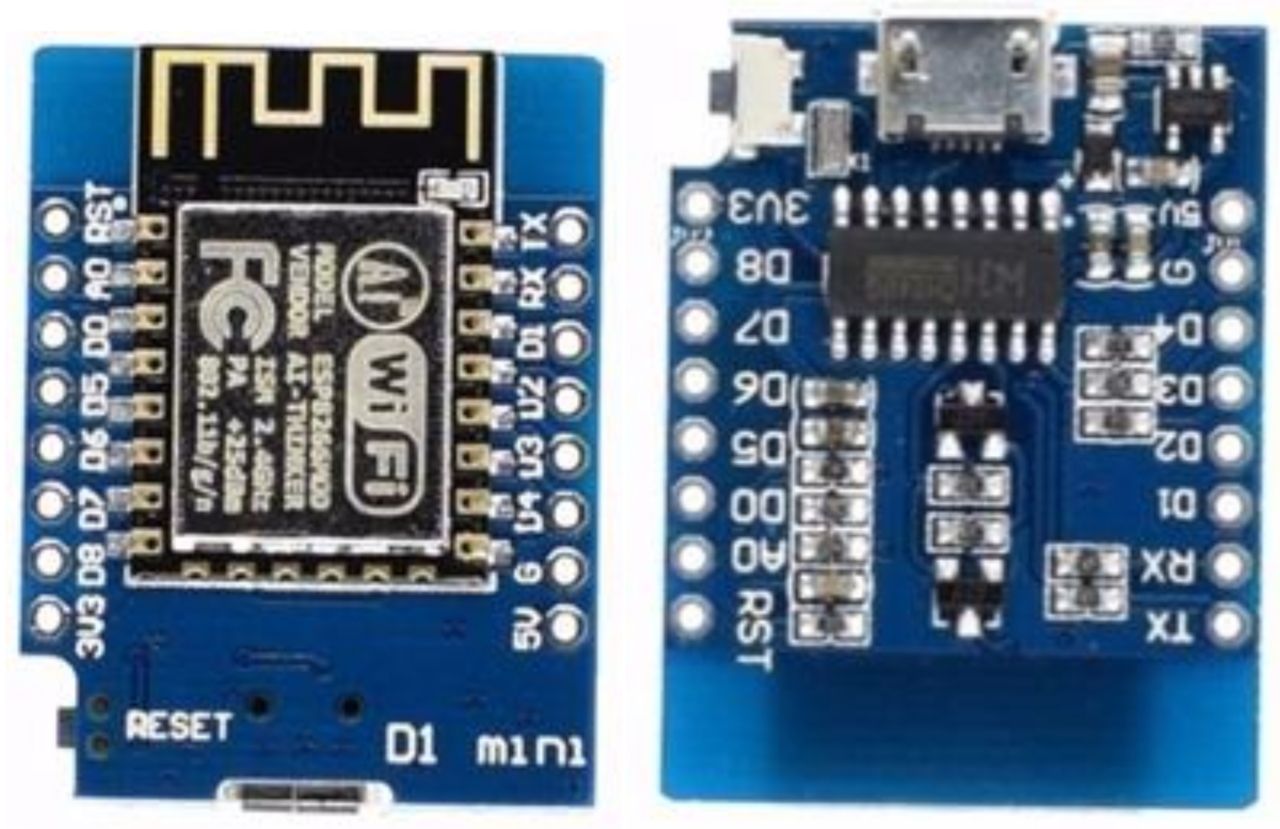
For this reason, we proposed the use of Wemos D1 mini modules. These are shown in
Figure 3.
These nodes are cheap and very small. WemosD1 mini allows connecting various digital sensors and one analog sensor. Nodes are implemented using ESP8266-based hardware. Specifically, Wemos D1 mini boards are used to collect the data from sensors. As a summary, the main features of this module are:
CPU Speed: 80 MHz
FlashMemory: 4 M bytes
Supply Voltage: 3.3 V
Digital I/O pins: 11, all of them are able to be configured as PWM, interruptions, and I2C
Analog Input: 1 (Max. 3.2 V)
Connector Micro-USB
Wireless connectivity: IEEE 802.11 b/g/n
To implement the necessary AP in the field, a Raspberry Pi with connection to the 3G/4G network can be used (which would imply the contracting of an additional fee with a mobile operator) to send the data to the cloud or by using of a smartphone (taking advantage of the mobile device connectivity).
Likewise, atmospheric parameters (such as temperature, humidity, rain, etc.) that allow us to implement intelligent irrigation systems in future applications will be used. All wireless nodes are connected to a Raspberry Pi configured as a local access point (AP). This AP will enable farmers to connect their tablet or smartphone to control the irrigation process. The values managed in this system are not particularly sensitive, so the system does not present very high requirements in terms of quality of service or % of lost packets (i.e., the loss of a packet would not suppose an extremely serious problem since notifications of the presence of water are sent every 30 s).
In order to control the presence of water in each ditch, a node is placed at the end of each one. It is preferable to have one device per ditch, since the separation per channel is sometimes more than 1 m for vegetables and more than 3–5 m for citrus and trees. The water sensors have a resistive behavior, so an excess of electrical wiring can damage the received signal. For this reason, it is preferable to use one node per ditch.
2.1.3. Analysis of Power Consumption
The energy consumption of the system is presented in this subsection. It can be considered that the nodes go through three stages:
Stage 1. The microcontroller, the communication peripherals, and the sensors are active. In this stage, the microcontroller gathers the data from the sensors.
Stage 2. WiFi transmission: The node transmits the data using WiFi wireless communication.
Stage 3. Sleep mode: In this stage, all the modules stay inactive until the timer is reached.
The power state of the modules in each stage is presented in
Table 2:
The estimate of the power consumption of each module provided in the specifications is presented in
Table 3.
Table 4 presents the added power consumption at each stage utilizing the previous values.
As it can be seen, the transmission stage is the stage that consumes the most power. In order to determine the power consumption of one year, the time the node spends in each stage is needed. As can be seen in
Table 4, the time in stage 3 is considerably larger than that of stages 1 and 2. We considered that the duration of stage 1 is 1 s. The data are gathered and transmitted each 30 s. The payload of the WiFi packet is 27 bits, which corresponds to 8 bits for humidity, 10 bits for temperature, 8 bits for light, and 1 bit for the water presence parameter. Considering the 32 byte header size and a bit rate of 54 Mbps, the transmission time of the WiFi packet and, therefore, the duration of stage 2 was approximately 6 μs. Finally, the duration of stage 3 was 28,994 ms. The mAh per cycle is calculated in Equations (1)–(3):
Therefore, the total energy consumption per cycle is 0.11274 mAh. For a battery with a capacity of 14,000 mAh, a total of 124,179 transmissions can be performed. Considering 2880 transmissions for each day, the node can be active for 43 days. The Raspberry Pi 3 B+ is constantly active and consumes 400 mA per minute with onboard WiFi.
To estimate the cost of deployment, we can consider a rectangular field 40 m long × 30 m wide and 10 ditches. In this sense, we would need a single gateway device and 10 nodes to detect the arrival of water. It is considered one node located on the main channel that will contain a proximity sensor (to detect if it contains water) and a DHT-11 sensor (just to register the ambient parameters). The deployment estimation cost for this system are shown in see
Table 5.
2.2. Analytical Study
This section presents the analytical study performed to analyze path losses due to rain and reflection on water and estimate signal levels under these conditions. Therefore, this section can be divided into three different subsections.
2.2.1. Signal Levels under Rainfall Conditions
Following the recommendations given by the International Telecommunication Union (ITU), the specific attenuation, γR in dB/km, can be obtained from Equation (4) [
14].
where the coefficient values of k and α are given as functions of frequency in GHz, and R is the rainfall rate in mm/h, which can be obtained using maps of meteorological parameters available in [
15]. However, for the sake of this study, the value of the specific attenuation was extracted from [
16] and has a value of 0.03 dB/km.
The signal levels under rainfall conditions can be obtained using Equation (5):
where
is the received signal strength at 1 m;
d is the distance in meters for air medium (
n = 2); and Lrain are the losses due to rain in dB.
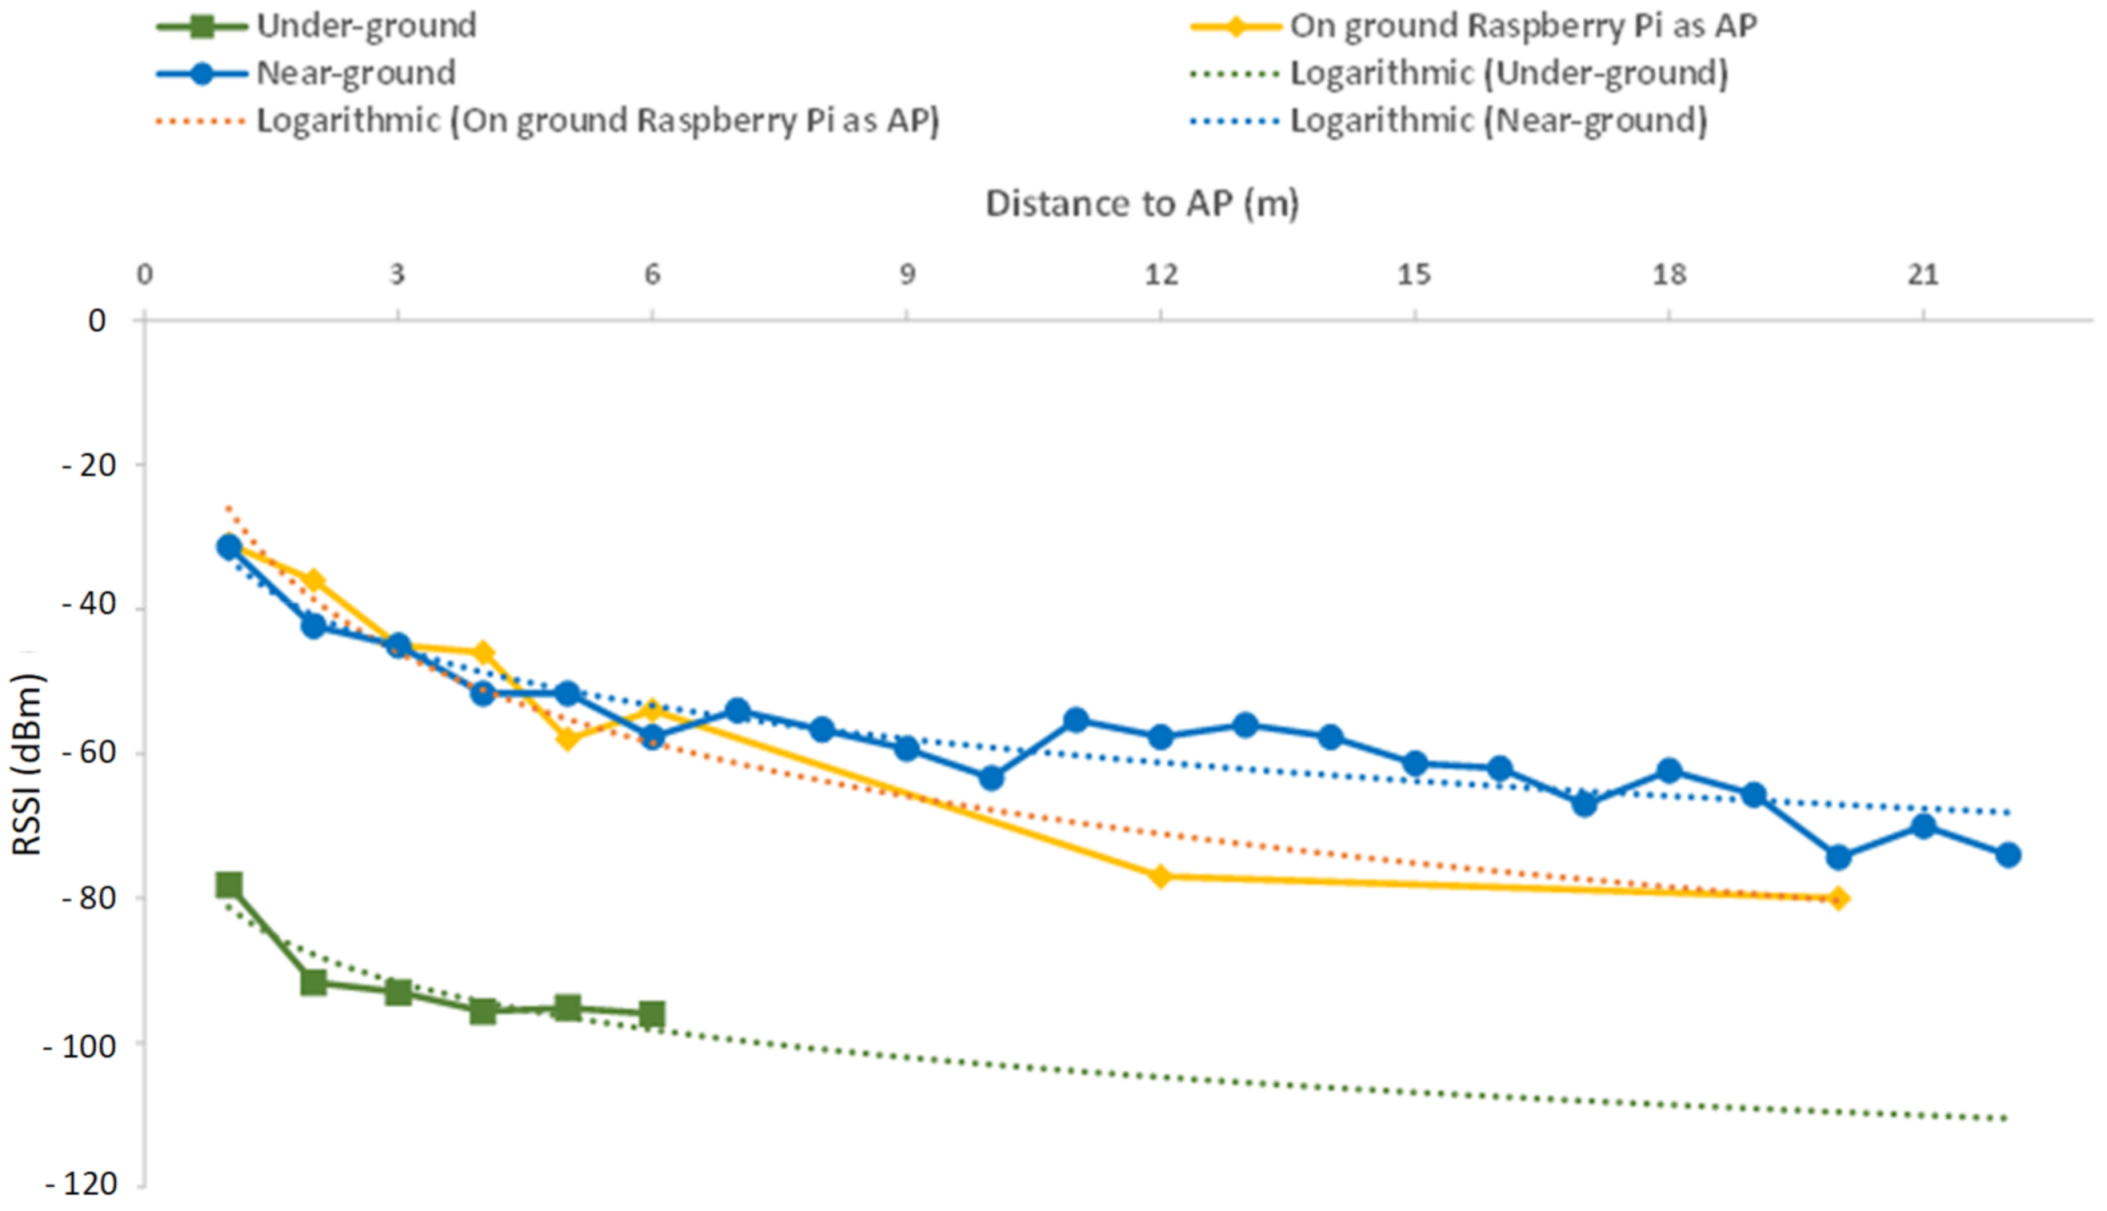
Figure 4 shows the obtained signal levels under rainfall conditions as a function of distance. In this case, it was decided to display the signal levels of a Raspberry Pi and a mobile phone placed on ground as well as the signal levels of a transmitter placed 30 cm above ground (near-ground scenario) and 1 m above ground (above ground scenario).
When a flood irrigation is performed, there is a substantial amount of water over the soil. Therefore, in our final deployment, we will place the devices 30 cm from the ground. If we place the nodes (even in a protective case) directly over the soil, it is possible to damage it (due to the water or a person walking, etc.). Additionally, the wires that connect the sensors and the nodes can also be damaged. Therefore, the main objective of this comparison was to observe the differences, when we have an emitter close to the ground (which can imply problems of interferences and signal reflections) and the effect of having the ground at 1 m, which, theoretically, is the point where the maximum power is registered.
As the figure shows, the performance of the Raspberry Pi and the near-ground and above ground transmitters was almost the same, and signal levels barely surpassed −71 dBm. However, in the case of the mobile phone, signal levels reached −80 dBm after 32 m.
2.2.2. Signal Levels under Air–Water Interface Conditions
The attenuation introduced by reflections on water surfaces depends on the reflection coefficient of air–water interfaces and can be calculated using Equation (6) [
17].
where the factor V is given by Equation (7).
where
is the amplitude of the reflection coefficient; r is the path length; α is the attenuation constant; Δ(r) is the difference between r and d; and ϕ is the phase of the reflection coefficient.
The reflection coefficient can be expressed by Equation (8) [
18].
where
and
are the intrinsic impedance of air and water mediums, respectively.
The attenuation constant is described by Equation (9) [
19].
where
is the frequency;
and
are the permeability and the permittivity of vacuum, respectively, and
and
are the real and imaginary parts of the dielectric constant of water.
The path length can be calculated using Equation (10).
where h is the distance between the sensor and the surface of water in meters, and d is the distance between sensors in meters.
Signal levels under air–water interface conditions can be calculated using Equation (5) and replacing
Lrain by
Lreflection.
Figure 5 displays the signal levels as a function of distance, with nodes placed 1 m apart. As it shows, the attenuation due to reflection on water surfaces does not have a great effect on signal levels. When placing the nodes 2 m apart, the attenuation due to reflection on water at the level of 85 pdB, and 0 dB when placing the nodes 3 m apart or more.
2.3. Analytical Network Design
In order to efficiently design the WSN and distribute the wireless nodes, it is important to consider the different signal loss during its path in a rural environment. To carry out the correct calculations, we need to know the power transmission of AP and the antenna gain of both the AP and the nodes. Additionally, losses due to objects such as trees or humidity should also be considered [
20]. Therefore, taking into account these values, we can formulate the power balance formula (given by Equation (11)) [
14]:
where d is the distance between the transmitter and the receiver and n is the attenuation variation index. In our case, n = 2 for the air medium [
17]. Since our system is developed to be used in a crop of vegetables and greens, we will only consider the losses due to rain. Therefore, the coverage distance equation will be (see Equation (12)):
The tests were carried out in the east of Spain. Spain has two main hydrometric areas: the H area and the K area [
15]. In the worst case, losses due to rain were 0.03 dB per kilometer. For the rest of the parameters, the theoretical transmitted power for an IEEE 802.11 g WLAN device at 1 m (P
tx) was −40.2 dBm. The threshold power, in order to have enough quality of signal (P
rx), was fixed at −78 dBm (i.e., the received power must be equal of greater than this value to be sure to transmit/receive data). Finally, we will use omnidirectional antennas for both the transmitter and the receiver device. Therefore, considering all these values, the formula needed to design the radio coverage of each wireless sensor is shown by Equation (13).
Considering a typical antenna’s gain of 3 dBi for a small sensor node (WEMOS D1 Mini), we could ideally calculate the maximum network coverage as a function of the antenna’s gain of AP (see
Figure 6).
The previous figure shows the maximum coverage for our network using an AP with different gains and a node of small dimensions and low gain. However, these results are obtained by taking into account an ideal situation where there are no obstacles between the transmitter and receiver and there are no losses due to the multipath effect. The multipath effect can lead to losses up to 20 dB. Therefore, if we consider the worst case, with losses due to the multipath effect, the maximum coverage of our system as a function of the gain of AP would be shown in
Figure 7.
As we can see, the maximum coverage for our network, where a Raspberry Pi 3B+ was used as the AP and a WEMOS D1 Mini was used as the wireless node, would be around 24 m.
2.4. System Design and Implementation
In order to implement our solution, we propose the use of a microservice for sensors connected to the mobile network for Internet access and web service in the cloud. It is a solution that allows the system to be fully accessible through the Internet.
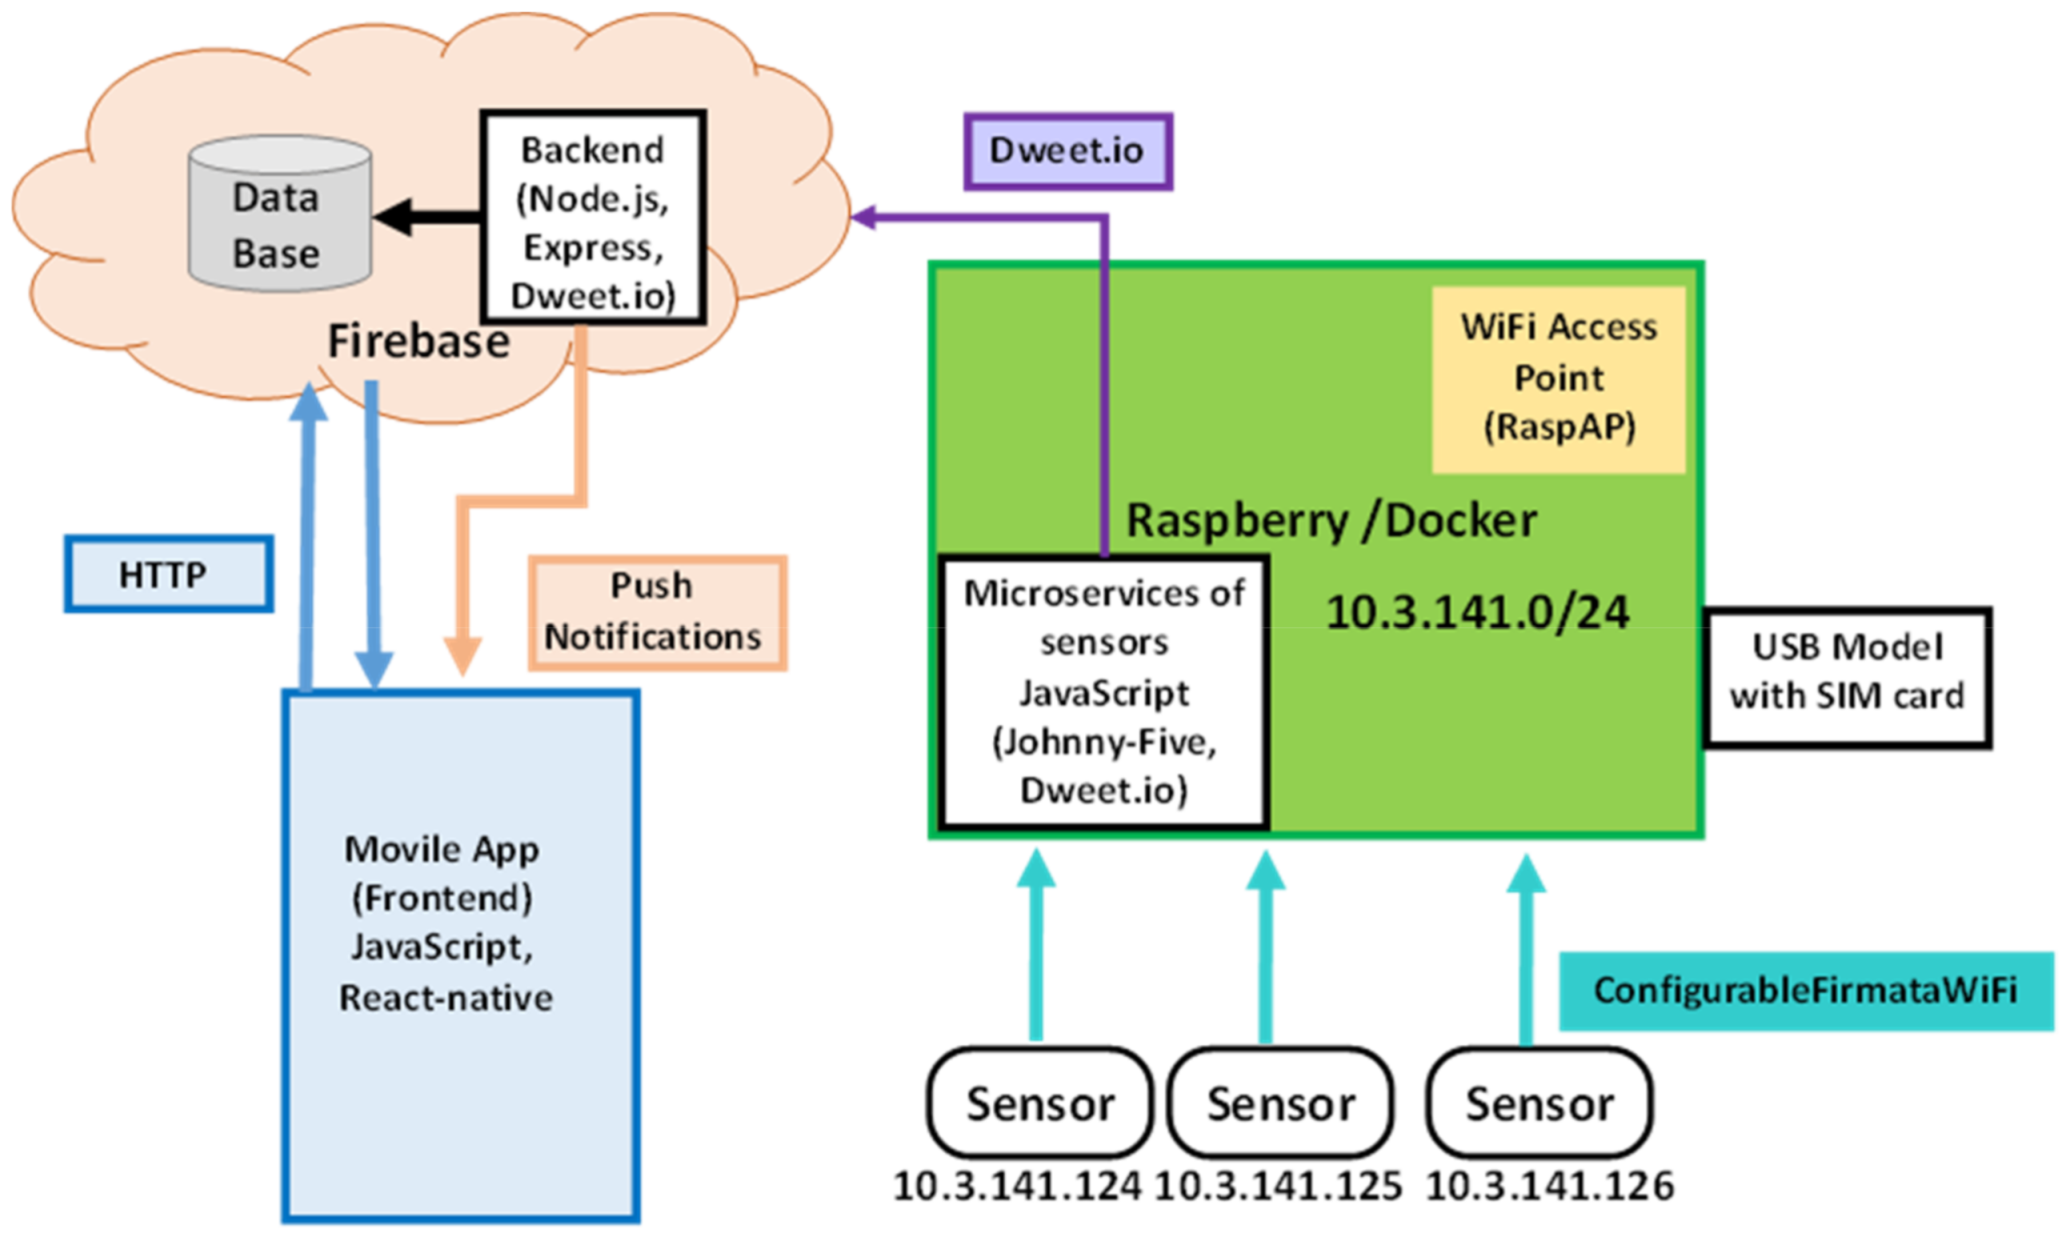
Figure 8 shows the network architecture of our system. As it shows, the information collected by the microservices of sensors, which are running on a server (built on a Raspberry Pi) located on the plot, are sent by using a WiFi connection. The information from sensors is sent to the cloud server where they will be stored in a database.
The Raspberry Pi contains the microservice, which is responsible for managing the sensors’ operation. This microservice is continuously running due to Docker technology, whose service facilitates the creation, deployment, and execution of applications using containers. In addition, this server will act as an AP. It will be in charge of providing the IP for sensors, so sensors will be uniquely identified in the local network. This server does not have any permanent storage; data from sensors are sent in real time to the cloud over the Internet using Dweet.io. Finally, the data are assigned to a user and stored in the available database managed by the API hosted in the cloud. If it is not possible to access the Internet through an Ethernet connection, the system will include a USB dongle with a SIM card that provides 3G/4G/5G connectivity.
The mobile application allows users to receive alerts generated when the water in a ditch has reach the sensor. The application allows the use of a shared calendar between an irrigation community for planning the irrigation of plots.
More and more IoT projects are linked to the concept of cloud computing. Cloud computing offers a suite of services ranging from storage for application to processing capacity, renting generally over the Internet and based on a pay-as-you-go model. The API (which is the native mobile application) in the cloud will work as a REST server for the client. The data stored in the database will be requested by the user through an HTTP request and returned by the server in a HTTP response (i.e., using a PULL communication method).
2.4.1. Software Design and Implementation
In this subsection, the workflow of the mobile application is presented and explained.
Figure 8 summarizes the system’s block diagram and the possible interactions of this application. This design is equivalent to the network architecture presented in
Figure 7, where the technologies used to establish wireless connections and implement the different subsystems are exposed. This flow diagram is composed of the sensors’ microservice, the server (backend), and the mobile application (frontend).
The sensors’ microservice running on the Raspberry Pi board corresponds to the green section of
Figure 8. Once the board and the sensors’ microservice are turned on, the system checks whether there are any sensors available to add them to the local area network (LAN) and assign them an IP address. If no sensor is available, the system will display an error and restart the service until it finds a sensor available. Once added to the network, the system will verify whether the connection was successful in order to proceed. If the connection is successful, the system will move on and verify whether there is water on the irrigation channel or any of the floodgates have been opened. At this point, if none of the previously mentioned cases occur, the sensors’ microservice will continue to be executed and the system will restart the process. In contrast, if the system detects the opening of a floodgate or water in the irrigation channel, the detected signal will be sent to the cloud service and registered into the database.
The flow diagram of the cloud service is presented in the pink section in
Figure 9. Although the server is continuously running, Firebase will be in charge of restarting the service in the case of errors or server downfalls. Moreover, the service information is continuously being printed into the Firebase’s console, where the information is shown by means of graphs to allow further analysis. As the
Figure 8 shows, the server itself does not need a mobile application to perform its tasks and will only send notification to the client when detected.
Finally, the block diagram of the mobile application and the interactions a user can perform are presented in blue in
Figure 9. In this case, once the application is executed, the user will be required to either login or fill the registration form. If the user manages to successfully log in or enroll, the main activity will be shown, and the server will send a notification message. In order to show the notification alert, the system will check whether the mobile application is currently visible and show either a popup window or a message in the status bar.
2.4.2. Design and Development of the Mobile Application
According to the calculations carried out by Statista, worldwide smartphone users in 2020 is estimated to be up to 3.5 billion [
21], which means that every third person we meet owns a smartphone. Therefore, it can be inferred that most farmers have a mobile phone and are likely to use it when working at farmlands.
Although Android is currently the most popular smartphone operating system, it is important to remember that other operating systems have their share in other areas, in terms of computing devices [
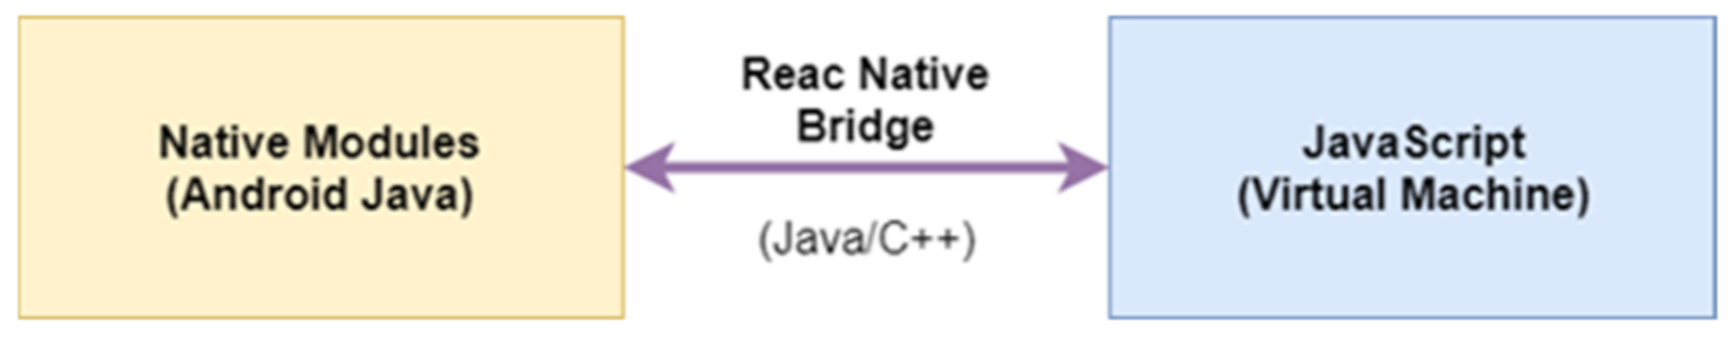
22]. In order to ease the application compatibility, it was decided to develop this mobile app within the React Native framework. This open-source mobile application framework runs on React, a popular open source library to build user interfaces with JavaScript (see
Figure 10).
Additionally, React Native uses other libraries to implement application functionalities such as login access via token. The needed token will be saved in the internal storage of the mobile phone to grant access to the mobile application and verify whether the token is valid or has expired. To ensure privacy, all cloud services are protected by the validation of this token. Moreover, push notifications were implemented using Firebase library on the client side. This library creates its own token, which is refreshed periodically.
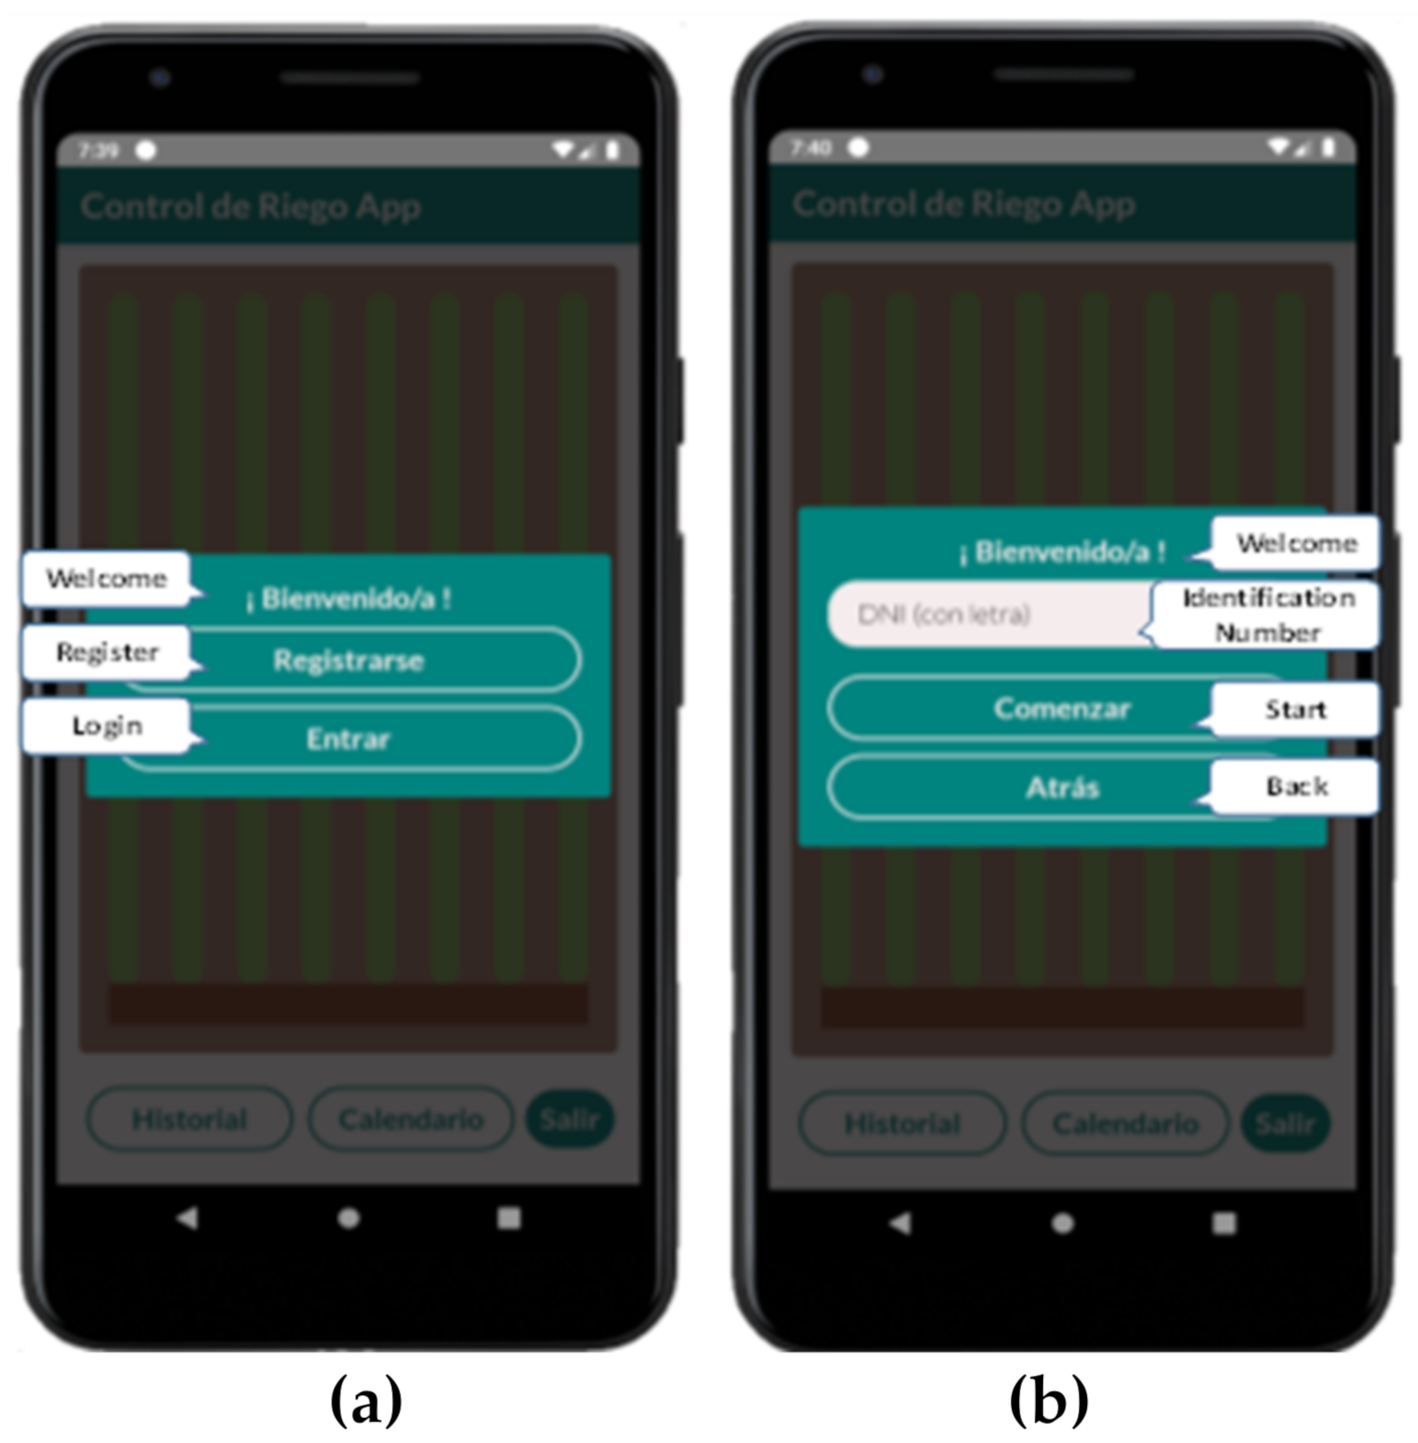
The application has been designed with a very simple appearance and is also intended to be basic in terms of operation. The application start screen (see
Figure 11a) allows access to a user session or the registration of a new client. As already mentioned, the access to the application is conducted through the user’s national identification number (see
Figure 11b). It is a unique identification number for each person that people often remember.
The identification number will also be used to create new accounts (see
Figure 12a).
Figure 12b shows a simplified map of the irrigation plot. The crops are represented by the green lines and the ditches are shown as brown spaces between them. In addition, the horizontal bar of darker brown represents the main channel. The main channel is the mainstream from where the ditches are fed by water. Maps can be customizable depending on the characteristics of each plot in a simplified form to facilitate the use for farmers.
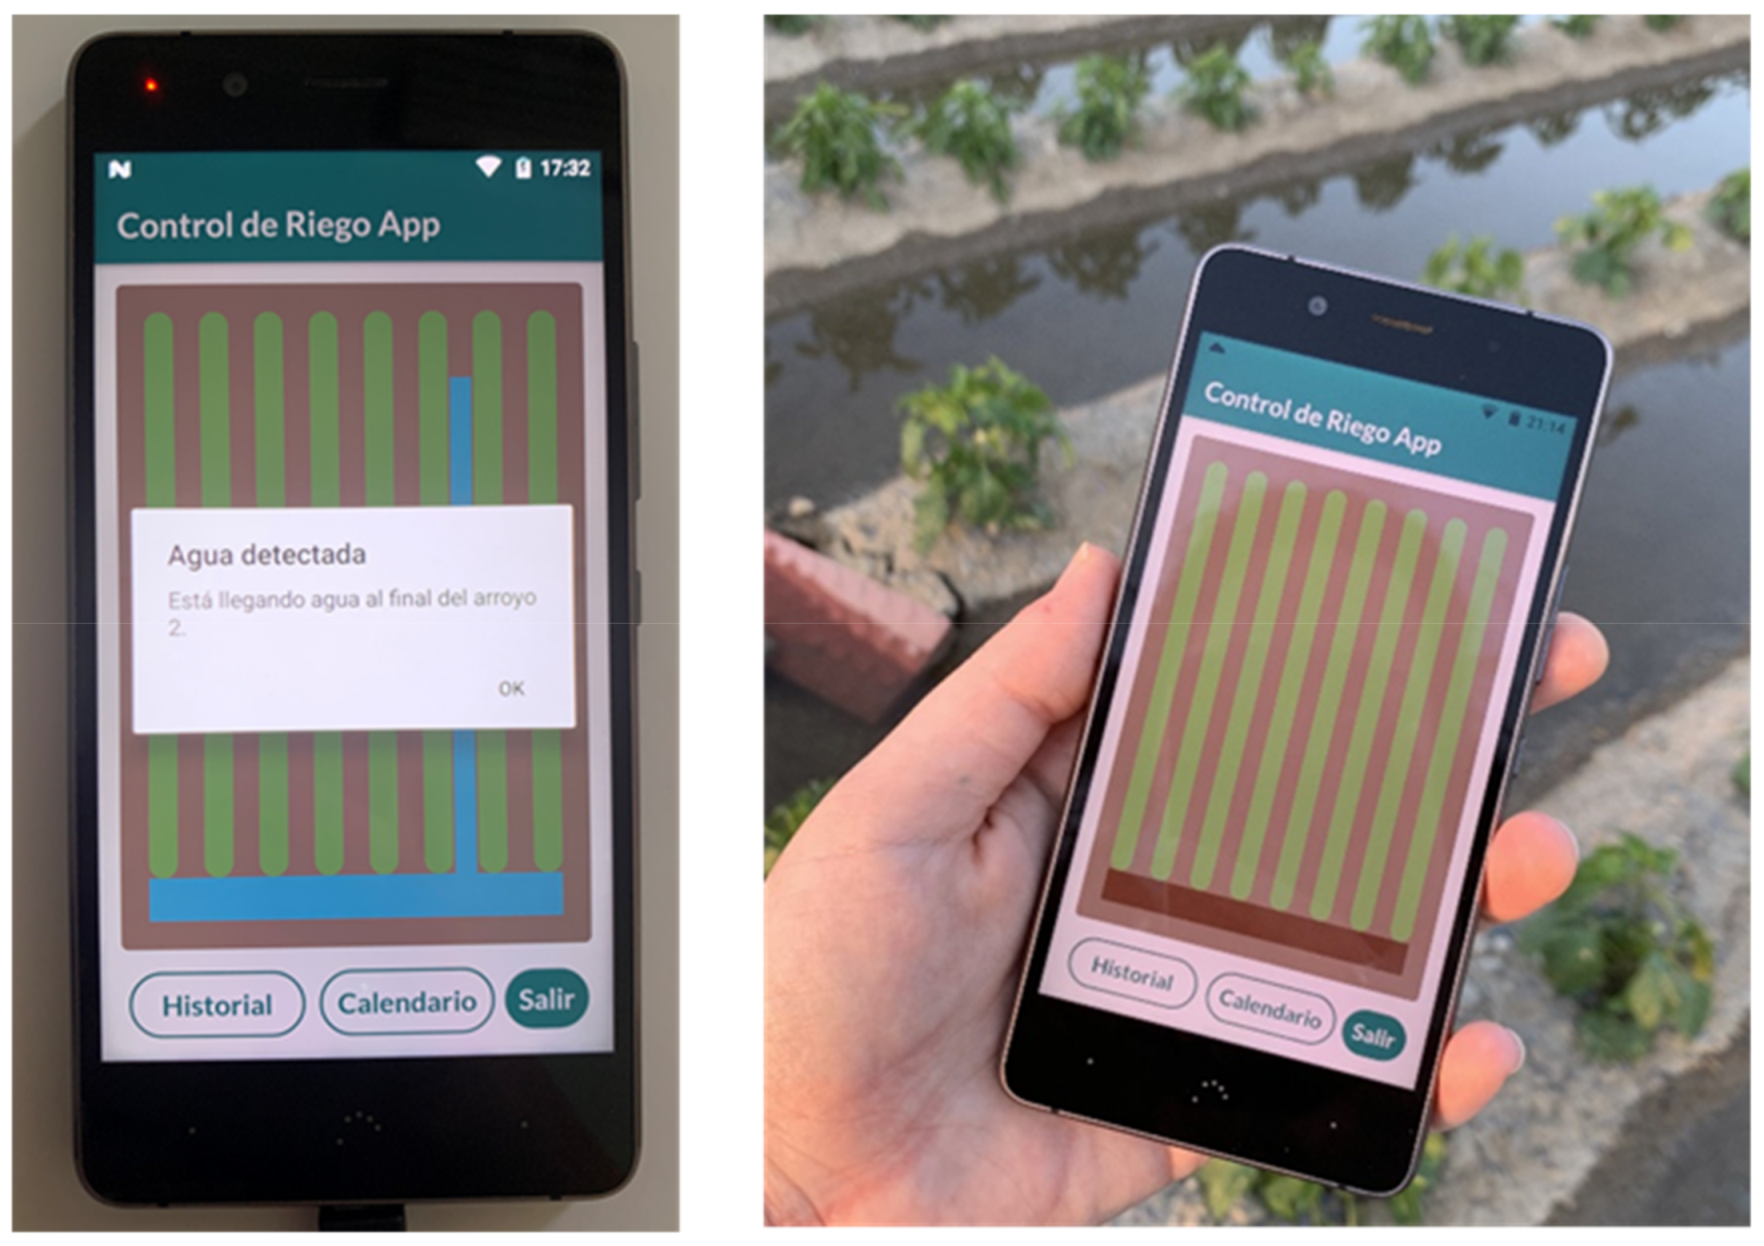
Figure 13a shows the main screen of application during an irrigation where we can see that the main channel has water and two ditches have already irrigated.
Figure 13b shows the alerts the user receives from the sensors. In this step, the data are stored in the cloud database.
While the application is executing in the background, the user will continue to receive notifications from the sensors thanks to the implemented push notifications (see
Figure 14).
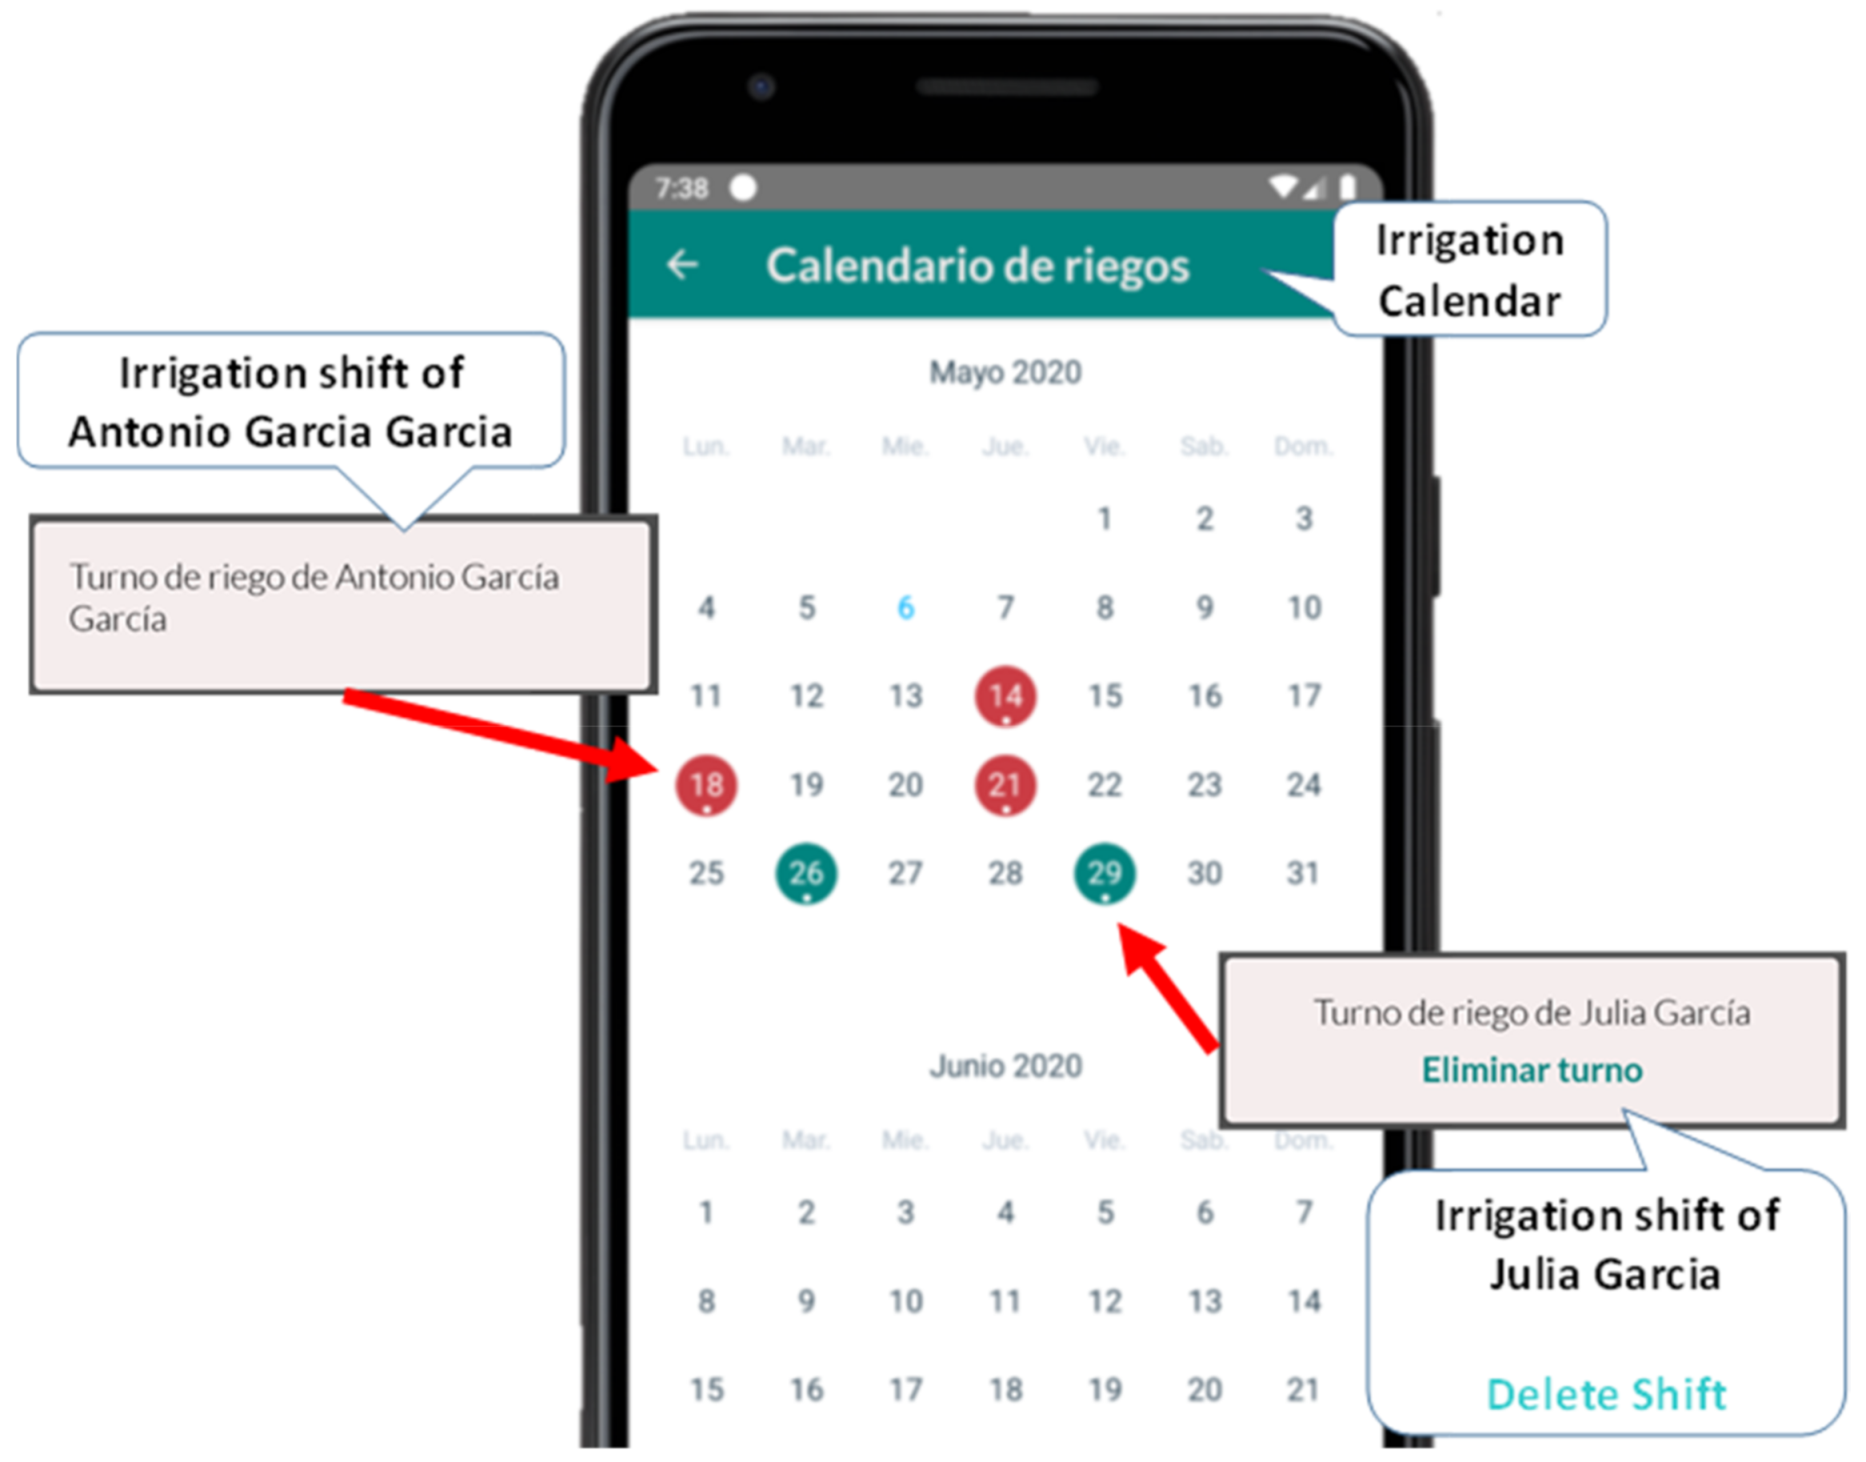
Finally,
Figure 15 shows the irrigation calendar view, in which the farmer can write down their irrigation dates (in red) and see the dates of other users (in green). The user can delete the dates that they created, although they cannot delete the dates of other users. These irrigation schedules are set to avoid water deficit. However, when rain events above 3 mm occur [
23], the scheduled irrigation can be cancelled, and the next irrigation event rescheduled. The soil sensors help in monitoring and adjusting the irrigation, but the irrigation schedule is also highly dependent on weather parameters such as humidity and temperature as it affects the evapotranspiration of the plants.
2.5. Cloud Service Deployment
This subsection presents a brief description of the system requirements as well as the different parts (hardware and software) that compose the entire system.
2.5.1. Sensors’ Microservice Deployment
Sensors’ microservice is in charge of processing the received data from the different sensors of the system. In this paper, we used the Johnny-Five [
24] library together with Dweet.io [
25] and Etherport-client libraries to implement a robust system with great functionality.
Dweet.io is a very simple and lightweight library that offers a machine-to-machine (M2M) messaging service for IoT systems. This library implements another well-known technology based on Web Sockets that establishes socket connections between a web browser and a server. In this way, we achieved a TCP socket connection that allows both the client and server to transmit data at any time. Moreover, this technology allows us to reestablish the connection automatically in the case of connection loss as well as detecting disconnections, etc. Therefore, the sensors connected to the system will generate events and send them for the microservice to process them and send them to the cloud, where they will be intercepted by the web server. The Etherport-client library allows a service to be directly connected via WiFi by adding a transport layer and working together with Firmata protocol to allow communication with the ESP8266 board. Therefore, Etherport-client is a virtual client-side serial port for Etherport, which is why a TCP client for JavaScript is needed.
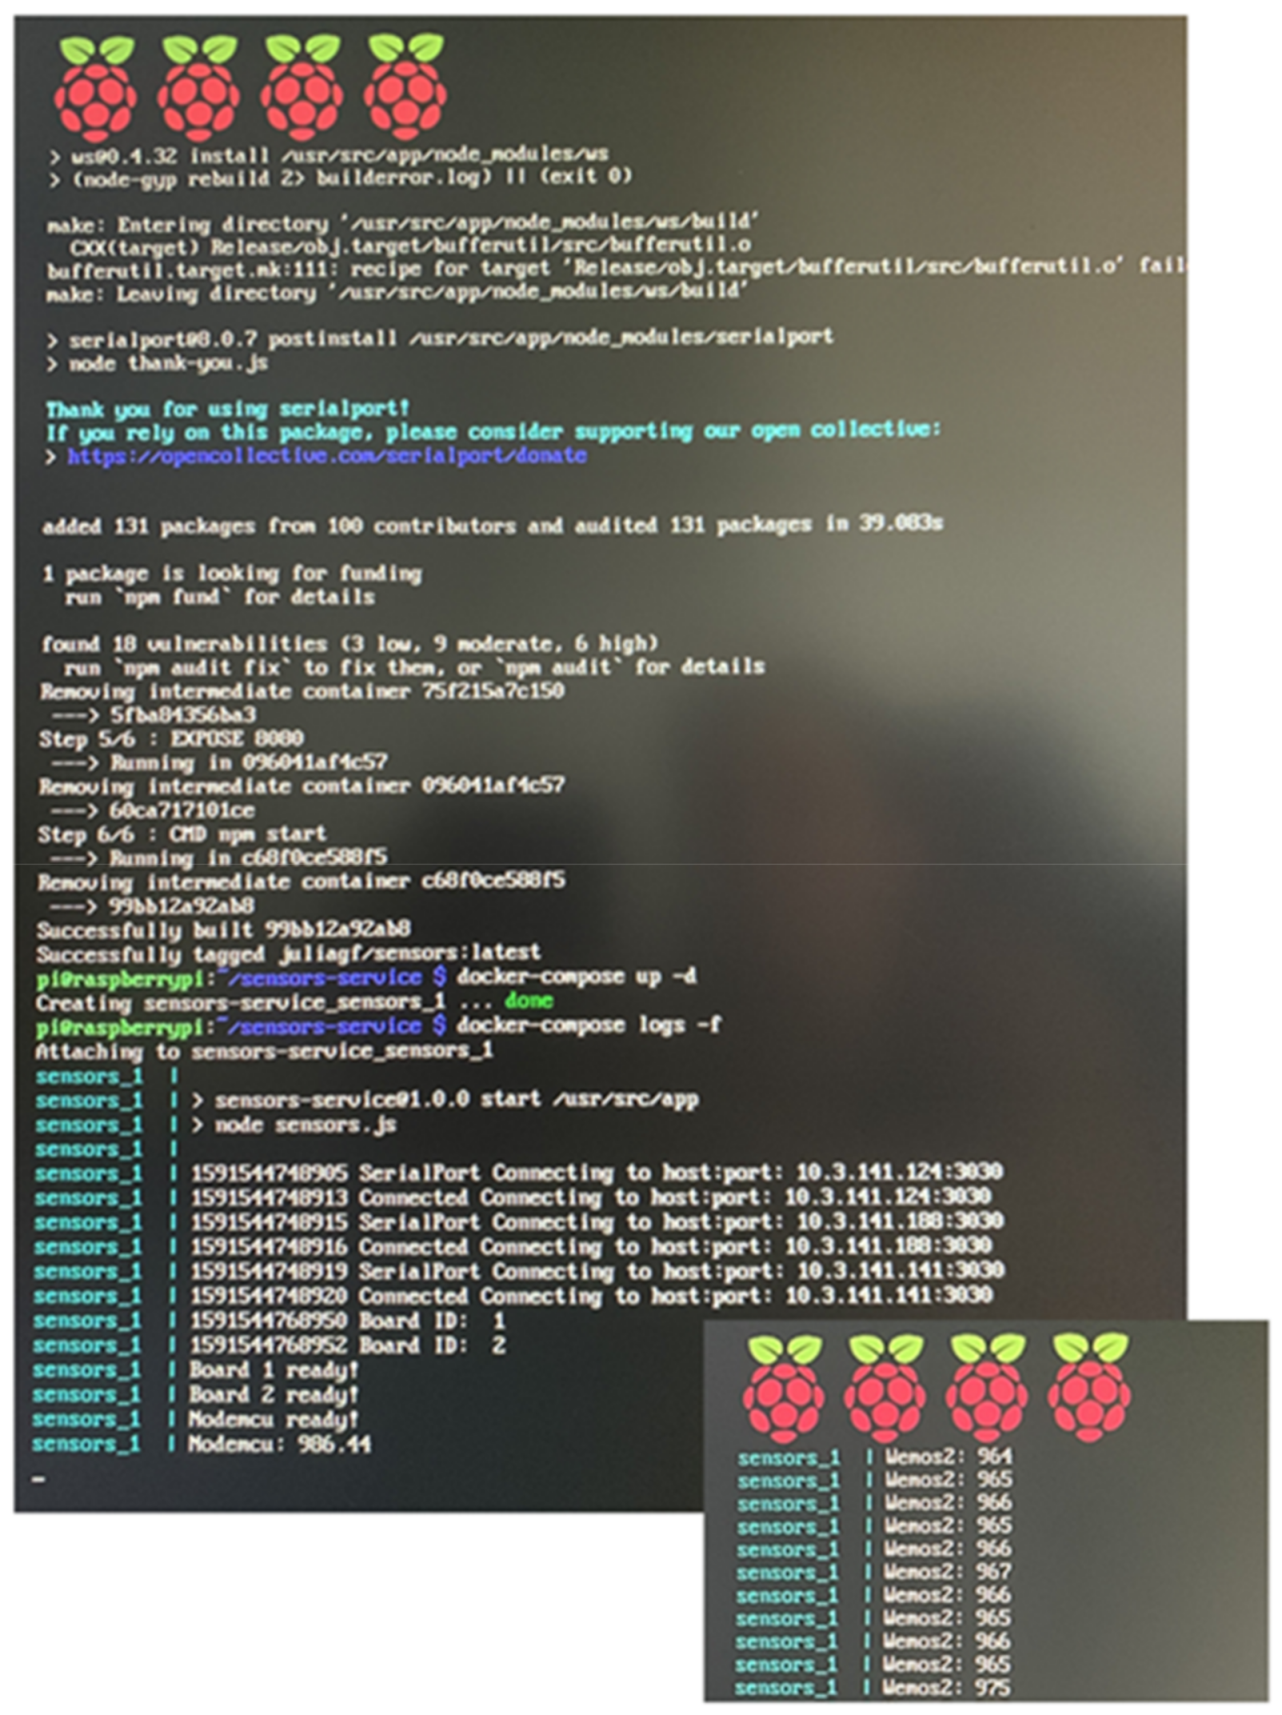
Finally, we used Docker technology to implement the microservices in Raspberry Pi by creating containers. According to Docker, a container is a lightweight and portable software unit that packages the code and all dependencies of an application so that it can run faster and in a more efficient manner at any given environment. Moreover, its use provides great advantages such as scalability, security, and maintainability.
2.5.2. Creating of API REST Server in the Cloud
In order to develop the server in the cloud, we used REST APIs. It is the most popular option in web and application development as well as for the development of IoT applications. REST APIs are developed using Express.js.
Node.js is a synchronous event-oriented JavaScript runtime environment built with Chrome’s V8 JavaScript engine. It is designed to build scalable network applications. Express.js is the most popular Node.js framework that provides mechanisms for writing request handlers with different HTTP verbs in different URL paths and for processing requests through additional and customized middle-wares at any point within the pipeline of handling requests. This fact greatly facilitates the development of the REST API for this system. HTTP error handling is another case where Express.js simplifies its implementation.
The service created with Node and Express is located in the cloud. Among the many options available, Firebase was chosen. Firebase is a software development platform that was acquired by Google in 2014 and offers a cross-platform toolkit compatible with iOS, Android, web development, Unity, and C ++. Firebase provides features like statistics, databases, bug reporting, and messaging using the Google infrastructure. In general, cloud computing platforms offer a series of delivery methods, among which are: Software as a Service (SaaS), Platform as a Service (PaaS), and Infrastructure as a Service (IaaS). In Firebase, the platform is a Backend as a Service (BaaS), which makes it possible to build a complete web server from scratch using only the different functionalities that these services offer. Therefore, Firebase allows us to completely/partially replace the backend of an application thanks to user authentication services, notify database in real time, etc. However, in our case, the use of this platform is more similar to the PaaS model, since the backend developed with Node and Express is essentially a function that integrates an entire user and content management in a micro-service.
The system database, which the microservice will give prior user authentication, will be dynamically created with the Firebase Cloud Firestore data storage service. It is a NoSQL database hosted in the cloud and organized in documents that are grouped into collections.
Figure 16 shows an example of the structure of the water sensor detection collection in the Firebase Cloud Firestore database. For the sensors’ data collection, the sensor ID is stored to identify in which specific stream the presence of water has been detected, the exact time and date of the detection. These data are assigned to the user ID.
Finally, with the Firebase Cloud Messaging service, the farmer is notified on the presence of water in each ditch of the plot. It is a free service that allows communication from the server to the client, as opposed to the HTTP request model, implementing push notification devices. With this service, it is possible to notify the events executed in the server developed in the cloud. In this sense, the user will receive a notification every time a sensor launches an event, at any time, even if the application is not open or it is running in the background.
4. Discussion
This section presents some previous works where mobile applications and irrigation control systems are presented. The section also includes a brief summary of the practical implementation problems and challenges to be considered in the development of wireless sensor networks.
In 2014, D.F.B. Rodrigues et al. developed a mobile phone application for irrigation scheduling called IGdroid [
28]. This app was implemented to help farmers irrigate crop areas in a more efficient manner by taking into account parameters such as: soil properties, irrigation system, and crop data. The scheduling task is dependent on climatological data that the user must input daily. As a result, the farmer will receive notifications whenever a registered area needs to be irrigated, informing them of the water depth and how long the system needs to be run. Additionally, this application allows the user to simulate irrigation scenarios to estimate water use in the production cycle. However, the developed app does not have access to the Internet, which forces the user to manually search for the necessary data to schedule irrigations. Moreover, since this application does not rely on sensors to collect information such as the soil moisture, scheduling times are being estimated. Thus, this situation may lead to under-irrigating or over-irrigating certain areas, even with meteorological data being correctly input by farmers.
In [
29], A.C. Bartlett et al. presented a smartphone application to serve as the interface of an online irrigation scheduling tool called Water Irrigation Scheduling for Efficient Application (WISE) intended to better use water resources. This online tool uses the soil water balance approach as well as data queries from two weather stations. In this this way, users can obtain information of the soil moisture deficit of their fields along with the weather conditions. Since this app does not allow users to outline field shapes, the setup of a field must be done through a web browser in order to draw the field boundaries on a map layer and input parameters such as crop type, plating date, initial soil water deficit, and emergence date. Moreover, to effectively use WISE, users must input irrigation amounts, unrecorded precipitation amounts, and any adjustments to the soil moisture deficit as well as the dates. This information will then be used to calculate the effective water added to the soil and the daily soil water deficit of the registered fields. Even though this solution does allow users to obtain information related to soil moisture and the effective water added to the field, the setup may be too difficult for farmers with a low technical profile. Additionally, the calculations being done are estimations dependent on third parties, which could lead to major errors in the irrigation schedule.
In 2015, J.G. Jagüey et al. designed an automated irrigation sensor that uses a mobile device to capture images of the soil around the root zone of crops and processes the pictures to estimate water content [
30]. For this sensor to work correctly, the chamber that contains it needs to be buried at the root level with the illumination conditions regulated beforehand. The digital camera and the WiFi network are controlled by an Android app that activates the device to capture the images and perform a series of transformations to the RGB picture to calculate the ratio between wet and dry areas. This value is sent to a gateway though a route node to control the water pump. Once this last task is performed, the mobile phone is put to sleep in order to save energy of the rechargeable batteries that will be charged in time with a photovoltaic panel. Nevertheless, this approach requires in-land calibration to successfully acquire a dynamic range to differentiate dry and wet soils throughout image processing techniques and requires more time and effort to install a set of sensors in cultivation terrains.
T. Savić and M. Radonjić proposed a solution to control three electromagnetic valves to release water in agricultural fields in a flexible manner based on the Libelium Waspmote open source platform [
31]. Additionally, this solution allows time scheduling irrigation and set the closure of valves in terms of the amount of water released or duration of the irrigation process. Moreover, the system can also be controlled remotely by sending commands via Short Message Service (SMS). The information report will then be sent via SMS to remind the user the configuration being used, and the amount of water released. Furthermore, this report is sent to a remote server to allow additional analysis. Furthermore, the designed solution is a modular system in which users can add more features on demand. The main control unit display both data and menu options on an LCD display to facilitate user interactions with its interface. However, this approach requires the user to either access the main control unit or remember commands to control the system remotely. Moreover, its functionality relies on the user’s criteria rather than the real needs of the crops.
In [
32], G. Vellidis et al. developed a smartphone application to schedule irrigation in cotton fiber crops called the Cotton SmartIrrigation App (Cotton App). This model is based on the evapotranspiration of water from soil and plants and uses meteorological data from weather stations and other parameters to estimate water deficits. To do so, the user needs to accurately register the field location to be able to locate the nearest weather station, select a soil type, an irrigation system, and a default irrigation rate. The application displays the estimated water deficit as a graph bar, but also numerically, and informs the user of the amount of water required to refill the land. Once the field has been irrigated, the user needs to record that irrigation and input the amount of water applied and the observed rain to double check the precipitation data with the rain data from the weather station. If any phenological changes occur, the app will notify the user to ensure that they will have enough time to trigger irrigation events in case of need. Since the Cotton App is strongly dependent on meteorological stations, its accuracy can be diminished by in-field precipitation variations. To avoid this, users must input the observed rain at the field, which will not be possible unless they visit the land.
In 2017, R.G. Perea et al. developed a multiplatform application for precision irrigation scheduling to be used in the strawberry production sector both from PC and Android devices [
33]. This software aims to guide strawberry growers to apply the correct amount of water during the right amount of time by analyzing agroclimatic and soil data for a given irrigation system. Moreover, this solution allows users to control the irrigation system manually and remotely. Water requirements are estimated taking into account crop data and meteorological information from weather stations as well as soil characteristics, in order to minimize percolation losses and maximize the efficiency of water resources. The irrigation scheduling is performed by the computer software and can be downloaded as files. The Android application allows users to have remote access to the system and gives them information related to daily irrigation times. Although this system successfully manages to increase water savings, its implementation focuses on a specific crop and relies on general parameter values instead of analyzing site-specific soil characteristics by means of sensors.
Z. Gu et al. developed an irrigation scheduling software based on predicted crop water stress and weather data to evaluate its effectiveness and economize water usage when maintaining the field [
34]. In this way, the amount of water that needs to be supplied is determined by the simulation results obtained from a calibrated model. In this case, weather conditions were obtained from websites and/or weather stations to schedule real-time irrigation using a software based on RZWQM2 and evaluate the potential water saving for a more efficient water usage. After analyzing the results, it was concluded that water stress-based irrigation could help reduce water usage, since irrigation was triggered by crop water stress index and forecast rainfall. However, more work is needed to install and test this system in irrigated field scenarios.
In [
35], O. Adeyemi et al. discussed how incorporating advanced monitoring systems and decision support systems (DSS) in irrigation management could enhance efficiency. In this review, it was highlighted that these techniques could not only help achieve environmental goals but increase economic benefits, and that sustainability in irrigated agriculture could be improved with the use of soil, plant, and weather sensors. Furthermore, the use of model predictive control in DSSs can help achieve significant improvements in crop yield and water savings. With this research, the authors provided an in-depth analysis of the necessary factors needed to develop a practical and robust DSS for irrigation management, taking into account monitoring systems, water application systems, adaptative DSSs, and the use of simulations and artificial intelligence to improve sustainability. It was concluded that a robust design of DSS includes monitoring soil, plant, and weather parameters as well as considering agronomic objectives. However, the high cost of such systems may lead to lower incomes at the field-scale.
M. T. Abi Saab et al. developed a smartphone irrigation scheduling tool, called Bluleaf, that uses crop, soil, weather, and irrigation system data to support farmers in the water application process and schedule irrigations [
36]. The testing process of this app showed a water saving of more than 1000 m
3/ha, which demonstrates that the use of this type of technology can help farmers improve irrigation practices at the local and regional scales, while increasing productivity and reducing freshwater withdrawal. This mobile application uses local meteorological data and weather forecasting as well as crop and soil data, and the characteristics of the irrigation system. Furthermore, the presented application could be used to perform traceable records of farm activities and estimate the eco-efficiency of these practices.
In 2020, L. García et al. presented a survey summarizing the state-of-the-art of smart irrigation to determine the monitored parameters in current systems [
37]. Among the possible parameters being sensed, researchers found water quality and quantity, weather conditions, and soil characteristics. Moreover, the most utilized nodes and wireless technologies were summarized to provide an overview of IoT-based irrigation systems. Among the most sensed parameters to characterize soil, plants, and water quality, researchers found soil moisture to be the most utilized parameter, followed by water levels and pH. As for the atmospheric parameters, air temperature and humidity, together with weather forecast, seemed to be the most popular ones. The most utilized nodes to implement IoT irrigation systems used Raspberry Pi, Arduino UNO, or Node MCU boards, together with WiFi, GSM, ZigBee, and Bluetooth as communication technologies and the ThinkSpeak platform to store data.
Table 6 presents a comparison of previous related studies. As it shows, most systems rely on user input data associated with soil and crop data as well as irrigation systems and meteorological data. Moreover, most applications do not use sensors to trigger events, although many studies recommend doing so. The difficulty level of these mobile applications is often medium/high since farmers are required to have technical knowledge of soil properties as well as technologies in order to correctly introduce the solicited data. In our proposal, we present a mobile application for food irrigation control and irrigation scheduling that allows farmers to remotely control water gates and relies on sensed data from the plantation field. The main novelty of the system lies in the simplicity and cost deployment. The system is built with very cheap hardware that must perform extremely simple monitoring tasks. This gives the system the required robustness for the overall objective of our proposal. The gateway can be deployed using a Raspberry Pi or using a smartphone.
Finally, it is extremely important to consider practical implementation problems and challenges.
One of the main problems outdoors is how to protect the electronics from the adverse conditions. The places where the devices are deployed should also be taken into account. Therefore, waterproof protection is highly recommended. The time during which the sensors and devices work can cause variations in the measurements. This fact should be controlled since an incorrect reading could provoke an anomalous behavior. For that, we can use techniques of artificial intelligence and redundancy mechanisms to face this problem.
Another important issue to consider is the physical properties of the sensors and probes. Most of them (especially those that are in contact with the water and soil) are manufactured with copper. In this sense, it is recommended to use sensors manufactured with the process of gold platting (not original gold) to combat the corrosion of probes.
Finally, theoretical estimations regarding coverage do not usually correspond to practical experimentation and for this reason, we believe that it is vitally important to perform practical experiments such as the ones presented in this paper.
5. Conclusions
Agriculture is a sector that creates one of the highest percentages of employed people in the world, with over a quarter of the population working in this area, more so in countries such as India and Somalia where agriculture is a key sector. It is also a large source of revenue for many countries. Climate change has put the focus on the need for water optimization. Thus, the technology has been applied to agriculture to create precision agriculture systems. In this paper, we presented a system for flood irrigation that consisted of a sensor network that utilized WiFi as its communication protocol. Several atmospheric parameters such as temperature, humidity, and rain, soil parameters such as humidity, and water parameters such as water temperature, salinity, and water height were measured by different sensors. A user application was designed to display the information gathered by the sensors and to allow the farmer to control the irrigation system. Tests were performed in a real environment to determine the coverage of the nodes with different deployments and to evaluate the correct performance of the system and the sensors.
In future work, we will implement this irrigation system for other types of crops such as citrus trees and other types of irrigation such as drip irrigation. To be sure the coverage is sufficient under all conditions, we also want check our system under adverse conditions due to rain, high level of relative humidity, low temperatures, etc. Moreover, we will implement the application for Apple iOS devices. We will also utilize other types of communication technologies such as LoRa for long-distance communication between the nodes deployed on remote fields and the server.


 ,
, 


